the Creative Commons Attribution 4.0 License.
the Creative Commons Attribution 4.0 License.
 | 05 Mar 2026
Hydrogen diffusion in hydrous minerals from Raman and NanoSIMS mapping – implications for isotopic characterization of fluid–rock interactions
Jannick Ingrin
Anne-Céline Ganzhorn
Julie Jonfal
Hélène Pilorgé
Clémentine Fellah
Nadège Hilairet
Laurent Remusat
Hydrogen diffusion in major hydrous minerals determines the closure temperatures of isotopic exchange used to track fluid–rock interactions. Deuterium–hydrogen (D–H) exchange was experimentally investigated between minerals and deuterated gas (D2) in an ambient-pressure furnace over the temperature range of 400–650 °C (tremolite, vesuvianite) and between minerals and D2O at high pressure (1.5–3 GPa) and temperature (315–500 °C) in a belt press (glaucophane, epidote). D (D + H) ratios in exchanged mineral grains were mapped using Raman spectroscopy calibrated by comparison with NanoSIMS analyses. Diffusion coefficients constrained by isotopic profiles were fitted to the Arrhenius equation , where Ha is the activation enthalpy, and D0 is the diffusion coefficient at infinite temperature T. The validity of intracrystalline diffusion laws from the literature is discussed with respect to the mechanical properties of hydrous minerals. Diffusion in tremolite is affected by intense cleavage, which reduces the effective grain size relative. High pressure appears to suppress cleavage opening in glaucophane. Results suggest that plasticity counteracts grain size reductions along cleavage planes in phyllosilicates. For vesuvianite, which lacks cleavage planes, intracrystalline diffusion is a valid assumption. In epidote, diffusivities are scattered over several orders of magnitude. Closure temperatures for hydrogen isotope diffusion were calculated and indicate that vesuvianite and phyllosilicates can record fluid–rock interactions under regional metamorphic conditions. Amphiboles may retain information about relatively short-lived eruptive events. Spatially resolved measurements of hydrogen isotopic compositions in those minerals may reveal low-temperature (100 < T < 400 °C) fluid–rock interactions associated with slip along major faults and metamorphic terrane exhumation.
- Article
(7191 KB) - Full-text XML
-
Supplement
(17561 KB) - BibTeX
- EndNote


Fluid–rock interactions are central to geological processes on Earth, in carbonaceous chondrites, and in planetary bodies (Lodhia et al., 2024). They play a major role in plate tectonics and their initiation (Amiguet et al., 2012; Reynard et al., 2022), particularly in subduction zones where intense fluid circulation occurs (Hyndman and Peacock, 2003; Schmidt and Poli, 1998). Fluid circulation is evidenced by metamorphic and metasomatic veins and may be channelized or diffuse (Bebout and Penniston-Dorland, 2016). Fluid–rock interactions are quantified using isotopic compositions in rocks and minerals, which constrain both the source of the fluid (i.e., meteoric, metamorphic, or magmatic) and the temperature of interaction (Kyser and Kerrich, 1991). Hydrogen isotope compositions have been used to trace the fluid source and hydrothermal alteration of the seafloor (Shilobreeva et al., 2011) in faulting (Menzies et al., 2014) and their link with seismogenesis (Mittempergher et al., 2014). Deciphering fluid sources and fluid–rock interactions requires a knowledge of isotopic fractionation and hydrogen diffusion in minerals. Hydrogen isotope diffusion laws allow for the calculation of the duration of fluid0-grain equilibration or closure temperature, i.e., temperature of cessation of interaction (Graham et al., 1987; Kyser and Kerrich, 1991). In this study, the deuterium–hydrogen exchange kinetics between fluid and common hydrous silicates were explored at high pressure (1.5 and 3 GPa), at ambient pressure, and at varying temperatures (from 315 to 650 °C) relevant to hydrothermal alteration in crustal systems, subduction zone metamorphism, meteorite parent bodies, etc. Diffusion profiles were analyzed using high-resolution NanoSIMS and Raman spectroscopic isotopic imaging. The target minerals (amphiboles, vesuvianite, epidote) allow for the complementing of the database formerly established using the same techniques (Ganzhorn et al., 2018; Ganzhorn et al., 2019; Pilorgé et al., 2017) and the assessment of the validity of diffusion measurements on hydrogen isotopes. Diffusion coefficients are established for vesuvianite and glaucophane, and maximum values are found for tremolite. The implications for the closure temperatures of hydrogen isotopic exchange are discussed.
2.1 Starting materials
We reanalyzed experimental charges from high-pressure deuterium exchange experiments on a natural blueschist rock from Groix Island in the Armorican Massif and a chlorite schist from the Saas-Zermatt zone in the western Alps. The Groix blueschist exhibits a mineralogical foliation where glaucophane-rich layers alternate with epidote-rich layers. For the experiments, the glaucophane-rich layers were selected; they consist mainly of glaucophane (> 95 %) with minor epidote, quartz, garnet, and titanite (< 5 %). The chemical formulas are Na1.8Ca0.2Fe1.0Mg2.3Al1.9Si7.7O22(OH)2 for glaucophane and Ca1.9Al2.5Fe0.5Si3O12(OH) for epidote (Ganzhorn et al., 2019). Both glaucophane and epidote grains are ca. 30 µm long. Glaucophanes are well recrystallized and show little evidence, if any, of internal deformation. Epidote grains also show no plastic deformation, while some exhibit fractures perpendicular to the foliation, suggesting incipient boudinage. Chlorites from Zermatt-Saas are well crystallized (100–500 µm long and 10–50 µm thick) with little internal deformation in the pristine sample. The composition of chlorite is Mg4.47FeAl0.99(Si3.18Al0.82)O10OH8 (Ganzhorn et al., 2018). Samples recovered from the high-pressure experiments display evidence of plastic bending due to compaction (Ganzhorn et al., 2018; Ganzhorn et al., 2019). A serpentinite sample, with antigorite composition (Mg2.52Fe0.24Al0.01)(Al0.06Si1.94)O5(OH)3.57 and equilibrated at 540 °C and 3 GPa with D2O (Pilorgé et al., 2017), was also reanalyzed.
For the ambient-pressure experiments, specimens of tremolite from Outokumpu, North Karelia, Finland; glaucophane from Groix (see above); and vesuvianite of unknown provenance were used. Glaucophane and tremolite are amphibole end-members across a well-defined miscibility gap (Reynard and Ballevre, 1988) and cover the Ca-rich and Na-rich compositional range of common amphiboles. The acicular tremolite occurs with dolomite and was separated from carbonate by dissolution in acetic acid for extracting single crystals. Tremolite composition is determined from scanning electron microsocopy and energy dispersive X-ray analysis (SEM-EDX) as Ca1.9Na0.1(Mg4.4Fe0.6)(Al0.2Si7.8)O22(OH)2. Fe (Mg+Fe) of 13 %–14 %, and Fe3+ Fetot values of 5 %–20 % were estimated using relative intensities of OH stretching bands (Burns and Greaves, 1971). Vesuvianite, a minor but common sorosilicate of metamorphic and volcanic rocks, has a composition of Ca9.9(Mg1.0,Fe0.8,Al0.2)Al4[(Al0.1,Si0.9)O4]5(Si2O7)2(OH)4 determined by SEM-EDX, close to the idealized formula Ca10Mg2Al4(SiO4)5(Si2O7)2(OH)4. No halogen elements were detected in the substitution for OH.
2.2 Exchange experiments
We used samples equilibrated with D2O following methods developed for studying deuterium–hydrogen exchange at high pressure (Ganzhorn et al., 2018; Ganzhorn et al., 2019; Pilorgé et al., 2017), as well as samples equilibrated at ambient pressure in a furnace flushed with D2 gas equilibrated with D2O (Hercule and Ingrin, 1999). Experimental P–T conditions and durations are reported in Table 1.
Ambient-pressure heat treatments were carried out at Université de Lille in a horizontal furnace fitted with an alumina tube of 18 mm in internal diameter (Hercule and Ingrin, 1999). Temperatures ranged from 673 to 923 K and were controlled to within ± 5 °C using a Pt Pt-Rh10 % thermocouple. A buffered atmosphere was maintained by a gas mixture of 90 % Ar + 10 % D2 flowing through deuterated water (99.8 % D2O; pD2=0.1 atm) for D–H exchange experiments. With this procedure, the oxygen partial pressure is fixed by the water dissociation equilibrium between 10−27 to 10−42 atm for temperatures of 923 to 673 K for experiments performed with pD2 equal to 0.1 atm. Exchange durations were varied at each temperature to check for time independence of the diffusion coefficients.

Tremolite and vesuvianite, both having broad stability fields extending to low pressures, could be heated metastably up to 923 and 823 K, respectively, without alteration and hydrogen loss. In contrast, glaucophane could only be heated to 673 K owing to a relatively low-temperature high-pressure stability field and decomposition to low-pressure phases below 0.5–0.8 GPa (Reynard et al., 1989; Corona and Jenkins, 2007; Jenkins, 2011). This maximum temperature proved to be too low to induce measurable isotopic profiles after 654 h of exchange, although significant OD bands were detected by Raman spectroscopy in some areas.
A belt press in Lyon and a piston-cylinder apparatus in Lille were used for glaucophane and epidote to prevent decomposition during heating and exchange with D2O. Pressures of 1.5–2.5 GPa and temperatures of 315–500 °C were applied. Samples were enclosed in sealed gold capsules to ensured impermeable conditions; the persistence of D2O after quenching and decompression was checked by weighting before and after piercing the capsule (Ganzhorn et al., 2018; Ganzhorn et al., 2019; Pilorgé et al., 2017). Extrapolation of the buffer lifetime duration determined at 750 °C (Scaillet et al., 1992) suggests negligible H2 or H2O loss during the present experiments, which is consistent with the absence of observable oxidation of magnetite grains present in the starting material.
Quenched capsules were mounted in epoxy resin and cut lengthwise in two parts with a wire diamond saw. Both halves were remounted in epoxy to stabilize the loose parts of the sample. The sections were polished with silicon carbide abrasive paper down to a grain size of 2.5 µm and then with a solution of alumina down to 0.5 µm (Ganzhorn et al., 2018; Ganzhorn et al., 2019).
2.3 Isotopic mapping
Raman mapping was performed using a Horiba™ LabRam HR Evolution spectrometer equipped with a 532 nm continuous-wave laser source. The confocal setup, combined with an objective of ×100 magnification and a high-precision motorized stage, allowed for the acquiring of Raman multispectral images with a spatial resolution of 0.5 µm. Maps were recorded with steps of 0.2 to 2 µm, depending on the diffusion profile width.
OD and OH vibrational bands are unambiguously distinguished by Raman shifts in the regions of 2450–2740 and 3300–3700 cm−1, respectively (Fig. S1 in the Supplement). D H maps were constructed by measuring the intensity ratio of OD and OH bands for a specific mineral (Pilorgé et al., 2017). Raman D (D + H) or D H maps were obtained by integrating the area below the OD and OH bands. The ratio of Raman cross-sections of OD and OH Raman bands was assumed to be unity based on first-principle calculations (Reynard and Caracas, 2009). Because Raman intensity varies with wavelength (Long, 1977), the expected ratio of OD OH intensity is approximately 0.58 given the frequency difference between OH and OD bands (Fig. S1). Other effects like absorption by electronic transitions or instrumental bias (Zarei et al., 2018) may influence the measured ratios. Raman band intensity ratios are, in the first approximation, assumed to be equal to concentration ratios (Pilorgé et al., 2017); this assumption is further discussed below.
For intercalibration purposes, hydrogen isotope mapping was performed on selected samples studied by Raman using the Cameca NanoSIMS 50 installed at the Muséum National d'Histoire Naturelle de Paris, France. Samples were coated with 20 nm of gold prior to analysis. A 16 keV primary Cs+ beam was used to collect secondary ions of H− and D− in multicollection mode using two electron multipliers. A mass-resolving power of 4000 was chosen. The primary beam current of 50 pA provided a spatial resolution of about 400–450 nm. Images were acquired over ∼ 20 × 20 µm areas divided into 256×256 pixels (∼ 80 nm steps), with a raster speed of 1 ms per pixel per frame, repeated for 40 to 45 frames.
Before each analysis, the sample was sputtered with a 600 pA primary beam current for five minutes over an area of 25 µm × 25 µm in order to remove the gold coating, clean the surface, and achieve steady-state sputtering (Thomen et al., 2014). The vacuum in the analysis chamber remained better than 10−9 torr throughout the measurement.
NanoSIMS data were analyzed using the L'Image software developed by Larry Nittler (https://sites.google.com/carnegiescience.edu/limagesoftware/, last access: 25 February 2026). Each image is a stack of several frames, with the first step in the stacking process consisting of aligning each frame using a correlation algorithm, after which the same shift in x and y was applied to all the pixels of a single frame. We used the free software look@nanoSIMS to analyze the data, from which D (D + H) ratio images can be generated. Considering the high D concentrations in experimental samples, the instrumental fractionation of the D H ratio was neglected.
2.4 Determination of diffusion coefficients
Diffusion experiments were performed by reacting natural minerals (∼ 0.015 atom % of deuterium) with D2O or D2 (purity 99 atom % and 99.8 atom %, respectively). With these extreme compositions, the natural abundance of deuterium in natural minerals can be neglected, and a pure hydrogen starting mineral composition is assumed in the quantification of deuterium–hydrogen exchange. During the high-pressure experiments, water isotopic composition varies depending on the water–rock ratio and grain size (Pilorgé et al., 2017) and can decrease to 0.5–0.6 for blueschist and antigorite and down to 0.15–0.2 in the most extreme case of chlorite (Ganzhorn et al., 2019).
Deuterium–hydrogen inter-diffusion coefficients () were calculated from diffusion profiles extracted from D (D + H) maps. Contributions of diffusion in the three directions have to be considered (Desbois and Ingrin, 2007), and the geometry of the mapped crystal must be known for defining the boundary conditions.
Simplifications can be made when the D (D + H) ratio of the grain core approaches zero, when the crystal face is perpendicular to the analyzed surface, and if the diffusion profile is at least 2 times larger than the Raman or NanoSIMS beam size. The diffusion equation can be reduced to Carslaw and Jaeger (1959) and Cranck (1975):
with erfc being the complementary error function; C being the analyzed D (D + H) ratio in the crystal at each spot; d being the diffusion depth in meters; C0 being the D (D + H) initial ratio in crystals (assumed as 0); C1 being the D (D + H) ratio of the fluid; being the inter-diffusion coefficient in m2 s−1; and t being the diffusion time, i.e., the experiment duration. Uncertainties associated with fitting experimental profiles are discussed in Sect. 3.2.
In ambient-pressure experiments, C1 remained constant and close to unity because the furnace is flushed with D2 gas. In high-pressure experiments, both C1 and were obtained by least-squares minimization. C1 is lower than the starting value of 0.99 due to isotopic exchange between the H-rich natural sample and the finite amount of D2O (99 %) added into the capsule. C1 depends on the initial mass of added D2O, grain size distribution, local fluid distribution, and variations in porosity; it represents the “integrated” water isotopic composition during exchange (Pilorgé et al., 2017). If the grain core concentration is higher than 0, it is necessary to take into account diffusion in the three crystallographic directions (Desbois and Ingrin, 2007). In the present study, diffusion profiles were small enough to justify using Eq. (2). Some profiles could not be fitted to this equation due to extensive cleavage locally reducing the grain size; these cases are discussed separately.
A common difficulty in determining the diffusion coefficient arises when the diffusion profile is comparable to or smaller than the probe size. If the NanoSIMS primary probe or Raman laser spots were ideal point sources, diffusion profiles would have a complementary error function shape with Cmax=C1 at the crystal edge. When the diffusion length approaches the probe spot size, convolution of probe and diffusion profiles reduces the maximum concentration (Cmax<C1 at d=0) and increases the apparent full width at half maximum (FWHM) of the profile. The probe size was estimated as 500 nm FWHM for both NanoSIMS and Raman analyses. The precise probe shape (Gaussian or rectangular) has little influence on the result (Pilorgé et al., 2017). Thus Eq. (1) was convoluted with a rectangular probe of 500 nm width to compute the evolution of apparent FWHM of the diffusion profiles as a function of diffusion coefficients (Fig. S2). These results were compared to the shortest profiles measured by Raman spectroscopy and NanoSIMS, down to ∼ 500 nm, with a point-to-point resolution of 200 and 80 nm, respectively. Because the diffusion coefficients obtained with this method are only estimates, an estimated error of 1 order of magnitude may result when the profile width is barely larger than the probe size. In the case where measured diffusion profiles are as low as or lower than the probe size, only maximum estimates are given. Such short profiles were observed in tremolite and epidote, for which no definitive determinations could be obtained (Sect. 3.2).
The diffusion law for deuterium–hydrogen inter-diffusion was obtained from a linear fit to the Arrhenius equation in relation to the diffusion coefficient obtained at different temperatures:
where D0 is the pre-exponential factor (m2 s−1), Ha is the activation enthalpy (J mol−1), R is the gas constant, and T is the absolute temperature (K). The parameters were estimated by least-squares minimization, and the estimated values and standard deviations of Ha and logD0 are reported where relevant. Uncertainties of diffusion coefficients are discussed in Sect. 3.3.
3.1 D (D + H) maps: intercalibration of Raman and NanoSIMS results
Hydrogen isotope mapping was performed using NanoSIMS on samples formerly studied by Raman spectroscopy, including antigorite (Pilorgé et al., 2017), glaucophane–epidote blueschist (Ganzhorn et al., 2019), and chlorite (Ganzhorn et al., 2018). Some regions were reanalyzed with Raman spectroscopy after NanoSIMS analysis as the removal of the gold coating during NanoSIMS analysis delineates the analyzed area and facilitates precise repositioning (Fig. 1).

Figure 1Images of areas mapped by NanoSIMS and Raman spectroscopy highlight the similarity of the results obtained by the two techniques. For antigorite and glaucophane, SEM images are shown alone (left), with superimposed NanoSIMS and half-transparent isotopic maps of the D H ratio (center) and with full-color isotopic maps (right), in order to illustrate the correspondence between isotopic zoning and crystal boundaries. For chlorite, only the isotopic maps are shown. The SEM antigorite image was obtained before NanoSIMS analysis. The glaucophane SEM image was obtained after NanoSIMS to illustrate the location of the analyzed areas where reflective gold coating was removed prior to NanoSIMS analysis. Note the close match between zonings imaged by NanoSIMS and Raman in antigorite and chlorite, as well as the similarity regarding the isotopic ratio values and scales, in spite of small distortions between the two imaging techniques. For glaucophane, although NanoSIMS and Raman images are similar, Raman images show smearing and higher background values at the center of the crystals. Differences between the two mapping techniques and results are discussed in the text.
At first glance, isotopic maps obtained by NanoSIMS and Raman spectroscopy are similar and reveal the same large-scale isotopic zoning within the studied crystals. In antigorite, one lath (see Fig. 3D in Pilorgé et al., 2017) was analyzed by both techniques, showing identical isotopic zoning and comparable D (D + H) ratios. Direct numerical comparison is not possible, however, because of slight geometric distortions in the NanoSIMS due to ion optics that differ from the straight optical path of the Raman setup. Outside the antigorite domains, discrepancies arise because the Raman map is constructed using the mineral-specific OD and OH bands, in that case, antigorite, whereas NanoSIMS provides the isotopic ratio irrespective of the analyzed material. Areas composed of other minerals, such as olivine (brighter in SEM images) or fine-grained alteration products (darker gray), yield no meaningful Raman signal, whereas the same regions appear as blue-green zones in NanoSIMS images, reflecting low D H ratios due to the presence of epoxy resin used for sample mounting. Epoxy-filled fractures are visible in both SEM and NanoSIMS images.
In the chlorite samples, crystals display low-D H cores in both NanoSIMS and Raman images, and the overall isotopic patterns are consistent between the two techniques. Minor discrepancies occur at small scales: NanoSIMS maps show smooth gradients, whereas Raman maps reveal thin saturated bands along (001) cleavages. This is attributed to locally high Cr3+ concentrations in chlorite derived from the alteration of former Cr-rich spinels. Trivalent Cr in low crystal field environments induces intense, broad fluorescence that extends into the OH-stretching region (Quérel and Reynard, 1996), hindering accurate Raman quantification.
In the Groix sample equilibrated at high pressure and temperature, both glaucophane and epidote exchanged hydrogen isotopes with the fluid. NanoSIMS simultaneously measured D H ratios in both minerals, whereas Raman mapping was mineral-specific. Consequently, epidote appears as low-D regions in the glaucophane Raman maps but as high-D areas in NanoSIMS images, reflecting extensive fluid exchange. Another difference is that NanoSIMS reveals D-free crystal cores, while Raman spectra show a weak but consistent D signal even in the crystal centers. This is due to glaucophane's optical transparency, which allows the Raman laser to probe deeper D-rich edges below the focal plane. This artifact was minimized by reducing the confocal aperture during Raman acquisition.
Overall, the good agreement between D (D + H) ratios measured by both techniques confirms that the isotopic ratio is proportional to detector counts in NanoSIMS and to integrated OD OH band areas in Raman spectroscopy (Pilorgé et al., 2017). Given the theoretical OD OH intensity ratio of 0.58, the one-to-one intensity ratio between Raman and NanoSIMS likely results from compensation by the optics (Zarei et al., 2018) and electronic or charge transfer absorption in these colored minerals. Similar direct proportionality was observed between the Raman band intensity ratio and isotopic D H ratio of water mixed by gravimetry (Kueter et al., 2023). For NanoSIMS, the observed proportionality applies only at the high D concentrations of the present experimental samples (D (D + H) up to 0.8). For natural variations where D (D + H) ratios are in the range 1–, the proportionality observed here may not apply due to easier contamination at low concentrations, and calibration against natural standards is required for quantitative isotopic measurements.
3.2 Diffusion profiles
To quantify deuterium–hydrogen exchange, we selected crystals exhibiting clear deuterium zoning and suitable geometry using Raman spectroscopy. We optically identified crystals whose rims were straight and as close as possible to vertical relative to the mapped sample surface. This was achieve on single crystals exchanged with D2 by preparing crystals which present flat faces. In polycrystalline samples from high-pressure experiments, we targeted regions where crystal textures and face orientations indicated near-vertical rims, as well as areas where grain boundaries between grains of the same mineral allowed measurement of diffusion on both sides to check the symmetry of the diffusion profiles. Symmetric profiles in adjacent crystals ensure that the grain boundary is close to vertical and that Eq. (1) applies.
diffusion coefficients were derived by fitting Eq. (1) to multiple diffusion profiles from each map. The precise location of grain boundaries is uncertain to within the resolution of optical microscopy; the Raman is not sensitive at low D (D + H) ratios, and the background isotopic value can be slightly above zero because of signal from epoxy or smeared epoxy from polishing. The maximum D (D + H) ratio may also vary depending on the fluid mineral ratio in experiments. Thus, C1, C0, and d0 – the location of the grain boundary – may be adjusted during the fit. The effect of changing d0 was tested to evaluate the associated uncertainty of the diffusion coefficient. Two distinct behaviors were observed, of which vesuvianite and tremolite provide typical examples.
D H mapping on vesuvianite (Fig. 2) reveals diffusion profiles that can be accurately fitted with Eq. (1). The resulting values are consistent over different durations for a given temperature (Fig. S3). This variability partly reflects the influence of crystallographic orientation and minor deviations of crystal faces from verticality. Varying the fitting parameters (C1, C0, and d0) results in an estimated uncertainty of ± 0.1 log unit, and the standard deviations of the fitted logD values for a given grain boundary sum up to combined uncertainties of ∼ 0.2 log units within conservative limits (Fig. 2). Given that fit uncertainties are similar for all profiles, averages for each temperature were used in least-squares fitting to the Arrhenius equation (Fig. 5). The uncertainties of the Arrhenius fit arise from the dispersion of averaged diffusion coefficients measured along different grain boundaries at each boundary and from the 0.2 log unit uncertainty defined above, yielding a combined uncertainty of 0.4–0.5 log units (Fig. 5). Diffusion coefficients obtained for each profile are given in Table S1.

Figure 2D H ratio maps in exchanged vesuvianite; isotopic profiles along white lines are outlined on the maps. When faces are perpendicular to the section, the profiles can be fitted to Eq. (1). The location of the maps is shown on a back-scattered electron image of the section equilibrated at 400 °C. The diffusion coefficient is estimated from fits to the diffusion profile, with a typical example for an experiment at 500 °C and 200 h (right, dots). The fitted logD value depends little on whether C1 and C0 are free parameters or are fixed to 1 and 0, respectively. A variation of 0.1 log unit is obtained if the position of the grain boundary is moved by 2 microns, a maximum value for the uncertainty on Raman imaging. This constitutes a conservative estimate of the uncertainty of the diffusion coefficient for a given profile and is similar to or larger than the variability of values along a given grain boundary (Fig. S3).
Diffusion profiles in tremolite cannot be described by diffusion along a simple interface. Sharp isotopic gradients at boundaries between highly cleaved and intact zones of the crystals indicate low intracrystalline diffusivities (Fig. 3). These sharp variations occur over distances close to the size of the probe and provide maximum estimates of the diffusion coefficient for tremolite by convoluting Eq. (1) with a probe size of 500 nm. At all temperatures, irregular D-rich patches are observed next to areas showing little or no exchange (Fig. S4). The resulting D H profiles do not follow inverse error function shapes expected for intracrystalline diffusion, indicating that non-point defects such as cleavages were involved. High cleavage densities produced during manipulation of tremolite crystals effectively reduce grain thickness to values comparable to that of the diffusion length.
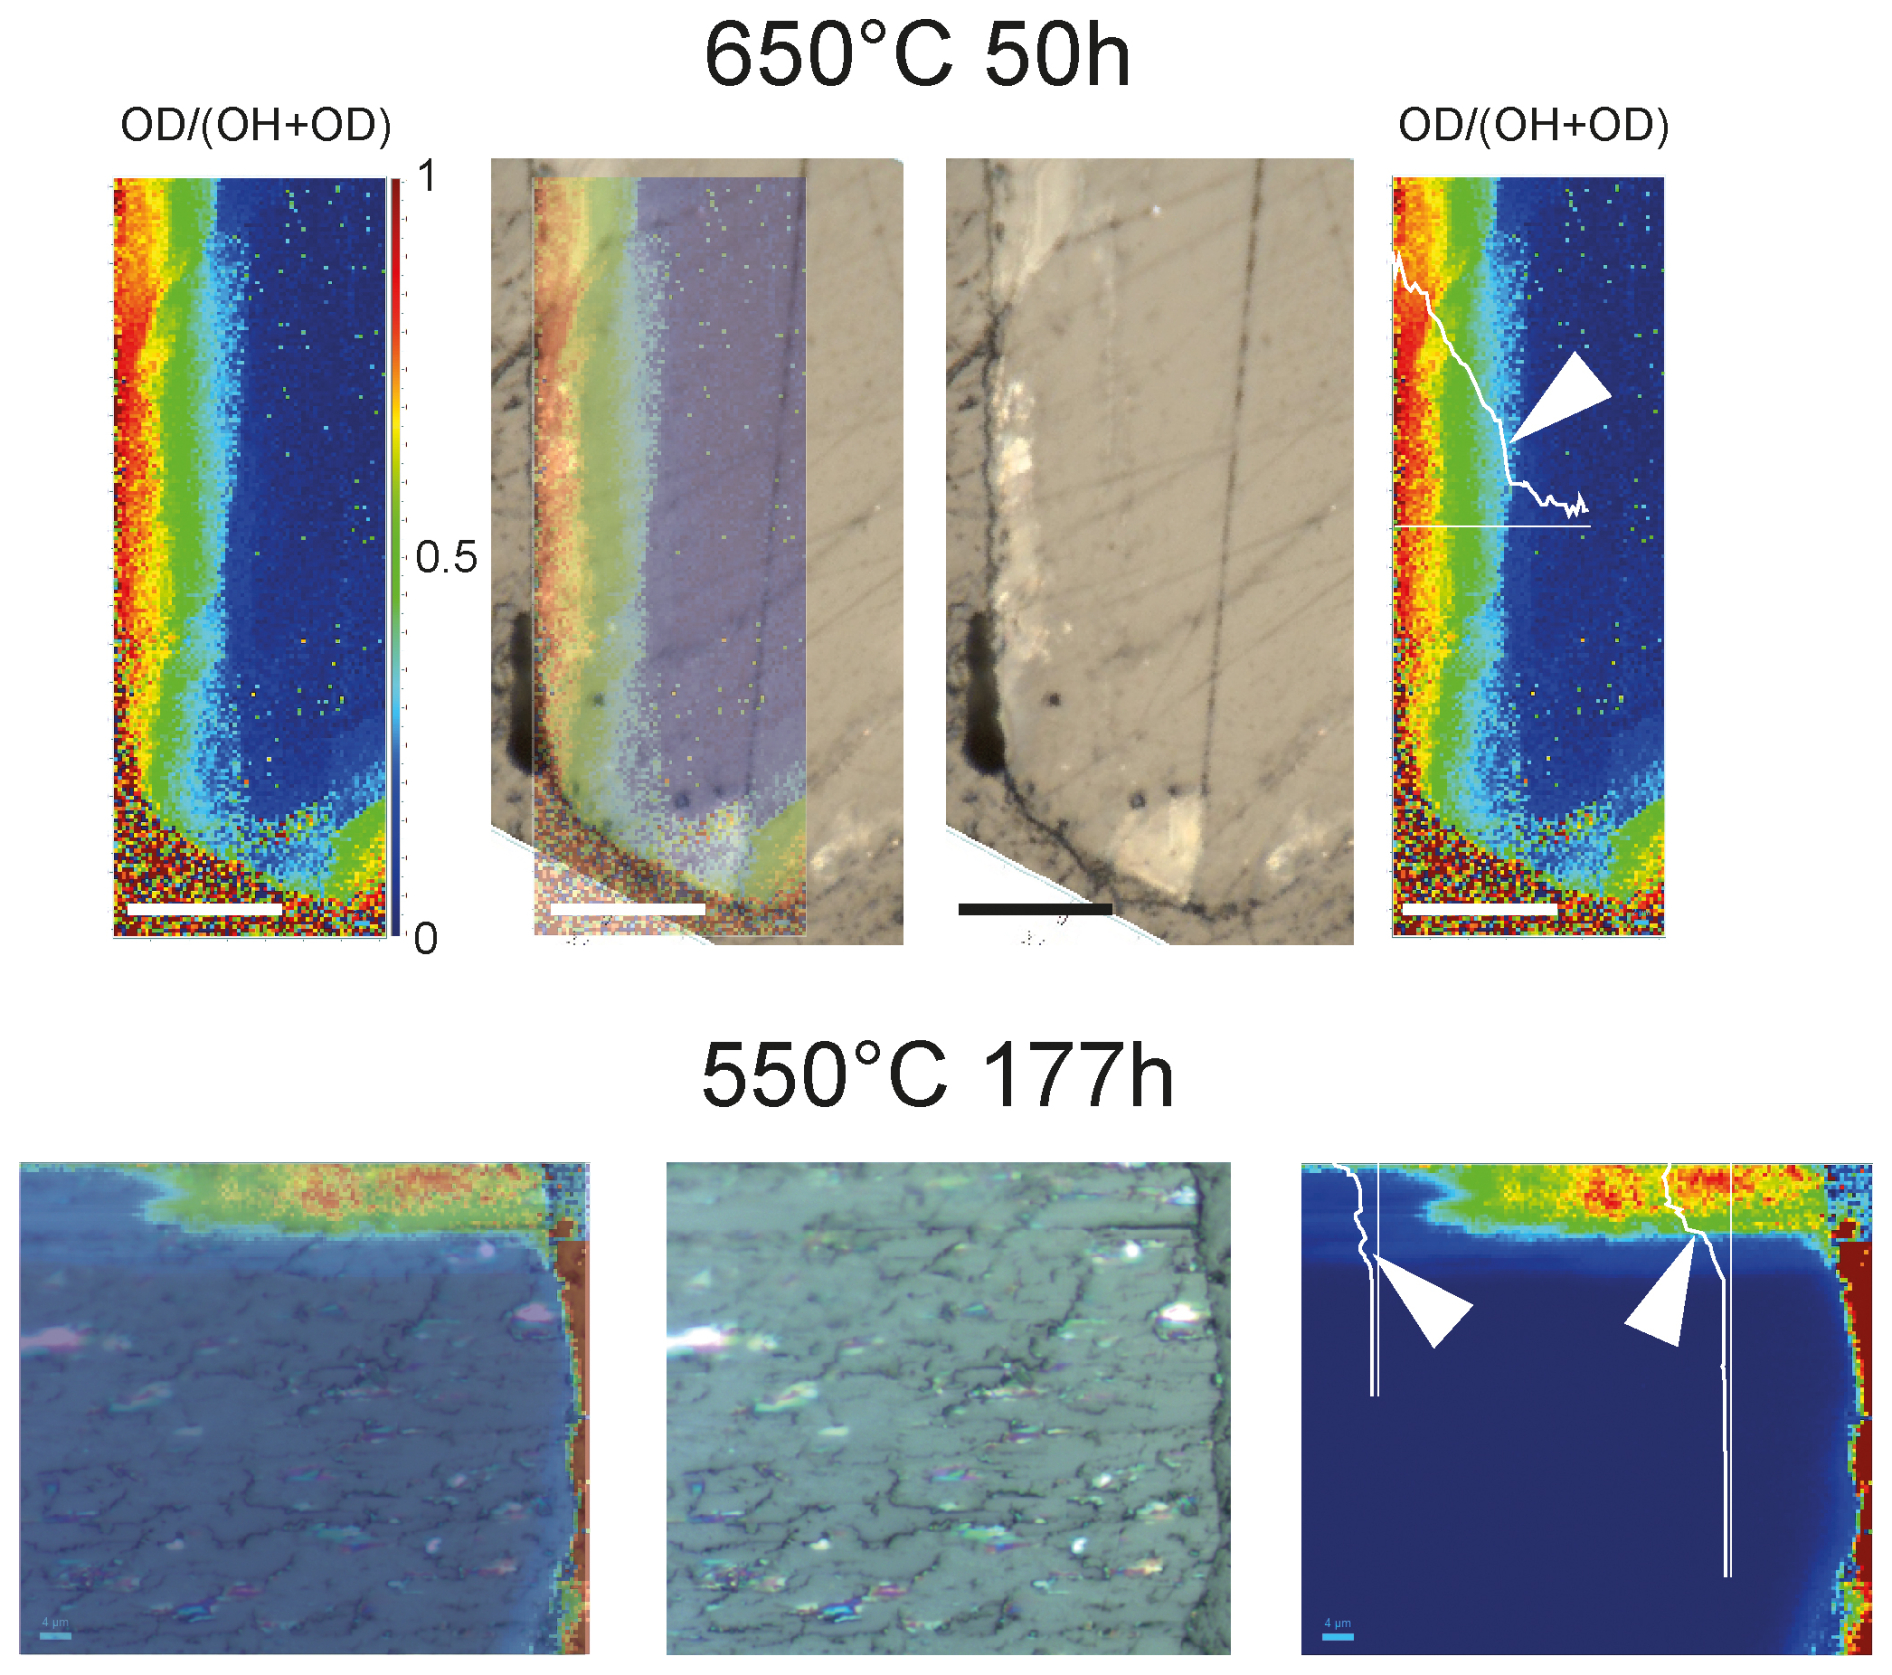
Figure 3D H ratio maps in exchanged tremolite; profiles are outlined in white on the maps. In all maps, D-rich areas correspond to highly cleaved zones, and intact (non-cleaved) areas show low D concentrations. Cleavage opens a new surface for D exchange and reduces the effective grain size, resulting in sharp concentration variations – indicated by the arrows on the profiles – between cleaved and intact areas. Raman maps and optical reflection images are shown, with basal sections (⟂ to c axis) for 650 °C and a section along the c axis (horizontal) for 550 °C. More examples are given in Fig. S4.
Diffusion in glaucophane and epidote was investigated from high-pressure experiments since these phases are metastable at low pressure. Although glaucophane is an amphibole-like tremolite, it shows diffusion profiles that can be fitted with Eq. (1) (Fig. 4). Glaucophane is less prone to cleavage than tremolite, and pressure likely counteracted cleavage formation and opening during the exchange experiment. Subvertical basal crystals display symmetrical profiles along grain boundaries (Figs. 4 and S5), allowing us to constrain diffusion coefficients at 450 and 500 °C (Table S2) within 0.4–0.5 log units using the same uncertainty propagation as in vesuvianite (Fig. 5).
In epidote, diffusion profiles were observed in experimental charges exchanged at 315 and 400 °C. At 500 °C, all crystals were highly deuterated and showed no significant isotopic zoning, indicating saturation of the diffusion process in crystals 30–50 µm across. Similar saturation effects were observed in crystals exchanged at 450 °C, with only a few showing zoning and D-poor cores (Fig. S5).

Figure 4Isotopic maps obtained by Raman spectroscopy on a glaucophane sample exchanged at high pressure. Contrary to ambient-pressure experiments on tremolite, no effect of cleavage is apparent, and grain boundaries are lined with well-defined diffusion profiles. Three profiles perpendicular to the subhorizontal grain boundary give similar logD values around −17 and a small standard deviation. C1, C0, and d0 are free parameters in the fit. Profiles are offset by 0.5 for the sake of readability. Further examples of glaucophane and epidote maps are provided in Fig. S5.

Figure 5Arrhenius plot of D H diffusion coefficients. Dashed lines show former results from bulk exchange data, and full lines show results from SIMS measurements (Table 2). (a) A diffusion law was fitted for vesuvianite (light green) whose diffusion coefficients are similar to those (dark green) of chlorite and antigorite (Ganzhorn et al., 2018; Pilorgé et al., 2017), all falling within 1 order of magnitude. Data for glaucophane (dark blue) fall close to the diffusion law for chlorite. Data for tremolite (blue crosses) were not fitted to an Arrhenius law because of uncertainties associated with cleavage. They fall close to the NanoSIMS data for pargasite (De et al., 2000). (b) Diffusion data for epidote. Empty arrows indicate minimum estimates for D-saturated crystals, and double arrows show the diffusivity range from diffusion profiles. They are broadly consistent with those obtained from bulk analyses on zoisite (Graham, 1981). No fit to an Arrhenius law was attempted due to large uncertainties likely associated with cleavage and anisotropy. Values obtained by SIMS (De et al., 2000) are low and likely reflect slow diffusion along the direction of the measurements (see the text for discussion). Diffusion data on brucite (Guo et al., 2013) fall above those of portlandite (Noguchi and Shinoda, 2010) and are not shown. Diffusion laws are plotted as lines over the actual experimental temperature range for each study.
3.3 Diffusion laws
An Arrhenius relationship is clearly defined in vesuvianite (Fig. 5) and was fitted to Eq. (2). The derived diffusion coefficients and fitted parameters (Table 2) are similar to those obtained for antigorite and chlorite (Pilorgé et al., 2017; Ganzhorn et al., 2018). The activation energies are similar within uncertainties, and diffusion laws for these minerals cover about 1 order of magnitude within the temperature range explored in experiments. Antigorite and vesuvianite have the highest diffusivities, and chlorite has the lowest. At low temperatures, extrapolated diffusion coefficients are higher for vesuvianite than for antigorite due to lower activation enthalpy. Similar diffusion laws reflect similar structures of the phyllosilicates antigorite and chlorite (Ganzhorn et al., 2018) but may be coincidental for vesuvianite with a very different structure.
The two amphiboles, tremolite and glaucophane, show contrasting behavior. In tremolite, isotopic maps clearly indicate that diffusion along open cleavage planes obscures the intracrystalline diffusion profile. The sharp concentration jumps in these profiles have widths comparable to the probe size and were therefore used to estimate loose, upper-limit diffusion coefficients, which remain well below those of the other minerals studied. No Arrhenius fit was attempted for these data because the diffusion coefficients for tremolite are poorly constrained. In contrast, glaucophane displays well-defined diffusion profiles (Fig. 4), yielding diffusion coefficients similar to those of chlorite. As there are only two points for glaucophane, a tentative diffusion law was fitted for glaucophane (Table 2), fixing the value of Ha to 170 kJ mol−1, similarly to that of chlorite and vesuvianite.
Table 2Arrhenius law fits to exchange data in hydrous minerals.

(1) Pilorgé et al. (2017), (2) Ganzhorn et al. (2019), (3) Graham et al. (1987), (4) Graham (1981), (5) Jibao and Yaqian (1997), (6) De et al. (2000), (8) Yaqian and Jibao (1993), (9) Noguchi and Shinoda (2010), and (10) Guo et al. (2013). Regular typeset indicates data for which the analytical resolution allows for the determination of intracrystalline diffusion profiles, italics indicate those for which the resolution of the analytical technique is low and for which crystal size is estimated from optical measurements, and bold indicates those for which the data likely represent intracrystalline diffusion.
For epidote, diffusion profiles were observed after exchange at 315 °C and on a few grains at 400 and 450 °C. At these highest temperatures, most grains showed constant high D (D + H) ratios, indicating full equilibration that prescribes diffusion coefficient quantification. Diffusion coefficients are similar for the three temperatures, suggesting low activation enthalpy consistent with previous findings, although the data scatter prevented a meaningful Arrhenius fit.
4.1 Validity of intracrystalline diffusion laws
Because of the small size of hydrogen, structural defects play a major role in increasing the density of reactive interfaces and atomic mobility. Consequently, diffusion data are strongly influenced by the mechanical and structural properties and by the chemical composition of minerals. By comparing results from this study with those reported in the literature, the validity of published diffusion laws is evaluated and summarized in Table 2. The absence of clear relationships between hydrogen diffusivity and crystal structure (Bosi, 2018; Pavese et al., 1998; Galuskin et al., 2007) or vibrational properties (Kokaly et al., 2017; Reynard and Caracas, 2009; Noguchi and Shinoda, 2010; Dawson et al., 1973) suggests that details of the diffusion mechanism can only be reliably constrained through first-principle calculations (Fig. S6 and Tables S3–S4 in the Supplement). In contrast, mechanical defects such as cleavages and crystal chemistry exert a critical control on diffusion and are discussed below.
Vesuvianite and tourmaline show no cleavage and fracture conchoidally. In vesuvianite, diffusion profiles across grain boundaries (Fig. 2) follow a complementary error function, as expected in intracrystalline diffusion. In tourmaline, diffusion coefficients derived from bulk isotopic exchange kinetics (Jibao and Yaqian, 1997) likely represent intracrystalline diffusion because optical grain size evaluation is valid in crystals lacking cleavage. The composition of tourmaline significantly affects diffusion coefficients (Desbois and Ingrin, 2007), limiting the application of determined diffusion laws to samples with compositions close to those studied in experiments. Compositional variations are more limited in vesuvianite than in tourmaline, suggesting that the diffusion law determined here is applicable in the common case where composition is close to that of the sample studied here.
Amphiboles possess perfect {110} cleavages, which are extremely well developed in calcic amphiboles and less pronounced in sodic ones. Calcic amphiboles display brittle behavior in experiments, though they may deform in a brittle-to-ductile manner in nature (Biermann and Van Roermund, 1983; Dollinger and Blacic, 1975). Natural glaucophane, in contrast, is ductile (Reynard et al., 1989). Easy cleavage in tremolite results in a dramatic reduction in grain thickness perpendicular to the c axis, and open cleavages promote rapid diffusion along damaged zones, as revealed by Raman imaging (Fig. 3). As a result, diffusion coefficients estimated from bulk isotopic-exchange kinetics are overestimated because optical grain size measurements are larger than the effective grain size in cleaved crystals. Variations in cleavage density likely account for the dispersion of D values among calcic amphiboles of similar structure and chemistry (Fig. 5). The lowest diffusion coefficients derived from Raman mapping of tremolite are consistent with SIMS measurements in pargasite (De et al., 2000). In glaucophane, cleavage formation was likely inhibited under high-pressure experimental conditions, allowing intracrystalline diffusion profiles to develop and reliable diffusion coefficients to be determined. Diffusion coefficients are much higher in glaucophane than in tremolite, likely reflecting the influence of chemistry in addition to cleavage.
Muscovite and chlorite have perfect (001) cleavage. Muscovite shows plastic behavior even at low stresses and a high experimental strain rate (Mares and Kronenberg, 1993), similarly to biotite (Kronenberg et al., 1990), lizardite, and chlorite (Amiguet et al., 2014; Amiguet et al., 2012), all phyllosilicates with continuous silicate sheets. The close agreement between the diffusion coefficients obtained by bulk isotopic analyses and by spatially resolved Raman mapping in chlorite (Ganzhorn et al., 2019; Graham et al., 1987) indicates that perfect cleavage has little effect on effective grain size or bulk isotopic exchange, likely because it is compensated for by plastic glide along sheets. This interpretation is supported by Raman images showing only minor broadening of intracrystalline diffusion profiles in bent areas of chlorite crystals (Fig. 1). The same reasoning applies to brucite and portlandite with perfect cleavage, for which diffusion coefficients are high and activation energies are low.
Antigorite possesses a good (001) cleavage parallel to its layered structure. Diffusion coefficients were determined from well-identified intracrystalline zoning and from stress-free diamond-anvil-cell experiments in liquid deuterated water (Pilorgé et al., 2017). Strong anisotropy is observed between directions along and perpendicular to sheets, consistently with results for chlorite (Ganzhorn et al., 2018).
Epidote and zoisite have perfect (001) cleavages and change deformation style – from twinning and brittle to plastic deformation – across the transition from greenschist- to amphibolite-facies conditions (Franz and Liebscher, 2004). Diffusion coefficients derived from bulk isotopic exchange are very high in epidote (Graham et al., 1980), possibly reflecting a grain size reduction due to easy cleavage. Diffusion coefficients from bulk isotopic exchange in zoisite (Graham et al., 1980) are similar to the diffusion coefficients obtained on epidote in the present study. In contrast, the diffusion coefficients obtained by SIMS (De et al., 2000) are much lower; these low values were measured along the b axis, whereas high values are obtained here along this direction. This inconsistency may stem from a crystallographic setting based on optical rather than X-ray conventions, where the optical b axis corresponds to the X-ray a axis (Game, 1954). Regardless, the large scatter of D values suggests that crystal anisotropy and cleavage exert a significant control on diffusion, making it difficult to define a single, robust diffusion law.
Diffusion coefficients in ilvaite (Yaqian and Jibao, 1993) are comparable to those of zoisite, consistent with their structural similarity. However, absolute D values from bulk isotopic measurements should be treated with caution as they may be overestimated due to grain size reduction in minerals with easy cleavage.
4.2 Implications for hydrous mineral water isotopic exchange in geological settings
Interpretation of isotopic compositions to constrain fluid sources relies on estimating when a mineral–fluid system becomes closed to exchange – the so-called closure temperature, which depends critically on diffusion law parameters (Dodson, 1973). Amphiboles, chlorite, and epidote are widespread in many geological environments, including oceanic and continental crustal faults and shear zones, hydrothermal veins, and subduction interfaces, where they interact with fluids of diverse origins (Kyser and Kerrich, 1991; Menzies et al., 2014; Shilobreeva et al., 2011). Vesuvianite, though less common, is also stable over a broad range of metamorphic conditions (Dey et al., 2019; Valley et al., 1985). Using the present compilation and critical evaluation of diffusion data, we estimate hydrogen closure temperatures and discuss their implications for isotopic studies.
Closure temperatures were calculated assuming three representative diffusion laws. First, because antigorite, chlorite, vesuvianite, muscovite, and glaucophane exhibit comparable diffusivities, the vesuvianite diffusion law was used to estimate closure temperatures for these minerals, characterized by a high activation enthalpy (Ha = 165 kJ mol−1) and pre-exponential factor (D0 = 10−5 m2 s−1). Second, the diffusion law for pargasite was adopted to estimate closure temperatures for calcic amphiboles, consistently with the upper bounds obtained for tremolite in this study. Closure temperatures for calcic amphiboles should therefore be regarded as minimum estimates, reflecting their low Ha (67 kJ mol−1) and D0 (10−14 m2 s−1). Third, the diffusion law derived from bulk measurements on zoisite was used as a proxy for the epidote–zoisite solid solution, recognizing that the data scatter likely reflects uncertainties associated with crystallographic orientation and cleavage effects during experiments. This diffusion law is characterized by intermediate parameters (Ha = 102 kJ mol−1; D0 = 10 m2 s−1). Diffusion coefficients for portlandite and brucite are high, and these minerals may remain open to exchange down to ambient temperature. They are not further discussed because they are uncommon in metamorphic rocks.
Closure temperatures (TC) were calculated using the following relation (Dodson, 1973):
where Ha and D0 are the Arrhenius law parameters, a is the grain size, A is a factor depending on shape anisotropy (a unique value of 55 was used here for the sake of simplicity), is the cooling rate, and R is the gas constant. Closure temperatures are reported as a function of cooling rate for the three characteristic diffusion laws (Fig. 6).
Closure temperatures for vesuvianite, phyllosilicates, and possibly glaucophane fall between 200 and 350 °C under typical metamorphic cooling rates. Isotopic compositions in these minerals may thus be modified by late, low-temperature fluid circulation. Such alteration should be accompanied by mineralogical changes detectable through petrographic observations. If formed below 200–350 °C, minerals such as chlorite and vesuvianite may record the isotopic composition of late metamorphic or hydrothermal fluids, as observed near the Alpine Fault in New Zealand (Menzies et al., 2014).

Figure 6Closure temperatures as a function of cooling rates and grain size for three characteristic diffusion laws for vesuvianite and/or phyllosilicates (green), calcic amphiboles (blue), and zoisite–epidote (red). Geological processes are indicated as a guide to the eye, but actual boundaries for those processes are not strictly defined.
Closure temperatures calculated using the zoisite–epidote diffusion law indicate that these minerals remain open to isotopic exchange under most geological conditions, except during slow, low-temperature evolutions associated with near-surface exhumation. Consequently, epidotes in late-metamorphic veins may record meteoric fluid circulation during the final stages of exhumation or along major fault zones. As discussed earlier, diffusion in epidote is likely anisotropic, and distinct diffusion profiles should be observed along different crystallographic orientations in large crystals, typically a few millimeters, such as those found in low-temperature greenschist-facies veins.
For calcic amphiboles, closure temperature estimates suggest that small crystals (< 100 µm) and crystal rims remain open to isotopic exchange, whereas large crystals (> 1 mm) are only partially re-equilibrated under low cooling rates. Hydrogen isotope data from amphibole- and epidote-bearing veins document late circulation of meteoric or marine fluids along major continental (Menzies et al., 2016) and oceanic faults (Masoch et al., 2025). The present diffusion data imply that measurable diffusion profiles can develop in common metamorphic vein minerals containing amphiboles and epidotes, recording transitions from deep, rock-buffered fluid compositions to shallower, more open-system conditions.
Closure temperatures calculated for calcic amphiboles also suggest that millimetric and larger crystals may remain near equilibrium with the surrounding fluid during short-lived, high-temperature magmatic events. This interpretation is consistent with observations of preserved mantle-like D H ratios in the cores of magmatic pargasites and partial re-equilibration of rims over distances of 100–200 µm as evidenced by SIMS mapping in Hawaii xenoliths (Deloule et al., 1991).
Raman isotopic mapping of hydrogen in hydrous minerals was calibrated against NanoSIMS analyses. It provides a robust and high-resolution method for quantifying hydrogen diffusivities in experimentally doped systems. This cross-calibration demonstrates that Raman spectroscopy can yield spatially resolved isotopic data comparable in terms of accuracy to NanoSIMS, while offering cheaper, easier to operate, and less destructive characterization.
Hydrogen diffusivities are shown to be highly sensitive to mechanical defects and chemical composition. These effects emphasize the need to focus on systems where true intracrystalline diffusion can be defined and on mineral series with limited compositional variability, unless compositional influences are explicitly constrained.
Despite these complexities, the new diffusion data and closure temperature estimates presented here substantially enhance our ability to interpret hydrogen isotope signatures in hydrous minerals. They provide a quantitative framework for tracing fluid–rock interaction and hydrogen mobility across a wide spectrum of metamorphic, hydrothermal, and magmatic environments.
Detailed original data will be provided upon reasonable request to the corresponding author.
The Supplement contains a discussion of secondary controls on diffusion, Figs. S1–6, and Tables S1–4. The supplement related to this article is available online at https://doi.org/10.5194/ejm-38-103-2026-supplement.
BR and JI designed the project, experiments, and analytical procedures. BR, JI, JJ, ACG, HP, and NH carried out the experiments and analyzed the data. CF performed the SEM-EDX analyses. LR performed NanoSIMS analyses. BR prepared the paper with contributions from all of the co-authors.
At least one of the (co-)authors is a member of the editorial board of European Journal of Mineralogy. The peer-review process was guided by an independent editor, and the authors also have no other competing interests to declare.
Publisher's note: Copernicus Publications remains neutral with regard to jurisdictional claims made in the text, published maps, institutional affiliations, or any other geographical representation in this paper. The authors bear the ultimate responsibility for providing appropriate place names. Views expressed in the text are those of the authors and do not necessarily reflect the views of the publisher.
We thank two anonymous referees for constructive criticism that helped improve the manuscript. Gilles Montagnac helped with the Raman spectrometers. Joerg Hermann kindly provided the chlorite sample.
This research was supported by grants to BR through the LABEX Lyon Institute of Origins (grant no. ANR-10-LABX-0066) of the Université de Lyon within the program “Investissements d'Avenir” (grant no. ANR-11-IDEX-0007) of the French government and the project HDEEP-ISO (grant no. ANR-21-CE49-0018), operated by the National Research Agency (ANR). This work was also supported by Institut national des Sciences de l'Univers (INSU) through the “Programme national de Planétologie”.
This paper was edited by Stefano Poli and reviewed by two anonymous referees.
Amiguet, E., Reynard, B., Caracas, R., Van de Moortèle, B., Hilairet, N., and Wang, Y.: Creep of phyllosilicates at the onset of plate tectonics, Earth and Planetary Science Letters, 345–348, 142–150, https://doi.org/10.1016/j.epsl.2012.06.033, 2012.
Amiguet, E., van de Moortèle, B., Cordier, P., Hilairet, N., and Reynard, B.: Deformation mechanisms and rheology of serpentines in experiments and in nature, Journal of Geophysical Research, 119, https://doi.org/10.1002/2013JB010791, 2014.
Bebout, G. E. and Penniston-Dorland, S. C.: Fluid and mass transfer at subduction interfaces – The field metamorphic record, Lithos, 240–243, 228–258, https://doi.org/10.1016/j.lithos.2015.10.007, 2016.
Biermann, C. and Van Roermund, H. L. M.: Defect structures in naturally deformed clinoamphiboles – a TEM study, Tectonophysics, 95, 267–278, https://doi.org/10.1016/0040-1951(83)90072-0, 1983.
Bosi, F.: Tourmaline crystal chemistry, American Mineralogist, 103, 298–306, https://doi.org/10.2138/am-2018-6289, 2018.
Burns, R. G. and Greaves, C.: Correlations of infrared and Mossbauer site population measurements of actinolites, American Mineralogist: Journal of Earth and Planetary Materials, 56, 2010–2033, 1971.
Carslaw, H. and Jaeger, J.: Conduction of Heat in Solids, 2nd Edn., Clarendon, London, ISBN-13 978-0198533030, 1959.
Corona, J. C. and Jenkins, D. M.: An experimental investigation of the reaction: glaucophane + 2 quartz = 2 albite + talc, European Journal of Mineralogy, 19, 147–158, https://doi.org/10.1127/0935-1221/2007/0019-1719, 2007.
Cranck, J.: The mathematics of diffusion, Oxford University Press, Oxford, ISBN-13 978-0198534112, 1975.
Dawson, P., Hadfield, C. D., and Wilikinson, G. R.: The polarized indrared and Raman spectra of Mg(OH)2 and Ca(OH)2, Journal of Physics and Chemistry of Solids, 34, 1217–1225, 1973.
De, S., Cole, D., Riciputi, L., Chacko, T., and Horita, J.: Experimental determination of hydrogen diffusion rates in hydrous minerals using the ion microprobe, Goldschmidt Journal of Conference Abstracts, 5, 340, https://www.academia.edu/75339628/Experimental_determination_of_hydrogen_diffusion_rates_in_hydrous_minerals_using_the_ion_microprobe?uc-sb-sw=109288510 (last access: 25 February 2026), 2000.
Deloule, E., Albarède, F., and Sheppard, S. M. F.: Hydrogen isotope heterogeneities in the mantle from ion probe analysis of amphiboles from ultramafic rocks, Earth and Planetary Science Letters, 105, 543–553, https://doi.org/10.1016/0012-821X(91)90191-J, 1991.
Desbois, G. and Ingrin, J.: Anisotropy of hydrogen diffusion in tourmaline, Geochimica et Cosmochimica Acta, 71, 5233–5243, https://doi.org/10.1016/j.gca.2007.08.027, 2007.
Dey, A., Choudhury, S. R., Mukherjee, S., Sanyal, S., and Sengupta, P.: Origin of vesuvianite-garnet veins in calc-silicate rocks from part of the Chotanagpur Granite Gneiss Complex, East Indian Shield: the quantitative PTX CO2 topology in parts of the system CaO-MgO-Al2O3-SiO2-H2O-CO2 (+ Fe2O3, F), American Mineralogist, 104, 744–760, 2019.
Dodson, M. H.: Closure temerature in cooling geochronological and petrological systems, Contributions to Mineralogy and Petrology, 40, 259–274, 1973.
Dollinger, G. and Blacic, J. D.: Deformation mechanisms in experimentally and naturally deformed amphiboles, Earth and Planetary Science Letters, 26, 409–416, https://doi.org/10.1016/0012-821X(75)90016-3, 1975.
Franz, G. and Liebscher, A.: Physical and Chemical Properties of the Epidote Minerals – An Introduction, in: Reviews in Mineralogy & Geochemistry 56: Epidotes, edited by: Liebscher, A. and Franz, G., Mineralogical Society of America, 1–82, https://doi.org/10.2113/gsecongeo.101.4.903, 2004.
Galuskin, E., Janeczek, J., Kozanecki, M., Sitarz, M., Jastrzębski, W., Wrzalik, R., and Stadnicka, K.: Single-crystal Raman investigation of vesuvianite in the OH region, Vibrational Spectroscopy, 44, 36–41, 2007.
Game, P.: Zoisite-amphibolite with corundum from Tanganyika, Mineralogical Magazine, 30, 458–466, 1954.
Ganzhorn, A.-C., Pilorgé, H., Le Floch, S., Montagnac, G., Cardon, H., and Reynard, B.: Deuterium-hydrogen inter-diffusion in chlorite, Chemical Geology, 493, 518–524, https://doi.org/10.1016/j.chemgeo.2018.07.010, 2018.
Ganzhorn, A. C., Pilorgé, H., and Reynard, B.: Porosity of metamorphic rocks and fluid migration within subduction interfaces, Earth and Planetary Science Letters, 522, 107–117, https://doi.org/10.1016/j.epsl.2019.06.030, 2019.
Graham, C. M.: Experimental Hydrogen Isotope Studies III: Diffusion of Hydrogen in Hydrous Minerals, and Stable Isotope Exchange in Metamorphic Rocks, Contributions to Mineralogy and Petrology, 76, 216–228, 1981.
Graham, C. M., Sheppard, S. M. F., and Heaton, T. H. E.: Experimental Hydrogen Isotope Studies, 1. Systematics of Hydrogen Isotope Fractionation in the Systems Epidote-H2O, Zoisite-H2O and AlO(OH)-H2O, Geochimica et Cosmochimica Acta, 44, 353–364, 1980.
Graham, C. M., Viglino, J. A., and Harmon, R. S.: Experimental study of hydrogen-isotope exchange between aluminous chlorite and water and of hydrogen diffusion in chlorite, American Mineralogist, 72, 566–579, 1987.
Guo, X., Yoshino, T., Okuchi, T., and Tomioka, N.: H-D interdiffusion in brucite at pressures up to 15 GPa, American Mineralogist, 98, 1919–1929, https://doi.org/10.2138/am.2013.4550, 2013.
Hercule, S. and Ingrin, J.: Hydrogen in diopside: Diffusion, kinetics of extraction-incorporation, and solubility, American Mineralogist, 84, 1577–1587, 1999.
Hyndman, R. and Peacock, S.: Serpentinization of the forearc mantle, Earth and Planetary Science Letters, 212, 417–432, 2003.
Jenkins, D. M.: The transition from blueschist to greenschist facies modeled by the reaction glaucophane + 2 diopside + 2 quartz = tremolite + 2 albite, Contributions to Mineralogy and Petrology, 162, 725–738, https://doi.org/10.1007/s00410-011-0621-8, 2011.
Jibao, G. and Yaqian, Q.: Hydrogen isotope fractionation and hydrogen diffusion in the tourmaline-water system, Geochimica et Cosmochimica Acta, 61, 4679–4688, https://doi.org/10.1016/S0016-7037(97)00252-4, 1997.
Kokaly, R. F., Clark, R. N., Swayze, G. A., Livo, K. E., Hoefen, T. M., Pearson, N. C., Wise, R. A., Benzel, W. M., Lowers, H. A., Driscoll, R. L., and Klein, A. J.: USGS Spectral Library Version 7, U.S. Geological Survey [data set], https://doi.org/10.3133/ds1035, 2017.
Kronenberg, A. K., Kirby, S. H., and Pinkston, J.: Basal slip and mechanical anisotropy of biotite, Journal of Geophysical Research: Solid Earth, 95, 19257–19278, 1990.
Kueter, N., Brugman, K., Miozzi, F., Cody, G. D., Yang, J., Strobel, T. A., and Walter, M. J.: Water speciation and hydrogen isotopes in hydrous stishovite: implications for the deep Earth water cycle, Contributions to Mineralogy and Petrology, 178, 48, https://link.springer.com/article/10.1007/s00410-023-02028-6, 2023.
Kyser, T. K. and Kerrich, R.: Retrograde exchange of hydrogen isotopes between hydrous minerals and water at low temperatures, Stable isotope geochemistry, A tribute to samuel Epstein, Geochemical Society, https://geochemsoc.org/publications/special-publications-series/v3-stable-isotope-geochemistry (last access: 25 February 2026), 1991.
Lodhia, B. H., Peeters, L., and Frery, E.: A review of the migration of hydrogen from the planetary to basin scale, Journal of Geophysical Research: Solid Earth, 129, e2024JB028715, https://doi.org/10.1029/2024JB028715, 2024.
Long, D. A.: Raman spectroscopy, McGraw Hill, 276 pp., ISBN-13 978-0070386754, 1977.
Mares, V. M. and Kronenberg, A. K.: Experimental deformation of muscovite, Journal of Structural Geology, 15, 1061–1075, https://doi.org/10.1016/0191-8141(93)90156-5, 1993.
Masoch, S., Dallai, L., Gomila, R., Fondriest, M., Novella, D., Pennacchioni, G., Cembrano, J., and Di Toro, G.: Evolving Fluid Source During the Growth of a Trench-Parallel Seismogenic Fault System, Geochemistry Geophysics Geosystems, 26, e2024GC011998, https://doi.org/10.1029/2024GC011998, 2025.
Menzies, C. D., Teagle, D. A. H., Craw, D., Cox, S. C., Boyce, A. J., Barrie, C. D., and Roberts, S.: Incursion of meteoric waters into the ductile regime in an active orogen, Earth and Planetary Science Letters, 399, 1–13, https://doi.org/10.1016/j.epsl.2014.04.046, 2014.
Menzies, C. D., Teagle, D. A., Niedermann, S., Cox, S. C., Craw, D., Zimmer, M., Cooper, M. J., and Erzinger, J.: The fluid budget of a continental plate boundary fault: Quantification from the Alpine Fault, New Zealand, Earth and Planetary Science Letters, 445, 125–135, 2016.
Mittempergher, S., Dallai, L., Pennacchioni, G., Renard, F., and Di Toro, G.: Origin of hydrous fluids at seismogenic depth: Constraints from natural and experimental fault rocks, Earth and Planetary Science Letters, 385, 97–109, https://doi.org/10.1016/j.epsl.2013.10.027, 2014.
Noguchi, N. and Shinoda, K.: Proton migration in portlandite inferred from activation energy of self-diffusion and potential energy curve of OH bond, Physics and Chemistry of Minerals, 37, 361–370, 2010.
Pavese, A., Prencipe, M., Tribaudino, M., and Aagaard, S. S.: X-ray and neutron single-crystal study of P4/n vesuvianite, The Canadian Mineralogist, 36, 1029–1038, 1998.
Pilorgé, H., Reynard, B., Remusat, L., Le Floch, S., Montagnac, G., and Cardon, H.: D H diffusion in serpentine, Geochimica et Cosmochimica Acta, 211, 355–372, https://doi.org/10.1016/j.gca.2017.05.022, 2017.
Quérel, G. and Reynard, B.: High-pressure luminescence spectroscopy of transition elements: experimental setup and preliminary results on Cr3+ in silicate glasses, Chemical Geology, 128, 65–75, 1996.
Reynard, B. and Ballevre, M.: Coexisting Amphiboles in an Eclogite from the Western Alps – New Constraints on the Miscibility Gap between Sodic and Calcic Amphiboles, Journal of Metamorphic Geology, 6, 333–350, 1988.
Reynard, B. and Caracas, R.: D H isotopic fractionation between brucite Mg(OH)2 and water from first-principles vibrational modeling, Chemical Geology, 262, 159–168, https://doi.org/10.1016/j.chemgeo.2009.01.007, 2009.
Reynard, B., Gillet, P., and Willaime, C.: Deformation mechanisms in naturally deformed glaucophanes: a TEM and HRTEM study, European Journal of Mineralogy, 1, 611–624, 1989.
Reynard, B., Ganzhorn, A.-C., and Coltice, N.: Primordial serpentinized crust on the early Earth, Physics of the Earth and Planetary Interiors, 332, 106936, https://doi.org/10.1016/j.pepi.2022.106936, 2022.
Scaillet, B., Pichavant, M., Roux, J., Humbert, G., and Lefvre, A.: Improvements of the Shaw membrane technique for measurement pressures control of fH2 at high temperatures and pressures, American Mineralogist, 77, 647–655, 1992.
Schmidt, M. W. and Poli, S.: Experimentally based water budgets for dehydrating slabs and consequences for arc magma generation, Earth and Planetary Science Letters, 163, 361–379, 1998.
Shilobreeva, S., Martinez, I., Busigny, V., Agrinier, P., and Laverne, C.: Insights into C and H storage in the altered oceanic crust: results from ODP/IODP Hole 1256D, Geochimica et Cosmochimica Acta, 75, 2237–2255, 2011.
Thomen, A., Robert, F., and Remusat, L.: Determination of the nitrogen abundance in organic materials by NanoSIMS quantitative imaging, Journal of Analytical Atomic Spectrometry, 29, 512–519, https://doi.org/10.1039/C3JA50313E, 2014.
Valley, J. W., Peacor, D. R., Bowman, J. R., Essene, E. J., and Allard, M. J.: Crystal chemistry of a Mg-vesuvianite and implications of phase equilibria in the system CaO-MgO-Al2O3-SiO2-H2O-CO2, Journal of Metamorphic Geology, 3, 137–153, https://doi.org/10.1111/j.1525-1314.1985.tb00311.x, 1985.
Yaqian, Q. and Jibao, G.: Study of hydrogen isotope equilibrium and kinetic fractionation in the ilvaite-water system, Geochimica et Cosmochimica Acta, 57, 3073–3082, https://doi.org/10.1016/0016-7037(93)90294-7, 1993.
Zarei, A., Klumbach, S., and Keppler, H.: The Relative Raman Scattering Cross Sections of H2O and D2O, with Implications for In Situ Studies of Isotope Fractionation, ACS Earth and Space Chemistry, 2, 925–934, https://doi.org/10.1021/acsearthspacechem.8b00078, 2018.