the Creative Commons Attribution 4.0 License.
the Creative Commons Attribution 4.0 License.
 | 14 Oct 2025
Crystal chemistry and trace-element behaviour in tourmalines from Minas Gerais, Brazil
Florent Bomal
Frédéric Hatert
Simon Philippo
Maël Guennou
Martin Depret
Hao Wang
Pierre Lefèvre
Muriel Erambert
A series of 17 museum tourmaline samples from several pegmatites of Minas Gerais, Brazil, were investigated by several techniques including single-crystal X-ray structure refinements, electron microprobe, and laser ablation inductively coupled plasma time-of-flight mass spectrometry (LA-ICP-TOF-MS). Chemically, most samples are Na-dominant on the X site and therefore belong to the alkali group. They correspond to fluor-elbaites or elbaites, where similar proportions of Al and Li share the Y positions. Elbaites are located close to the elbaitic end-member, with Fe2+ strongly depleted and the schorlitic component negligible, while fluor-elbaites tend to align along the fluor-elbaite to fluor-schorl solid solution. One sample, with vacancies dominant on the X site, is identified as a rossmanite close to the foitite compositional field. Besides the classical schorlitic substitution, several other mechanisms were observed, evolving towards rossmanite (XNaLi 0.5 YAl3+), towards liddicoatite (XNaAlCaLi+), or towards oxy-foitite (0.5 XNaFe(OH)AlO2−). Single-crystal data indicate a unit-cell parameters varying between 15.8187(3) and 15.9309(3) Å and c parameters ranging from 7.0924(2) to 7.1279(2) Å. These values are similar to those obtained for Brazilian tourmalines of the elbaite–schorl solid solution. A detailed cation distribution has also been established, indicating that the B site is fully occupied by boron, that the T site is mainly occupied by Si and sometimes by minor amounts of B, and that the Z site is mainly occupied by Al with sometimes minor amounts of Fe3+. The X site contains vacancies, Na, K, and Ca, and the Y site is occupied by Li, Al, and Fe2+ and minor amounts of Mn2+, Ti, Mg, and Zn. In two samples, a significant disorder between Li and Ca on the X and Y sites has been observed. The position of our samples in a diagram correlating the fluorine and the Fe2+ contents of tourmalines indicates that they are below the trend admitted for primary pegmatitic tourmalines. This feature can be explained by their occurrence in miarolitic cavities, where fluid circulations may affect the tourmaline composition. Finally, the trace-element contents, including rare earth elements (REEs), are discussed in detail and appear to be influenced by both the geochemical pegmatitic context and crystal–chemical constraints.
- Article
(6639 KB) - Full-text XML
-
Supplement
(323 KB) - BibTeX
- EndNote


Tourmalines are accessory minerals occurring in most crustal environments. They mainly appear in igneous, metamorphic, or metasomatic contexts and occasionally in sedimentary settings. Very common in granitic pegmatites, tourmaline crystals often reach pluri-centimetric to metric sizes, unmatched qualities, and beautiful colours, therefore making them highly prized on the gemstone market. But, beyond this economic value, their real interest lies in their ability to provide a wide range of information about the geological context from which they originate. Some tourmaline solid solutions like the schorl–elbaite series can, for example, be used as differentiation markers within lithium-enriched pegmatites. Moreover, being the most widespread borosilicate phase in nature, they allow extensive comprehension of the phenomenon leading to the formation of their geological deposits.
The nomenclature and classification of the tourmaline supergroup, developed by Hawthorne and Henry (1999) and approved by the Commission on New Minerals, Nomenclature and Classification of the International Mineralogical Association (IMA-CNMNC), define tourmalines as trigonal borosilicates with a R3m space group (Buerger and Parrish, 1937; Hamburger and Buerger, 1948) and with a general formula XY3Z6[T6O18](BO3)3V3W (Hawthorne and Henry, 1999), where X= Na, Ca, K, □; Y= Li, Mg, Fe2+, Mn2+, Zn, Al, Cr3+, V3+, Fe3+, Ti4+; Z= Mg, Al, Fe2+, Fe3+, Cr3+, V3+; T= Si, Al, B; B= B; V= OH, O; and W= OH, F, O (Henry et al., 2011). The tourmaline structure allows a wide range of substitutions, leading to numerous end-members. Most of the compositional variations occur on the X, Y, Z, W, and V sites, whereas the T and B sites are less likely to accept different cations (Ertl et al., 2018). Amongst the anionic sites, the O3 and O1 positions are occupied by anions from the V and W groups, respectively. Hydrogen atoms H3 and H1 are chemically bonded to the oxygen atoms of these O3 and O1 sites, respectively (Bosi, 2018; Henry and Dutrow, 2018).
Due to their capacity to generate strong economic and scientific interests, tourmalines rank amongst the most extensively studied minerals in the world. The understanding of their highly complex crystal chemistry is refined day by day. This is especially the case for pegmatitic tourmalines from Minas Gerais (Brazil), as the region has proven itself to be a particularly fertile field of experimentation to work on these minerals. This is explained mainly by the wealth in terms of high-quality crystals and in terms of various geological contexts in the region but also by the ease of access to samples formed in these deposits. However, gaps remain concerning some aspects of these minerals, since most publications have been dedicated to the determination of major-element concentrations in crystals from the main deposits of the country. This implies not only that the majority of small deposits are very poorly known in terms of tourmaline crystal chemistry, but also that the trace-element concentrations and behaviours have almost never been studied in most deposits from Minas Gerais.
With the present paper, we attempt to fill this gap by investigating 17 tourmaline crystals from eight pegmatite deposits in Minas Gerais. These samples will be analysed by electron microprobe (EMP) and by laser ablation inductively coupled plasma time-of-flight mass spectrometry (LA-ICP-TOF-MS) to determine their major- and trace-element concentrations and by single-crystal X-ray diffraction (SCXRD) to assess their structural features. Relationships between these data and the geological context will also be discussed.
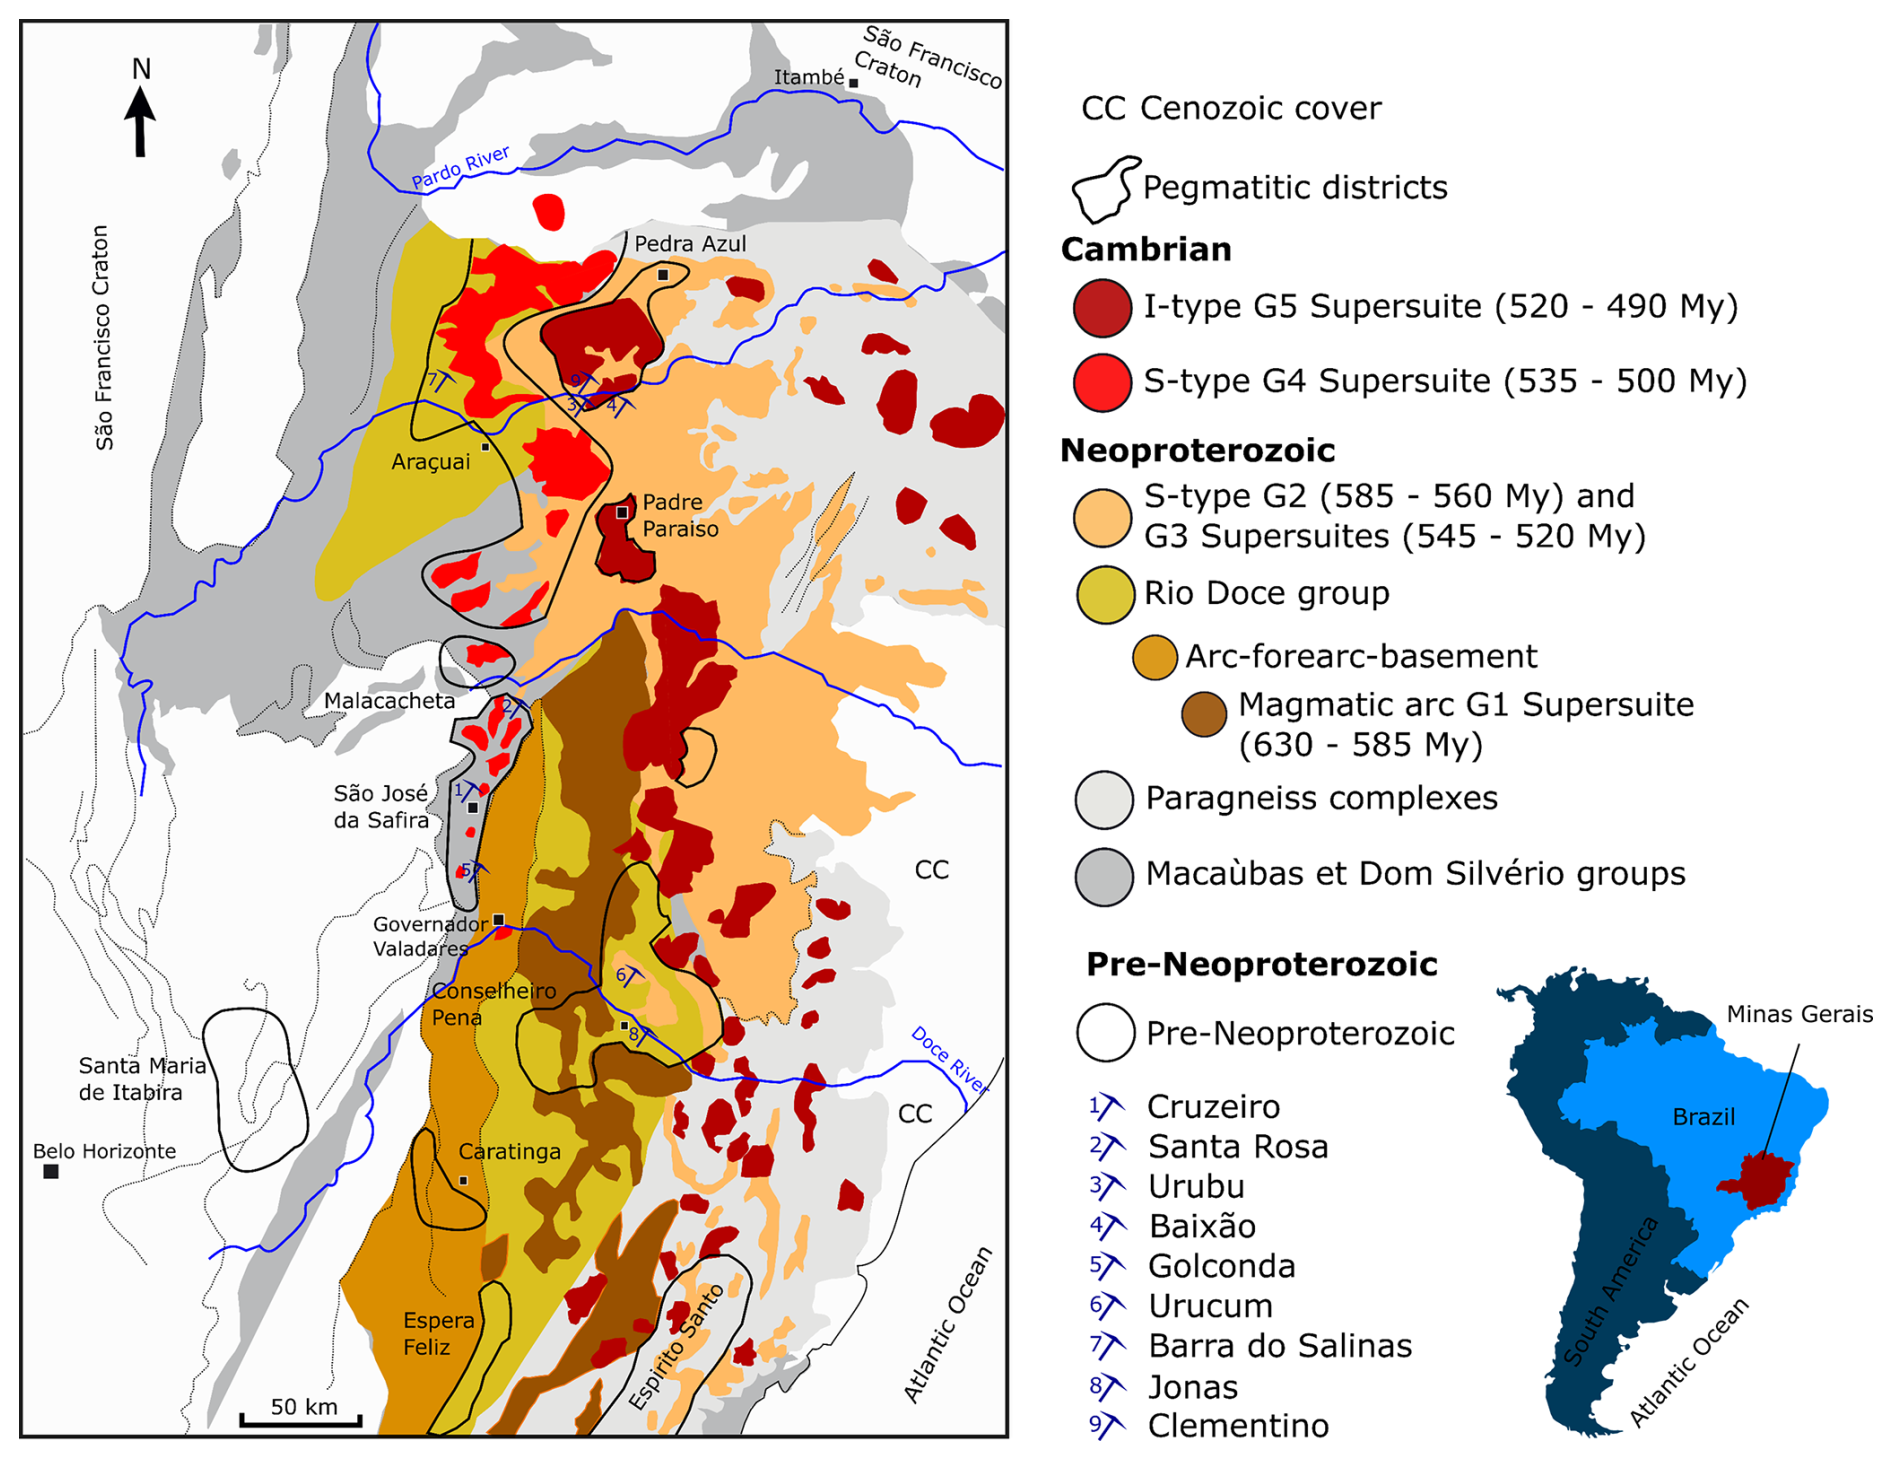
Figure 1Geology of the Eastern Brazilian Pegmatite Province, showing the main pegmatitic districts (modified from Pedrosa-Soares et al., 2001b, 2009). The inset gives the location of the Minas Gerais province.
Covering about 589 000 km2 of south-eastern Brazil, the mining state of Minas Gerais (Fig. 1) has been a major tourmaline producer worldwide since the end of the 17th century. Amongst the wide diversity of geological contexts encompassed in this Brazilian state can be found four major units: the tectonic belts of Tocantins and Mantiqueira that are mainly composed of Proterozoic granites and granitoids as well as metamorphic rocks; the São Francisco Craton, defined by sedimentary rocks from the Neoproterozoic and Cretaceous periods; and the Paraná Basin, which gathers sediments from the Ordovician to the Cretaceous (Moreira and Camelier, 1977; Pedrosa-Soares et al., 1994; De Souza et al., 2015).
Minas Gerais owes most of its opulence to the Eastern Brazilian Pegmatite Province (EBPP) (Fig. 1), defined by Paiva (1946) and which mainly extends east of the São Francisco Craton in an orogenic unit called the Araçuaí Orogen (Fig. 1). The 150 000 km2 EBPP is therefore characterized by granitic rock formations dating from the late Neoproterozoic to the early Ordovician into which a series of pegmatites are inserted. These rocks are gathered into super-suites named G1, G2, G3, G4, and G5 on the basis of the relation between their establishment and the advancement of the orogeny. G1 includes the pre-collisional formations (630 to 585 Myr), G2 is syn-collisional (585 to 560 Myr), G3 is late- to post-collisional (545 to 520 Myr), and G4 and G5 are post-collisional (535 to 490 Myr) (Pedrosa-Soares et al., 2001a, 2009). The EBPP is itself subdivided into a series of pegmatitic districts, and the main ones are given in Fig. 1.
These pegmatite districts are where most of the gemstone production in Minas Gerais is concentrated. A wide variety of mineral species can be found in important quantities, like beryl, tourmaline, topaz, chrysoberyl, or quartz. In minor quantities, spodumene, amblygonite, brazilianite, or garnets are also represented as well as a multitude of other rarer minerals (Barreto and Bittar, 2010).
There are two types of pegmatites in these Eastern Brazilian Pegmatite Province districts: the anatectic ones which formed by partial melting of the parent rocks (DPA pegmatites, direct products of anatexis; Wise et al., 2022) and the residual ones that crystallized from the residual silicate melts left by the fractional crystallization of the parent granite (RMG pegmatites, residual melts of granite magmatism; Wise et al., 2022). Most of the pegmatites from the Araçuaí, the Ataléia, the Conselheiro Pena, the Espera Feliz, the Padre Paraíso, the Pedra Azul, and the São Jose de Safira districts (Fig. 1) are of RMG type. The Caratinga, Santa Maria de Itabira, and Espírito Santo districts (Fig. 1) are dominated by DPA pegmatites resulting from the partial melting of gneisses. Finally, some hydrothermal deposits from Malacacheta and Santa Maria de Itabira are gathered under the pegmatite term despite the fact that they are not pegmatites s.s. (Correia-Neves et al., 1986; Pedrosa-Soares et al., 2009).
Most of the DPA pegmatites formed during the collisional phase of the Araçuaí Orogen. They are usually associated with migmatites and granulites, and often they constitute corundum and beryl deposits (Correia-Neves et al., 1986; Morteani et al., 2000; Pedrosa-Soares et al., 2009). RMG pegmatites, more abundant in the EBPP, have as parent rocks the different syn- (G2) and post-collisional (G4, G5) granites. They can be called “intragranitic” if, as in the Araçuaí, the Ataléia, the Conselheiro Pena, and the São Jose de Safira districts, they are hosted inside the parent granite or “extragranitic” if they are surrounded by the host rocks, as in the Espera Feliz, the Padre Paraíso, and the Pedra Azul districts. Extragranitic pegmatites are usually considered better gemstone deposits than intragranitic pegmatites (Pedrosa-Soares et al., 2009).
The granitic super-suite G2 mainly encompasses peraluminous (Type S) and some metaluminous granites. Their setup followed the superposition of continental margins during the collisional phase of the Araçuaí Orogen. This superposition led to a thickening of the crust followed by a rise in the temperature conditions at the origin of the production of huge quantities of magmas. Two types of granites were generated: a superficial two-mica granite and a deep granite hosting biotites and garnets. The first of these granites, despite being less abundant than the later one, was favourable to the production of pegmatites like those of Conselheiro Pena. In the meantime, a migmatization of the paragneiss complexes is at the origin of the genesis of pegmatites in the Caratinga, Espirito Santo, and Santa Maria de Itabira districts (Pedrosa-Soares et al., 2009).
The granitic super-suite G4 consists of a series of balloon-shaped plutons with zonations ranging from granites with biotites in the core to muscovite-bearing granites towards the rim. These plutons are capped with pegmatoidic domes. The peraluminous (Type S) granites, sometimes slightly metaluminous, appeared during the post-collisional phase of the Araçuaí Orogen. Several pegmatites from the Araçuaí, São Jose da Safira, and Malacacheta districts derive from these plutons (Pedrosa-Soares et al., 1987; Basílio et al., 2000; Pinto et al., 2001; Pedrosa-Soares et al., 2009).
The granitic super-suite G5 is characterized by granitic, charnockitic, or dioritic balloon-shaped intrusions located at depth (25 km). These plutons, which were established during the post-orogenic phase, are the source of residual pegmatites in the Ataléia, Espera Feliz, Padre Paraíso, Pedra Azul, and Espírito Santo districts (Fig. 1). These pegmatites are usually enriched in biotites but poor in lithium minerals. They form veins of a few metres thick inside the granites and the charnockites (Gandini et al., 2001; Ferreira et al., 2005; Pedrosa-Soares et al., 2009).
Table 1Description of the studied samples and their occurrence.
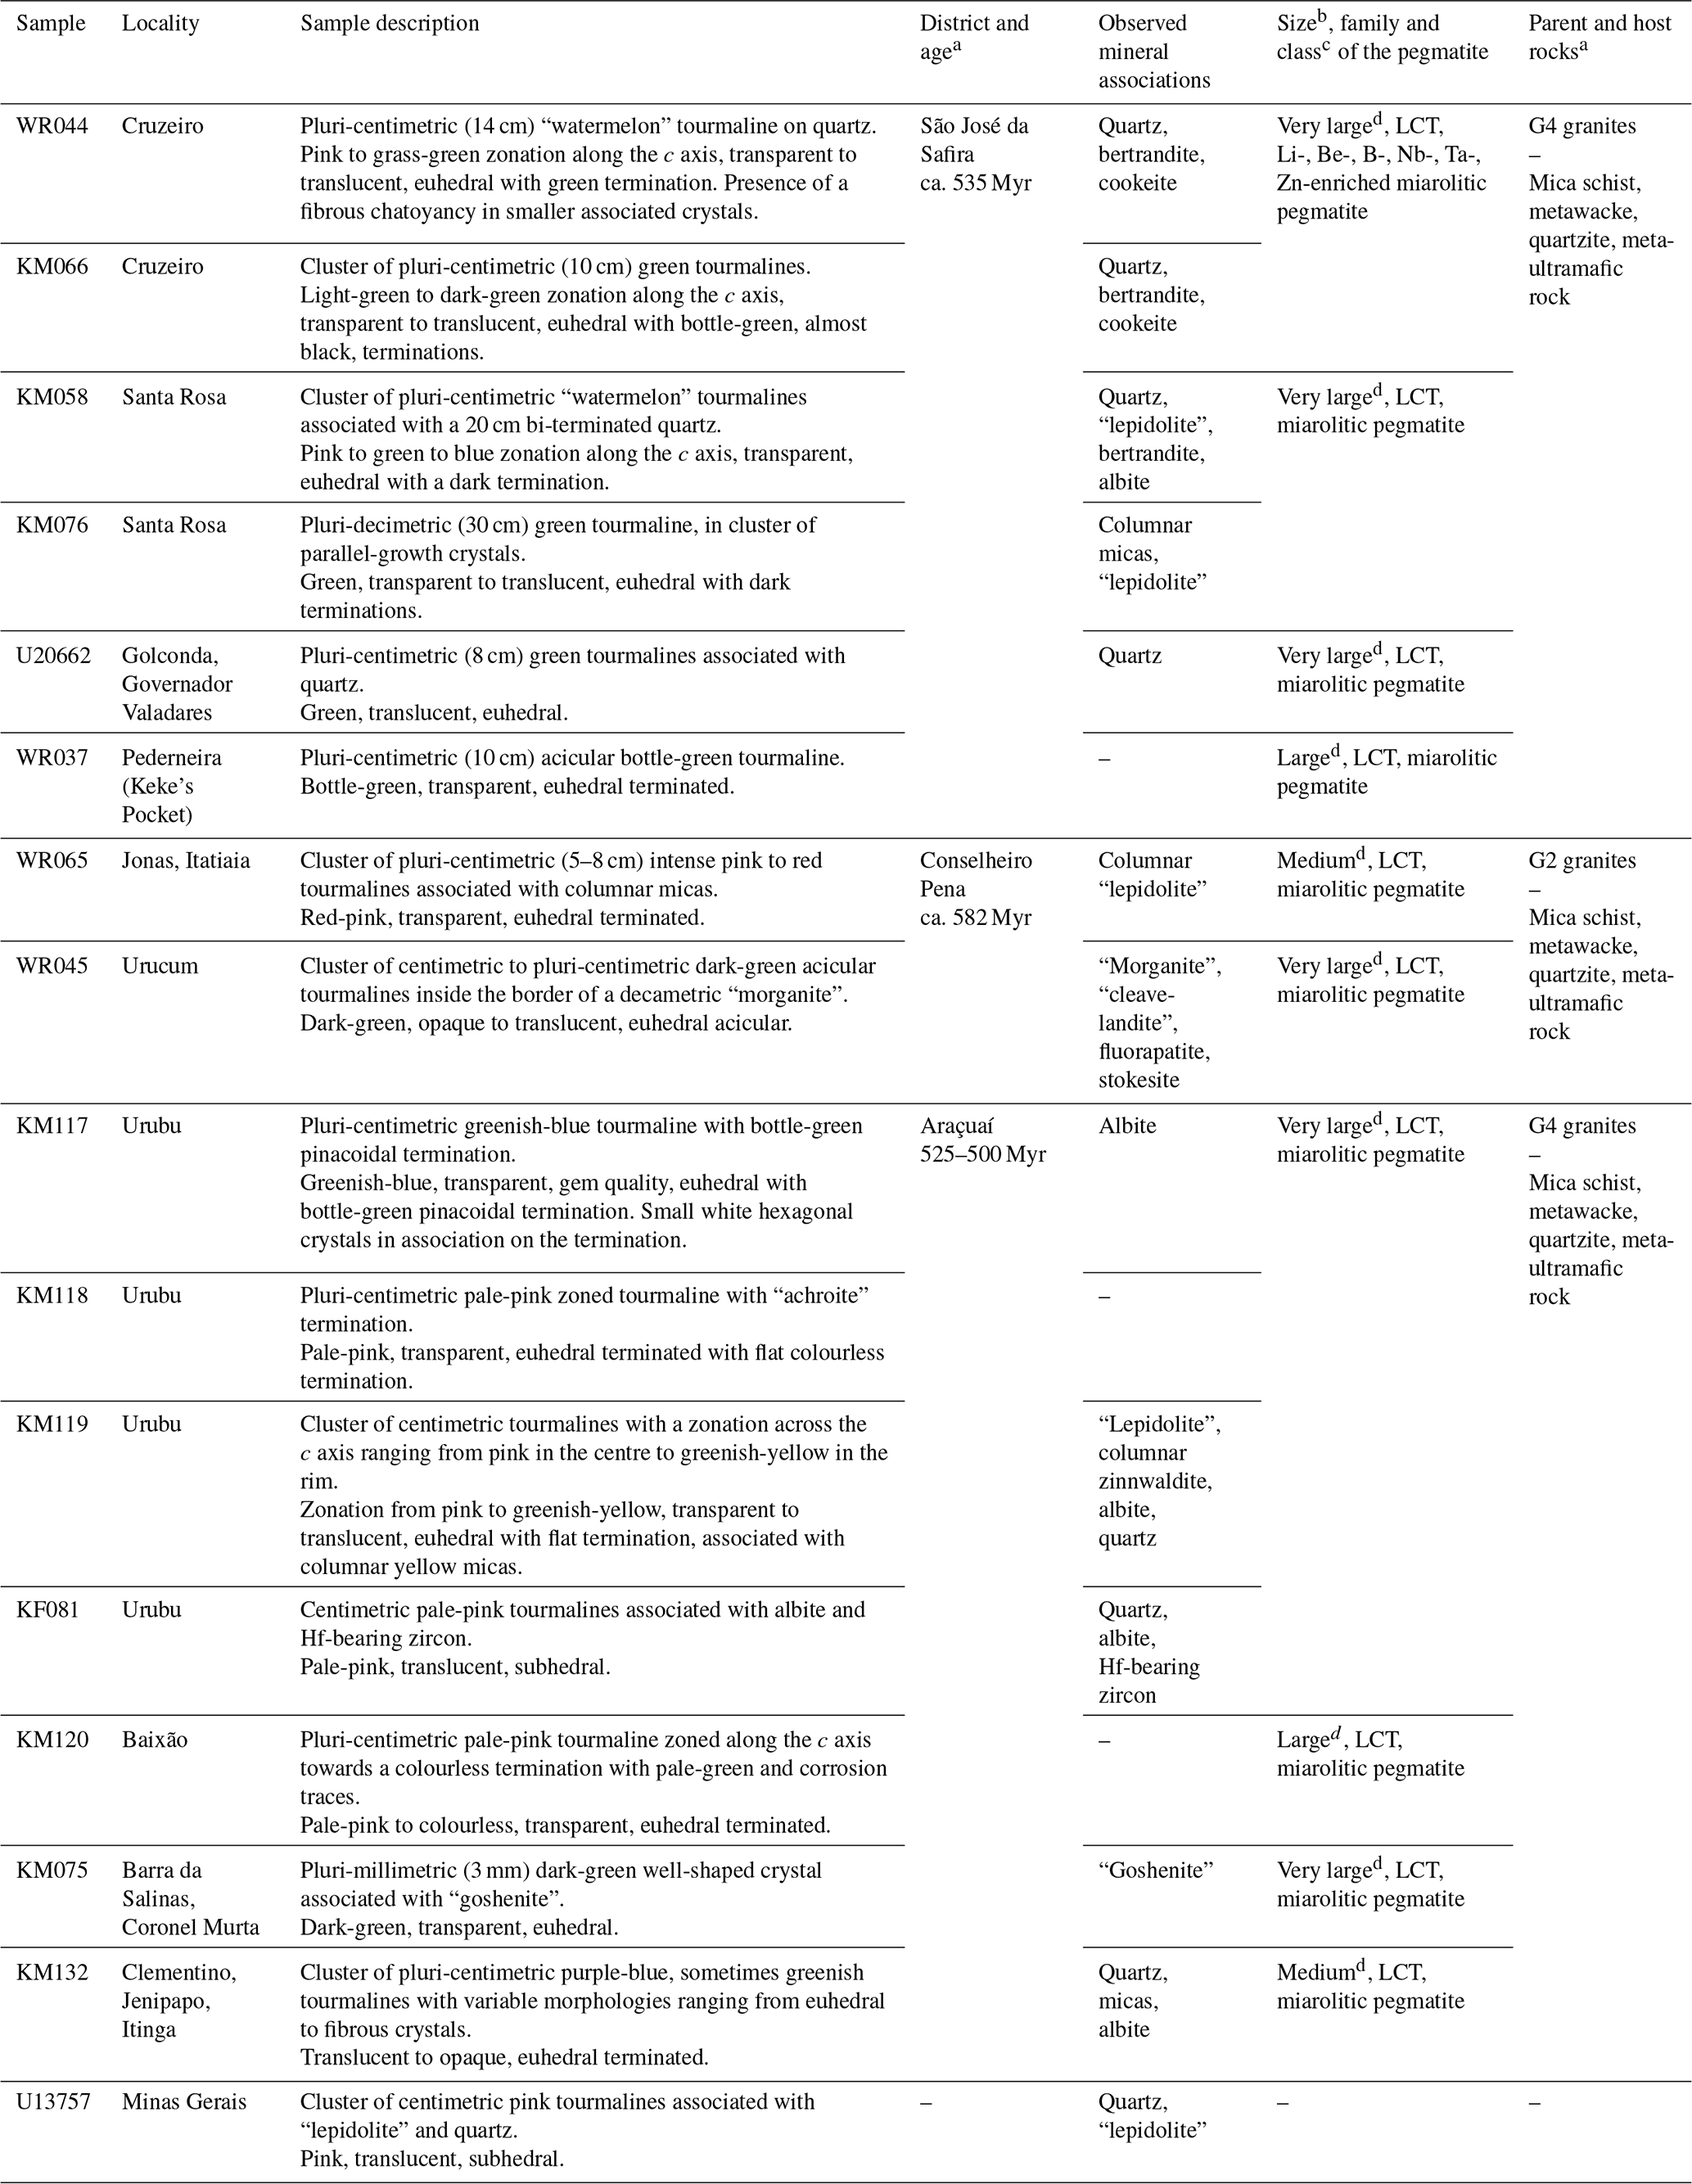
a Pedrosa-Soares et al. (2009). b Pegmatite size is defined according to its thickness: very small <0.5 m, small 0.5 to 5 m, medium 5 to 15 m, large 15 to 50 m, and very large >50 m. c Cerný and Ercit (2005). d Cassedanne and Philippo (2015).
Samples were selected in the collections of the Laboratory of Mineralogy, University of Liège (prefix “U” in the sample number), and of the Natural History Museum of Luxembourg (prefixes “WR”, “KM”, and “KF”). Selected tourmalines are constituted by single crystals carefully extracted from larger collection pieces. They were chosen on the basis of their quality, their colour, and their occurrence. Their respective origins, which are known with variable degrees of precision, as well as their macroscopic descriptions and the associated mineral assemblages, are detailed in Table 1. Accurate localization of most pegmatites can be found in Cassedanne and Philippo (2015). A preliminary optical description has been conducted for each sample under a binocular microscope coupled with a microscope-adapted numerical camera for capturing images. Magnifications used vary between 6× and 9×, depending on the sample. Results are gathered in Table 1 and Fig. 2.
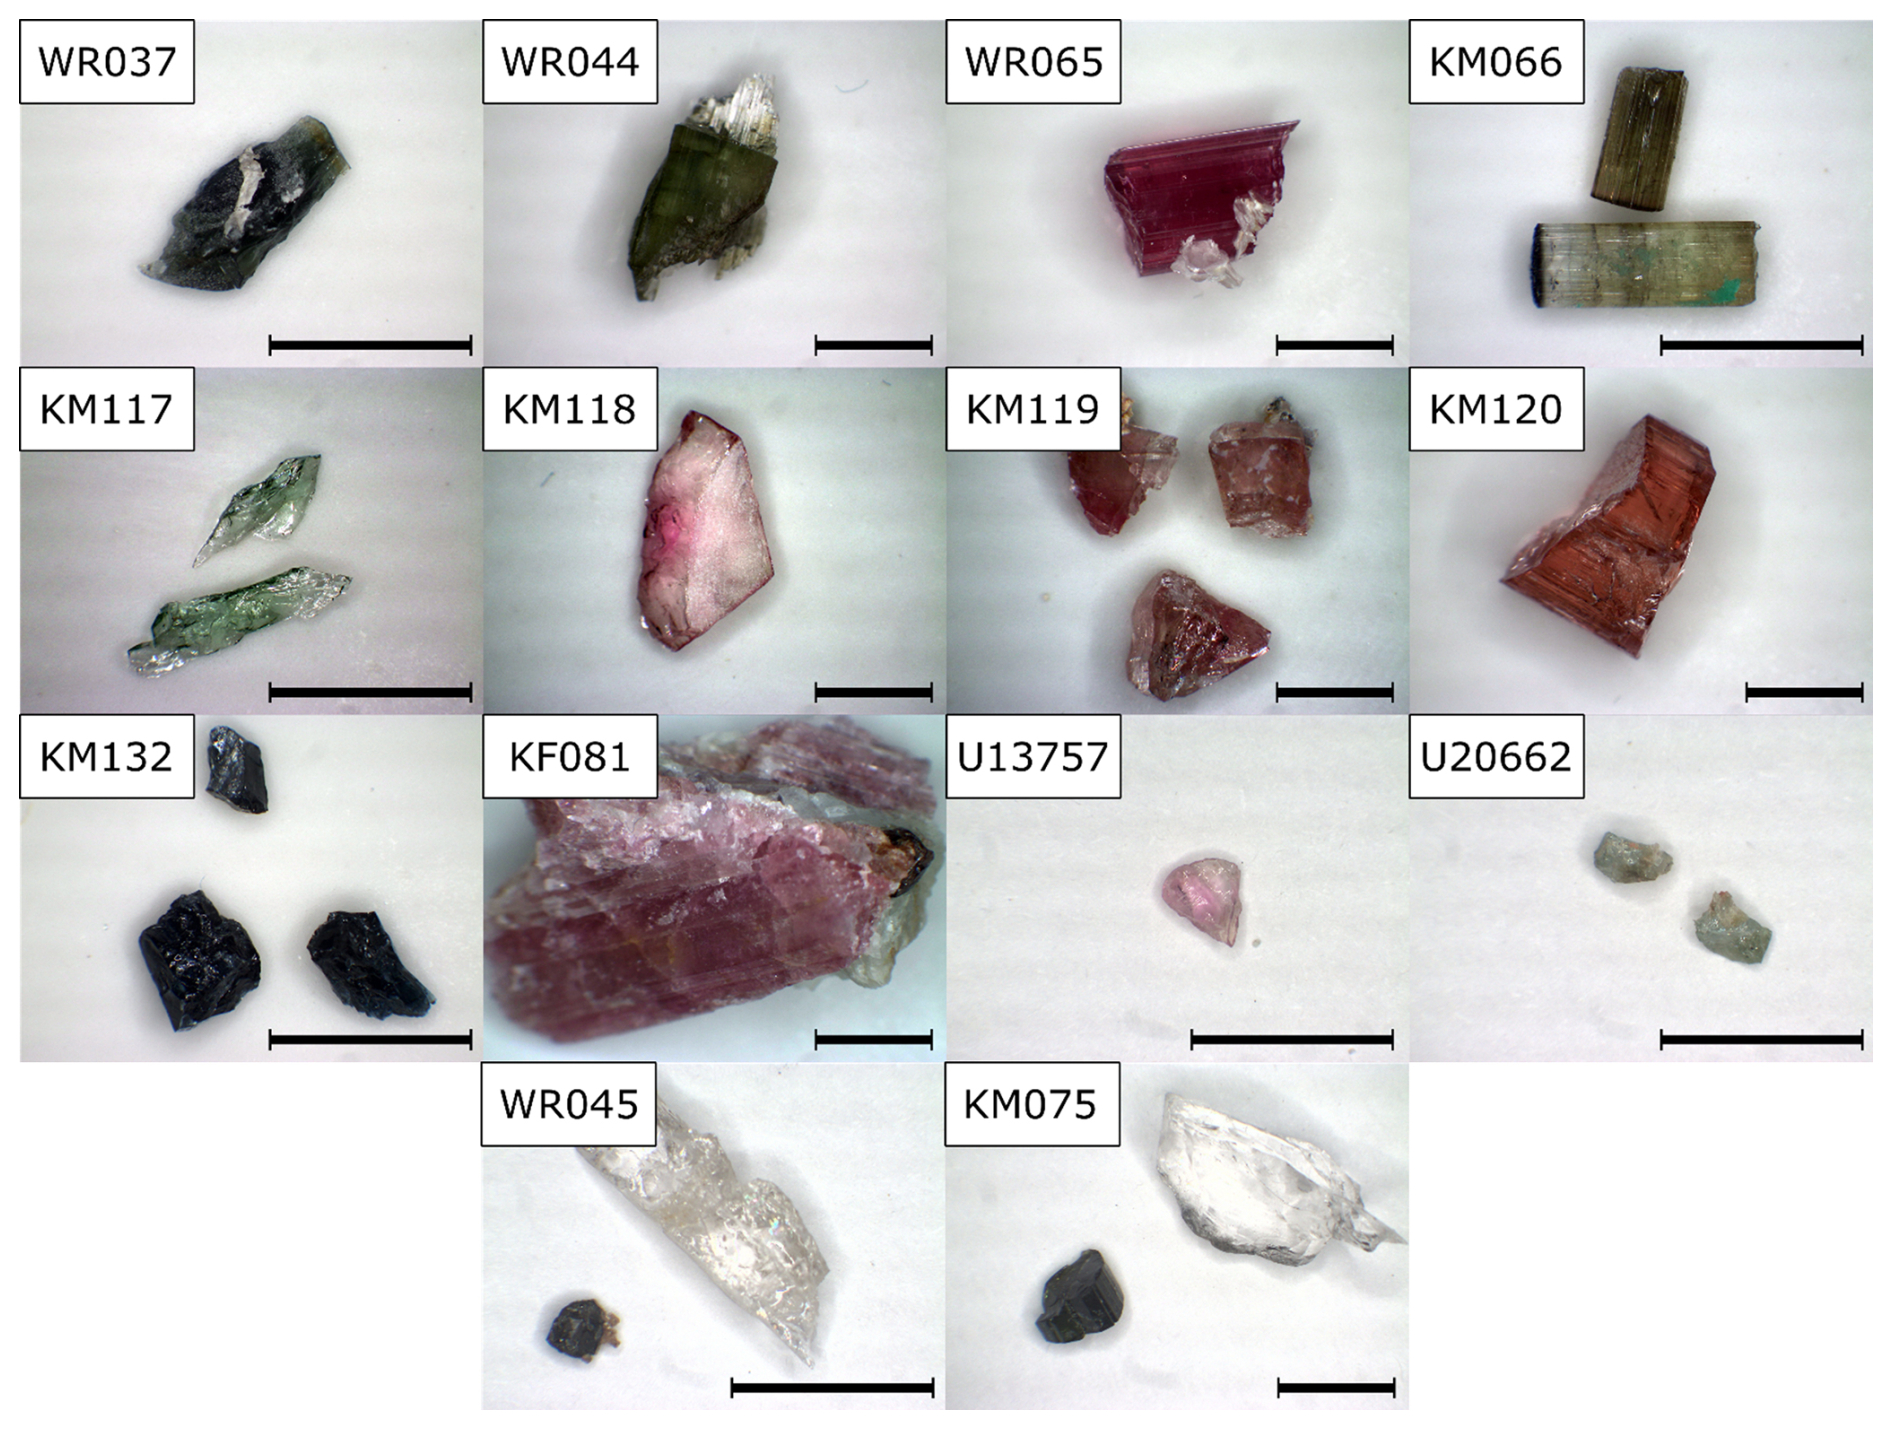
Figure 2Photographs of the investigated tourmaline samples, under the binocular lens. The scale bar is 5 mm on each picture.
Tourmaline fragments of about 2 to 3 mm in diameter were then handpicked, sealed in epoxy resin, and polished to perform electron-microprobe analysis (EMPA) at the Geosciences Department of Oslo University. The instrument used was a CAMECA SX100 electron microprobe, working under an acceleration voltage of 15 kV, a beam current of 15 nA, and a beam diameter from 5 to 10 µm and equipped with five WDS (wavelength-dispersive X-ray spectroscopy) spectrometers with the following diffracting crystals: PET (pentaerythritol), LPET (pentaerythritol – large crystal), TAP (thallium acid phthalate), LTAP (thallium acid phthalate – large crystal), and LLIF (lithium fluoride – large crystal). Standards used for the calibration were wollastonite (Si, Ca), pyrophanite (Ti, Mn), orthoclase (K), albite (Na), fluorite (F), and a series of synthetic standards – Al2O3, MgO, and Fe. All analytic lines were Kα, and detection limits were 2000 ppm (F), 615 ppm (Fe, Mn), 400 ppm (Ca), 335 ppm (Na, Si, Al), 265 ppm (Mg, Ti), and 235 ppm (K). Five measurements were performed on each sample, and their average value was used during data treatment.
Since boron and lithium are not determined by the EMP analyses, they were analysed by LA-ICP-TOF-MS (see below). In order to verify the reliability of these values, they were compared to the B2O3 concentrations calculated by considering an ideal value of three atoms per formula unit (apfu) on the B site and to the Li2O concentrations necessary to fill the 3 apfu on the Y site. The populations of the different crystallographic sites were calculated on the basis of 15 cations (Table 2) based on the method developed by Henry et al. (2011). The totals on the X site did not reach the ideal value, which can be explained by the presence of vacancies in the crystal structure. The H2O levels were calculated assuming that the V site was filled by 3 OH groups pfu and that the W site was occupied by 1 (OH,F,O) anion pfu. Considering that iron is mostly divalent (except in sample KM132), the OH content was calculated as 62 − total cationic charges − F, taking into account the positive charges corresponding to the ideal boron content.
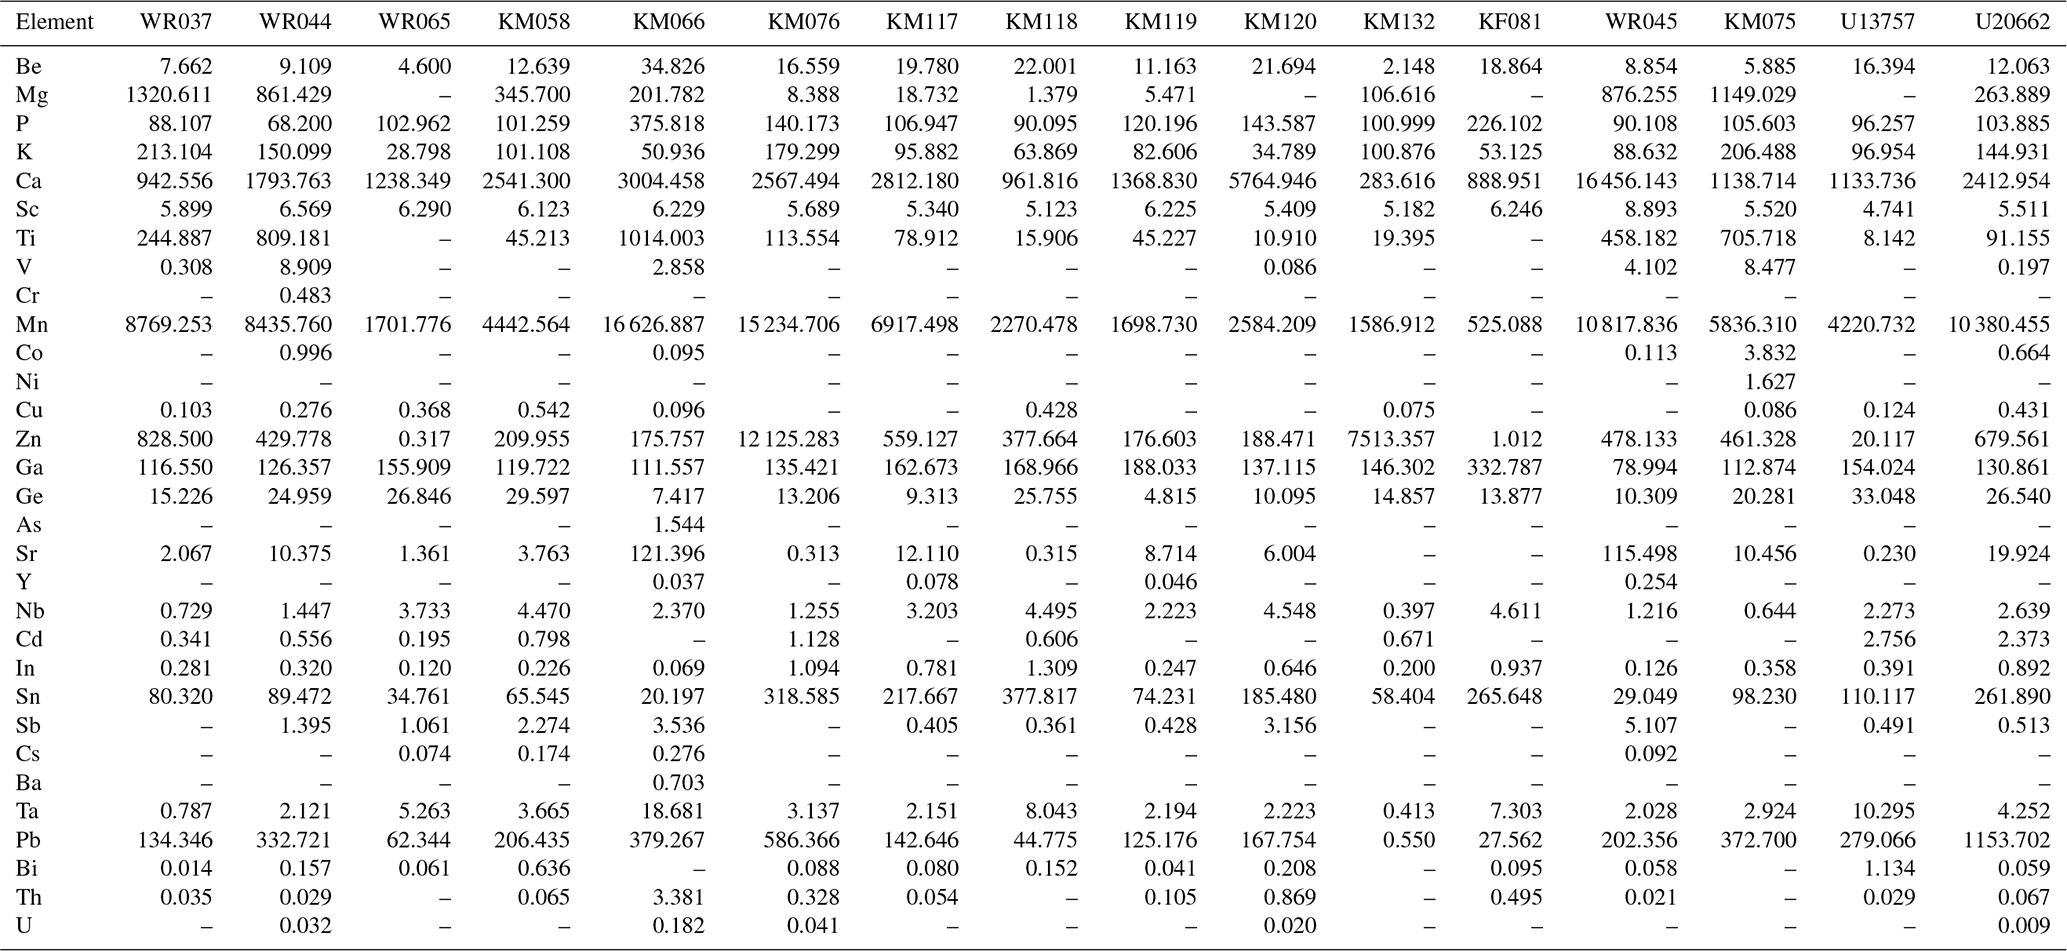
Table 2Chemical compositions of tourmalines samples from Minas Gerais, Brazil (from EMPA and GemTOF analyses).
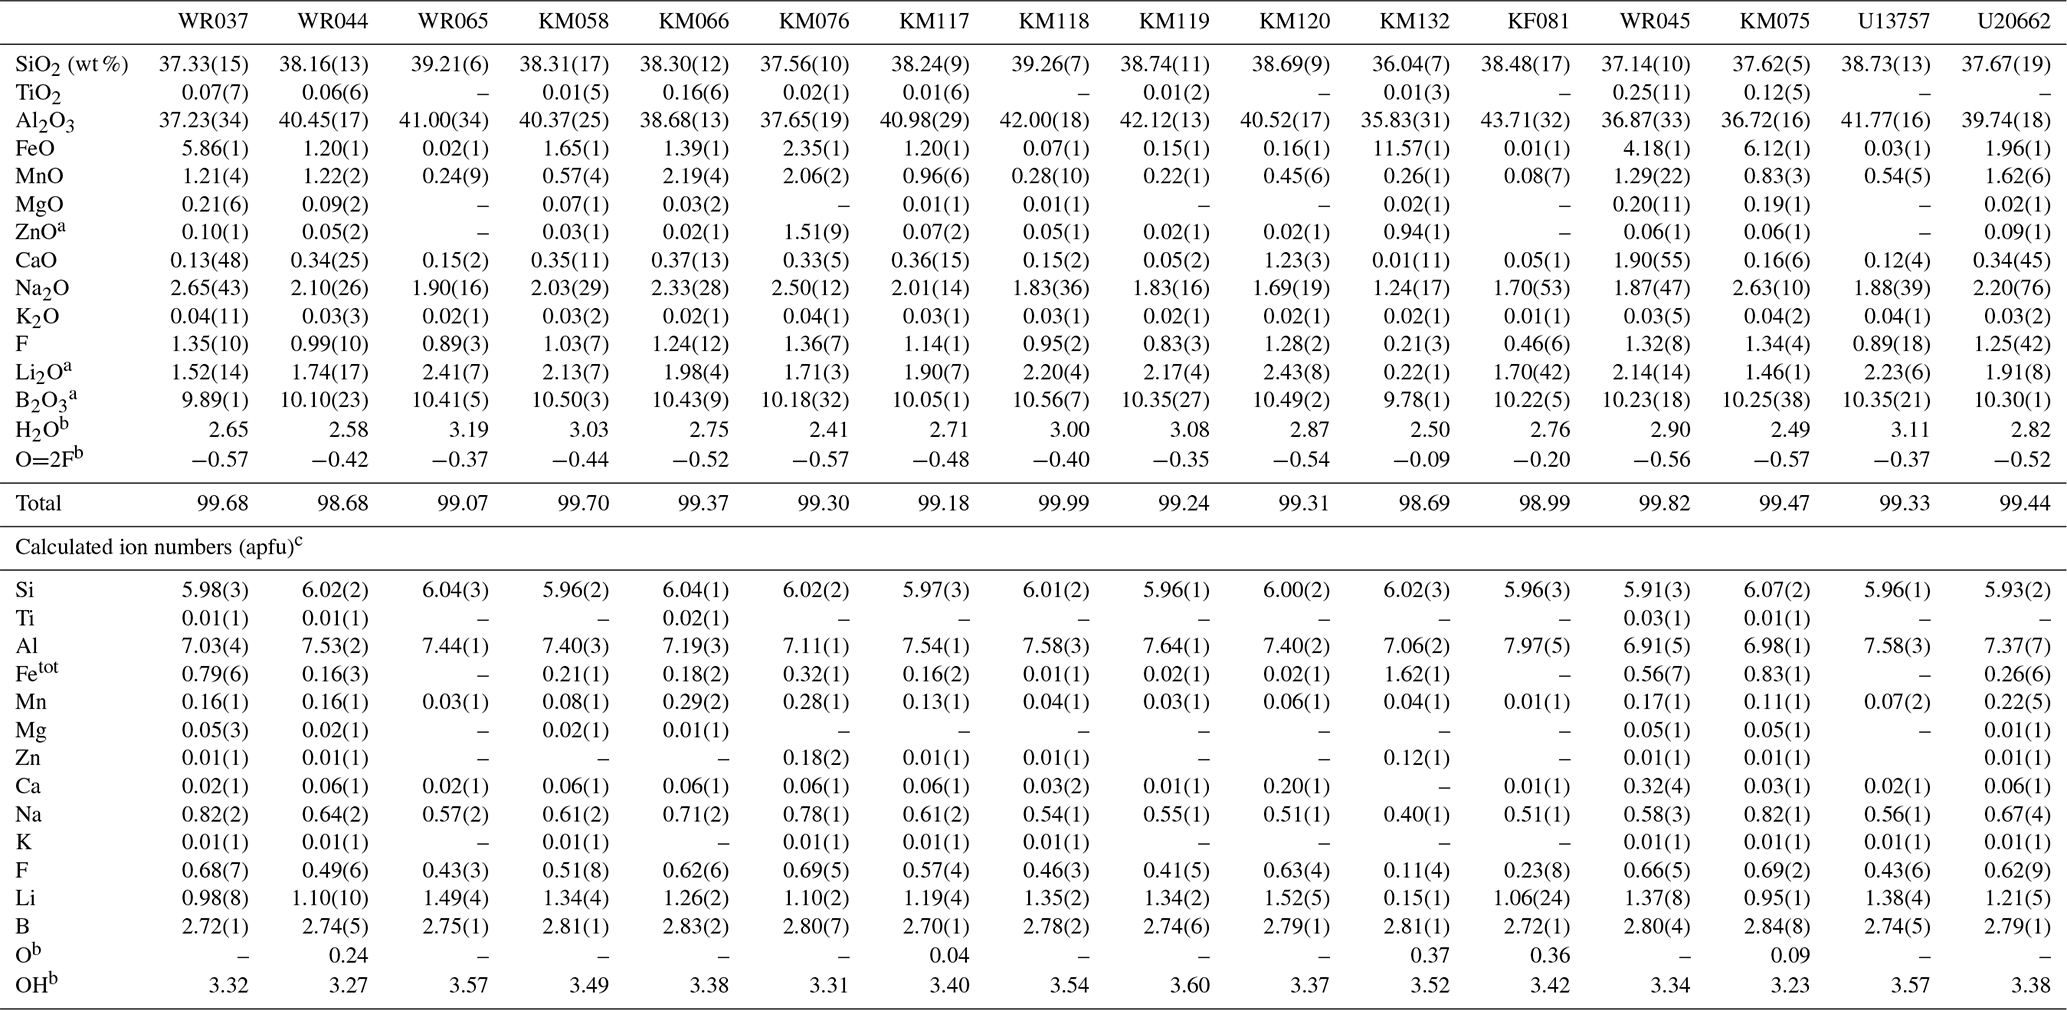
Notes: uncertainties for oxides are standard deviations (in brackets) of repeated analyses on individual crystals. Standard deviations for the ions were calculated by error propagation. a Values measured by GemTOF. b Values calculated in order to maintain the charge balance. c Ion numbers were calculated on the basis of 15 cations ().
The polished sections used for EMP analyses were sent to the Swiss Gemmological Institute SSEF of Basel to quantify trace elements. A LA-ICP-TOF-MS instrument, also nicknamed GemTOF, has been used for this purpose. It includes an ArF excimer laser of 193 nm equipped with a TWoVol2 ablation chamber (NWR193UC, Elemental Scientific Lasers, USA). The laser is coupled with a commercial ICP-TOF-MS unit (icpTOF, Tofwerk AG, Switzerland), modified from an ICP-Q-MS (Q denotes quadrupole) optimized unit (iCAP Q, Thermo Fisher Scientific). The ICP power ranges from 1300 to 1350 W, and the instrument is able to measure a complete mass spectrum from 7Li+ to 238U+, thus allowing the determination of all elements of the periodic table, except hydrogen and elements heavier than uranium. Measurements have been conducted under the following analytic conditions: two points have been measured in each fragment, and the average value of the two measurements will be used in the discussion below. Each point underwent laser ablation of 50 µm in diameter with a repetition rate of 20 Hz and a fluence of 5.6 J cm−2. Helium has been used as carrier gas (0.8 to 0.85 L min−1). Five pre-ablation cleaning shots were realized before each measurement (30 s of background measurement, 30 s of ablation). Every element between lithium and uranium was measured simultaneously. The quantification was realized with a MATLAB script developed at the SSEF (Wang and Krzemnicki, 2021). NIST610 and NIST612 glasses were used as standards and underwent 75 µm laser ablation in the same conditions as previously described. Data obtained through LA-ICP-TOF-MS analyses, concerning trace elements and rare earth element (REE) concentrations in tourmalines from Minas Gerais, are given in Tables 3 and 4, respectively. Elements with concentrations below the detection limit in all samples are not included in the table for ease of reading.
Table 3Average trace-element concentrations (except REEs) in tourmalines from Minas Gerais, measured by GemTOF (PPM).
Values below detection limits have been removed.
Table 4Average REE concentrations in tourmalines from Minas Gerais, measured by GemTOF (PPM).
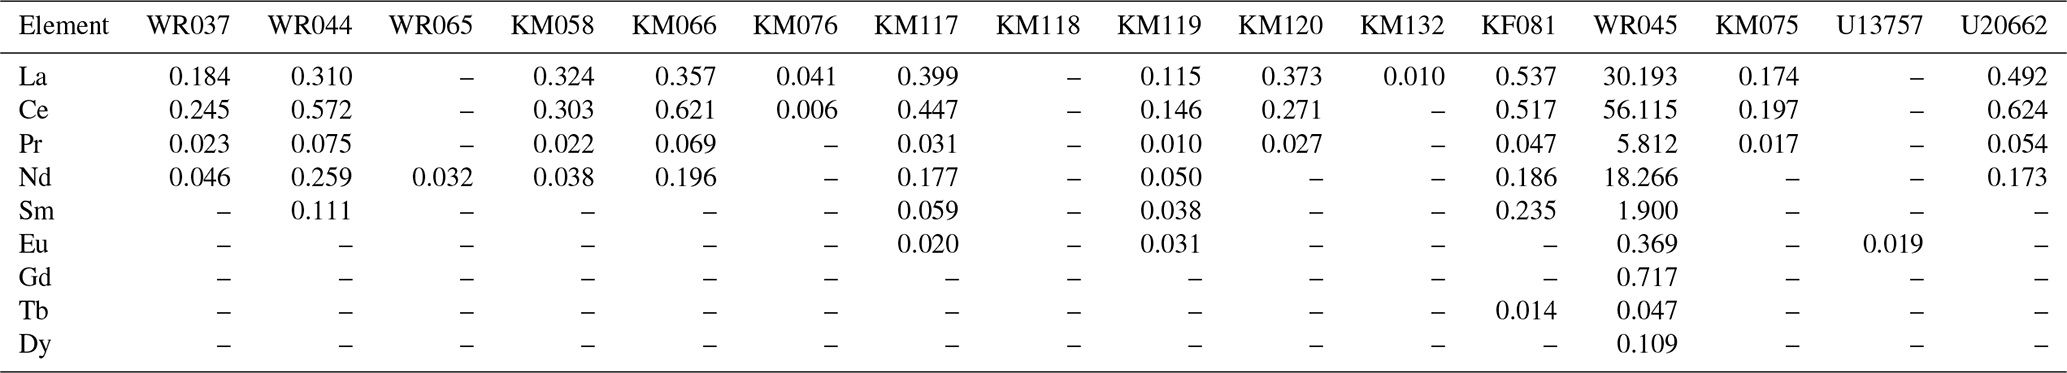
Values below detection limits have been removed. Contents of Ho, Er, Tm, Yb, and Lu are below the detection limit.
The samples finally underwent structural analyses by single-crystal X-ray diffraction methods. Fragments were carefully handpicked for each tourmaline and were then glued on a glass capillary using a transparent polish. The whole mounting was introduced in a Rigaku Xcalibur 4-circle diffractometer using a kappa geometry, a CCD (charge-coupled device) EOS detector, and MoKα (λ=0.7107 Å) radiation. Several pre-experiments were sometimes necessary to choose the best single crystal. Data reduction was performed with the RED program (Oxford diffraction, 2007) by subtracting the background from the raw intensities and correcting the Lorentz and polarization factors, as well as the absorption. Structure refinements were achieved with the OLEX2 suite of programs, which uses SHELXS to solve the structure (direct methods) and then SHELXL to refine the model (Sheldrick, 2015). The VESTA program was finally used to obtain a drawing of the three-dimensional structural models. The KM058 tourmaline sample was zoned from the core (pink) to the rim (green), and an analysis was conducted for each zone. Selected fragments were named KM058_R and KM058_V, respectively. More details concerning data collection and crystal structure refinements are given in Table 5.
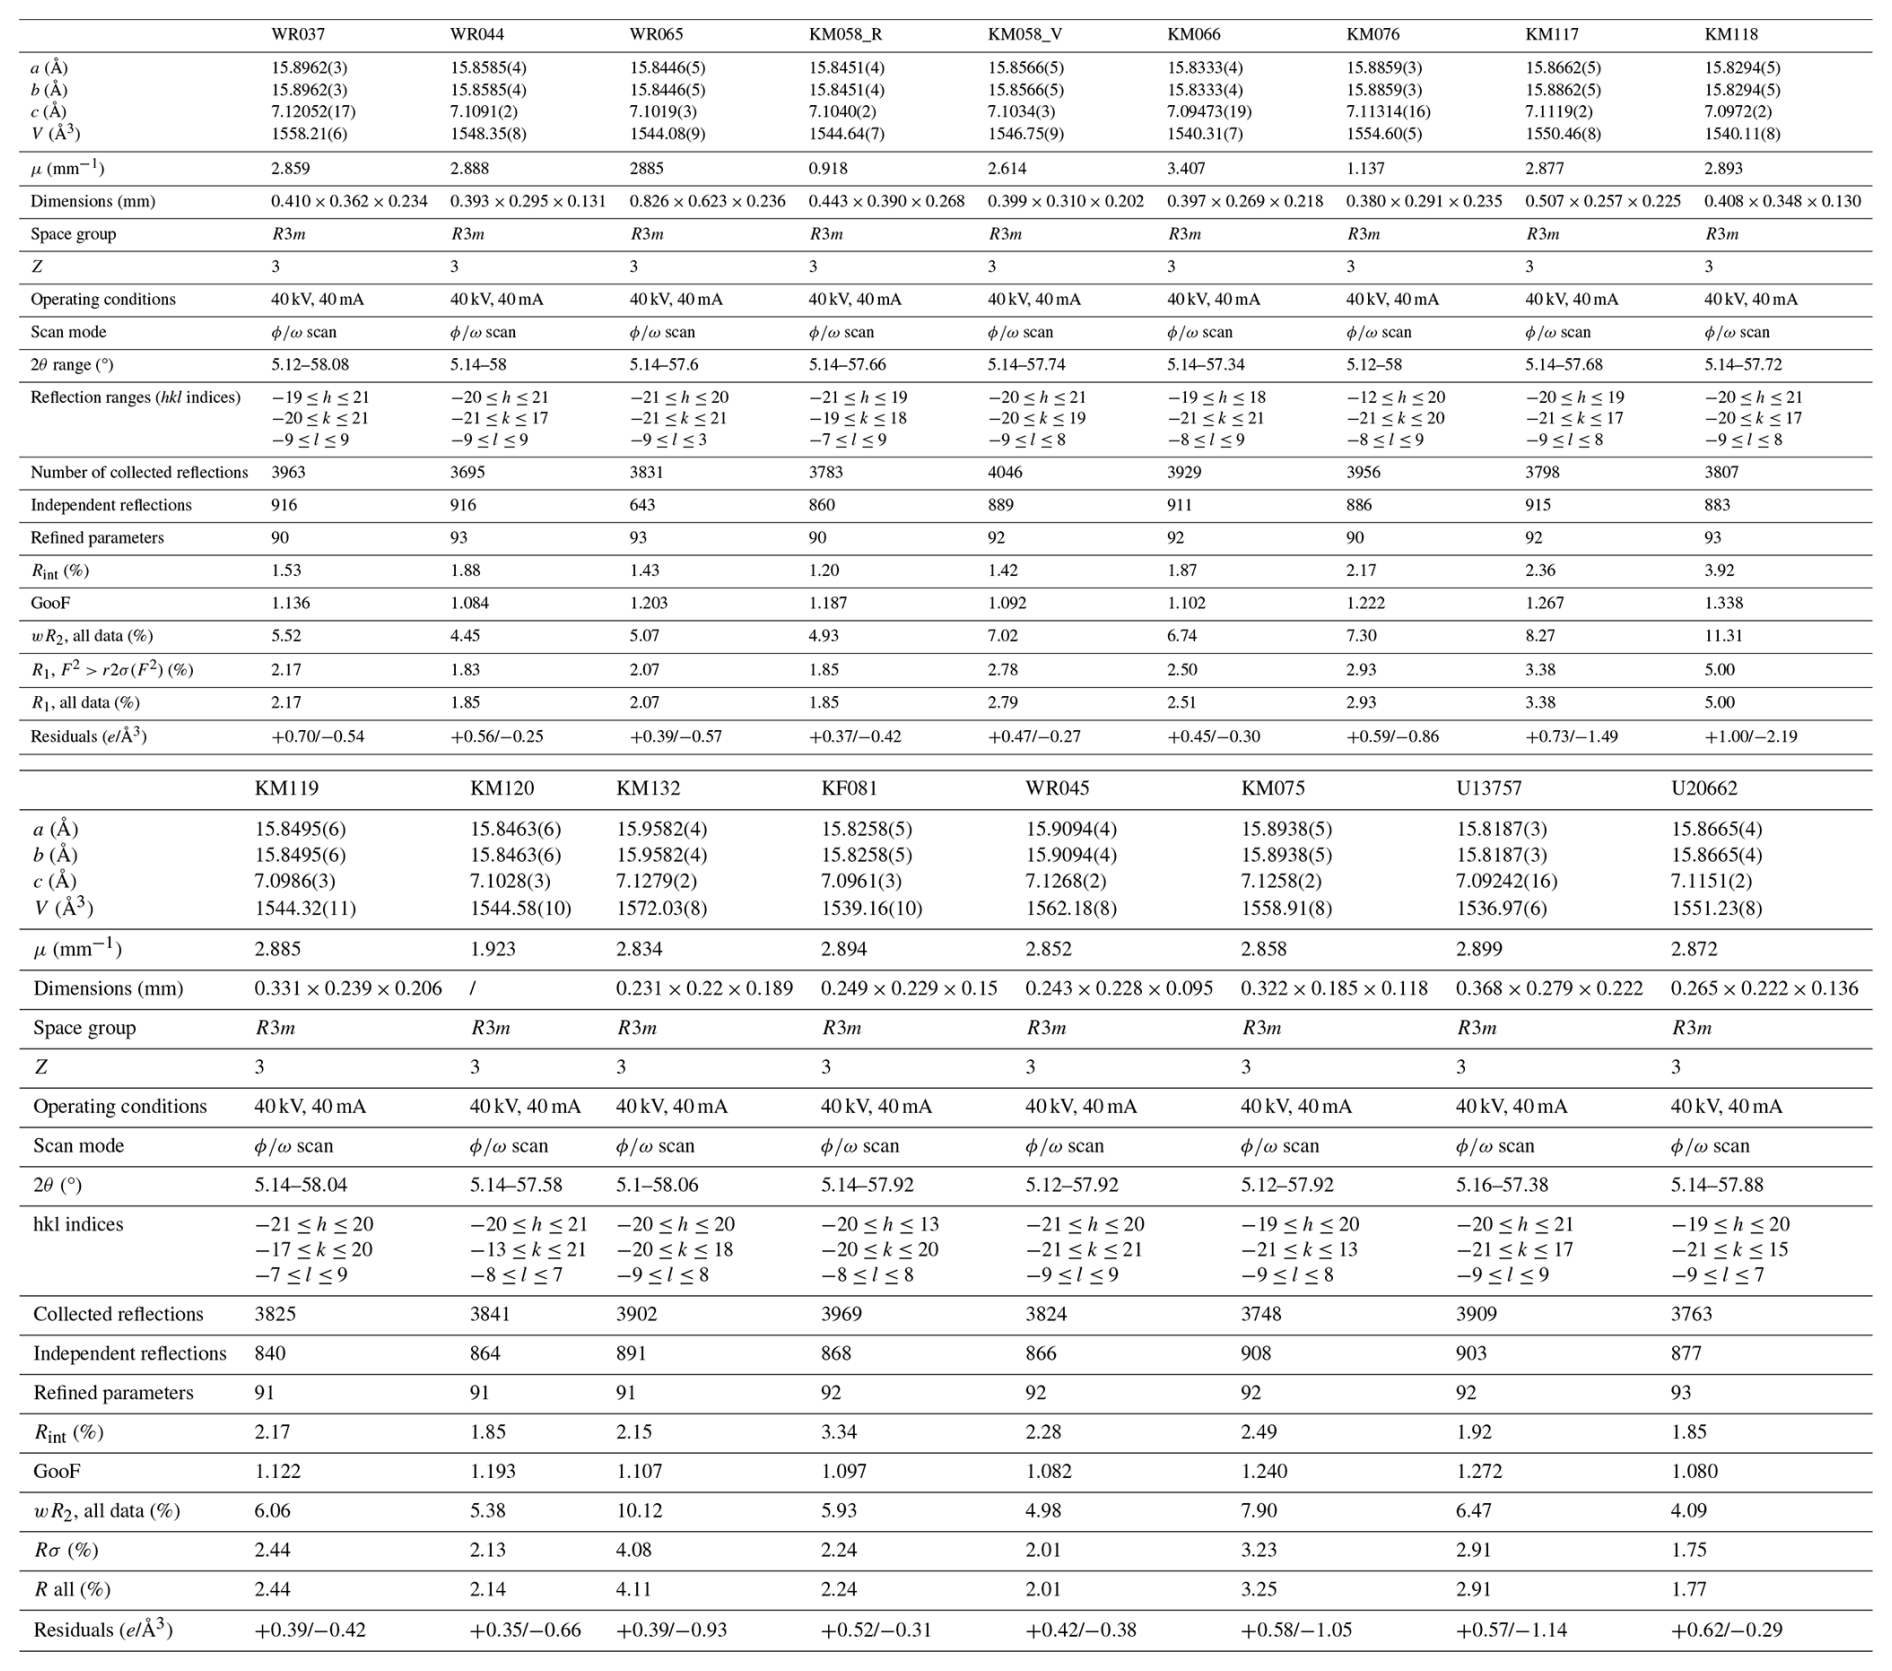
Table 5Data collection for the single-crystal X-ray diffraction measurements, and structure refinement details. GooF denotes goodness of fit.
Average major-element compositions for the tourmaline samples, calculated from the electron-microprobe and LA-ICP-TOF-MS analyses, are shown in Table 2. The totals reach values close to 100 wt % (98.68 wt % to 99.99 wt %), which attests to the reliability of the calculation method. The major-element compositions (Table 2) are very close to those usually given in the literature for tourmalines from the Eastern Brazilian Pegmatite Province (Bilal et al., 1998; Federico et al., 1998; Bosi and Lucchesi, 2004; Bosi et al., 2005; Andreozzi et al., 2025).
Table 6Final assigned site populations for the tourmalines from Minas Gerais, Brazil.
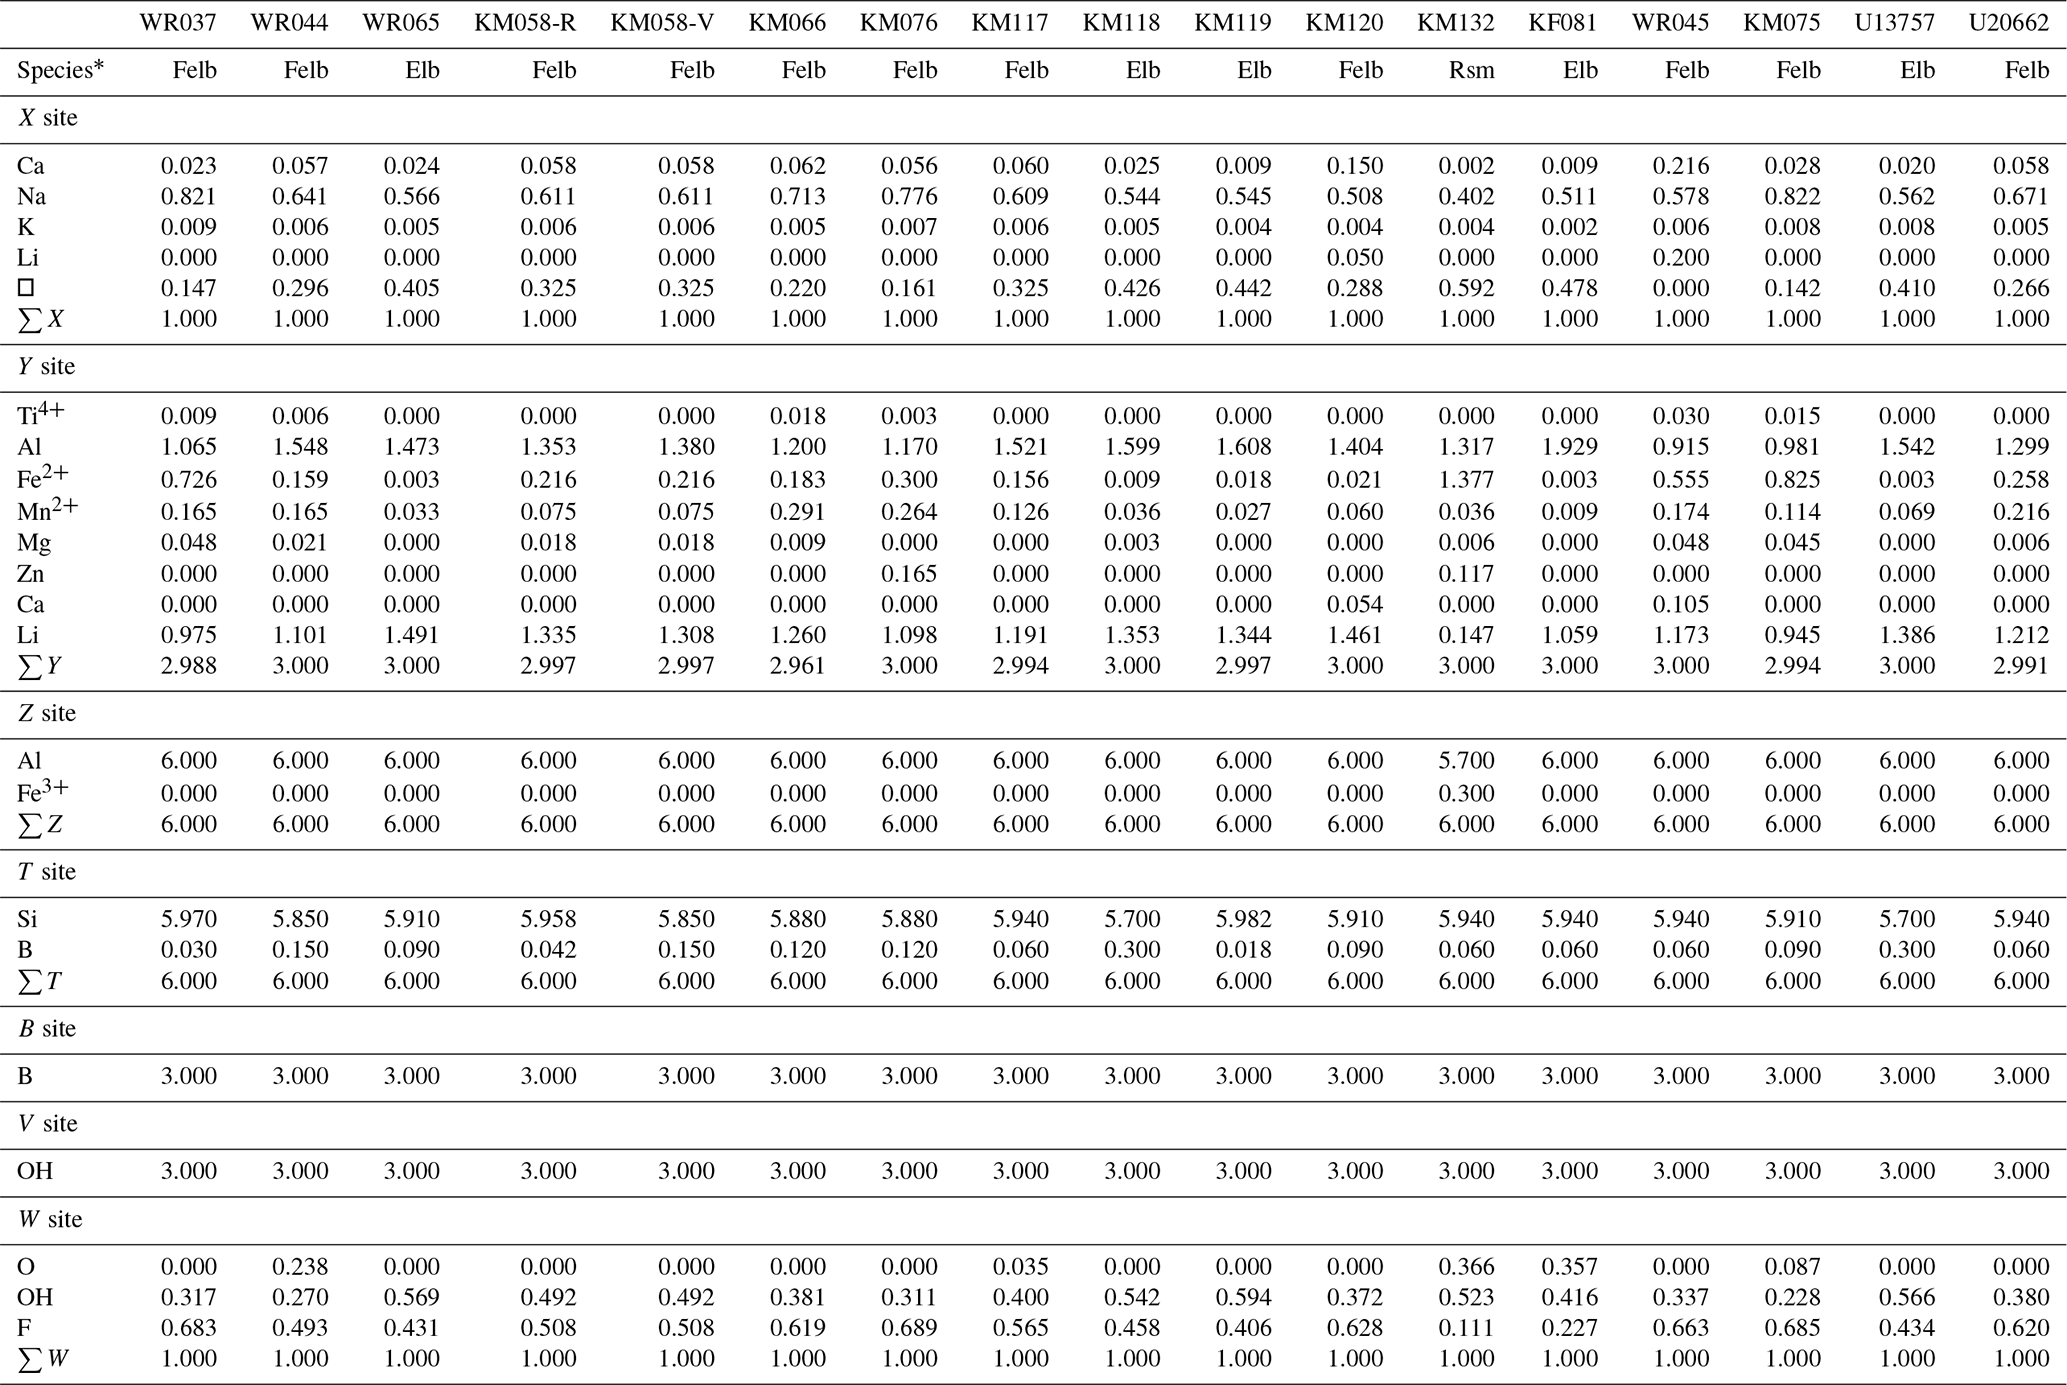
∗ Mineral symbols according to Warr (2021).
In order to accurately determine the cation populations on each crystallographic site of the tourmaline samples, cations were distributed among those sites in order to reach the best fits between several structural (see below) and chemical parameters: the calculated site scattering (CSS) and the refined site scattering (RSS) values, the mean bond lengths (MBLs) and the calculated bond lengths (CBLs), the bond-valence sums (BVSs), and the theoretical valence (TV). The results of these distributions are shown in Table 6, and generally, the good agreement between those parameters confirms the validity of the assigned site populations (Table S1 in the Supplement). The B site is fully occupied by boron, the T site is mainly occupied by Si and sometimes by minor amounts of B, and the Z site is mainly occupied by Al with sometimes minor amounts of Fe3+ (sample KM132). The X site contains vacancies, Na, K, and Ca, and the Y site is occupied by Li, Al, Fe2+, and minor amounts of Mn2+, Ti, Mg, and Zn. In the two samples KM120 and WR045, a significant disorder between Li and Ca on the X and Y sites has been observed, necessary to reach a good fit between the RSS and the CSS values (Table S1).
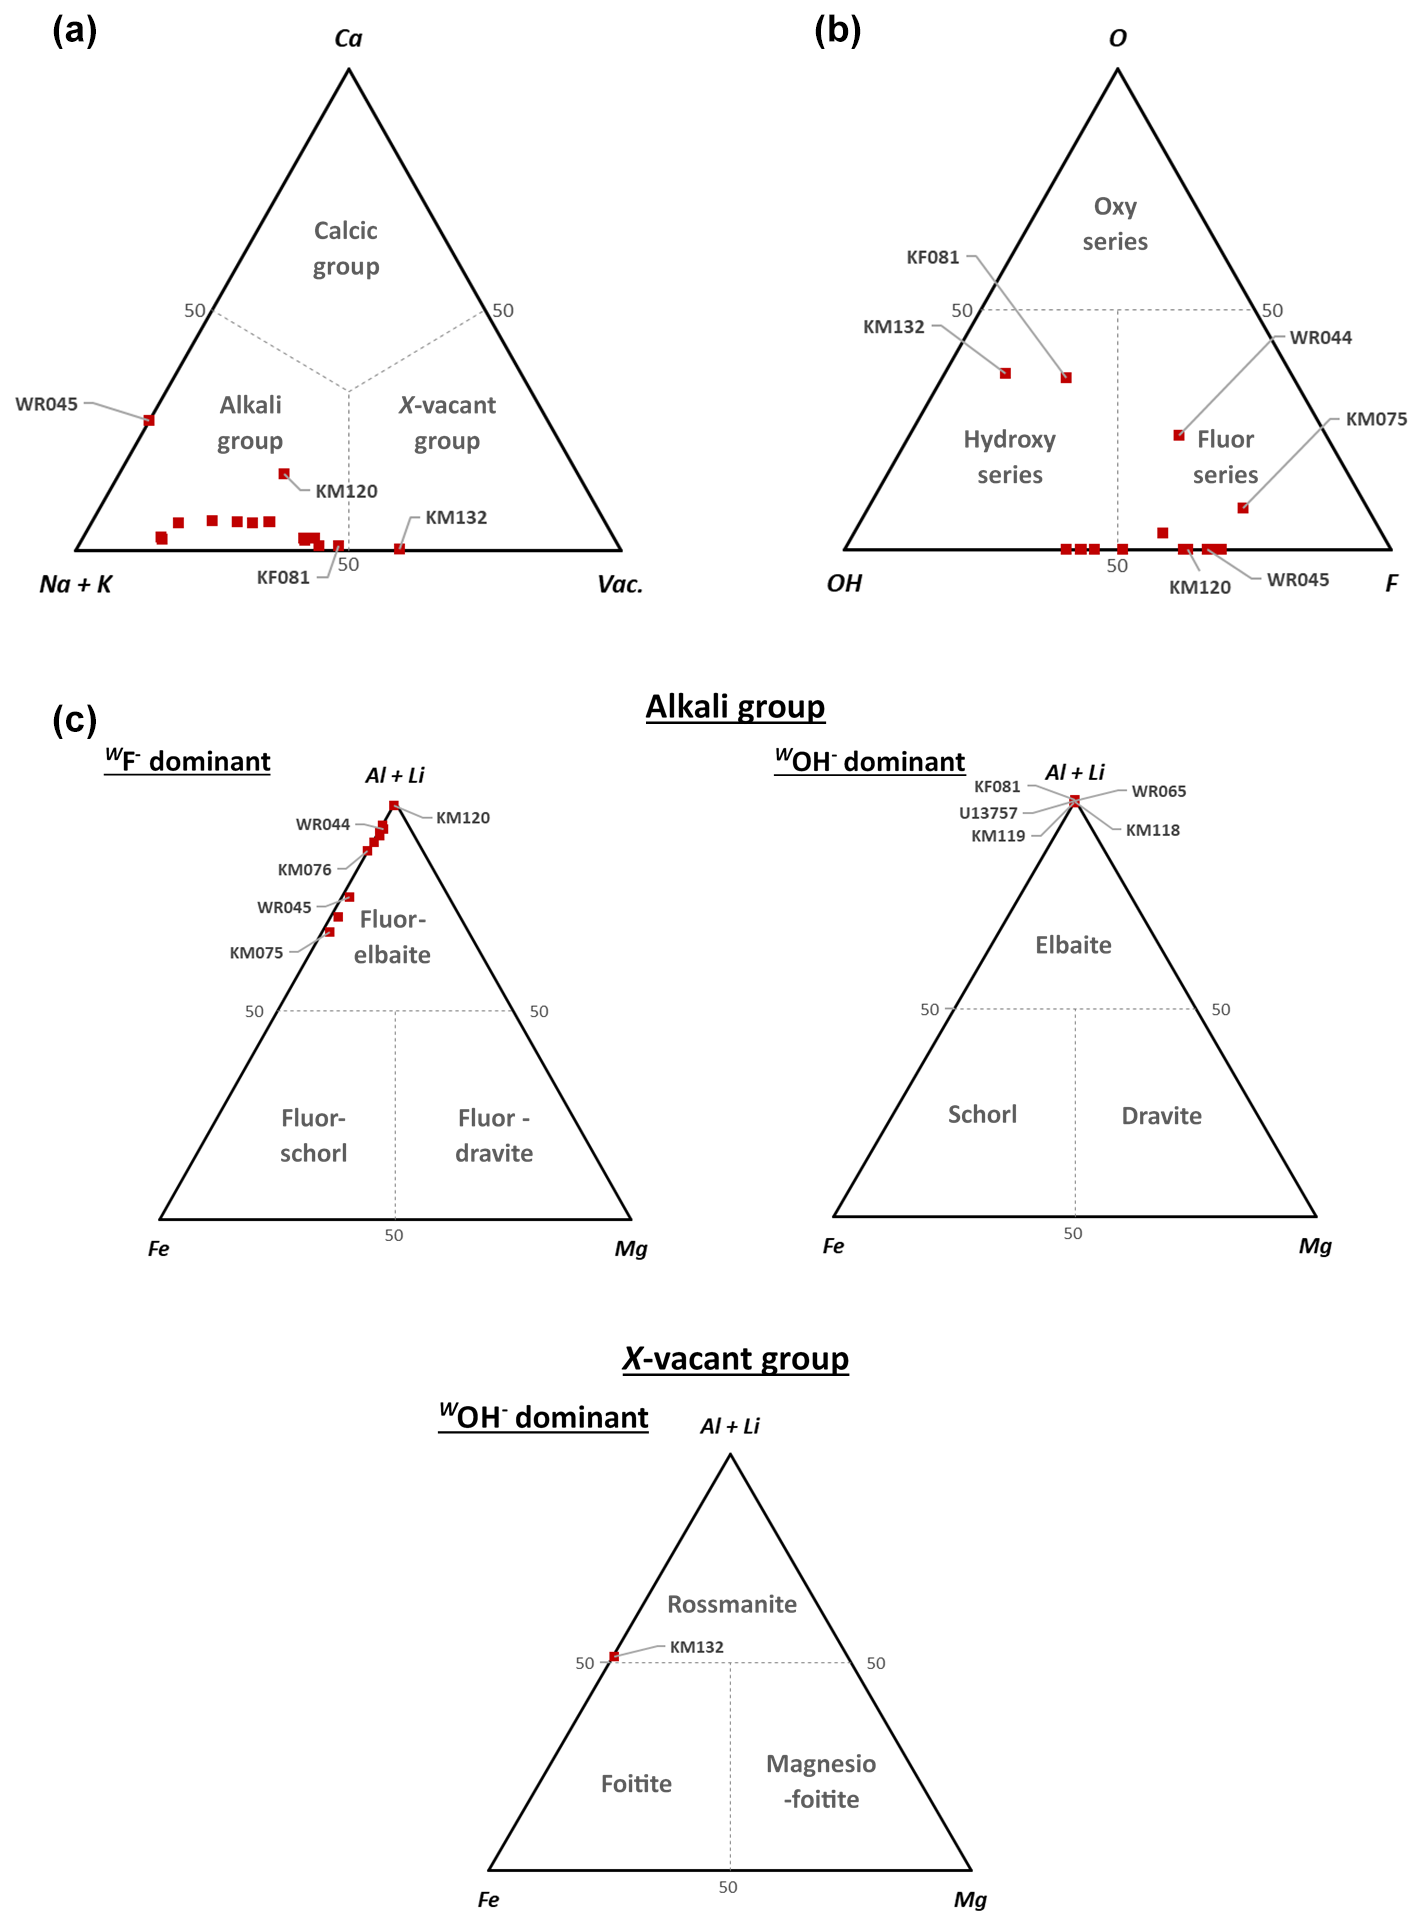
Figure 3(a) Classification of tourmaline samples of this study into the different groups, based on their dominant occupancy at the X sites (Henry et al., 2011). (b) Classification of tourmaline analyses in the different series, based on the anion occupancy of the W sites (Henry et al., 2011). (c) Ternary Al Li+–Mg2+–Fe2+ diagrams showing the Y-site occupancy of the tourmaline samples, used to determine the species in the alkali and X-vacant groups (Henry et al., 2011).
Occupancies of the X crystallographic sites (Table 6) show that they are dominated by large amounts of Na in almost every sample. These crystals therefore belong to the alkali group (Fig. 3a) defined by the new classification of tourmalines developed by Hawthorne and Henry (1999) and reviewed by Henry et al. (2011). These results are coherent with those obtained by Bosi and Lucchesi (2004), Bosi et al. (2005), and Andreozzi et al. (2025) on tourmalines from the Cruzeiro mine. In most of our samples, significant numbers of vacancies occur on the X site, leading to an alignment of the compositions along the solid solution between the alkali and the X-vacant group (Fig. 3a). Three crystals, however, escape this rule: first, the KM132 sample from the Clementina mine, in which vacancies (0.592□ pfu) exceed the proportion of (Na + Ca + K) on the X site – this sample consequently belongs to the X-vacant group (Table 6); secondly, the WR045 tourmaline from Urucum, which is still Na-dominant but displays a strong enrichment in Ca (0.216 apfu) and a very low number of vacancies; finally, the sample KM120 from Baixão, which shows an intermediate behaviour characterized by an enrichment in Ca (0.150 apfu) and in vacancies (0.288 pfu), coupled to a slight depletion in Na (Fig. 3a).
In order to calculate the W-site populations, the V-site occupancies were constrained to 3 OH− pfu, following the consensus from the literature (Grice and Ercit, 1993; Hawthorne and Henry, 1999). The occupancies of the W sites are relatively heterogenous, with F concentrations ranging from 0.111 to 0.689 apfu and OH contents between 0.228 and 0.594 apfu (Table 2). A majority of our samples belong to the fluor series, whereas many other samples can be classified in the hydroxy series (Fig. 3b). It is noteworthy that these OH-rich tourmalines show a composition very close to that of pure elbaite and therefore occur on the same point in Fig. 3c. KM132, KF081, and WR044 show different behaviours, since they contain significant amounts of O2− on the W sites (between 0.238 and 0.366 O pfu, Fig. 3b). The presence of the three types of tourmaline series amongst the samples from Minas Gerais had already been highlighted by previous studies (Bosi and Lucchesi, 2004).
Previous authors also agree on the fact that in most tourmalines from the Eastern Brazilian Pegmatite Province, the boron contents on the B sites can be considered very close to 3 apfu. However, in our case, boron has been directly measured by LA-ICP-TOF-MS, and the resulting data (Table 2) are consistently below the stoichiometric values (2.70 to 2.84 B pfu). Similar results were obtained by Bosi et al. (2005) when they measured, by secondary ion mass spectrometry (SIMS), the B2O3 contents of tourmalines from Cruzeiro. According to these authors, such low B contents can be attributed to analytical errors, which is also certainly the case in our study. This assumption is further supported by the fact that the 〈B–O〉 bond lengths measured in our samples (see below) are within the range of those calculated for boron in triangular coordination in tourmalines (Pieczka, 1999). In the final assigned site populations (Table 6), we consequently considered the theoretical occupancy of 3 B pfu on the triangular sites.
Tetrahedral T sites often display stoichiometric amounts of Si (6.000 apfu), but a careful examination of Si–O average bond lengths (see below) indicates that minor amounts of boron certainly occupy this site, as already described by Ertl et al. (2018). Starting from these observed Si–O mean bond distances, we recalculated the B contents of the tetrahedral sites, according to the correlation proposed by these authors, and we obtained values ranging from 0.020 to 0.300 B pfu (Table 6).
Most of the major compositional variations affecting the tourmalines of this study take place on the Y crystallographic sites, which can incorporate various types of cations (Table 6). Ti and Mg are almost absent from our samples, with Ti appearing sporadically in very small proportions (up to 0.03 apfu) and Mg reaching maximum values of 0.21 wt % MgO, indicating that the dravitic component is low amongst tourmalines from the EBPP (Fig. 3c). Higher values are obtained for YMn2+ (Table 6), with concentrations from 0.009 to 0.291 apfu. Although manganese does not become the dominant cation on the Y sites of these Mn2+-rich samples, its presence indicates a non-negligible tsilaisitic component (samples KM066, KM076, WR037, WR044, WR045, and U20662).
Al, Li, and Fe2 are, by far, the most represented cations on the octahedral sites (Table 6). The dominant cation on these sites is Al in most samples, with values ranging from 0.915 to 1.608 apfu. In some cases (WR065, KM066, KM120, WR045), Li can also be the dominant cation, sometime reaching 1.491 apfu. KM132 is the only example of YFe-dominant (Fe = 1.377 apfu) tourmaline amongst our samples; this Fe enrichment is accompanied by strong depletion in lithium (Li = 0.147 apfu). Based on these data, the tourmaline species of this study have been identified using the ternary (AlLi+)–Mg2+–Fe2+ diagram developed by Henry et al. (2011) to classify the tourmaline species from the alkali and X-vacant groups.
The results are given in Fig. 3c, and the identified species are given in Table 6. Most of our tourmalines are fluor-elbaites or elbaites, where similar proportions of Al and Li share the Y positions. Elbaites are located close to the elbaitic end-member, with Fe2+ strongly depleted and the schorlitic component negligible (Fig. 3c). On the other hand, fluor-elbaites tend to align themselves along the fluor-elbaite to fluor-schorl solid solution. The only exception is sample KM132, which shows a dominance of vacancies on the X site (Fig. 3a), as well as of Fe2+ on the Y site (Fig. 3c). Such a composition indicates that this sample can be considered a rossmanite close to the foitite composition field (Fig. 3c).
Crystal structure refinements were performed in the R3m space group. Cation occupancies for Si on the T site, as well as for B on the B site, were constrained to 1, as well as oxygen occupancies. Occupancies for Na on the X site, for Al or Fe on theY site, and for Al on the Z site, were generally refined, except for the Z-site occupancies, which were constrained to 1 when the preliminary refinements indicate that this site was fully occupied. For the last refinement cycles, all atoms except hydrogens were refined with anisotropic displacement parameters. Atomic coordinates and occupancy factors and anisotropic displacement parameters, as well as bond length distances and interatomic angles, are available in the Supplement (Tables S2 to S4). Average bond lengths are given in Table 7.
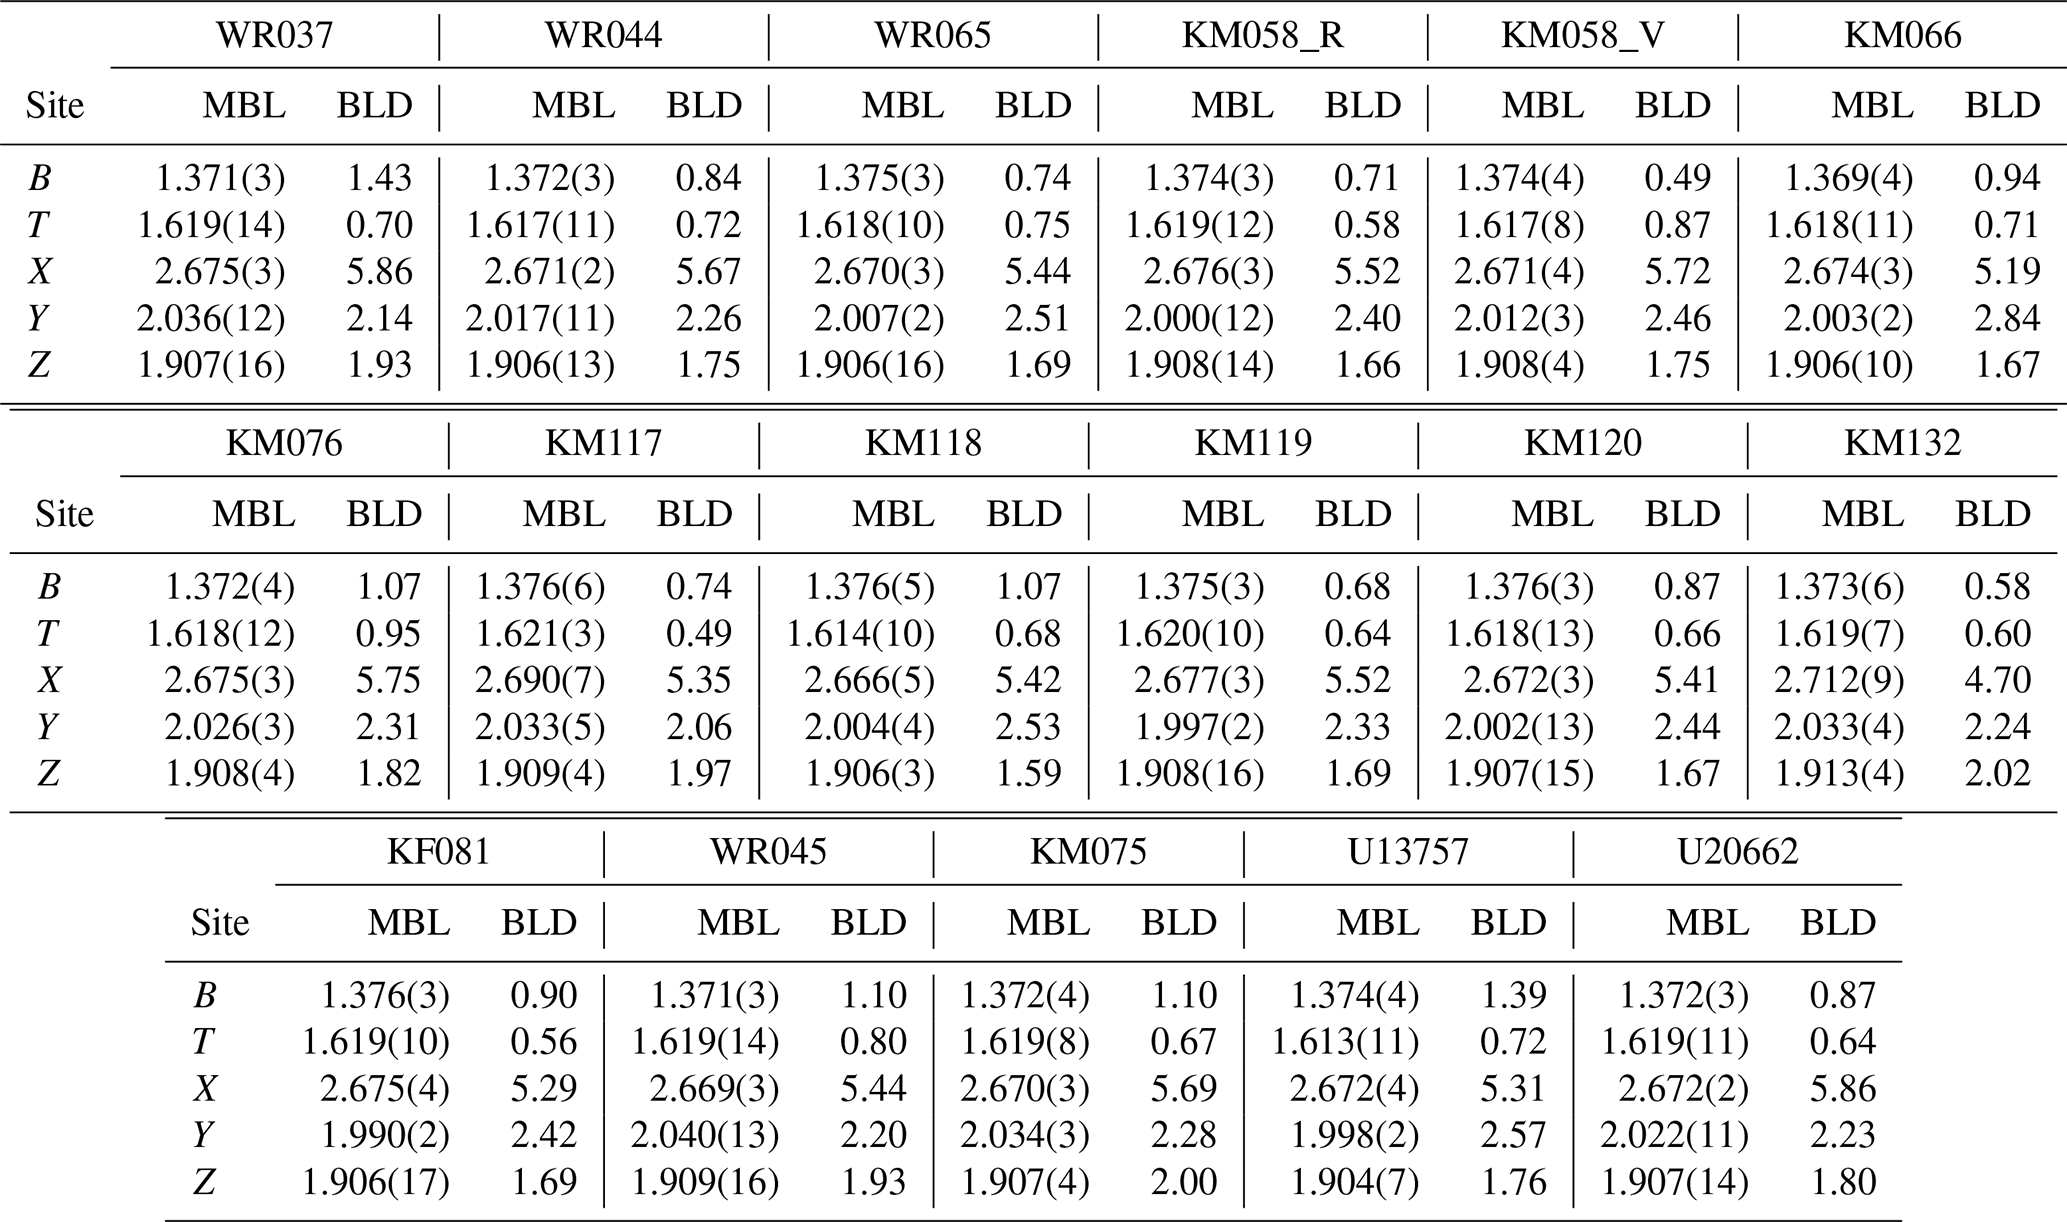
Table 7Mean bond length (MBL) and bond length distortion (BLD) values for the cationic sites of Brazilian tourmalines.
Unit-cell parameters (Table 5) are in the ranges usually admitted for tourmalines (15.7 Å Å; Å; Hawthorne and Dirlam, 2011), and they are similar to the values obtained for Brazilian tourmalines of the elbaite–schorl solid solution (Bosi et al., 2005; Gatta et al., 2012; Bosi and Lucchesi, 2004). The a parameters of our samples vary between 15.8187(3) and 15.9309(3) Å, whereas their c parameters range from 7.0924(2) to 7.1279(2) Å. None of the sample reaches the schorl–dravite solid solution reference values. The KM132 crystal is, by far, the sample showing the most important schorlitic component. KM117 and WR045 are located in the centre of the schorl–elbaite solid solution, whereas WR037, KM075, and KM076 have weak schorlitic components but still keep their distances from the elbaitic pole. The rest of the samples are relatively close to the elbaite end-member (Fig. 3). The specific case of the zoned KM058 crystal is interesting as it displays an evolution of the c parameter. The pink part of the sample shows unit-cell parameters close to those of the elbaitic end-member, while the green part of the sample shows unit-cell parameters close to those of an elbaite, with a strong schorlitic component. Four tourmalines (U13757, KF081, KM118, and KM066) also display particularly low a and c parameters, below the reference values of elbaites. In the case of the first three samples, this behaviour can be explained by the presence of high amounts of aluminium, with a small ionic radius, on the Y site of tourmaline, but this explanation does not apply to the KM066 crystal, which is enriched in Mn2+ and Fe2+ on this site.
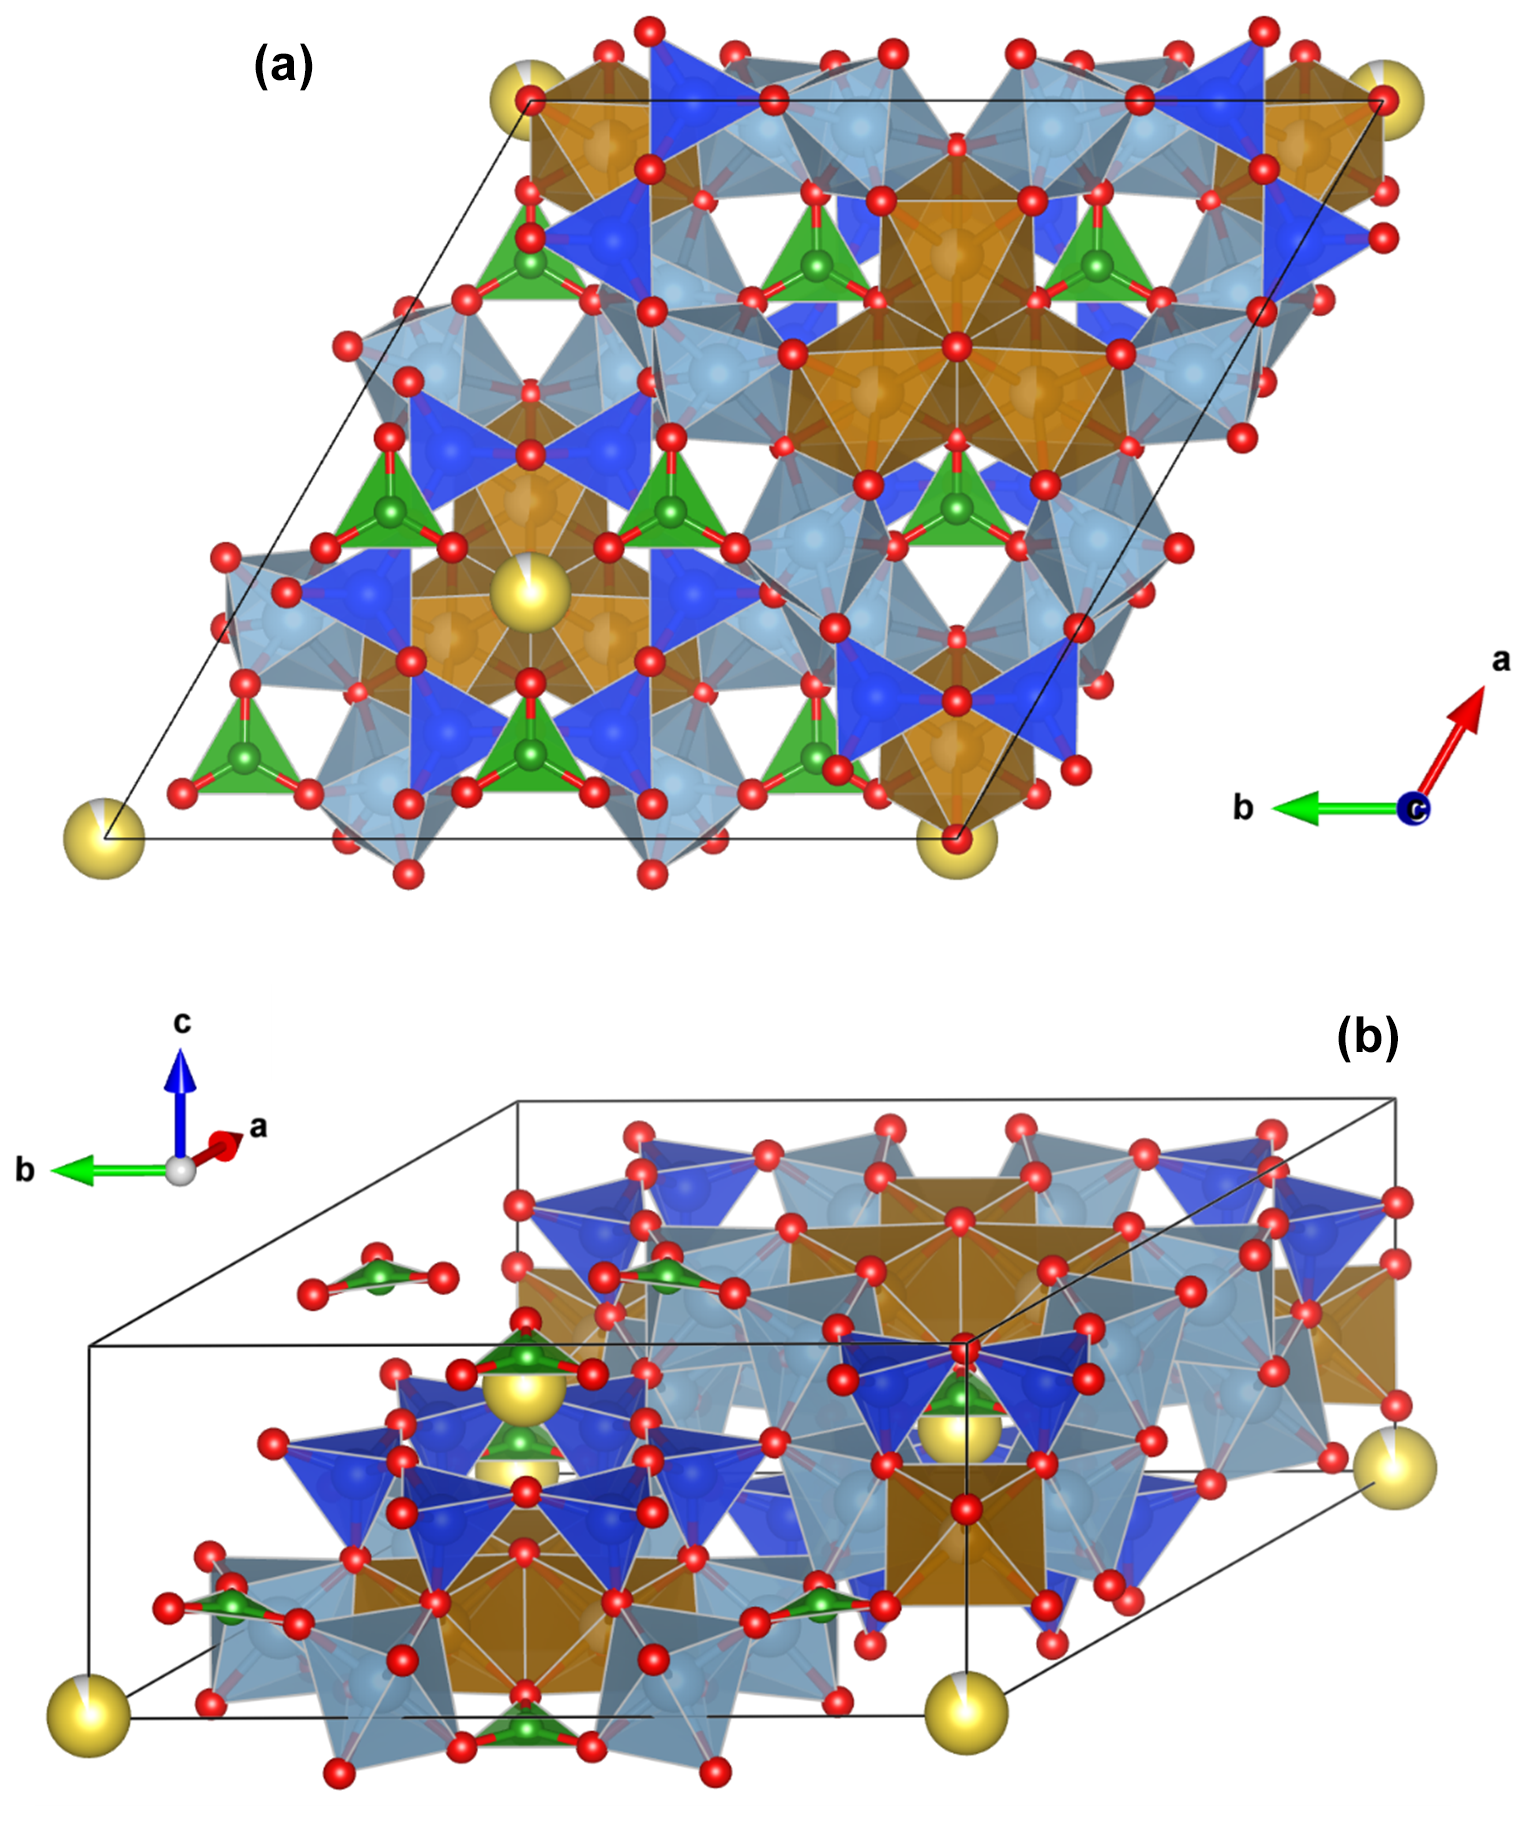
Figure 4Crystal structure of a tourmaline from Minas Gerais (sample WR037). (a) View of the structure along the c axis. TO4 tetrahedra are blue, BO3 triangles are green, ZO6 octahedra are grey, and YO6 octahedra are brown. Yellow spheres represent Na atoms located on the X crystallographic sites. (b) General view of the structure. Drawings were created using the Vesta 3 program (Momma and Izumi, 2011).
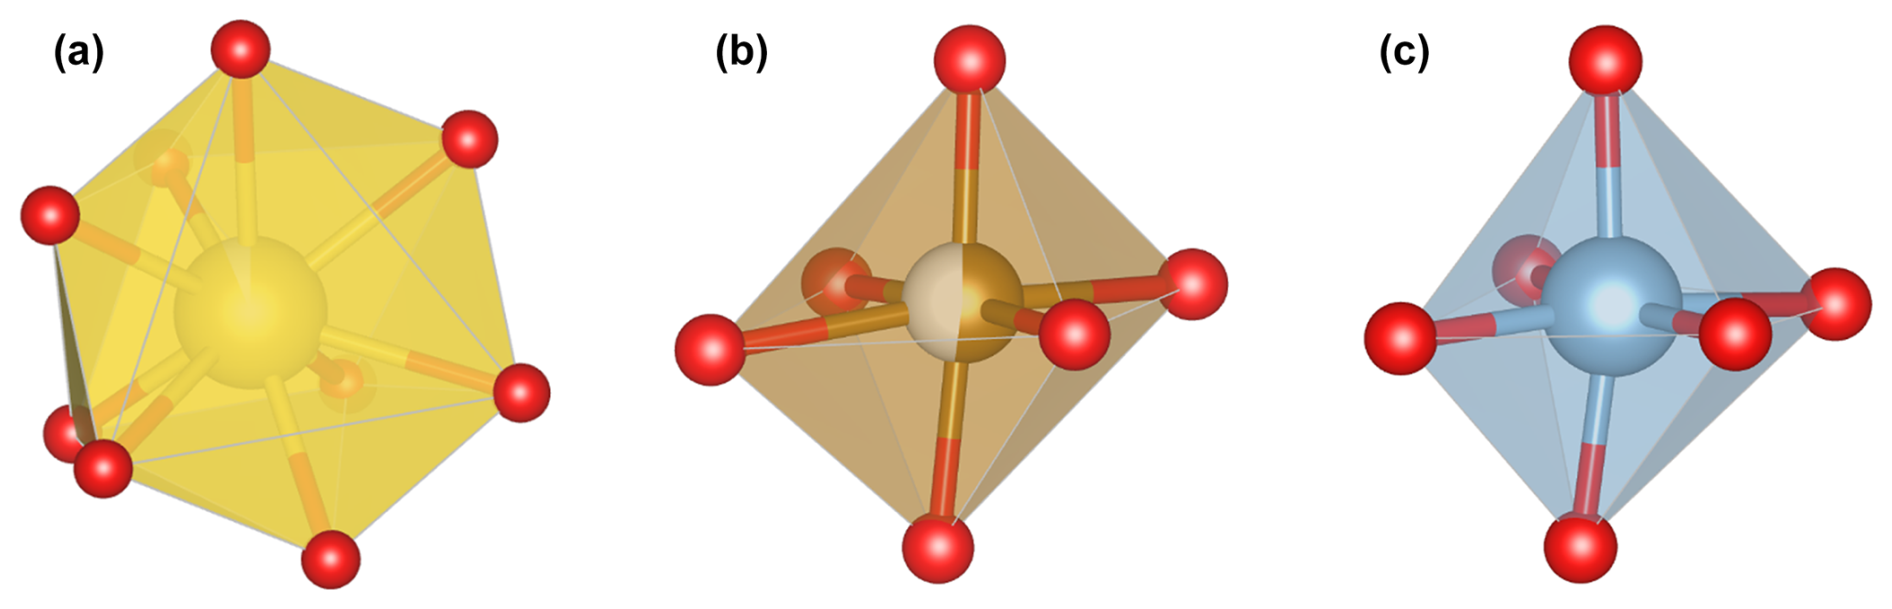
Figure 5Morphologies of the (a) [XO9], (b) [YO6], and (c) [ZO6] polyhedra in the crystal structure of a tourmaline from the Eastern Brazilian Pegmatite Province (sample WR037). Drawings were performed using the Vesta 3 program (Momma and Izumi, 2011).
The main feature of the tourmaline structure (Fig. 4) is the presence of six [TO4] tetrahedra linked by their corners to form [T6O18] rings, perpendicular to the c axis. The presence of these rings implies that tourmalines belong to the cyclosilicates sub-class (Mills et al., 2009). The rings are linked to three [YO6] octahedra bonded together by their edges to form trimers. The second type of octahedra hosts the Z sites and is bonded to the periphery of these trimers by the edges. B sites are in triangular coordination, therefore forming [BO3] groups that are linked by their corners to the two types of octahedra. This arrangement therefore leaves cavities in the crystal structure that are occupied by the X sites, in 9-fold coordination. These positions are located along the c axis, outside the plan containing the [T6O18] rings. The [XO9] polyhedra are usually occupied by cations with large ionic radius such as Na or Ca, but they are also often empty. These polyhedra are strongly distorted (Fig. 5a). The W anions occupy the O1 sites, located along the c axis, in a central position, and every V anion located in O3 is shared between a [YO6] and a [ZO6] octahedra (Hawthorne and Dirlam, 2011). The unidirectional orientation of the [TO4] tetrahedra constituting the rings implies that tourmalines are both non-centrosymmetric and polar. These minerals are, therefore, pyroelectric and piezoelectric (Hawthorne and Dirlam, 2011). The structural formula, deduced from these data, can be written XY3Z6[T6O18](BO3)3V3W (Hawthorne and Henry, 1999).
Table 7 indicates that the measured mean bond lengths are relatively coherent for each site, among the different samples. In the B sites of these tourmalines, the B–O bond lengths show variations of a few thousandths of ångströms, indicating that these sites are geometrically stable. Their coordination polyhedra are slightly distorted, compared to a perfect triangle, as one of the three B–O bonds (Table S3) is 0.020 to 0.040 Å shorter than the two other bonds. This distortion also produces a significant tightening of the O8–B–O8 interatomic angle (Table S3). Bond length distortion values (BLD, Table 7), allowing an estimation of the crystallographic site deformation based on the measured bond lengths, were calculated using a method similar to the one used by Hatert et al. (2004) and based on the Renner and Lehmann (1986) approach. For the triangular BO3 sites, the BLD factors vary between 0.49 % and 1.43 %, which confirms the low deformation degree of the polyhedra. These parameters are even lower for the tetrahedral TO4 positions, thus implying that these sites are close to the perfect tetrahedral shape. Based on their BLD values of around 2.37 % and 1.79 %, respectively, the Y and Z sites appear to be more distorted (Fig. 5b, c; Table 7). The XO9 coordination polyhedron, with BLD values above 5.19 %, appears to be the most distorted in the tourmaline structures of our samples (Fig. 5a, Table 7).
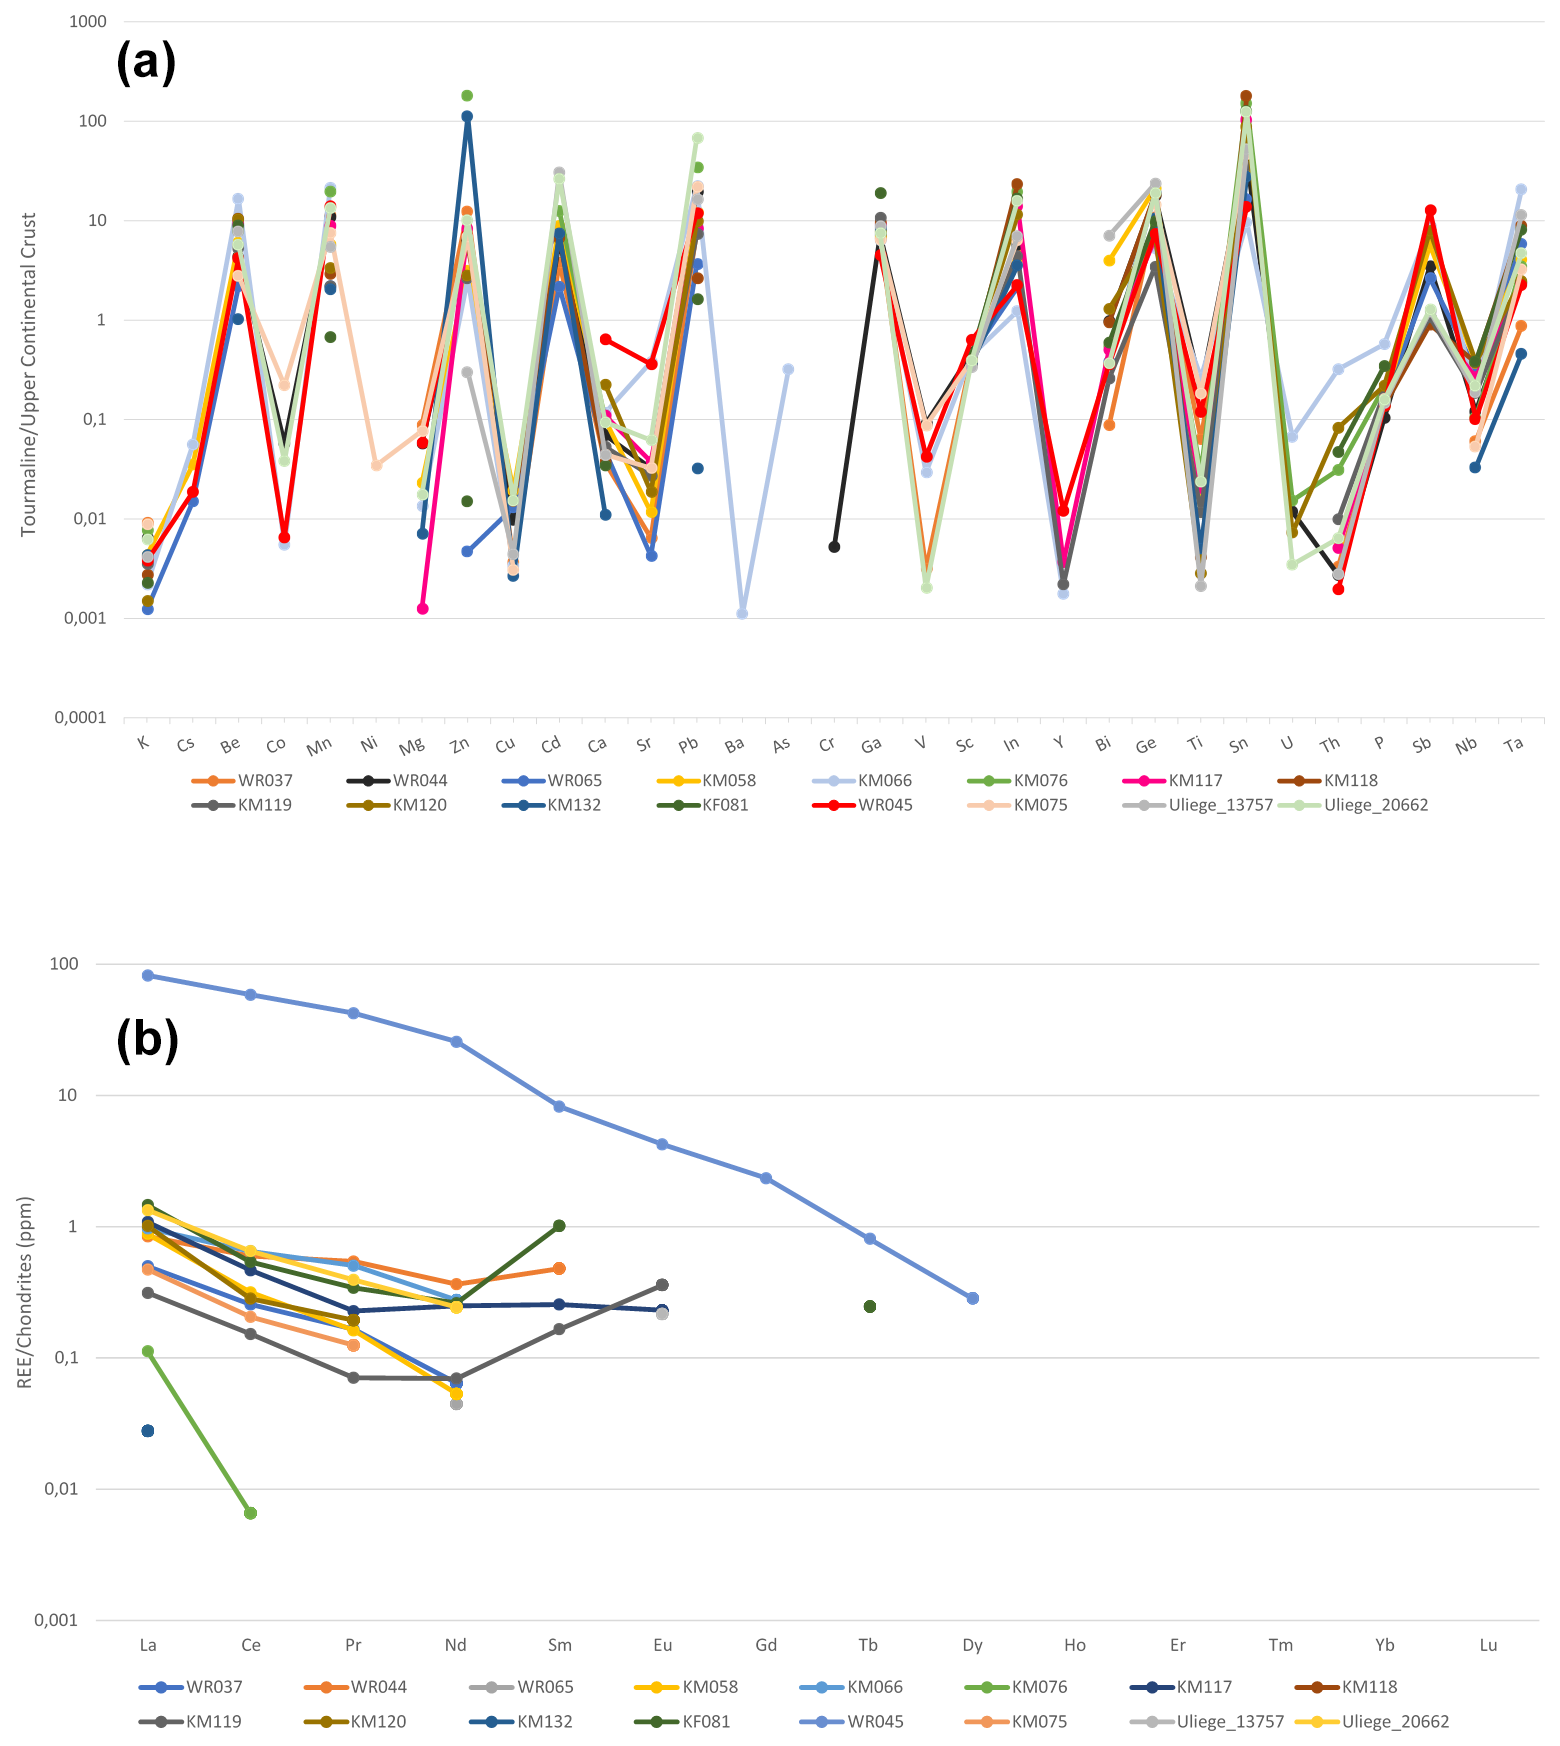
Figure 6(a) Trace-element variations in tourmalines from the Eastern Brazilian Pegmatite Province, normalized to the Upper Continental Crust (Rudnick and Gao, 2014). (b) Rare-earth-element mean concentrations in tourmalines, obtained through LA-ICP-TOF-MS. Data were normalized to chondrites, based on the values published by Taylor and McLennan (1985).
The trace-element contents of tourmalines from Eastern Brazilian Pegmatite Province (Table 3) were normalized to the Upper Continental Crust (Rudnick and Gao, 2014). Variations in these element ratios are shown in Fig. 6a, where they are gathered based on their dominant valence states (monovalent to pentavalent) and then by increasing ionic radii (VI coordinated to O; Shannon, 1976), according to a procedure defined by Trumbull et al. (2018). These variations are relatively strong, since the diagram obviously shows a sawtooth pattern. Such a pattern is difficult to decipher, but certainly both the pegmatitic fractionation and the crystal–chemical constraints influence the observed variations.
Twelve elements generally show concentrations above those of the Upper Continental Crust, namely Be, Mn, Zn, Cd, Pb, Ga, In, Bi, Ge, Sn, Sb, and Ta (Fig. 6a). Some of these elements are clearly enriched by pegmatite fractionation, for example Be, Ga, Sn, and Ta (Simmons and Webber, 2008). On the other hand, divalent cations such as Mn (effective ionic radius, e.i.r. = 0.830 Å; Shannon, 1976), Zn (e.i.r. = 0.740 Å), or Cd (e.i.r. = 0.95 Å), as well as trivalent cations such as In (e.i.r.=0.800 Å), could easily substitute for Fe2+ (e.i.r.=0.780 Å) on the octahedral Y site. Larger cations such as Bi (e.i.r.=1.17 Å) and Pb (e.i.r. = 1.19 Å) could substitute for Na (e.i.r.=1.24 Å) on the X [9]-fold site, and smaller cations such as Ge (e.i.r.=0.530 Å) could replace Al (e.i.r.=0.535 Å) on the Z site. The incorporation of Sb (e.i.r.=0.60 Å) could take place on the Z site, but recent studies on melt inclusions by Thomas and Davidson (2016) have shown that this element was also enriched by fractionation in pegmatites.
It is extremely difficult to unravel the behaviour of independent samples in Fig. 6a due to a strong overlap of their geochemical trends. Sample WR045, which appears to be particularly enriched in Ca due to its evolution towards the calcium-rich end-member liddicoatite (Tables 2, 6), is also the richest in other elements such as Sr, Sc, Y, and Sb. The substitution of Ca [9] (e.i.r.=1.18 Å) by Sr (e.i.r.=1.31 Å) and Y (e.i.r.=1.075 Å) is relatively easy due to their close ionic radii, and this steric effect also allows the incorporation of light REEs from La (e.i.r.=1.216) to Dy (e.i.r.=1.083) in this tourmaline sample (Fig. 6b). The presence of REEs in the crystal structure of tourmalines is certainly mostly constrained by geochemical factors, explaining the positive correlation between the Ca and REE contents of tourmalines. As shown in Table 6 and Fig. 6b, the most calcic sample WR045 (1.90 wt % CaO) is the richest in REEs and the less calcic sample KM132 (0.01 wt % CaO) is the poorest in REEs (except sample KM076, which is basically depleted in REEs; Table 3). The calcium and REE enrichment of sample WR045 is obviously linked to a late calcium metasomatic stage, well known to affect some granitic pegmatites (Martin and De Vito, 2014; Pieczka et al., 2019) and responsible for the crystallization of other Ca-rich species associated with these samples, such as fluorapatite and stokesite (Table 1).
7.1 Major substitution mechanisms
Most tourmalines investigated here are of the fluor-elbaite to fluor-schorl solid solution (Fig. 3, Tables 2 and 6). This is relatively different from the samples previously investigated in the EBPP, which are generally composed of members of the schorl–elbaite solid solution (Bilal et al., 1998; Federico et al., 1998; Castañeda et al., 2000; Bosi and Lucchesi, 2004; Bosi et al., 2005; Andreozzi et al., 2025). KF081, WR065, KM118, KM119, KM132, and U13757 are the only samples belonging to the hydroxy series and corresponding to elbaite, but KM132 and KF081 show compositions relatively close to the oxy series (Fig. 3b). Sample KM132 is the first occurrence of rossmanite in Minas Gerais, but this species has already been reported in several pegmatites of the state of Tocantins, Brazil (Queiroz et al., 2011). Its composition is close to foitite, which is known from the Cruzeiro deposit (Dutrow and Henry, 2000).
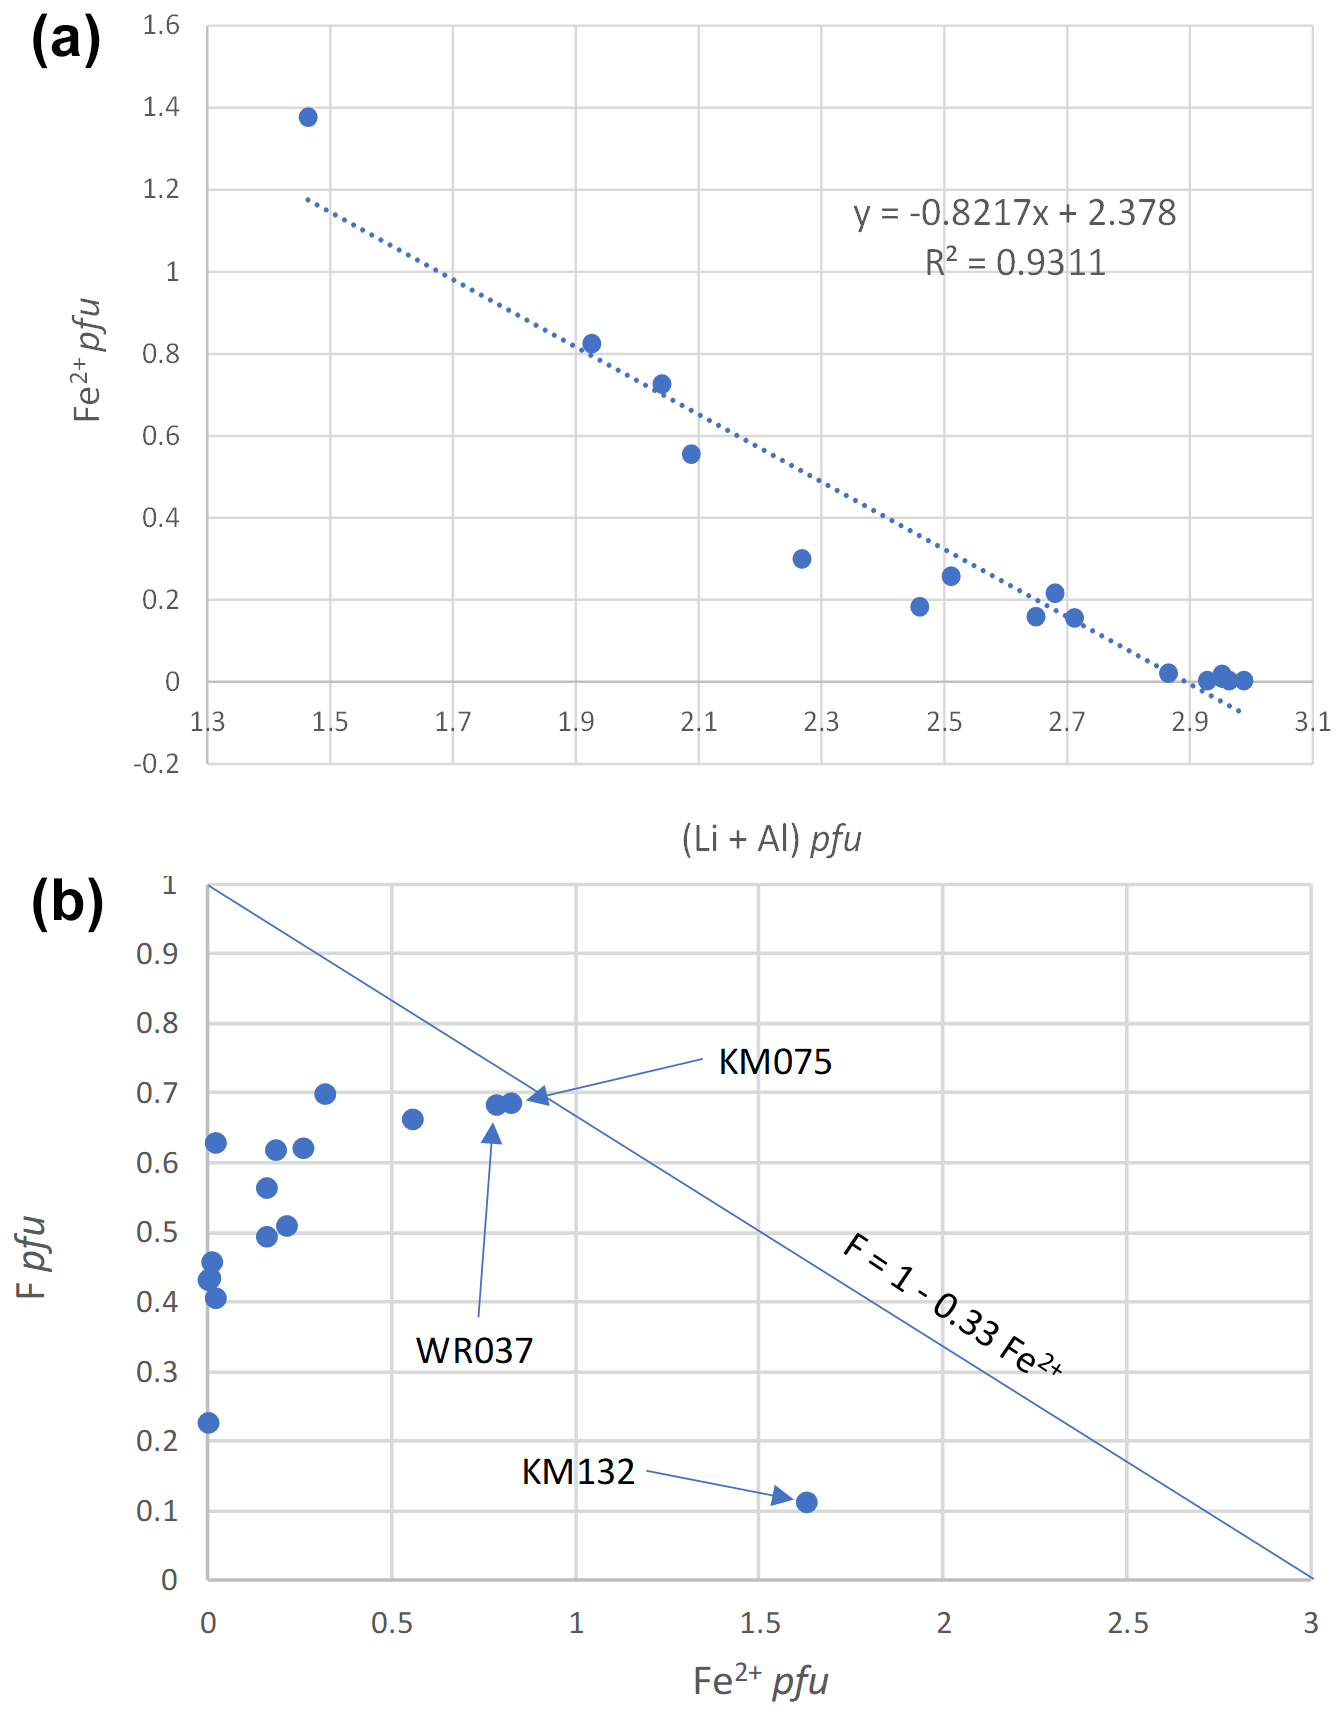
Figure 7Correlation between Fe2+ pfu and (Li + Al) pfu (a), and between F pfu and Fe2+ pfu (b), in tourmalines from Minas Gerais, Brazil.
Several substitution mechanisms are involved to explain the chemical variations observed for our tourmaline samples. In most fluor-elbaites and elbaites, an increasing schorlitic component can be observed as 3Fe2+ progressively replaces (1.5AlLi+) on the Y octahedral sites. The excellent correlation between Fe2+ pfu and (Li + Al) pfu, with a slope close to −1 (Fig. 7a), confirms this schorlitic mechanism, which is the main substitution highlighted by Bosi et al. (2005) for the pegmatitic tourmalines from the Eastern Brazilian Pegmatite Province.
As explained earlier, another mechanism observed in our samples is the replacement of the Y-site cations by Mn2+, which leads to the presence of a tsilaisitic component amongst some of the crystals. KF081 and WR045 also show peculiar behaviours. In the KF081 elbaite, strong Al enrichment, Li depletion, and replacement of XNa by X□ pull the composition towards the rossmanite pole, according to the substitution mechanism XNaLiAl3+ (Table 6). In WR045, an inverse phenomenon affects the Y sites, while the X positions are progressively filled with Ca; such substitutions indicate an evolution towards a liddicoatite component, according to the mechanism XNaAlCaLi+ (Table 2). The composition of sample KM132 can be obtained starting from a schorl composition and applying the complex substitution mechanism 0.5 XNaFe(OH)AlO2−.
Recently, Andreozzi et al. (2025) investigated a zoned tourmaline crystal from the Cruzeiro mine and observed an inverse correlation between the F and Fe2+ contents, according to the mechanism F = 1 − 0.33 Fe2+. These authors compiled a significant dataset from the literature and concluded that the negative correlation between F and Fe2+ is due not to the Fe2+–F avoidance rule known in some silicates (Rosenberg and Foit, 1977) but to an increase in the fluorine concentration of the residual melt during pegmatite crystallization. The tourmaline samples investigated in our study do not show this negative correlation, and their compositions are mostly localized below the trend defined by Andreozzi et al. (2025) (Fig. 7b). As underlined by these authors, such a behaviour can be explained by a fluorine depletion in tourmaline samples found in miarolitic cavities, in which aqueous fluids play an essential role. It is indeed obvious that most of our samples were collected in such pockets, which give colourful, gemmy, and well-developed crystals suitable for museum collections (Fig. 2). Three samples are closer to the F = 1 − 0.33 Fe2+ trend (Fig. 7b), thus indicating that they were less strongly affected by late fluorine depletion. One of them appears to be very dark in colour and without any visible crystal face (KM132, Fig. 2), thus indicating that it certainly corresponds to a rock-forming tourmaline rather than to a pocket sample.
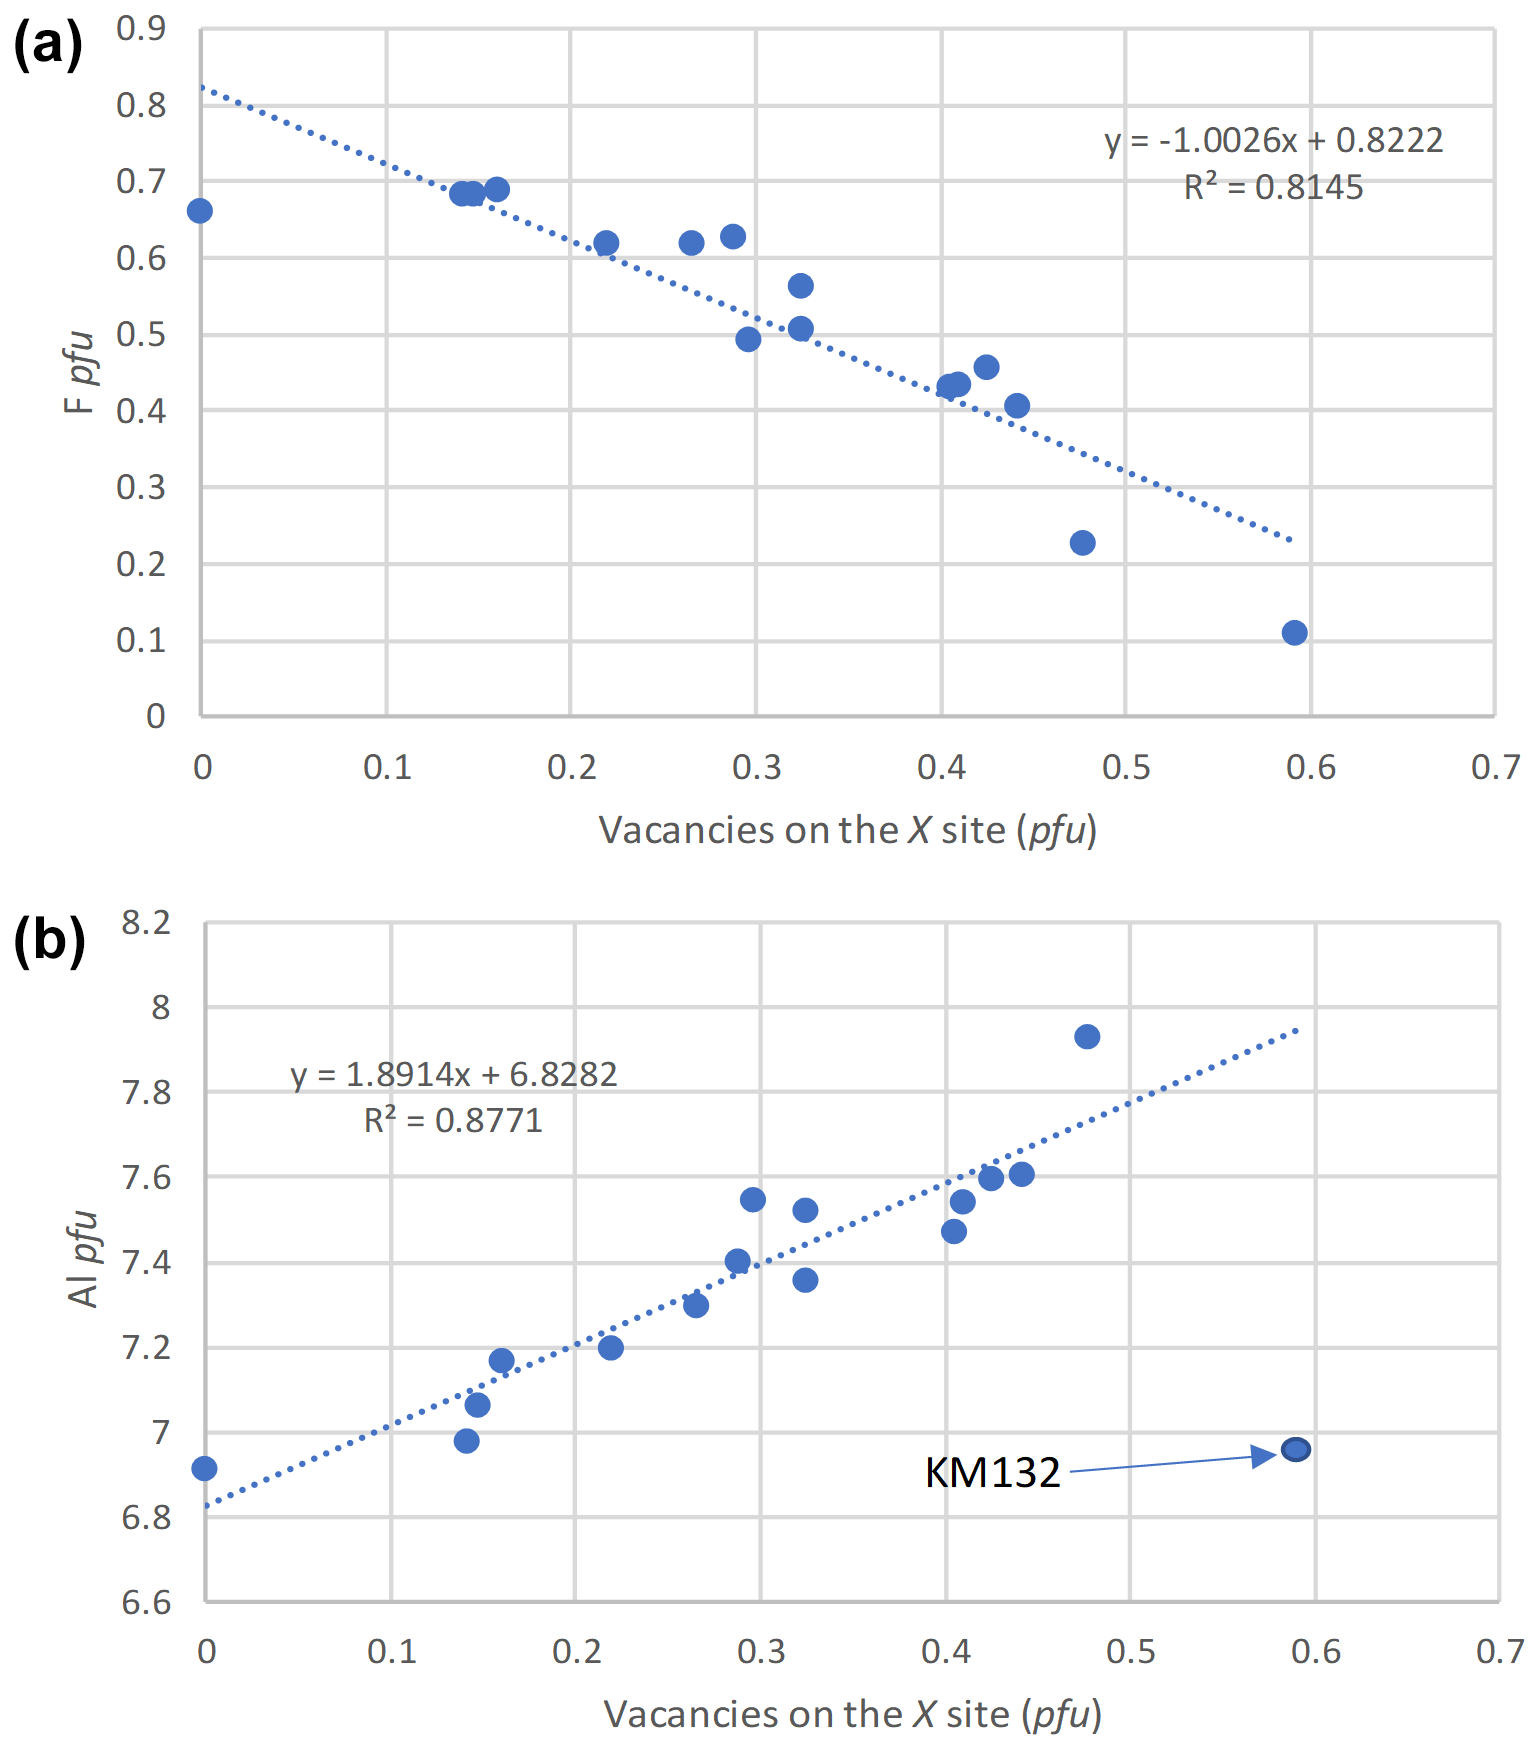
Figure 8Correlations between F pfu and vacancies on the X site (a) and between Al pfu and vacancies on the X site (b), for tourmalines from Minas Gerais, Brazil.
An excellent negative correlation between F and the number of vacancies pfu has also been observed (Fig. 8a), which was previously described by Henry and Dutrow (2011). These authors demonstrate that the fluorite anions, exclusively localized at the O1 position, are strongly influenced by the occupancies of the X and Y sites. Indeed, O1 is linked to three neighbouring Y-site cations and to one X-site cation. As a consequence, the fluorine content of tourmalines is positively correlated with the average X-site charge, thus explaining the negative correlation between F and the number of X vacancies observed in the present paper (Fig. 8a). Another positive correlation between Al and the X-vacancy content pfu is also shown in Fig. 8b, which could be explained by a replacement of Fe2+ by Al3+ on the Y site, compensated by the incorporation of vacancies on the X site according to the substitution mechanism XNaFeAl3+.
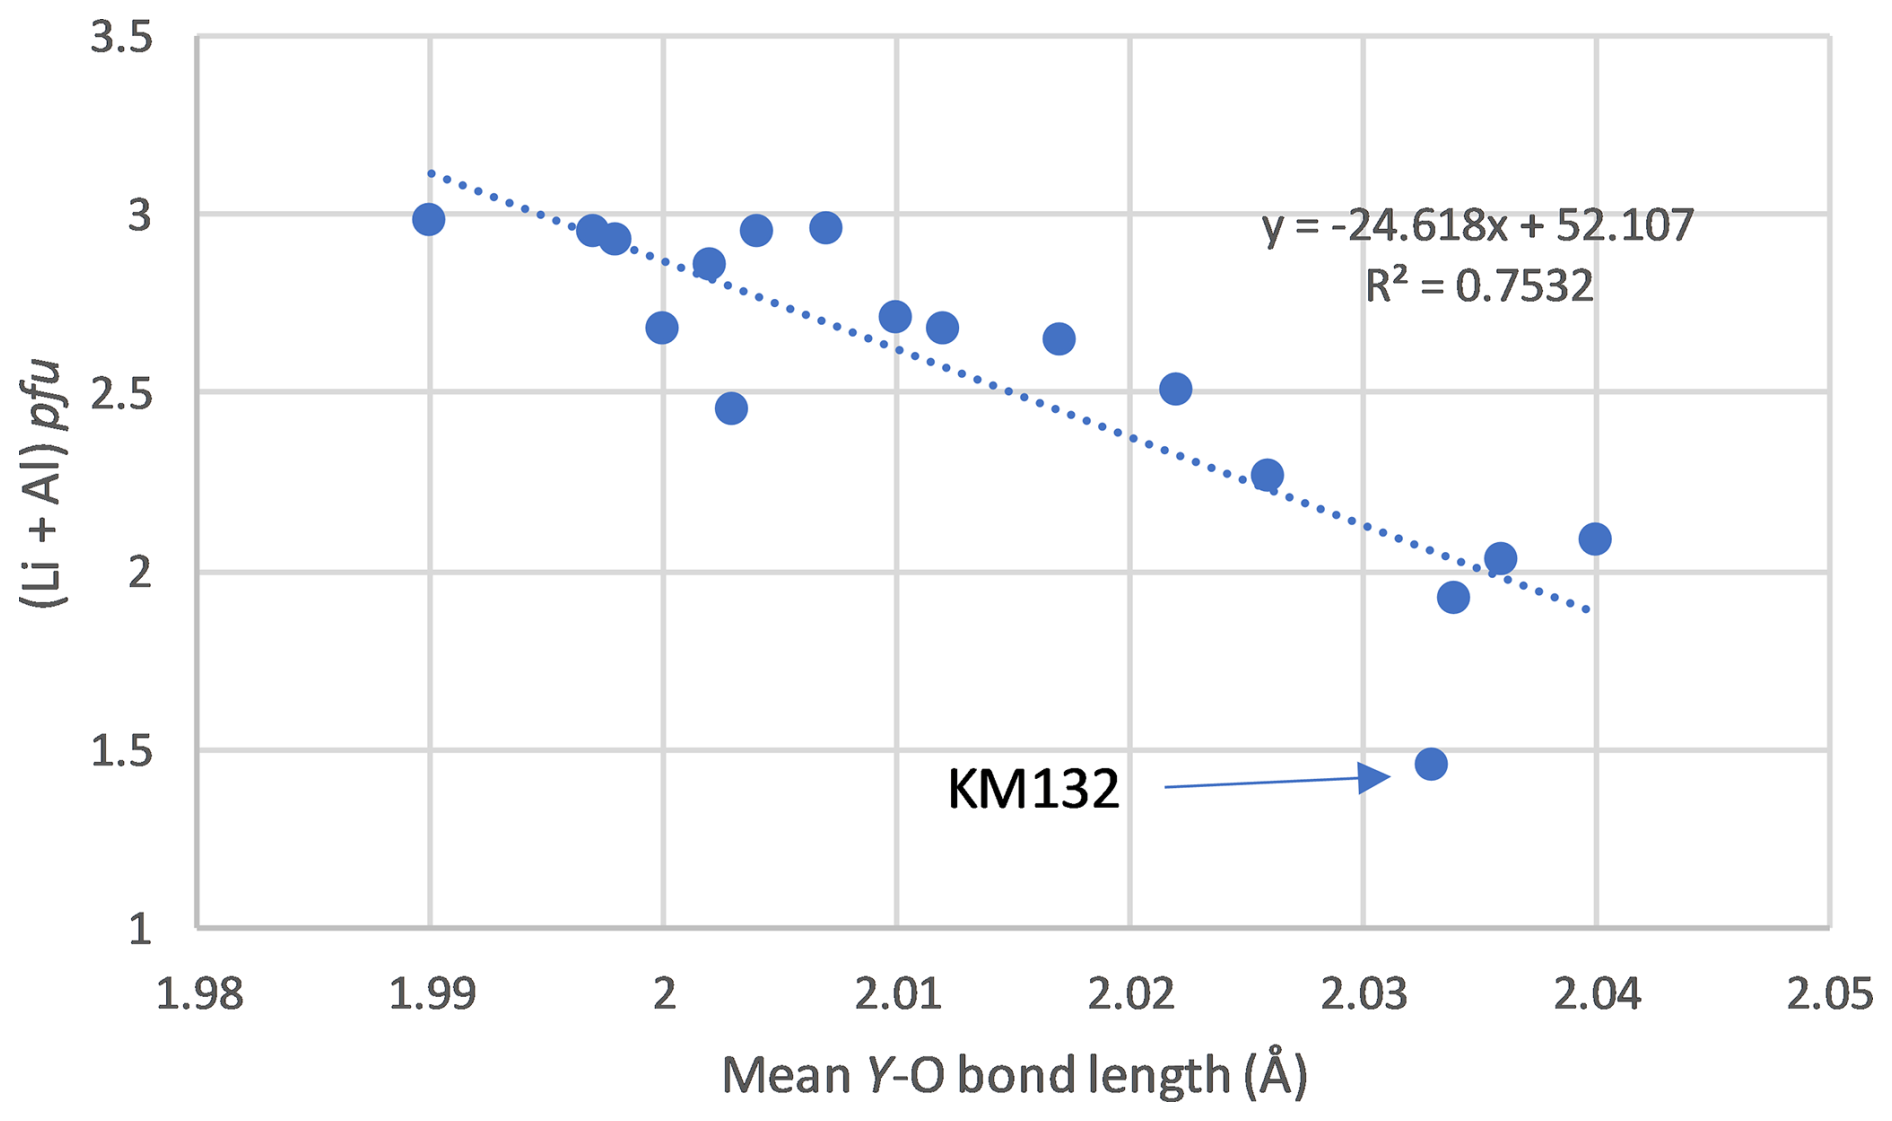
Figure 9Correlation between (Li + Al) pfu and the Y–O mean bond length (Å), for tourmalines from Minas Gerais, Brazil.
7.2 Crystal–chemical correlations
Examination of mean bond lengths (Table 7) indicates that most crystallographic sites of the tourmaline structure do not show significant volume variations, except the Y site, on which the major schorlitic substitution occurs (Fig. 7a). A good negative correlation between the (Li + Al) contents and the mean bond length on the Y site confirms this hypothesis (Fig. 9). This correlation can be explained by a decrease in the mean ionic radii of cations occurring on the Y site, which evolve from 0.780 Å in schorl (e.i.r. Fe2+) to 0.648 Å in elbaite (e.i.r. 0.5 Li Al3+).
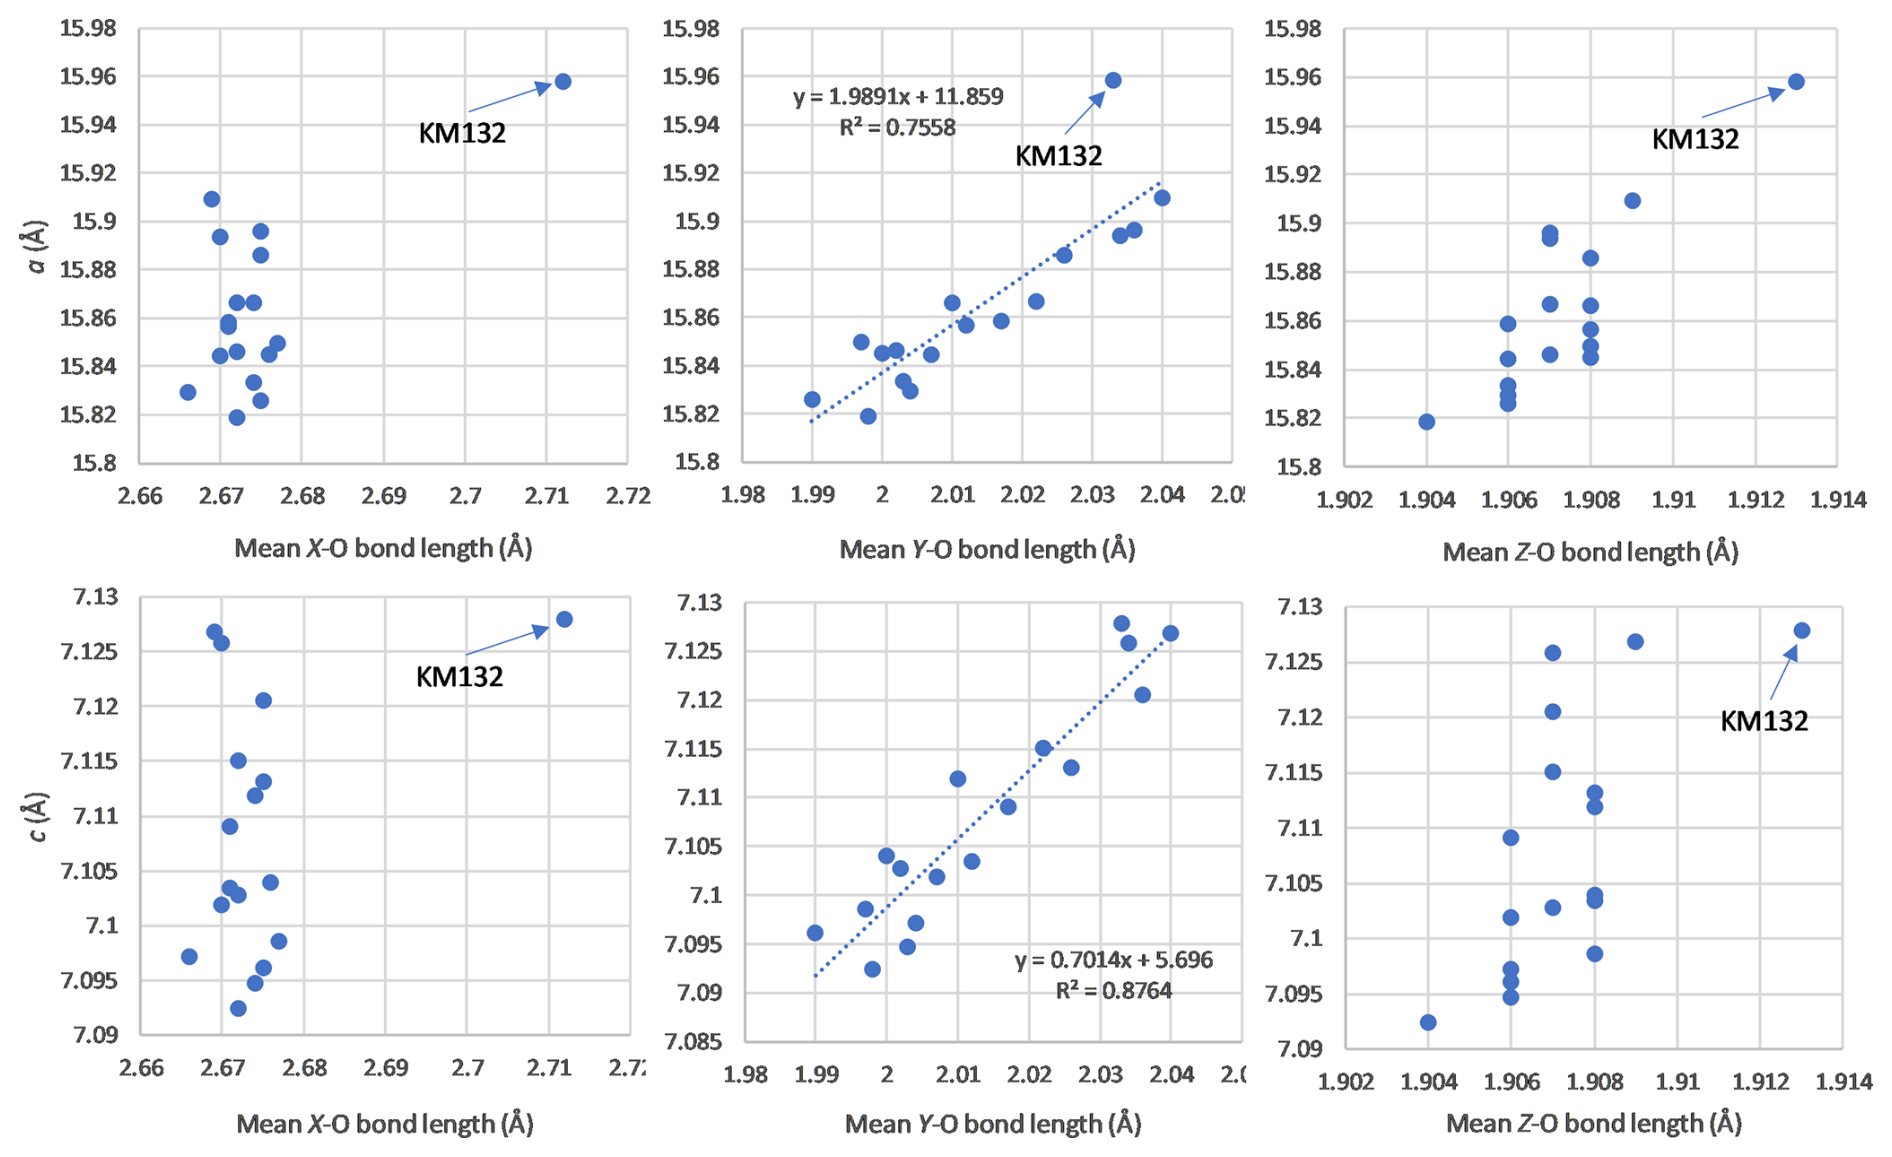
Figure 10Correlations between the unit-cell parameters and the mean bond lengths of the X, Y, and Z sites, for tourmalines from Minas Gerais, Brazil.
Unit-cell parameters of our samples were also correlated with the mean bond lengths of the different crystallographic sites of the tourmaline structure (Fig. 10). The a and c parameters are not correlated with the mean X–O and Z–O bond lengths, which are scattered along constant values of 2.67 and 1.907 Å, respectively. The mean Y–O bond length is, however, positively correlated with the unit-cell parameters, since the main 0.5 Li Al Fe2+ substitution occurs on that site. Similar correlations were established by Bosi et al. (2005) on the elbaite–schorl series, but approaching the schorl end-member composition, they observed a stabilization of the Y–O bond lengths around 2.040 Å. Such a behaviour is not observed in our samples, thus indicating that the substitution mechanism affects the iron-rich compositions and the replacement of Al by Fe3+ on the Z site do not take place herein. It is noteworthy that sample KM132, corresponding to a rossmanite (Fig. 3), systematically falls beyond the observed correlations (Fig. 10), thus confirming that this tourmaline does not belong to the elbaite–schorl series.
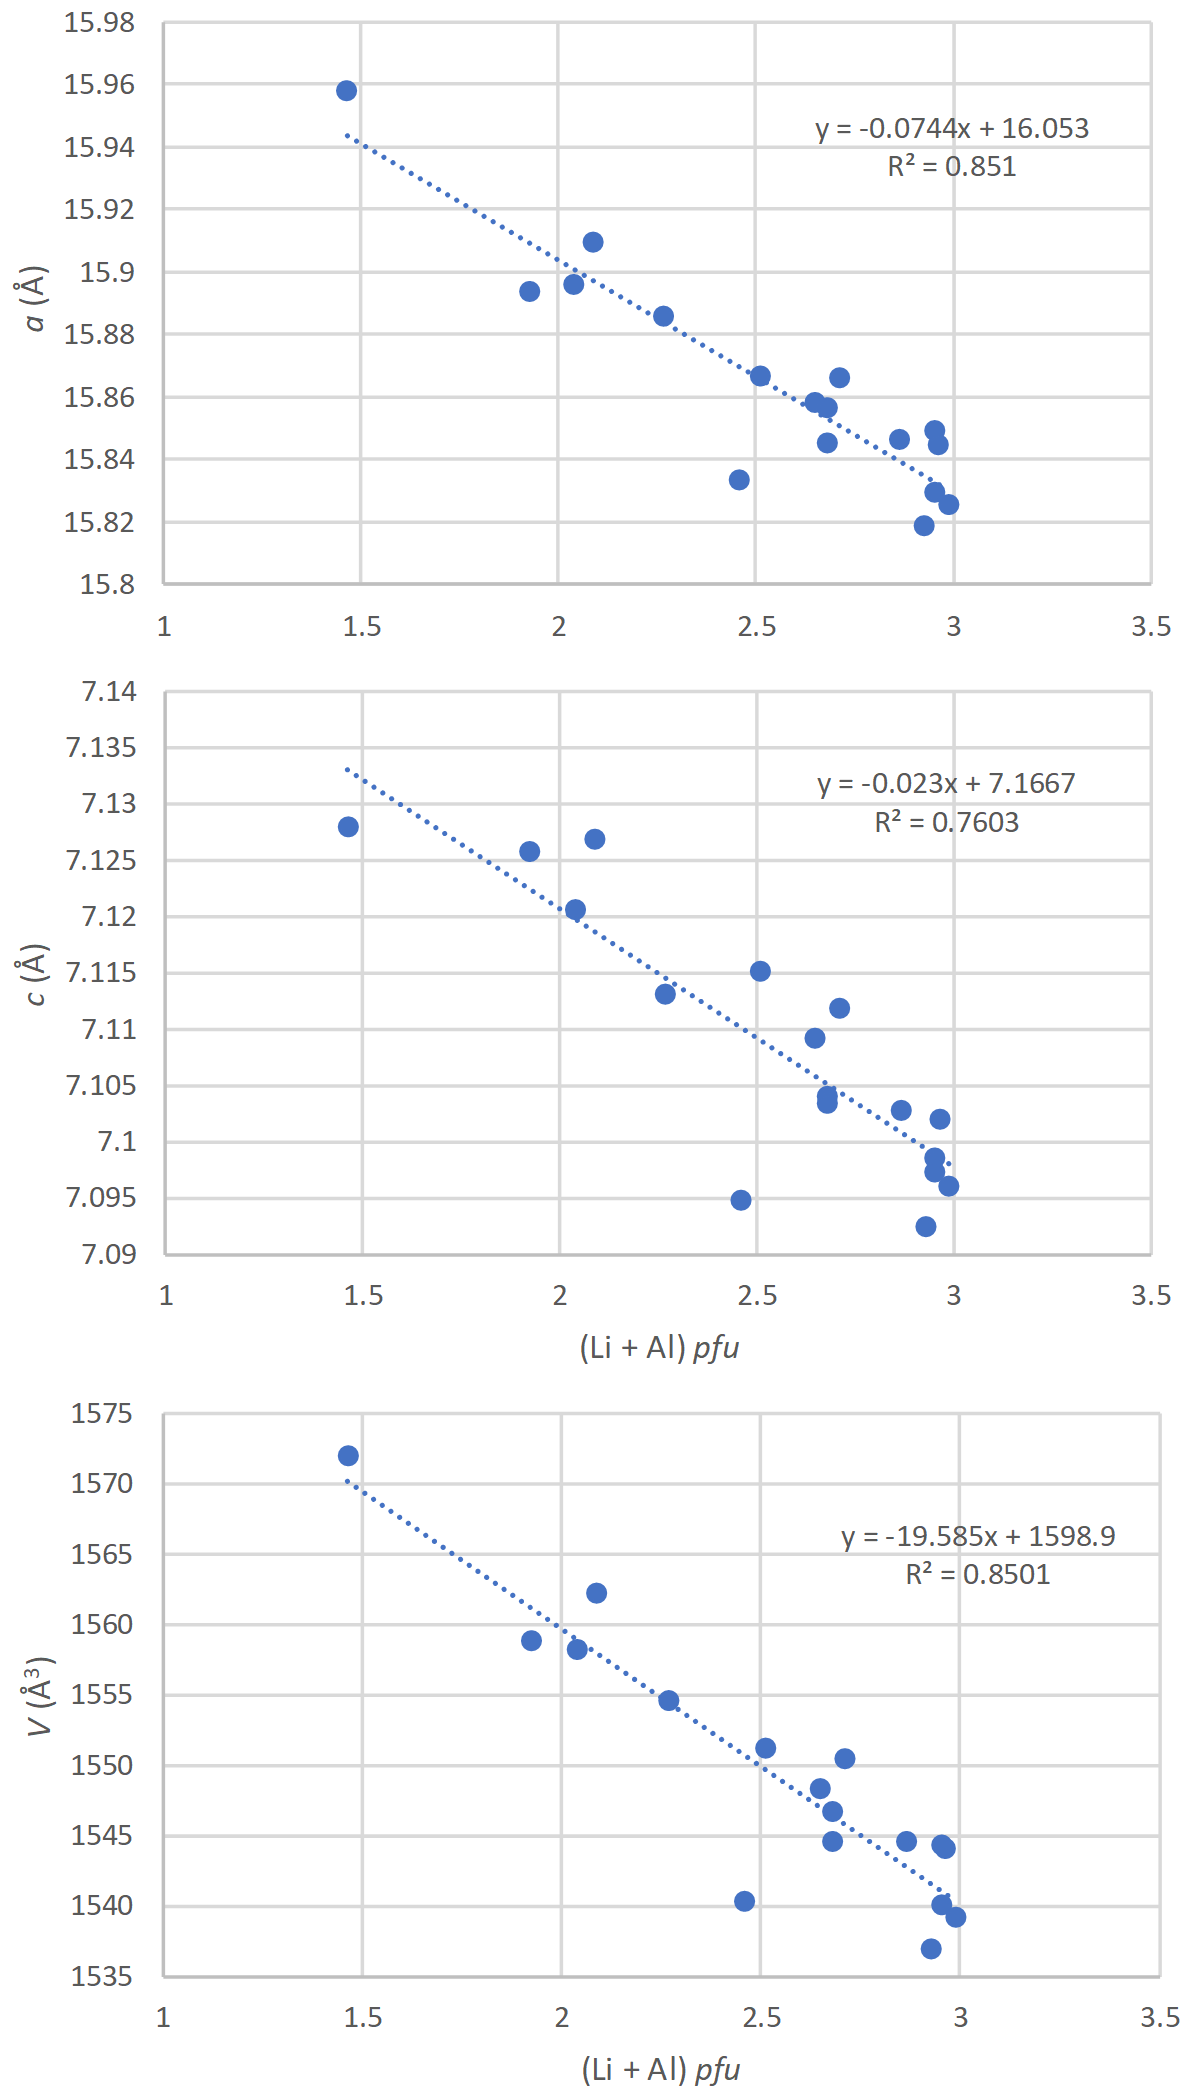
Figure 11Correlations between the unit-cell parameters and the (Li + Al) contents (pfu), for tourmalines from the Eastern Brazilian Pegmatite Province, Brazil.
By considering the strong influence of the schorlitic substitution mechanism on the unit-cell parameters of our tourmalines, it seems logical to observe good correlations between those parameters and the (Li + Al) contents obtained from the chemical analyses (Tables 2, 6). The equations reported in Fig. 11 could consequently be used to determine the (Li + Al) contents of tourmaline samples belonging to the elbaite–schorl series, using their measured unit-cell parameters.
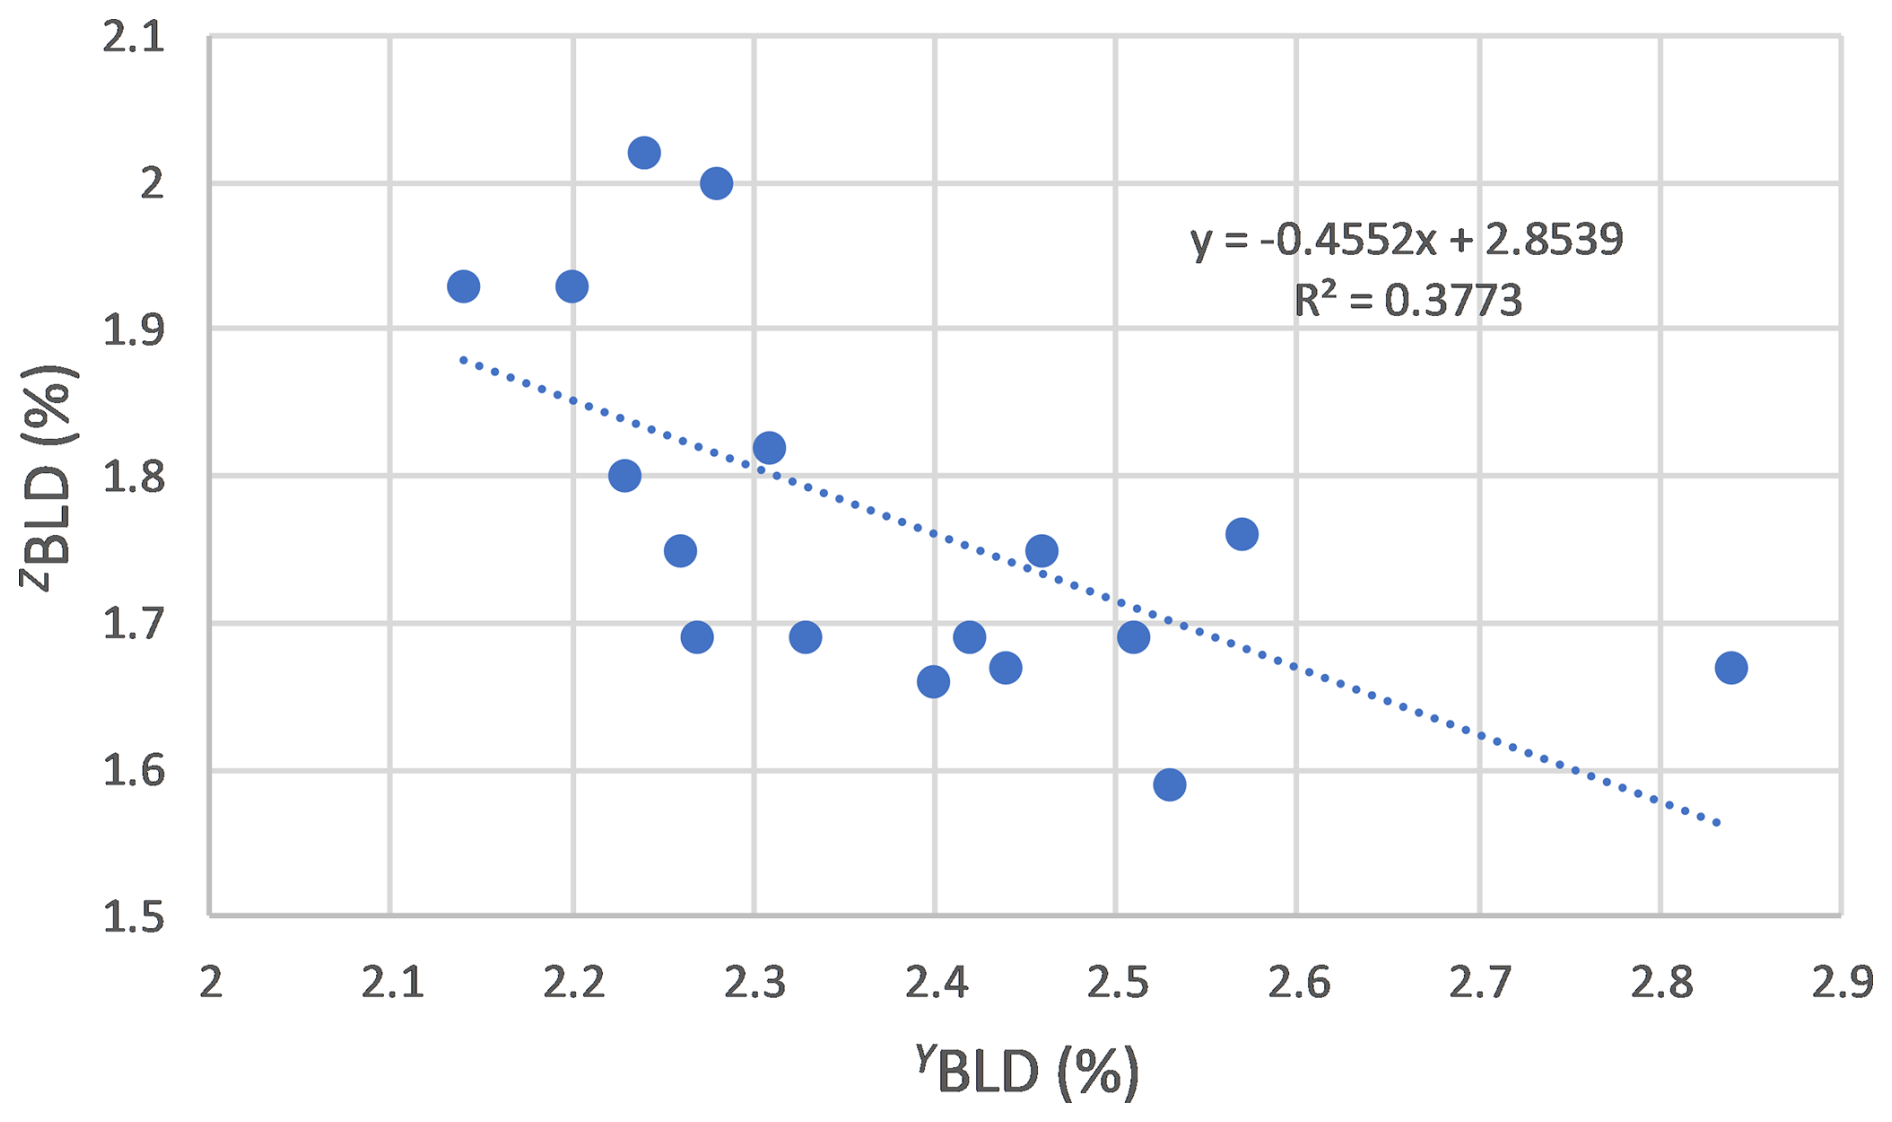
Figure 12Correlation between the bond length distortion (BLD) values obtained for the Y and Z crystallographic sites of the tourmalines from the Eastern Brazilian Pegmatite Province, Brazil.
Finally, observations of BLD values (Table 7) show significant variations among the different crystals, particularly for the YO6 (BLD 2.14 % to 2.84 %) and for the ZO6 octahedra (BLD 1.59 % to 2.02 %). An inverse correlation has been observed between YBLD and ZBLD (Fig. 12), which can be explained by the close geometrical relationships between the Y and Z sites, which share several of their edges, as shown in Fig. 4. According to Bosi and Lucchesi (2007), who explored in detail the compressional and expansion behaviours of tourmaline crystallographic sites, distortion variations of the Z octahedral site occur with constant Z–O mean bond lengths and are produced by a displacement of the O7 atom induced by volume variations of the adjacent YO6 octahedron.
7.3 Geochemical fingerprint of the geological context
In Minas Gerais pegmatites, as in other pegmatitic bodies around the world, compositional and mineralogical zonings are frequently observed, from the core to the rim of the intrusion. Therefore, the chemical compositions of the minerals hosted by these pegmatites vary depending on their position in the magmatic body. The outer pegmatite rim is usually less differentiated and therefore enriched in Fe, whereas intermediate and core zones are more differentiated and consequently enriched in Li and Mn (Castañeda et al., 2000; De Oliveira et al., 2002). From a general point of view, the most differentiated zones of pegmatites show a progressive increase in the , , , , and atomic ratios.
Chemical analyses of trace elements in the tourmalines investigated in the present paper (Table 3, Fig. 6a) show that Ta is always higher than Nb, indicating a very high differentiation degree. Thirteen elements show highly variable amounts, some of which probably occur on the crystallographic sites where the most significant substitutions take place. These elements are Ca, Sr, and Pb, which replace Na on the X site, as well as Mn, Mg, Zn, and Co, which replace Fe2+ and (Li, Al) on the Y site.
The most Ca-rich sample, WR045 from the Urucum mine, corresponds to a late tourmaline, formed during the calcic metasomatic pegmatite stage; this hypothesis is confirmed by the occurrence of fluorapatite and stokesite in association with this sample (Table 1). In the Santa Rose pegmatite, two tourmalines were analysed, one of which showing an enrichment in Zn (KM076) and the other one being poor in this element (KM058). Due to the close ionic radii of Zn (e.i.r.=0.740 Å) and Mg (e.i.r.=0.720 Å), we could consider Zn an element indicating a low pegmatite differentiation degree, and consequently, sample KM076 would originate from a less differentiated zone compared to sample KM058. This is confirmed by the visual appearance of sample KM058, which is a nice “watermelon” tourmaline, which typically forms in albitized zones. The same argument could indicate that the Zn-rich rossmanite–foitite sample KM132, from Clementina, originated from a poorly differentiated pegmatite zone. This conclusion is in agreement with the tourmaline evolution path described by Dutrow and Henry (2000) in Cruzeiro, where foitite appears in the first generation, followed successively by elbaite–schorl and by fluor-elbaite.
In the Cruzeiro mine, sample KM066 is particularly rich in Sr, U, Th, and As, as well as in Be and Ta, which indicates its high differentiation degree compared to sample WR044 from the same locality. Finally, in the Urubu pegmatite, the three samples KM117, KM118, and KM119 show similar trace-element contents, while KF081 is poorer in Ca, Mn, Zn, and Pb but richer in Ga. The high Ga content of this sample, as well as its low Zn content, indicates a high differentiation degree, confirmed by the presence of Hf-rich zircon in close association (Table 1).
REE contents observed in our tourmaline samples (Table 4, Fig. 6b) are mostly depleted compared to chondrites, except for the Ca-rich sample WR045. Light REEs (LREEs) are well represented, but heavy REEs (HREEs) are absent or very close to the detection limit of the GemTOF instrument. These REE contents are comparable to those of the literature but close to the higher reported values (Marks et al., 2013; Trumbull et al., 2018). The concave profile of the LREE pattern, oriented upwards, has already been reported by Marks et al. (2013) and Trumbull et al. (2018), and the positive Eu anomaly observed for sample KM119 has already been described by Marks et al. (2013) in hydrothermal crystals but not in their pegmatitic tourmalines. The marked positive anomaly in Sm, observed in some samples (Fig. 6b), has never been reported in the literature.
The two samples KM076 and KM132 originate from two different pegmatites, but they show very low REE contents and are very rich in Zn, thus indicating their poor differentiation degree. The calcium-rich sample WR045 is very rich in REEs and shows a linear decreasing tendency not previously described in the literature. Its REE profile is relatively similar to the pegmatitic profile described by Marks et al. (2013), but the REE amounts are globally much more important here.
The present paper gives a detailed crystal–chemical investigation of 17 tourmaline samples from different pegmatites of Minas Gerais, Brazil. The combined approach, including single-crystal X-ray data, electron-microprobe, and GemTOF analyses, gives new insights in the complex crystal chemistry of this mineral group.
The samples generally belong to the schorl–elbaite and the fluor-schorl to fluor-elbaite series, but some samples clearly show different chemical compositions, for example sample WR045, which is particularly enriched in calcium, and sample KM132, which corresponds to a rossmanite. Major observed substitution mechanisms are from elbaite to schorl (0.5 YAlLiFe2+), from elbaite to rossmanite (XNaLiAl3+), from elbaite to liddicoatite (XNaAlCaLi+), or from schorl to oxy-foitite (0.5 XNaFe(OH)AlO2−). The mechanism XNaFeAl3+ explains the observed positive correlation between Al and the vacancy content of the X site.
Most chemical and crystal–chemical correlations had already been established in the abundant literature on tourmalines. However, the detailed interpretations of the trace-element behaviours and comparison with their crystal–chemical data allow a better understanding of the boundaries between the pure geochemical pegmatitic influence and the crystal–chemical constraints. Simple correlations, such as those between the (Li + Al) contents and the unit-cell parameters, will certainly be useful to semi-qualitatively determine the lithium content of these minerals using simple X-ray powder diffraction data.
All data are available upon request to Florent Bomal or Frédéric Hatert.
The supplement related to this article is available online at https://doi.org/10.5194/ejm-37-709-2025-supplement.
The samples investigated herein were loaned by SP and FH; most of those samples were collected on the field by SP. The electron-microprobe analyses were performed by ME, the GemTOF analyses were performed by HW and PL, and the single-crystal structure refinements were conducted by FB. The manuscript was written by FB and FH, and crystal–chemical correlations were improved by MD. MG participated in the discussions during the PhD committee meetings of FB.
The contact author has declared that none of the authors has any competing interests.
Publisher's note: Copernicus Publications remains neutral with regard to jurisdictional claims made in the text, published maps, institutional affiliations, or any other geographical representation in this paper. While Copernicus Publications makes every effort to include appropriate place names, the final responsibility lies with the authors.
Many thanks are due to Adam Pieczka and to the anonymous reviewer for their constructive comments.
This paper was edited by Giuseppe Cruciani and reviewed by Adam Pieczka and one anonymous referee.
Andreozzi, G. B., Gori, C., Skogby, H., Hålenius, U., Altieri, A., and Bosi, F.: Insights from the compositional evolution of a multi-coloured, zoned tourmaline from the Cruzeiro pegmatite, Minas Gerais, Brazil, Eur. J. Mineral., 37, 1–12, https://doi.org/10.5194/ejm-37-1-2025, 2025.
Barreto, S. B. and Bittar, S. M. B.: The gemstone deposits of Brazil: occurrences, production and economic impact, Boletín de la Sociedad Geológica Mexicana, 62, 123–140, 2010.
Basílio, M. S., Pedrosa-Soares, A. C., and Jordt-Evangelista, H.: Depósitos de alexandrite de Malacacheta, Minas Gerais, Geonomos, 8, 47–54, 2000.
Bilal, E., Mendes, J. C., Correia-Neves, J. M., Nasraoui, M., and Fuzikawa, K.: Chemistry of tourmalines in some pegmatites of São José da Safira Area, Minas Gerais, Brazil, Journal of the Czech Geological Society, 43, 33–38, 1998.
Bosi, F.: Tourmaline crystal chemistry, Am. Miner., 103, 298–306, 2018.
Bosi, F. and Lucchesi, S.: Crystal chemistry of the schorl-dravite series, Eur. J. Mineral., 16, 335–344, https://doi.org/10.1127/0935-1221/2004/0016-0335, 2004.
Bosi, F. and Lucchesi, S.: Crystal chemical relationships in the tourmaline group: Structural constraints on chemical variability, Am. Miner., 92, 1054–1063, 2007.
Bosi, F., Andreozzi, G. B., Federico, M., Graziani, G., and Lucchesi, S.: Crystal chemistry of the elbaite-schorl series, Am. Miner., 90, 1784–1792, 2005.
Buerger, M. J. and Parrish, W.: The unit-cell and space group of tourmaline (an example of the inspective equi-inclinaison treatment of trigonal crystals), Am. Miner., 22, 1139–1150, 1937.
Cassedanne, J. and Philippo, S.: Mineral and gem deposits of eastern Brazilian pegmatites, Publication du Musée d'Histoire Naturelle de Luxembourg, Luxembourg, 1, 674 pp., ISBN 978-2-919877-20-1, ISBN 978-2-919877-21-8, 2015.
Castañeda, C., Oliveira, E. F., Gomes, N., and Pedrosa-Soares, A. C.: Infrared study of OH sites in tourmalines from the elbaite-schorl series, Am. Miner., 85, 1503–1507, 2000.
Correia-Neves, J. M., Predosa-Soares, A. C., and Marciano, V. P.: A província pegmatítica oriental do Brasil à luz dos conhecimentos atuais, Revista Brasileira de Geociências, 16, 106–118, 1986.
De Oliveira, E. F., Castañeda, C., Eeckhout, S. G., Gilmar, M. M., Kwitko, R. R., De Grave, E., and Botelho, N. F.: Infrared and Mössbauer study of Brazilian tourmalines from different geological environments, Am. Miner., 87, 1154–1163., 2002.
De Souza, J. J. L. L., Abrahão, W. A. P., Mello, J. W. V., Silva, J., Costa, L. M., and Oliveira, T. S.: Geochemistry and spatial variability of metal(loid) concentrations in soils of the state of Minas Gerais, Brazil, Sci. Total Environ., 505, 338–349, 2015.
Dutrow, B. L. and Henry, D. J.: Complexly zoned fibrous tourmaline, Cruzeiro mine, Minas Gerais, Brazil: A record of evolving magmatic and hydrothermal fluids, Canadian Mineralogist, 38, 131–143, 2000.
Ertl, A., Henry, D. J., and Tillmanns, E.: Tetrahedral subsitutions in tourmalines: a review, Eur. J. Mineral., 30, 465–470, https://doi.org/10.1127/ejm/2018/0030-2732, 2018.
Federico, M., Andreozzi, G. B., Lucchesi, S., Graziani, G., and Mendes, J. C.: Compositional variation of tourmaline in the granitic pegmatite dykes of the Cruzeiro mine, Minas Gerais, Brazil, Canadian Mineralogist, 36, 415–431, 1998.
Ferreira, M., Fonseca, M., and Pires, F.: Pegmatitos mineralizados em água-marinha e topázio do Ponto do Marambaia, Minas Gerais: tipologia e relações com o Granito Caladão, Revista Brasileira de Geociências, 35, 463–473, 2005.
Gandini, A. L., Achtschin, A. B., Marciano, V. R., Bello, R. F., and Pedrosa-Soares, A. C.: Berilo, in: Gemas de Minas Gerais, edited by: Castañeda, C., Addad, J. E., and Liccardo, A., Belo Horizonte, Sociedade Brasileira de Geologia, 349 pp., 2001.
Gatta, G. D., Danisi, R. M., Adamo, I., Meven, M., and Diella, V.: A single-crystal neutron and X-ray diffraction study of elbaite, Phys. Chem. Miner., 39, 577–588, 2012.
Grice, J. D. and Ercit, T. S.: Ordering of Fe and Mg in the tourmaline crystal structure: The correct formula, Neues Jahrbuch für Mineralogie Abhandlungen, 165, 245–266, 1993.
Hamburger, E. and Buerger, M. J.: The structure of tourmaline, Am. Miner., 33, 532–540, 1948.
Hatert, F., Long G. J., Hautot, D., Fransolet, A.-M., Delwiche, J., Hubin-Franskin, M. J., and Grandjean, F.: A structural, magnetic, and Mössbauer spectral study of several Na-Mn-Fe-bearing alluaudites, Phys. Chem. Miner., 31, 487–506, 2004.
Hawthorne, F. C. and Dirlam, D. M.: Tourmaline the indicator mineral: from atomic arrangement to viking navigation, Elements, 7, 307–312, 2011.
Hawthorne, F. C. and Henry, D. J.: Classification of the minerals of the tourmaline group, Eur. J. Mineral., 11, 201–215, 1999.
Henry, D. J. and Dutrow, B. L.: The incorporation of fluorine in tourmaline: internal crystallographic controls or external environmental influences?, Canadian Mineralogist, 49, 41–56, 2011.
Henry, D. J. and Dutrow, B. L.: Tourmaline studies through time: contributions to scientific advancements, J. Geosci., 63, 77–98, 2018.
Henry, D. J., Novák, M. J., Hawthorne, F. C., Ertl, A., Dutrow, B. L., Uher, P., and Pezzotta, F.: Nomenclature of the tourmaline-supergroup minerals, Am. Miner., 96, 895–913, 2011.
Marks, M. A. W., Marschall, H. R., Schühle, P., Guth, A., Wenzel, T., Jacob, D. E., Barth, M., and Markl, G.: Trace element systematics of tourmaline in pegmatitic and hydrothermal systems from the Variscan Schwarzwald (Germany): The importance of major element composition, sector zoning, and fluid or melt composition, Chem. Geol., 344, 73–90, 2013.
Martin, R. F. and De Vito, C.: The late-stage miniflood of Ca in granitic pegmatites: an open-system acid-reflux model involving plagioclase in the exocontact, Canadian Mineralogist, 52, 165–181, 2014.
Mills, S. J., Hatert, F., Nickel, E. H., and Ferraris, G.: The standardisation of mineral group hierarchies: application to recent nomenclature proposals, Eur. J. Mineral., 21, 1073–1080, https://doi.org/10.1127/0935-1221/2009/0021-1994, 2009.
Momma, K. and Izumi, F.: VESTA 3 for three-dimensional visualization of crystal, volumetric and morphology data, Journal of Applied Crystallography, 44, 1272–1276, 2011.
Moreira, A. A. N. and Camelier, C.: Relevo, In Geografia do Brasil: Região Sudeste, v.3, Rio de Janeiro, Diretoria de Divulgação Centro Editorial Centro de Serviços Gráficos, 1–50, 1977.
Morteani, G., Preinfalk, C., and Horn, A. H.: Classification and mineralization potential of the pegmatites of the Eastern Brazilian Pegmatite Province, Mineralium Deposita, 35, 638–655, 2000.
Oxford diffraction: Crys Alis PRO, Oxford Diffraction Ltd, Abingdon, Oxfordshire, England, 2007.
Paiva, G.: Províncias pegmatíticas do Brasil, Boletim DNPM-DFPM, 78, 13–21, 1946.
Pedrosa-Soares, A. C., Pereira Monteiro, R. L. B., Correia-Neves, J. M., Leonardos, O. H., and Fuzikawa, K.: Metasomatic evolution of granites, northeast Minas Gerais, Brazil, Revista Brasileira de Geociências, 17, 512–518, 1987.
Pedrosa-Soares, A. C., Dardenne, M. A., Hasui, Y., Castro, F. D. C., and Carvalho, M. V. A.: Nota explicativa dos mapas geológico, metalogenético e de ocorrências minerais do Estado de Minas Gerais, Belo Horizonte, COMIG, 97 pp., 1994.
Pedrosa-Soares, A. C., Noce, C. M., Wiedemann, C. M., and Pinto, C. P.: The Araçuaí-West Congo Orogen in Brazil: An overview of a confined orogen formed during Gondwanland assembly, Precambrian Research, 110, 307–323, 2001a.
Pedrosa-Soares, A. C., Pinto, C. P., Netto, C., Araujo, M. C., Castañeda, C., Achschin, A. B., and Basílio, M. S.: A província gemológica oriental do Brasil, in: Gemas de Minas Gerais, edited by: Castañeda, C., Addad, J. E., Liccardo, A., Belo Horizonte, Sociedade Brasileira de Geologia, 349 pp., 2001b.
Pedrosa-Soares, A. C., Chaves, M., and Scholz, R.: Eastern Brazilian pegmatite province: Field trip guide, PEG2009 – 4th International Symposium on Granitic Pegmatites, 28 pp., https://doi.org/10.51359/1980-8208/estudosgeologicos.v32n2p37-51, 2009.
Pieczka, A.: Statistical interpretation of structural parameters of tourmalines: the ordering of ions in the octahedral sites, Eur. J. Mineral., 11, 243–251, 1999.
Pieczka, A., Szuszkiewicz, A., Szełęg, E., and Nejbert, K.: Calcium minerals and the late-stage Ca-metasomatism in the Julianna pegmatitic system, Góry Sowie block, SW Poland, Canadian Mineralogist, 57, 775–777, 2019.
Pinto, C. P., Drumond, J. B. V., and Féboli, W. L.: Projeto Leste, Etapas 1 e 2, Belo Horizonte, CPRM-COMIG, 2001.
Queiroz, H., Viana, R. R., Battilani, G. A., Laiame de Oliveira, L., Medeiros Borges, G., and Guerra, D. L.: Occurrence of complex pegmatites in the south of Tocantins state, Brazil, Asociación Geológica Argentina, Serie D, Publicatión Especial, 14, 157–159, 2011.
Renner, B. and Lehmann, G.: Correlation of angular and bond length distortion in TiO4 units in crystals, Zeitschrift für Kristallographie, Crystalline Materials, 175, 43–59, 1986.
Rosenberg, P. E. and Foit, F. F.: Fe2+-F avoidance in silicates, Geochim. Cosmochim. Ac., 41, 345–346, 1977.
Rudnick, R. L. and Gao, S.: Composition of the Continental Crust, in: Treatise on Geochemistry, edited by: Holland, H. D. and Turekian, K. K., Elsevier, Oxford, 1–51, ISBN 9780080959757, 2014.
Shannon, R. D.: Revised effective ionic radii and systematic studies of interatomic distances in halides and chalcogenides, Acta Crystallographica, A32, 751, https://doi.org/10.1107/S0567739476001551, 1976.
Sheldrick, G. M.: Crystal structure refinement with SHELXL, Acta Crystallographica, C71, 3–8, 2015.
Simmons, W. B. and Webber, K. L.: Pegmatite genesis: state of the art, Eur. J. Mineral., 20, 421–438, https://doi.org/10.1127/0935-1221/2008/0020-1833, 2008.
Taylor, S. R. and McLennan, S. M.: The Continental Crust: Its Composition and Evolution, Blackwell Scientific, Oxford, 312 pp., ISBN 0-632-01148-3, 1985.
Thomas, R. and Davidson, P.: Revisiting complete miscibility between silicate melts and hydrous fluids, and the extreme enrichment of some elements in the supercritical state – Consequences for the formation of pegmatites and ore deposits, Ore Geol. Rev., 72, 1088–1101, 2016.
Trumbull, R. B., Garda, G. M., Xavier, R. P., Cavalcanti, J. A. D., and Codeço, M. S.: Tourmaline in the Passagem de Mariana gold deposit (Brazil) revisited: major-element, trace-element and B-isotope constraints on metallogenesis, Mineralium Deposita, 54, 395–414, 2018.
Wang, H. A. O. and Krzemnicki, M. S.: Multi-element analysis of minerals using laser ablation inductively coupled plasma time of flight mass spectrometry and geochemical data visualization using t-distributed stochastic neighbor embedding: case study on emeralds, Journal of Analytical Atomic Spectrometry, 36, 518–527, 2021.
Warr, L. N.: IMA-CNMNC approved mineral symbols, Mineralogical Magazine, 85, 291–320, 2021.