the Creative Commons Attribution 4.0 License.
the Creative Commons Attribution 4.0 License.
 | 22 Jul 2025
Elbaite, the neotype material from the Rosina pegmatite, San Piero in Campo, Elba island, Italy
Ferdinando Bosi
Federico Pezzotta
Henrik Skobgy
Riccardo Luppi
Paolo Ballirano
Ulf Hålenius
Gioacchino Tempesta
Giovanna Agrosì
Jiří Sejkora
Elbaite, Na(Li1.5Al1.5)Al6(Si6O18)(BO3)3(OH)3(OH), is a mineral species of the tourmaline supergroup. A formal description of the neotype elbaite material, approved by the International Mineralogical Association's Commission on New Minerals, Nomenclature and Classification (IMA-CNMNC), is presented in this study. Elbaite occurs in the Rosina pegmatite, San Piero in Campo, Elba island, Italy (42°44′51.35′′ N, 10°12′38.02′′ E). Crystals show euhedral habitus, are up to 1.5 cm in length, and are colorless with a vitreous luster, conchoidal fracture, and white streak. Elbaite has a Mohs hardness of approximately 7, has a calculated density of 3.04 g cm−3, and is uniaxial negative. It has trigonal symmetry, space group R3m, a=15.8117(2) Å, c=7.0937(1) Å, V=1535.89(4) Å3, and Z=3. The crystal structure was refined to R1=2.12 % using 1783 unique reflections collected with MoKα X-ray intensity data. Crystal–chemical analysis resulted in the empirical formula X(Na0.71□0.28Ca0.01)Σ1.00Y(Al1.77Li1.16MnFe)Σ3.00ZAl6.00[T(Si5.94B0.06)Σ6.00O18](BO3)3V(OH)3W[(OH)0.48F0.23O0.29]Σ1.00.
The neotype elbaite originates from a nearly colorless crystal with a black to dark-green base. Chemical analysis shows a transition from Mn-rich schorl in darker areas to chemically homogeneous elbaite in lighter regions, with Fe and Mn contents decreasing significantly due to a (Li + Al) substitution. In the Rosina pegmatite, tourmaline is the primary boron mineral, increasing in abundance toward the core. Its composition reflects the pegmatite's geochemical evolution, with rising Li and Cs contents in deeper zones. Early crystallization of biotite, sekaninaite, and Fe-rich schorl removed Mg, Ti, and Fe from the system, allowing later-stage tourmaline to evolve into Fe-free, Mn-rich fluor-elbaite. The present elbaite crystals formed in cavities in the pegmatite's deeper sections. Low Mn and F contents resulted from spessartine and lepidolite crystallization, respectively. As a result, tourmaline near cavities evolved into homogeneous, nearly colorless elbaite prisms.
- Article
(3408 KB) - Full-text XML
-
Supplement
(336 KB) - BibTeX
- EndNote


Tourmalines are complex borosilicates that have been studied in terms of their crystal structure and crystal chemistry (e.g., Hawthorne, 1996; Hawthorne and Henry, 1999; Ertl et al., 2002; Novák et al., 2004, 2013; Agrosí et al., 2006; Bosi and Lucchesi, 2007; Henry and Dutrow, 2011; Bosi and Skogby, 2013; Cempírek et al., 2013; Bosi et al., 2015a; Bačík and Fridrichová, 2021). In accordance with Henry et al. (2011), the general chemical formula of tourmaline is written as XY3Z6T6O18(BO3)3V3W, where X = Na+, K+, Ca2+, □ (= vacancy); Y = Al3+, Fe3+, Cr3+, V3+, Mg2+, Fe2+, Mn2+, Li+; Z = Al3+, Fe3+, Cr3+, V3+, Mg2+, Fe2+; T = Si4+, Al3+, B3+; B = B3+; V = (OH)−, O2−; W = (OH)−, F−, O2−. Note that the un-italicized letters X, Y, Z, T, and B represent groups of cations hosted at the [9]X, [6]Y, [6]Z, [4]T, and [3]B crystallographic sites (letters italicized). As for the letters V and W, they represent groups of anions accommodated at the [3]-coordinated O(3) and O(1) crystallographic sites, respectively. The dominance of specific ions at one or more structural sites of the structure gives rise to a range of distinct mineral species, such as elbaite, ideally Na(Li1.5Al1.5)Al6(Si6O18)(BO3)3(OH)3(OH).
However, a complete crystal–chemical characterization and description of the holotype of elbaite species is currently lacking. Additionally, no type material has been deposited as permanent reference material in a museum or a nationally recognized mineral collection. Elbaite is one of the most important and diffuse borosilicates, and the lack of a holotype species may lead to confusion and inconsistencies in the identification of mineral specimens. Furthermore, no structural refinement data for elbaite crystals from Elba island have been published to date.
The first description of elbaite and the type locality appeared in Vernadsky (1914) and Schaller (1913). The former proposed the name “Elbait” for Li-, Na-, and Al-dominant tourmaline from Elba island, Italy, while Schaller (1913) assigned it to pale-red (nearly colorless) tourmaline crystals with determined density (3.04–3.05 g cm−3), refraction indices (ω= 1.650–1.652 and ε=1.630), and chemical analysis. The latter leads to the empirical formula
Ertl (2008) provided a historical review of elbaite and summarized the above information, pointing out that it is highly likely the type material of (pink) elbaite was found at Fonte del Prete, San Piero in Campo, Campo nell'Elba, Elba island, Livorno province, Tuscany, Italy.
In accord with Dunn and Mandarino (1987), a formal description of the neotype tourmaline elbaite – approved by the International Mineralogical Association's Commission on New Minerals, Nomenclature and Classification (IMA-CNMNC) (proposal 24-A) – is presented here. A neotype is a specimen chosen by the authors of a redefinition or re-examination of a species to represent the species when the holotype or cotypes cannot be found. Neotype material is deposited in the collections of the Museo Universitario di Scienze della Terra (MUST), Dipartimento di Scienze della Terra, Sapienza Università di Roma, Italy, with catalog number 33383/406.
The neotype specimen is from the Rosina pegmatite, which is located a few hundred meters south of the San Piero in Campo village, Elba island, Italy (geographic coordinates: 42°44′51.35′′ N, 10°12′38.02′′ E), about 174 m above sea level. Since its discovery in early 1990, the Rosina pegmatite has been mined for both collectibles and specimens suitable for scientific research (Pezzotta, 2021). The pegmatite is hosted in a porphyritic monzogranite at the eastern border of the Monte Capanne pluton and has a complex shape, trending roughly N–S with a variable dip angle of 40–75° W (Pezzotta, 2000). The major productive section of the body is ∼ 14 m long and 0.6–2.1 m wide. In general, the shallowest portions of the pegmatite body were characterized by mostly aplitic textures with minor coarse-grained pegmatitic lenses, whereas at greater depths the body becomes more pegmatitic and divides into two major branches that are interconnected by several small veinlets (Pezzotta, 2000; Bosi et al., 2022). The Rosina pegmatite belongs to the LCT (lithium, cesium, tantalum) family. This pegmatite is commonly miarolitic, with abundant small-to-medium pockets and a series of medium and occasionally large pockets (up to ∼ 80 dm3 in volume), and it is significantly asymmetric in terms of textures, mineralogy, and geochemistry. The axial core-miarolitic zone, which is rich in petalite and pollucite, with occasional concentrations of granular lepidolite, divides the body into a medium-grained lower section enriched in albite with minor K-feldspar, quartz, spessartine, patches of sekaninaite, and comb-texture tourmaline and an upper coarse-grained section enriched in K-feldspar with minor albite, quartz, and tourmaline. Cavities found at shallower levels contain dark tourmalines, together with pale-blue aquamarine and spessartine. In contrast, cavities found at deeper levels contain abundant polychrome and rose tourmalines with little to no Fe and variable Mn content, pink beryl (morganite), petalite, pollucite, and spessartine (Orlandi and Pezzotta, 1996; Pezzotta, 2000; Bosi et al., 2022).
Some miarolitic cavities of small to medium size (from a few centimeters up to a couple of decimeters in diameter) in the intermediate and the deepest portions of the dike provided a number of well-shaped, lustrous, elongated tourmaline crystals characterized by a black to dark-green base and a gem, with nearly colorless (or very pale pink) upper portion, up to 1.5 cm in length. The neotype material for elbaite has been selected from a group of such nearly colorless crystals (Fig. 1). The cavity in which these crystals were found, measuring approximately 25 × 20 × 8 cm, was named the “Geode delle Farfalle” (butterfly geode).
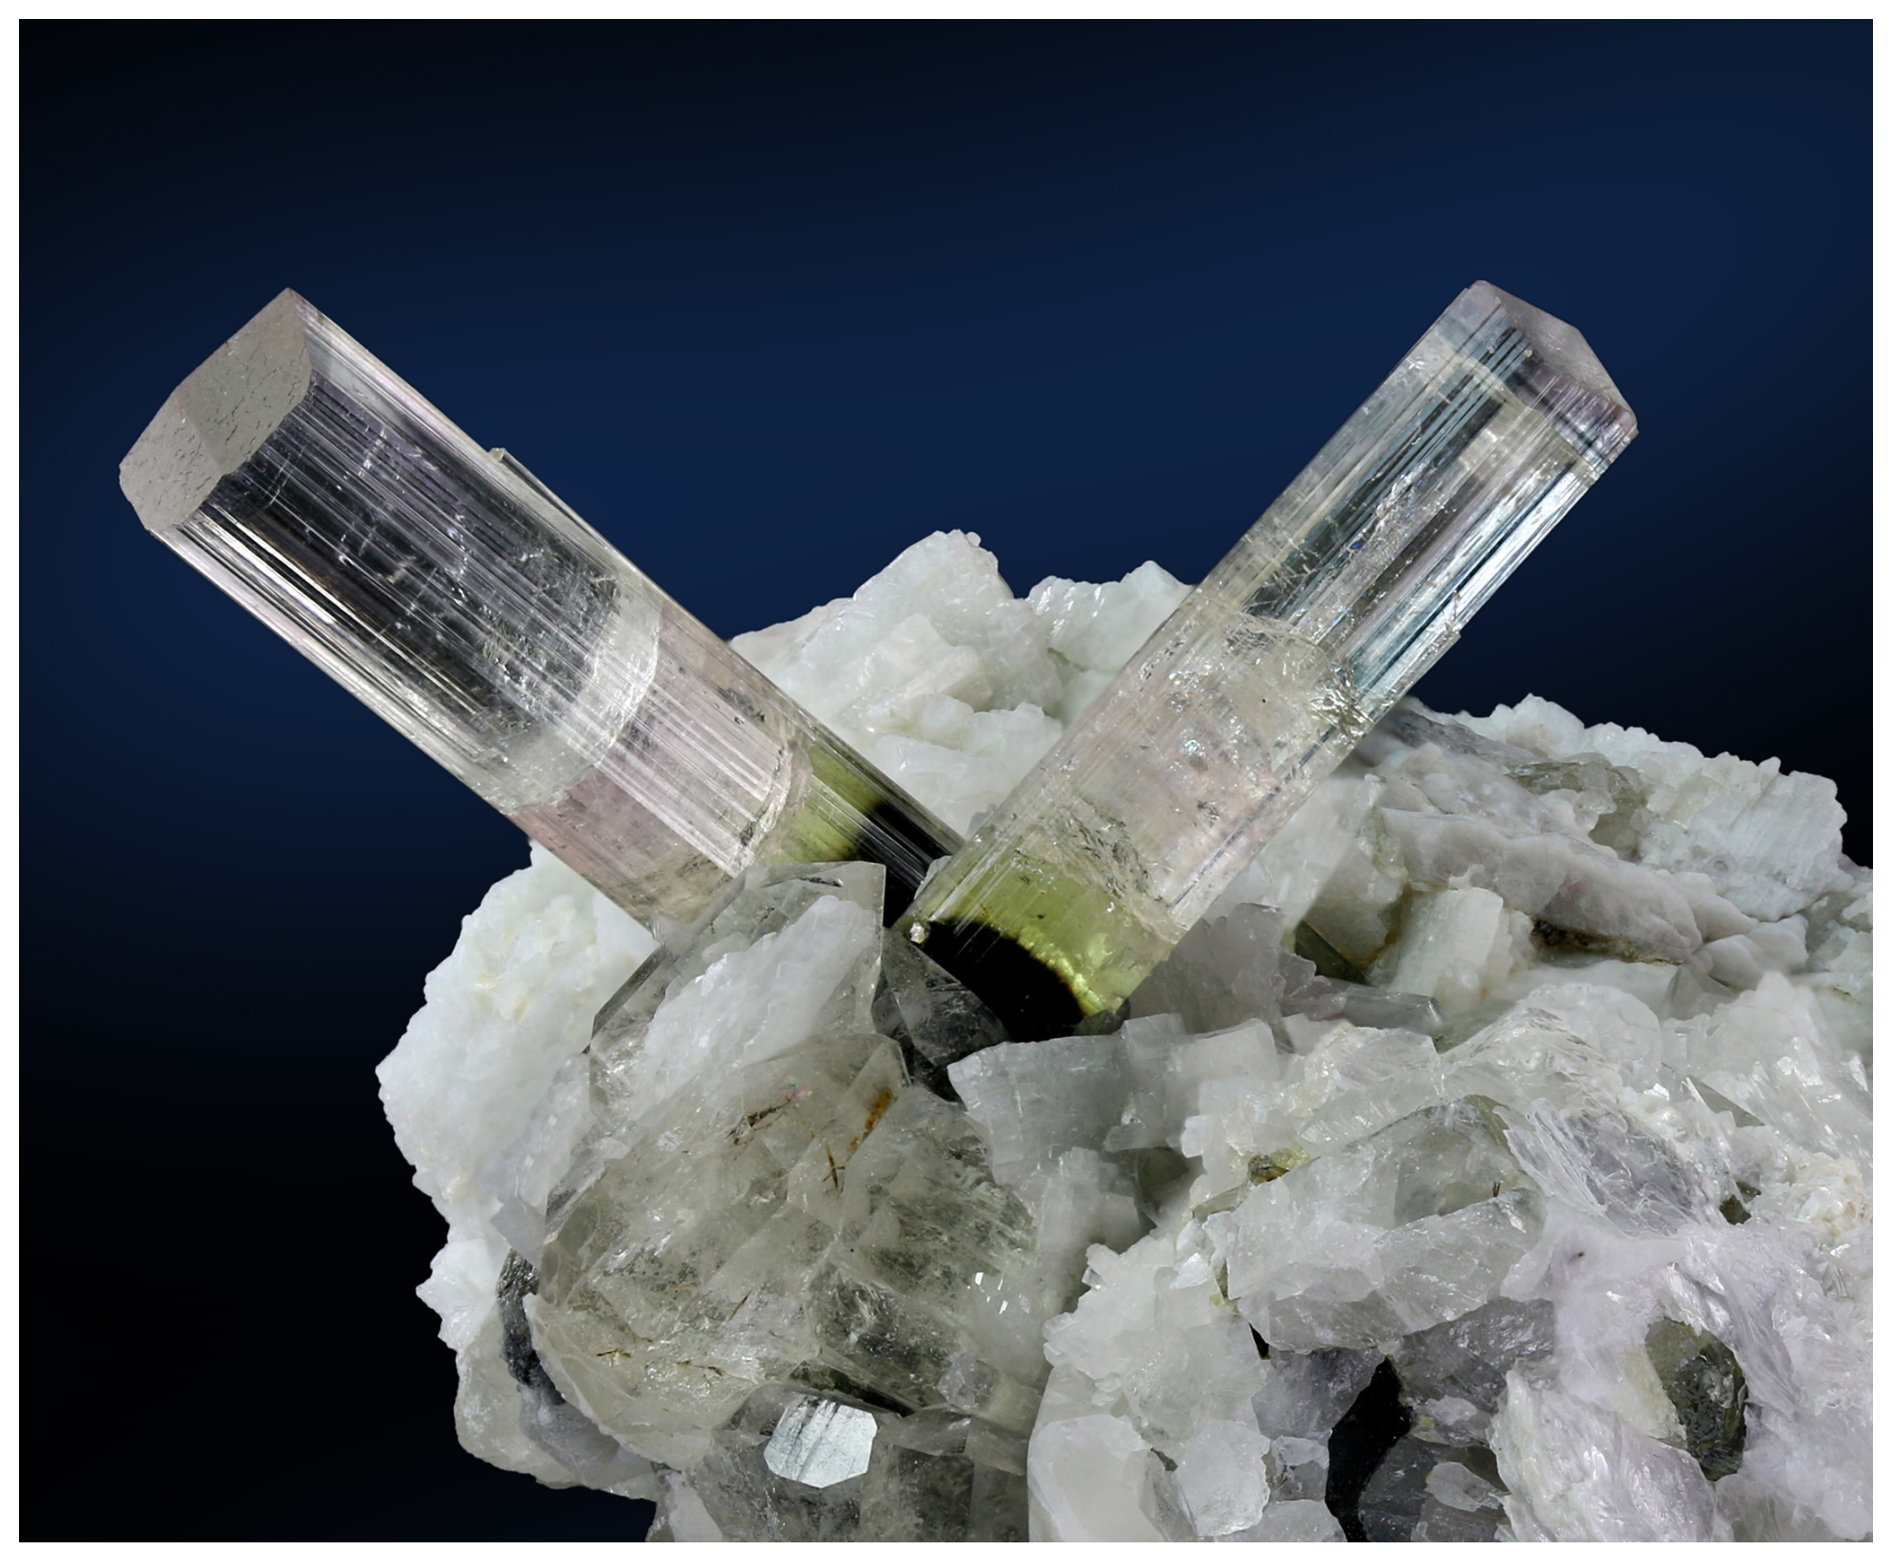
Figure 1Elbaite crystals up to 2.6 cm in length on a matrix with albite and quartz; Rosina pegmatite, San Piero in Campo, Elba island; MUM – Museo Mineralogico Luigi Celleri specimen. Photo by Antonio Miglioli.
The elbaite crystals show euhedral habitus, are up to 1.5 cm in length, and are colorless with a vitreous luster (Fig. 1). The observed forms are {10–10}, {11–20}, {10–11}, and {02–20}. Elbaite has a white streak and shows no fluorescence. It has a Mohs hardness of approximately 7 (based on scratch tests) and is brittle with a conchoidal fracture. The calculated density, based on the empirical formula and unit-cell volume refined from single-crystal X-ray diffraction (XRD) data, is 3.04 g cm−3. In thin section, elbaite is transparent; in transmitted light, pleochroism was not observed in the investigated thin-section fragment. Elbaite is uniaxial negative with refractive indices ω=1.64(5) and ε=1.62(5), measured by the immersion method using white light from a tungsten source on a 40 µm thick section. The mean index of refraction, density, and chemical composition led to an excellent compatibility index () (Mandarino, 1981).
4.1 Microprobe analysis
Electron microprobe analysis (EMPA) was obtained using a wavelength-dispersive spectrometer (WDS mode) with a Cameca SX100 instrument, operating at an accelerating potential of 15 kV, a sample current of 10 nA, and 2 µm beam diameter. Minerals and synthetic compounds were used as standards: sanidine (Si, Al), wollastonite (Ca), almandine (Fe), TiO2 (Ti), LiF (F), albite (Na), and rhodonite (Mn). Magnesium, V, Cr, K, Zn, Ni, Ba, Cu, Cl, Co, and Pb were below detection limits (<0.03 wt %). The PAP routine was applied (Pouchou and Pichoir, 1991). The results (Table 1) represent mean values of 14 spot analyses.
Table 1Electron microprobe data (WDS mode) and complementary chemical data (wt %) for elbaite. Atoms per formula unit (apfu) normalized to 31 anions.

Note: errors for oxides and fluorine are standard deviations (in parentheses). a Calculated by stoichiometry, (Y + Z + T + B) = 18.00 apfu. b Oxidation state obtained by optical absorption spectroscopy. c Estimated by optical absorption spectroscopy. d Determined by micro-laser-induced breakdown spectroscopy.
4.2 Micro-laser-induced breakdown spectroscopy (µ-LIBS)
For the analysis, the Modì mobile LIBS instrument (Bertolini et al., 2006) equipped with a dual-pulse Nd:YAG laser, which emits two collinear laser pulses of about 20 ns FWHM (full width at half maximum) at a wavelength of 1064 nm, has been used. The pulse energy was set to 30 mJ per pulse, with an interpulse delay of 1 µs. The acquisition delay was set to 1 µs (from the second pulse), with a gate of about 1 ms (time-integrated acquisition). The laser pulses were focused on the sample surface using a petrographic optical microscope (OL 10×; NA 0.25; WD 14.75 mm).1 The diameter of the sampled area was typically around 7–10 µm on the surface, with a depth of about 1–2 µm. The LIBS signal was acquired by two AvanSpec-USB2 spectrometers (from Avantes, the Netherlands) in the wavelength range of 390–900 nm with 0.3 nm resolution for acquisition. The LIBS spectrum, once acquired, was processed via the proprietary LIBS++ software. The analysis is very fast (fractions of seconds per sample) and minimally invasive, since a single laser shot is used for the analysis of the samples. Quantitative data were obtained by generating a linear regression using the main Li emission line intensity (670.706 nm corresponding to resonance transition 1s2 2s>1s2 2p), which is particularly sensitive to Li amounts as verified in tourmaline in previous studies (Altieri et al., 2023; Rizzo et al., 2023; Bosi et al., 2021; Bosi et al., 2022; Fabre et al., 2002). The fit was made using spectra recorded on a NIST standard glass (SRM 610), tsilaisite (Bosi et al., 2012a), and a certified glass (FLX-SLAG1 by FLUXANA®). The measured Li2O content, 1.85(3) wt %, is very similar to that, 1.87 wt %, estimated using the procedure of Pesquera et al. (2016).
4.3 Single-crystal infrared spectroscopy
Polarized Fourier transform infrared (FTIR) absorption spectra were measured on a 49 µm thick doubly polished single-crystal section oriented parallel to the c axis. A Bruker Vertex spectrometer attached to a Hyperion 2000 microscope was used to collect spectra in the range 2000–13000 cm−1 at a resolution of 4 cm−1. Spectra recorded in polarized mode parallel to the crystallographic c axis show a weaker shoulder band at 3320 cm−1, two very intense off-scale bands around 3470 and 3585 cm−1, a strong band at 3653 cm−1, and a weak band at 3704 cm−1. Spectra obtained perpendicular to the c axis show considerably weaker bands, centered at 3475, 3584, and 3662 cm−1 (Fig. 2).
Note that the band at 3320 cm−1 is consistent with the presence of minor B along with Si in [4]-fold coordination (Kutzschbach et al., 2016), whereas the bands above 3650 cm−1 (3653, 3662, and 3704 cm−1), which is the region where bands due to (OH) at the W position are expected (e.g., Gonzalez-Carreño et al., 1988; Bosi et al., 2015b), indicate significant (OH) contents at the W position.
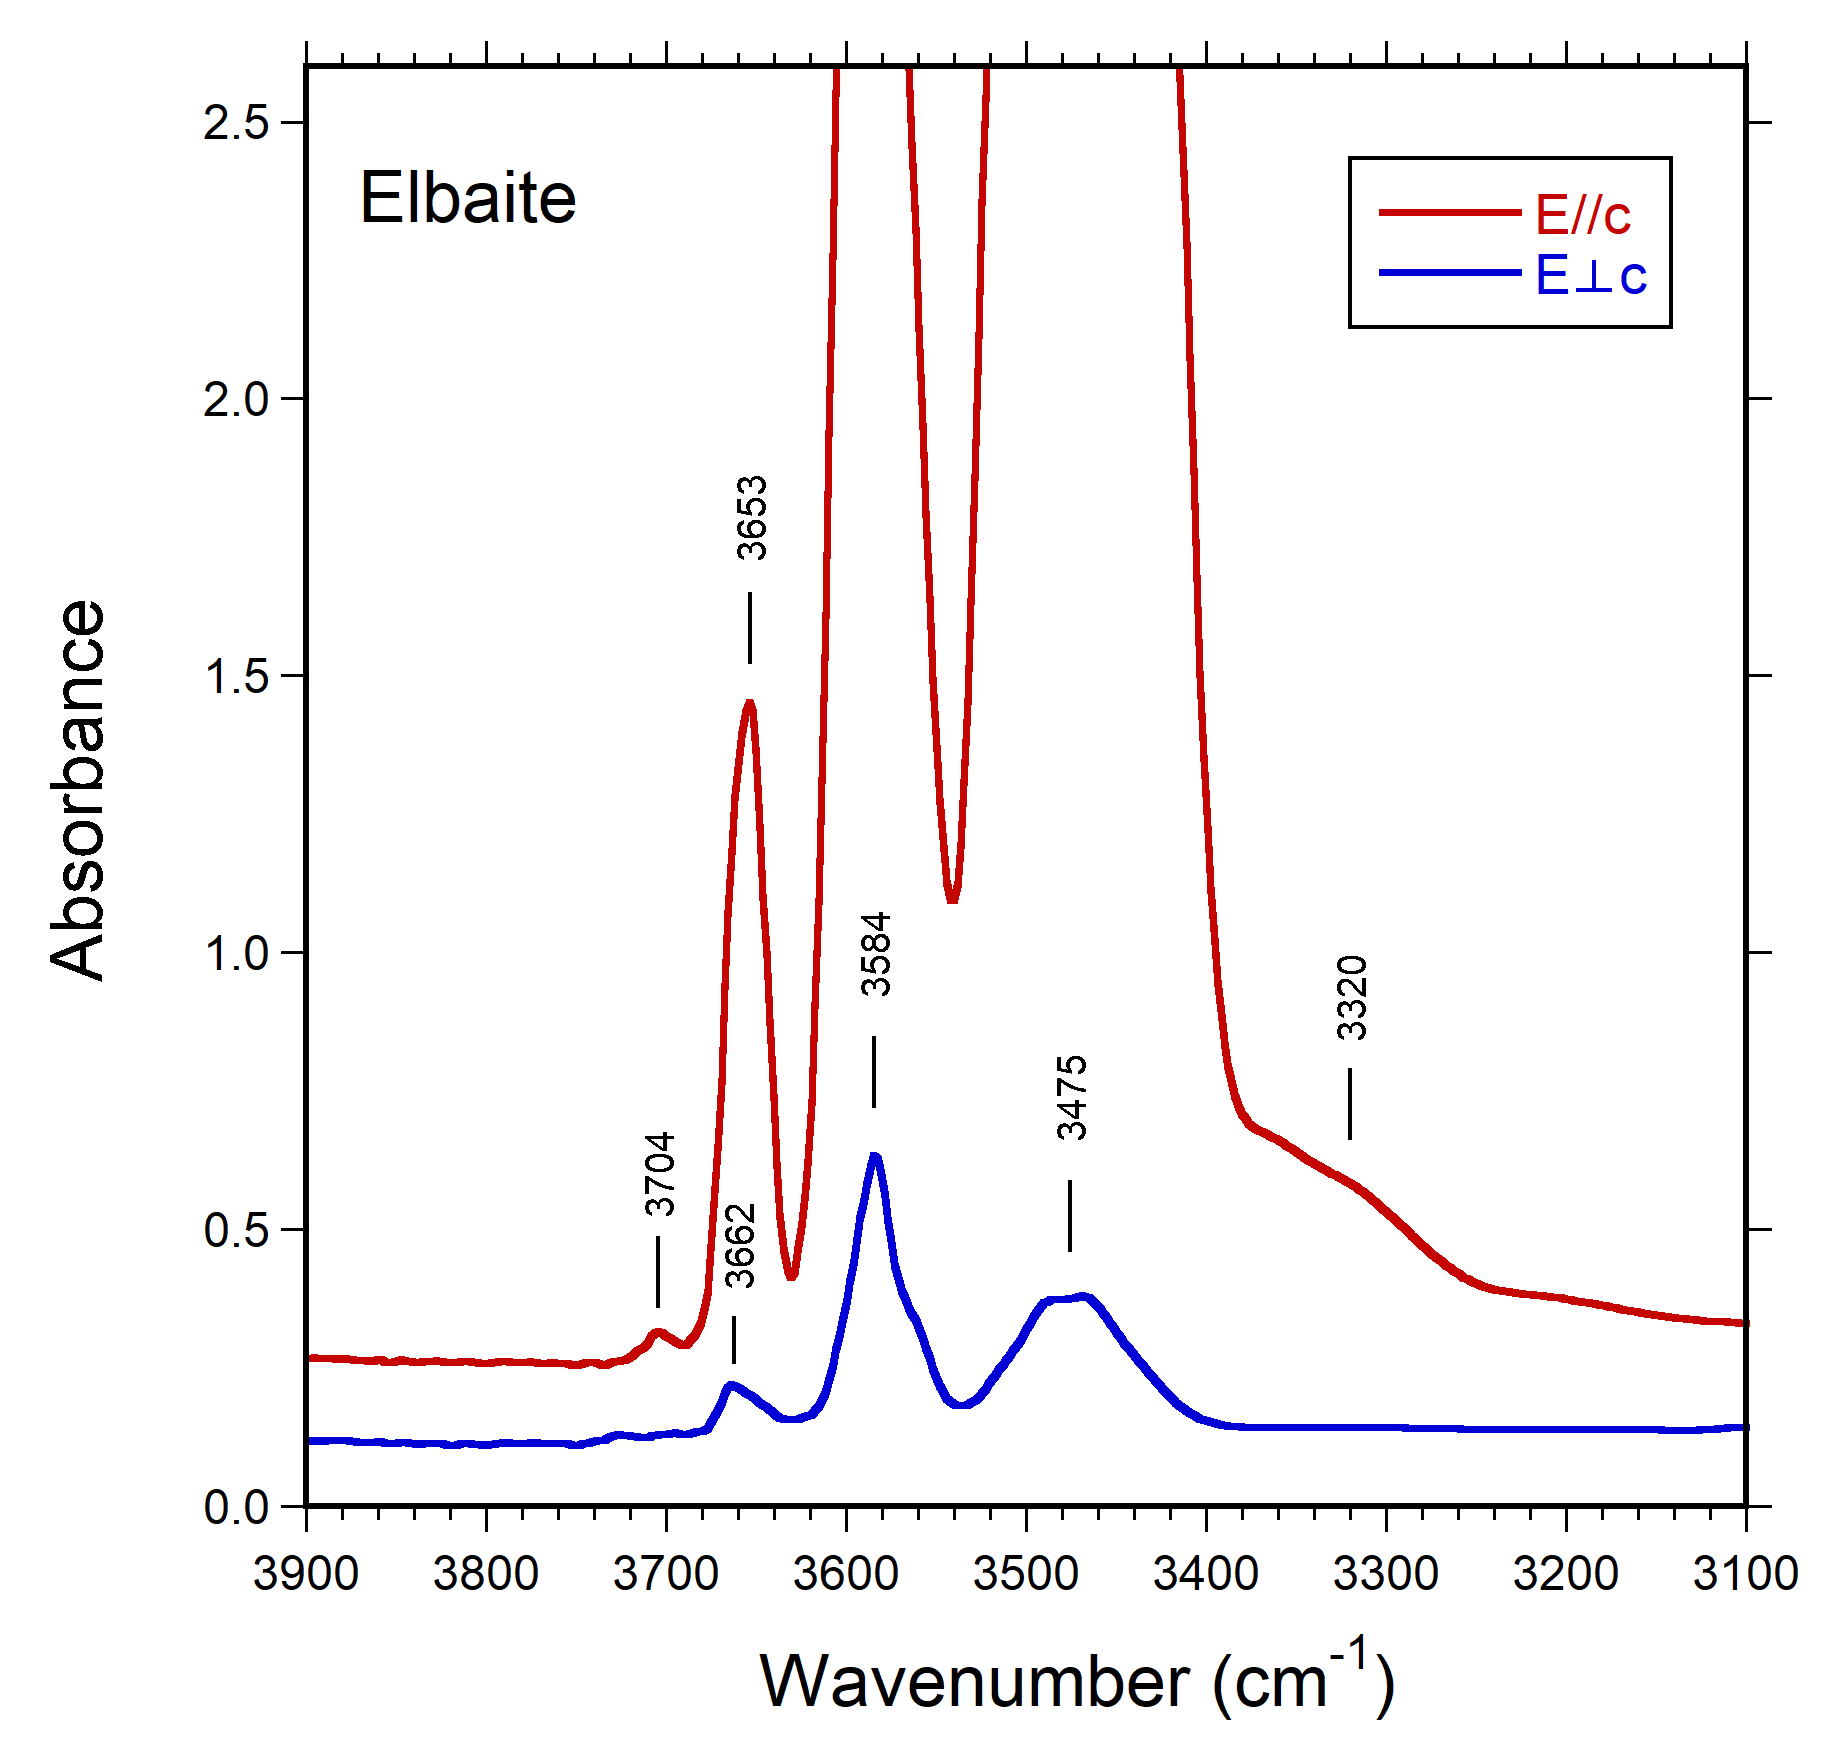
Figure 2Polarized FTIR spectra for elbaite. Note the bands above 3650 cm−1 corresponding to W(OH) contents at the O1 site. The main bands are truncated around 2.5 absorbance units in the E//c direction due to excessive absorption. Sample thickness is 49 µm.
4.4 Optical absorption spectroscopy (OAS)
Polarized optical absorption spectra of elbaite (Fig. 3) were acquired at room temperature on a doubly polished crystal with a thickness of 844 µm. An AVASPEC-ULS2048X16 spectrometer, connected via a 400 µm UV fiber cable to a Zeiss Axiotron UV microscope, was used. A 75 W xenon arc lamp was used as light source, and Zeiss Ultrafluar 10× lenses served as objective and condenser. A UV-quality Glan–Thompson prism, with a working range from 40 000 to 3704 cm−1, was used as polarizer. Spectra in the NIR range were taken from the FTIR measurements.
The recorded optical absorption spectra of untreated elbaite show no absorption bands. However, after treatment through electron irradiation, another fragment (thickness 937 µm) of colorless elbaite turned pale pink, and the absorption spectrum of the fragment showed an absorption band at ∼ 19000 cm−1 (Luppi, 2022). This absorption band is caused by a characteristic spin-allowed Mn3+ electron transition typical for red tourmalines (e.g., Bosi et al., 2021). In conclusion, the recorded spectra of the colorless elbaite show the absence of both Mn3+ and Fe3+. Consequently, Mn and Fe in neotype elbaite are considered to be divalent.
A broad and weak absorption band at ca. 11 000 cm−1 is assigned to a spin-allowed electronic transition in Cu2+. The band energy as well as the polarization of the band is consistent with published data on Cu-bearing tourmaline samples (Rossman et al., 1991). The net absorption of the band in our spectra, ∼ 0.04 mm−1 according to Rossman et al. (1991), would correspond to a CuO content of ∼ 0.02 wt %, which is below the detection limit for Cu in our EMPA measurements.
The narrow absorption bands recorded in the range 6500–7500 cm−1 represent overtones of the fundamental (OH)-stretching bands observed between 3300–3700 cm−1.
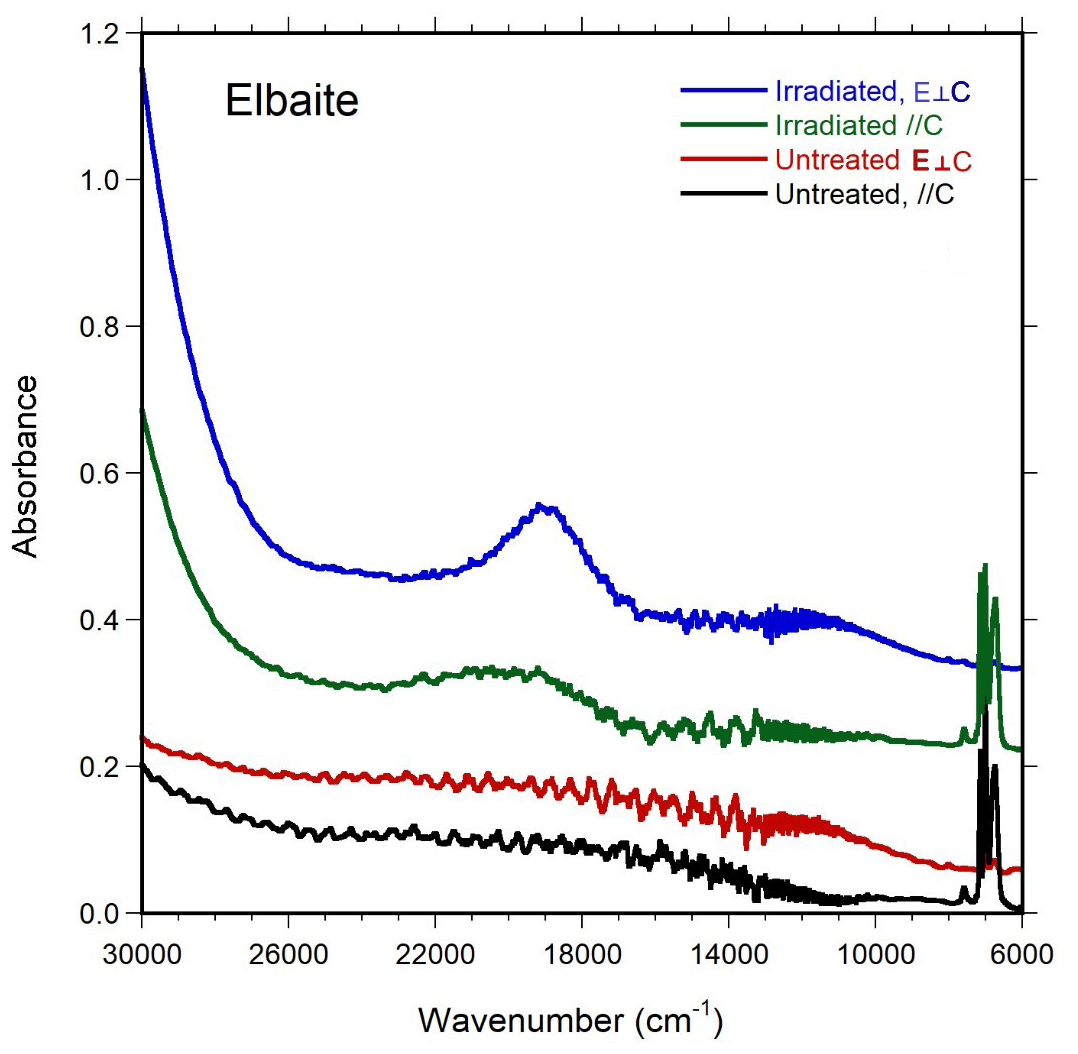
Figure 3Polarized optical absorption spectra of colorless and pink-red irradiated elbaite in the UV–Vis–NIR region.
4.5 Single-crystal structure refinement
A representative crystal of elbaite from the Rosina pegmatite (Elba island) was selected for X-ray diffraction measurements on a Bruker KAPPA APEX-II single-crystal diffractometer, equipped with a CCD area detector (6.2 × 6.2 cm active detection area, 512 × 512 pixels) and a graphite-crystal monochromator, using MoKα radiation from a fine-focus sealed X-ray tube. The sample-to-detector distance was 4 cm. A total of 1296 exposures (step = 0.5°, time per step = 20 s) covering a full reciprocal sphere with a redundancy of about 12 was collected using ω and φ scan modes. Final unit-cell parameters were refined using the Bruker AXS SAINT program on 4538 reflections with I>10σI in the range 5°<2θ<75°. The intensity data were processed and corrected for Lorentz, polarization, and background effects using the APEX2 software program of Bruker AXS. The data were corrected for absorption using a multiscan method (SADABS). The absorption correction led to an improvement in Rint from 0.0385 to 0.0334. No violation of R3m symmetry was detected.
Structure refinement (SREF) was done using the SHELXL-2013 program (Sheldrick, 2015). Starting coordinates were taken from Bosi et al. (2021). Variable parameters were the following: scale factor, extinction coefficient, atom coordinates, site-scattering values (for X, Y, and T sites), and atomic-displacement factors. Neutral atom scattering factors were used. In detail, the X site was modeled using the Na scattering factor. The occupancy of the Y site was obtained considering the presence of Al versus Li, and the T site was obtained with Si versus B. The Z, B, and anion sites were modeled with Al, B, and O scattering factors, respectively, and with a fixed occupancy of 1, because refinement with unconstrained occupancies showed no significant deviations from this value. The position of the H atom bonded to the oxygen at the O(1) (≡ W) and O(3) (≡ V) sites in the structure was taken from the difference Fourier map and incorporated into the refinement model; the O(1)-H(1) and O(3)-H(3) bond lengths were restrained (by DFIX command) to be 0.96 and 0.97 Å, respectively, with an isotropic displacement parameter constrained to be equal to 1.2 times that obtained for the O(1) and O(3) sites. There were no correlations greater than 0.7 between the parameters at the end of the refinement.
Details of data collection and refinement are given in Table 2. Atom coordinates, displacement parameters, and site occupancy factors are reported in Table 3. Table 4 reports selected bond distances; Table 5 reports the refined site-scattering values and optimized site populations. Bond-valence calculations, weighted according to the optimized site populations, are reported in Table 6. A Crystallographic Information File (CIF), showing all structural data, is deposited in the Supplement.
Table 2Single-crystal X-ray diffraction data for elbaite.
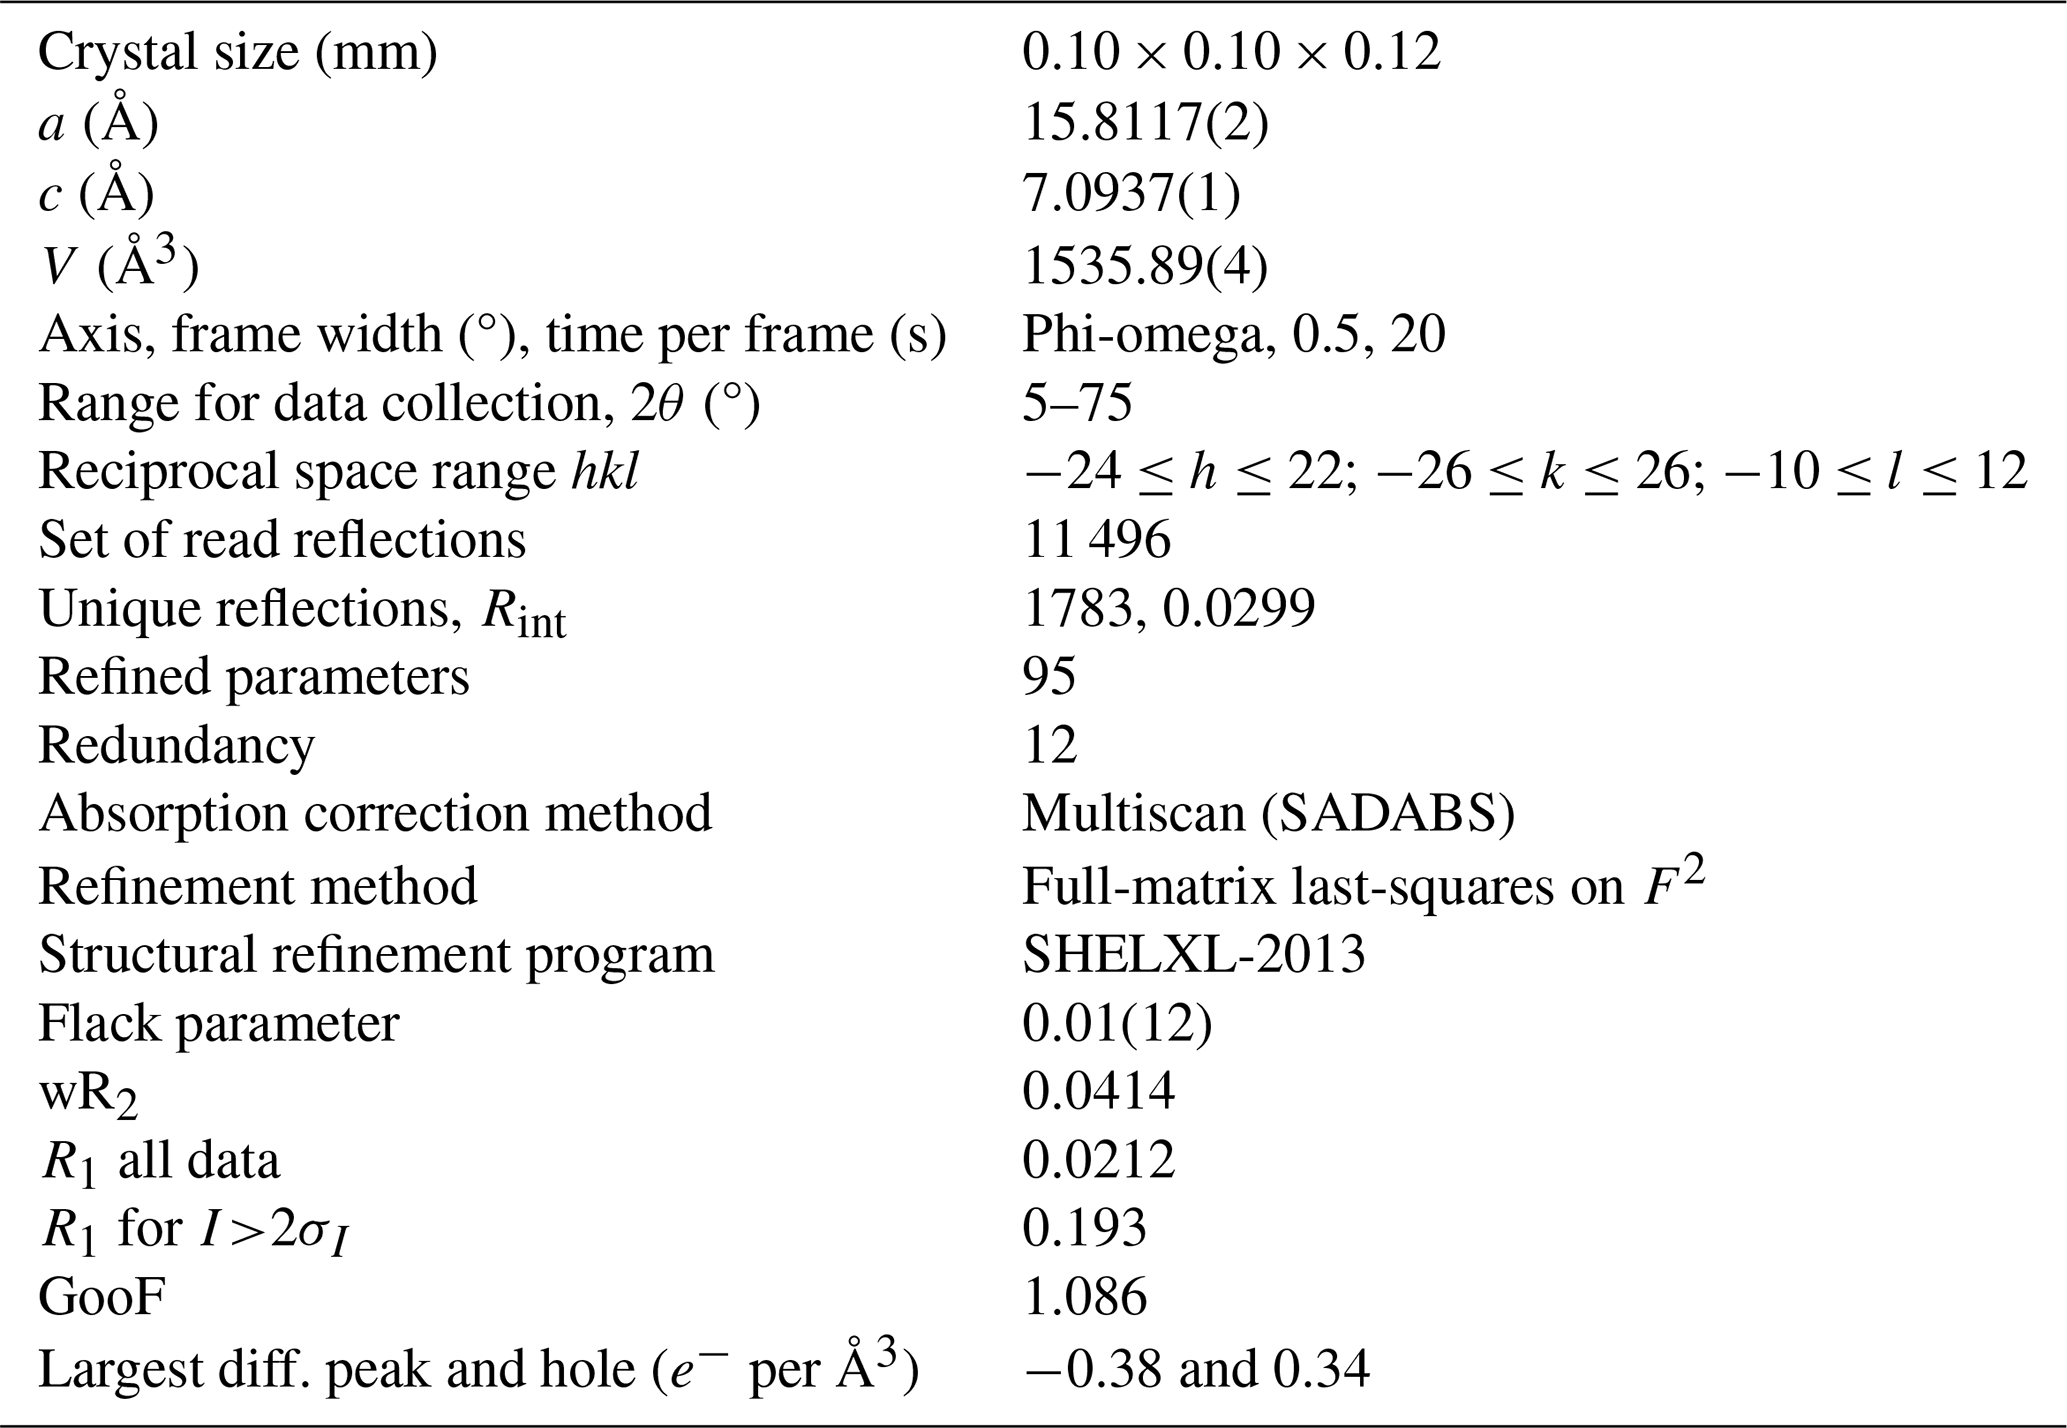
Notes: Rint= merging residual value; R1= discrepancy index, calculated from F data; wR2= weighted discrepancy index, calculated from F2 data; GooF = goodness of fit; diff. peak = maximum and minimum residual electron density. Radiation, MoKα= 0.71073 Å. Data collection temperature = 293 K. Space-group type is R3m; Z= 3.
Table 3Sites, Wyckoff positions, site occupancies (s.o.), fractional atom coordinates, and isotropic or equivalent-isotropic displacement parameters (in Å2) for elbaite.
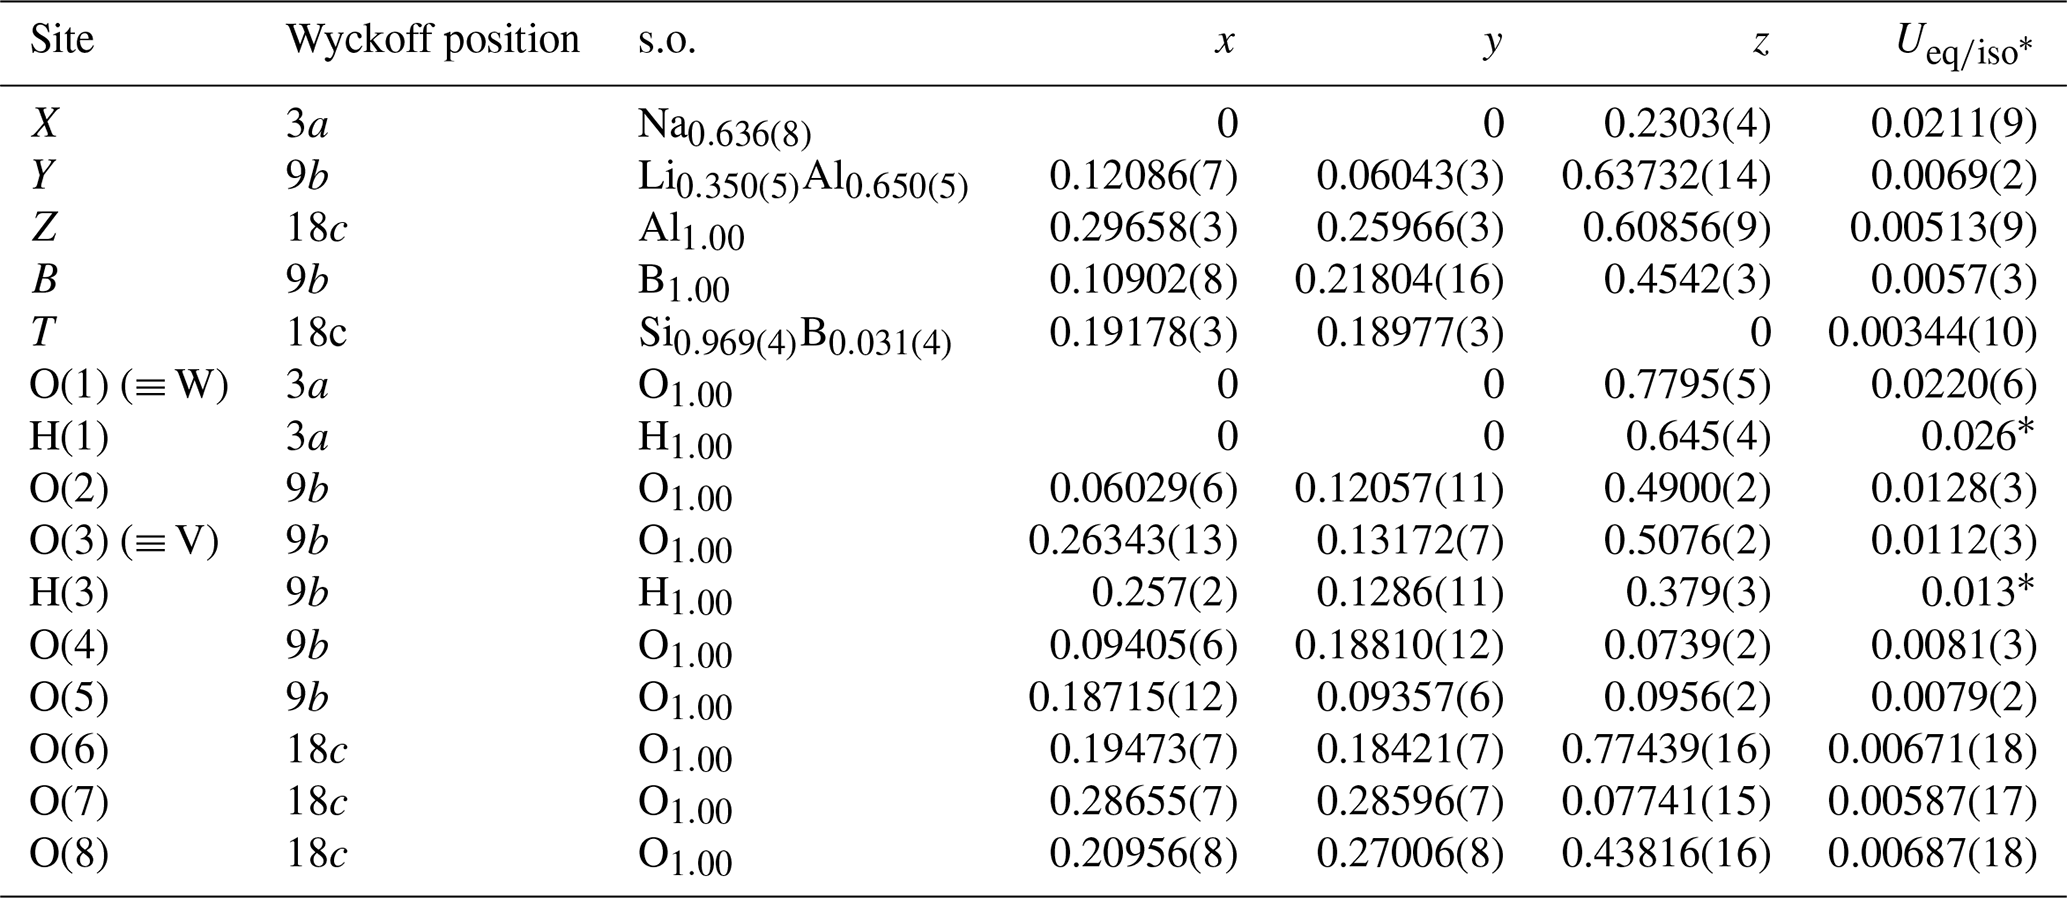
* Isotropic displacement parameters (Uiso) for H(1) and H(3) constrained to have a Uiso 1.2 times the Ueq value of the O(1) and O(3) oxygen atoms, respectively.
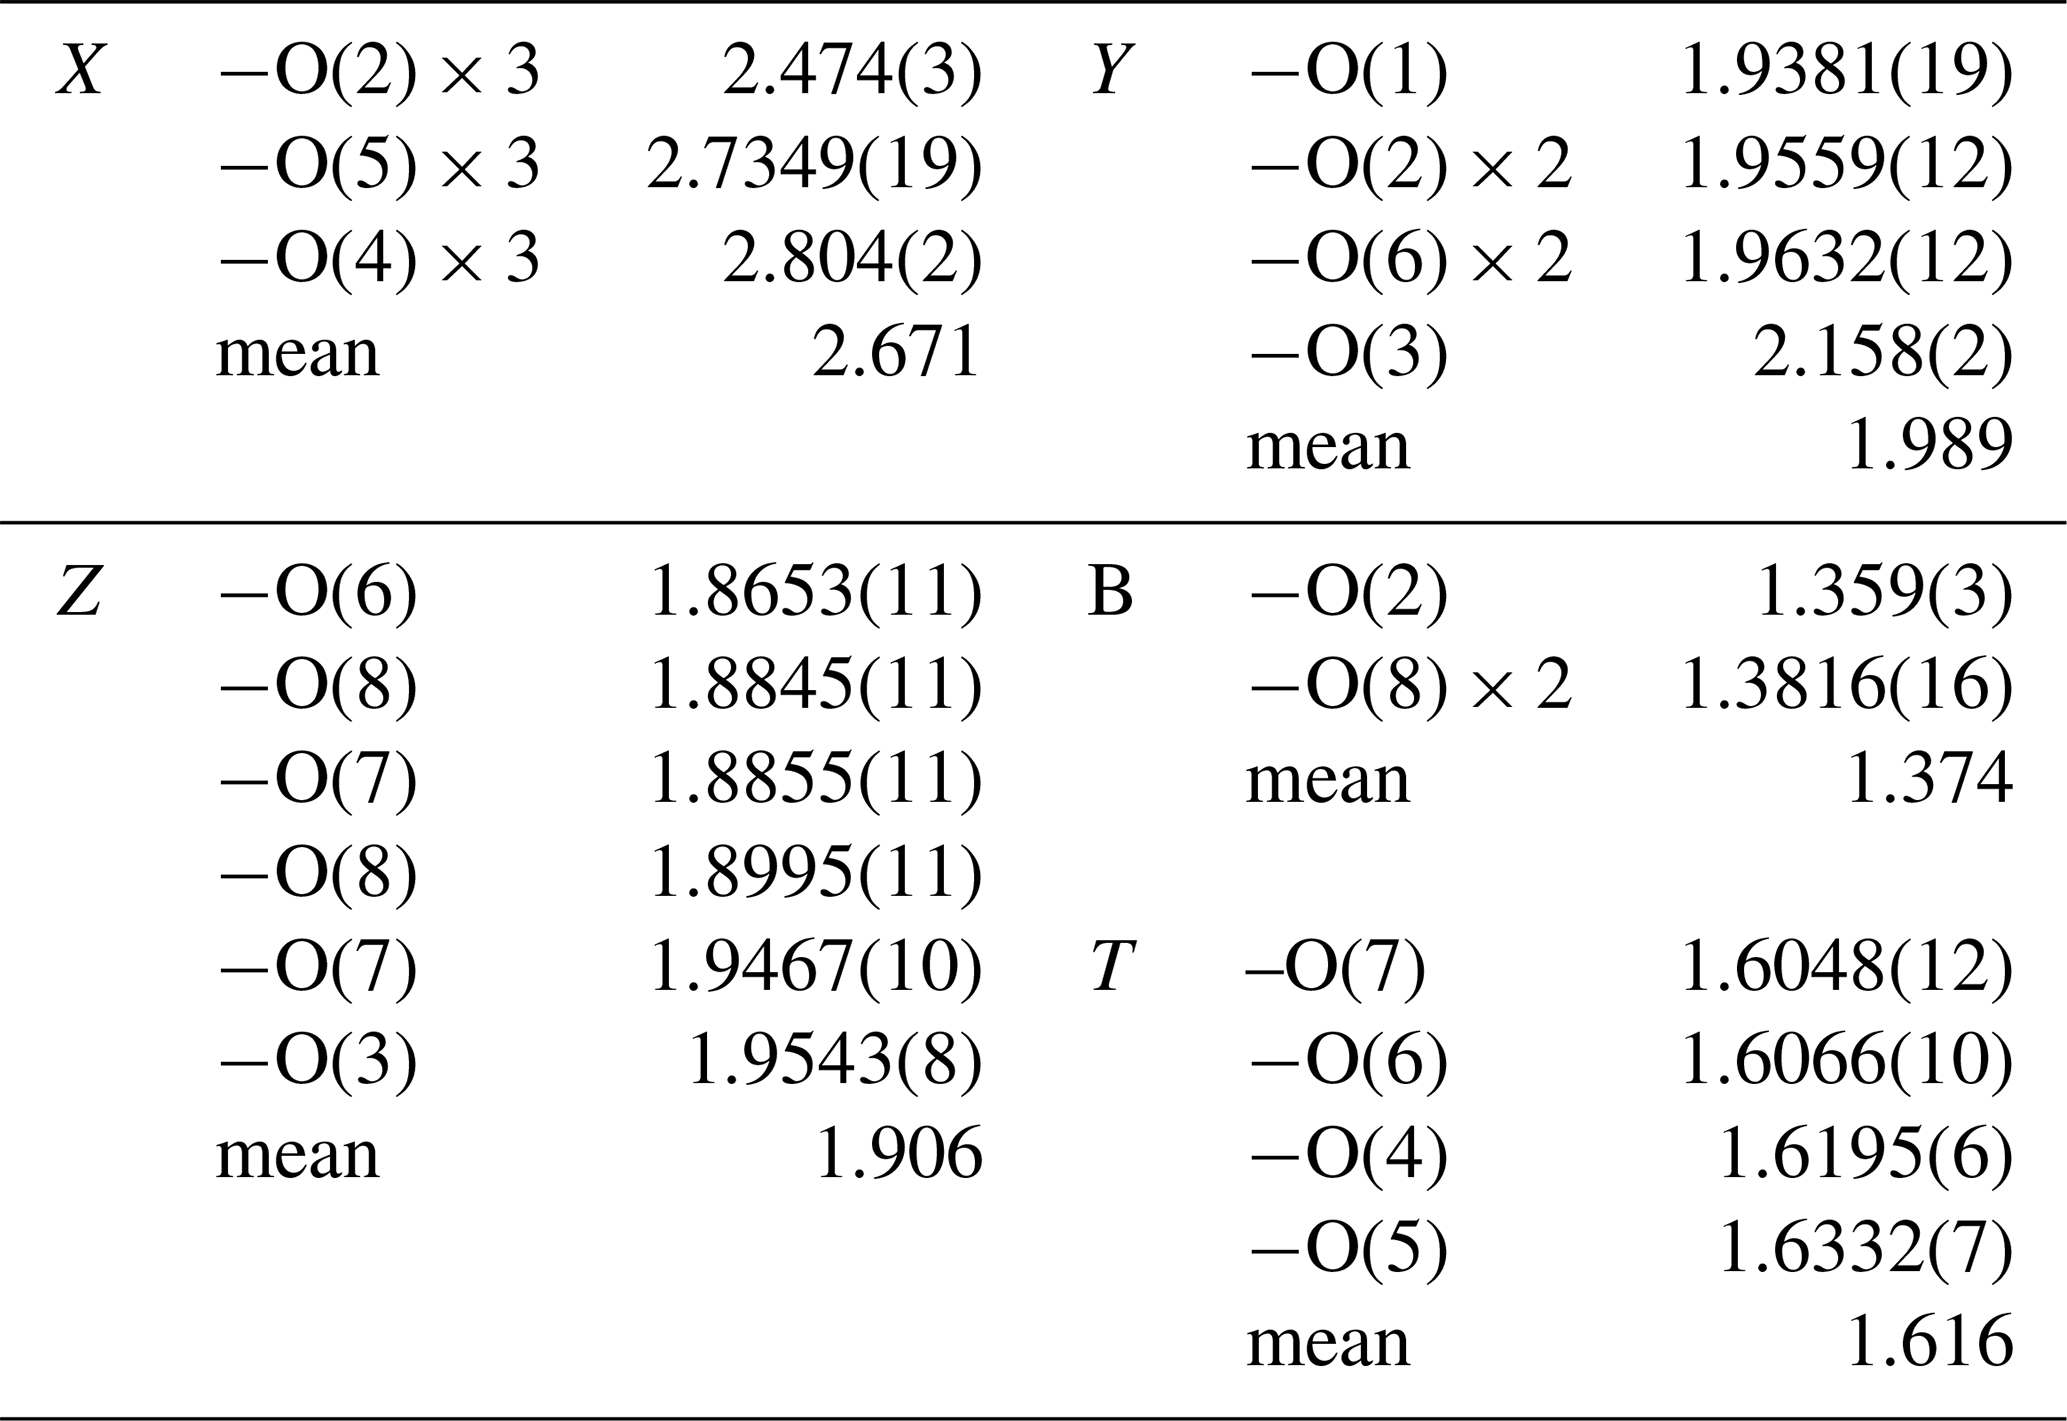
Table 5Site-scattering values and site populations for elbaite.
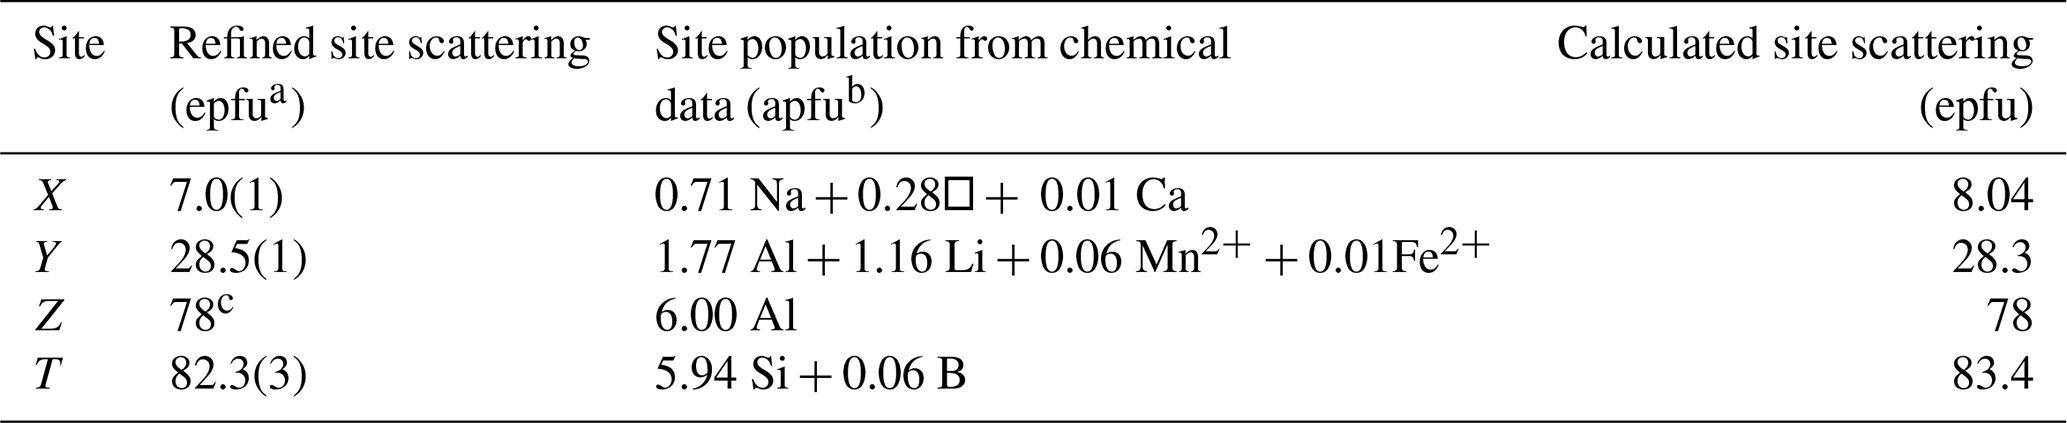
a electrons per formula unit. b atoms per formula unit. c fixed in the final stages of refinement.
Table 6Weighted bond valences (in valence units) and bond valence sum (BVS) for elbaite compared to mean formal charge (MFC) calculated from the empirical formula.
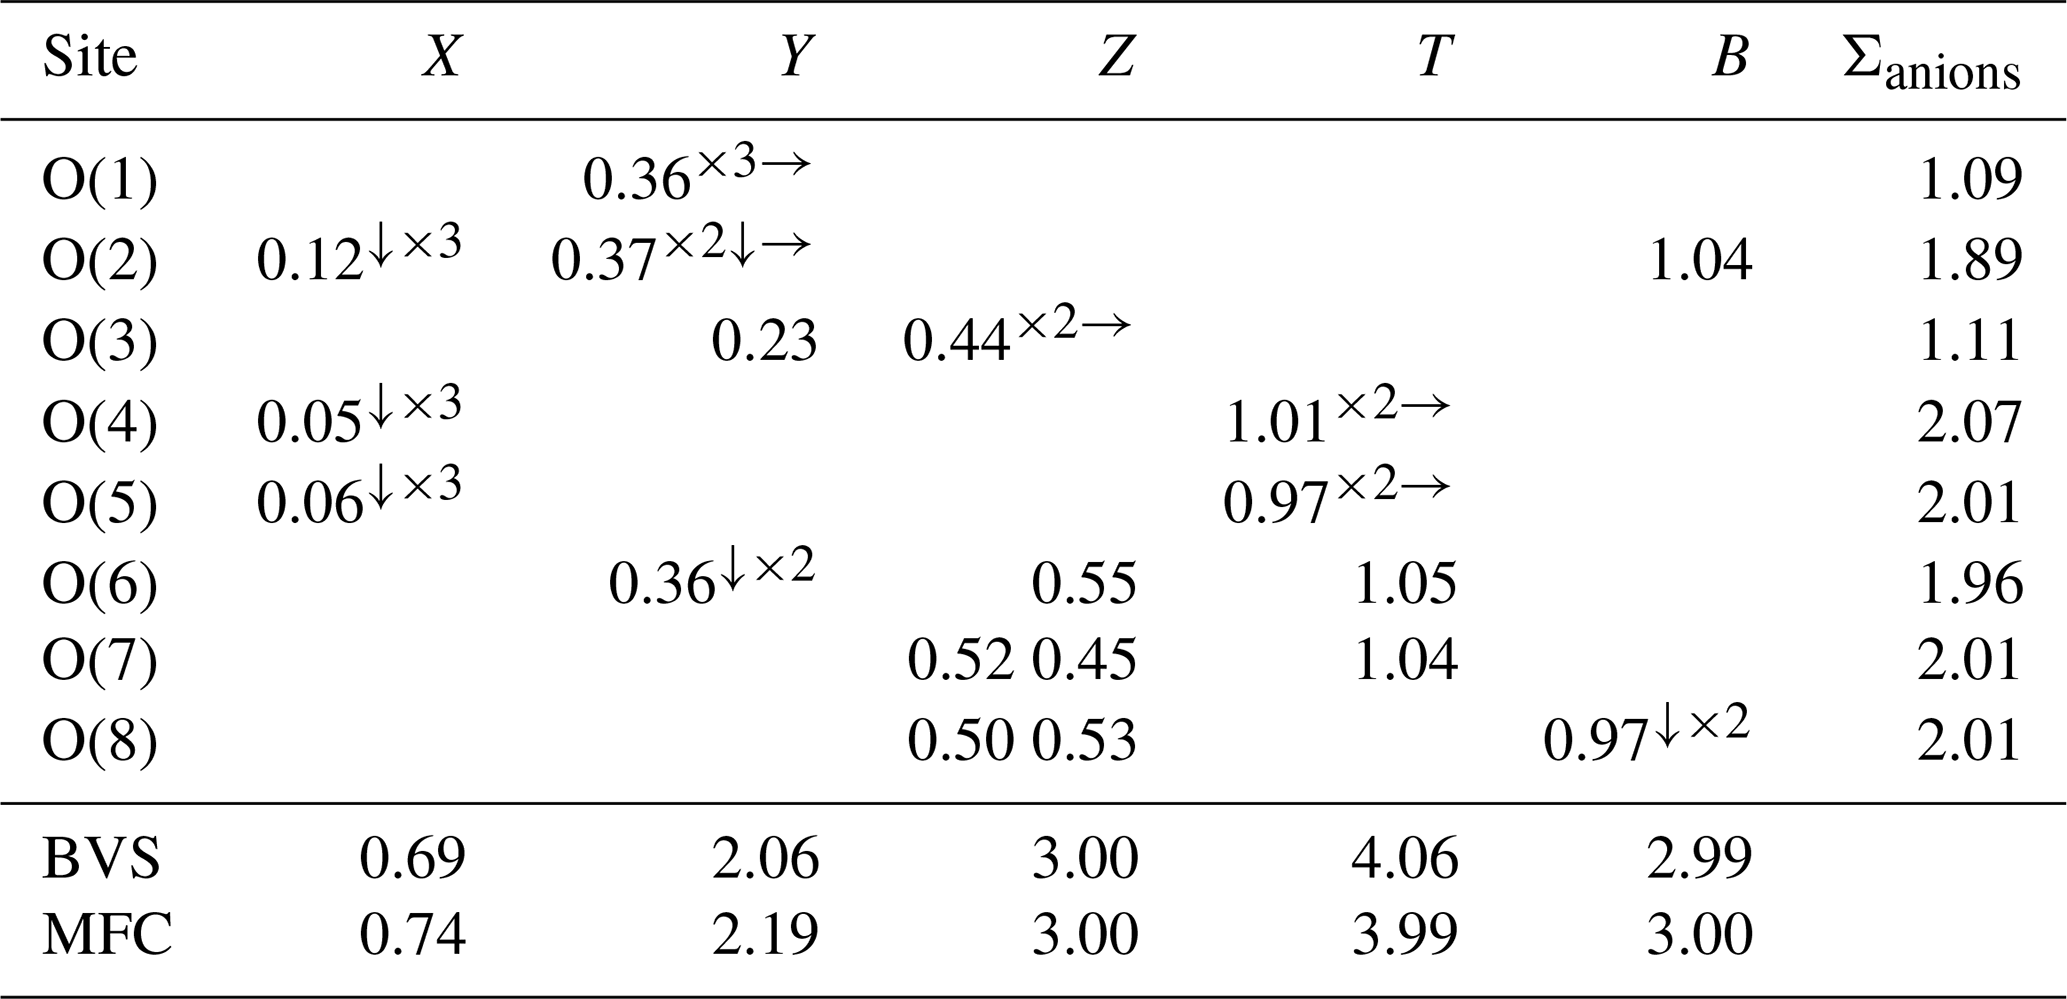
Notes: bond valence parameters from Gagné and Hawthorne (2015) and Brown and Altermatt (1985) for cation F bonds. Left and right superscripts indicate the number of equivalent bonds involving anions and cations, respectively.
4.6 X-ray powder diffraction
Powder X-ray diffraction data were collected on a Bruker AXS D8 Advance diffractometer equipped with incident beam focusing Göbel mirrors and a position-sensitive detector VÅntec-1 set to an opening angle of 6° 2θ. The instrument operates in vertical geometry in transmission mode. The resulting powder was loaded in a 0.3 mm diameter borosilicate glass capillary that was fixed and aligned on a standard goniometer head. Diffracted intensities were collected in the 6–145° 2θ angular range, 0.021798° 2θ step size, and 40 s counting time. Data were evaluated using Topas V6 software (Bruker AXS, 2016). The resulting indexed X-ray powder diffraction pattern is provided in Table 7, and the refined unit-cell parameters are as follows: a=15.81105(4) Å, c=7.09587(2) Å, V=1536.236(9) Å3, space group R3m, and Z=3.
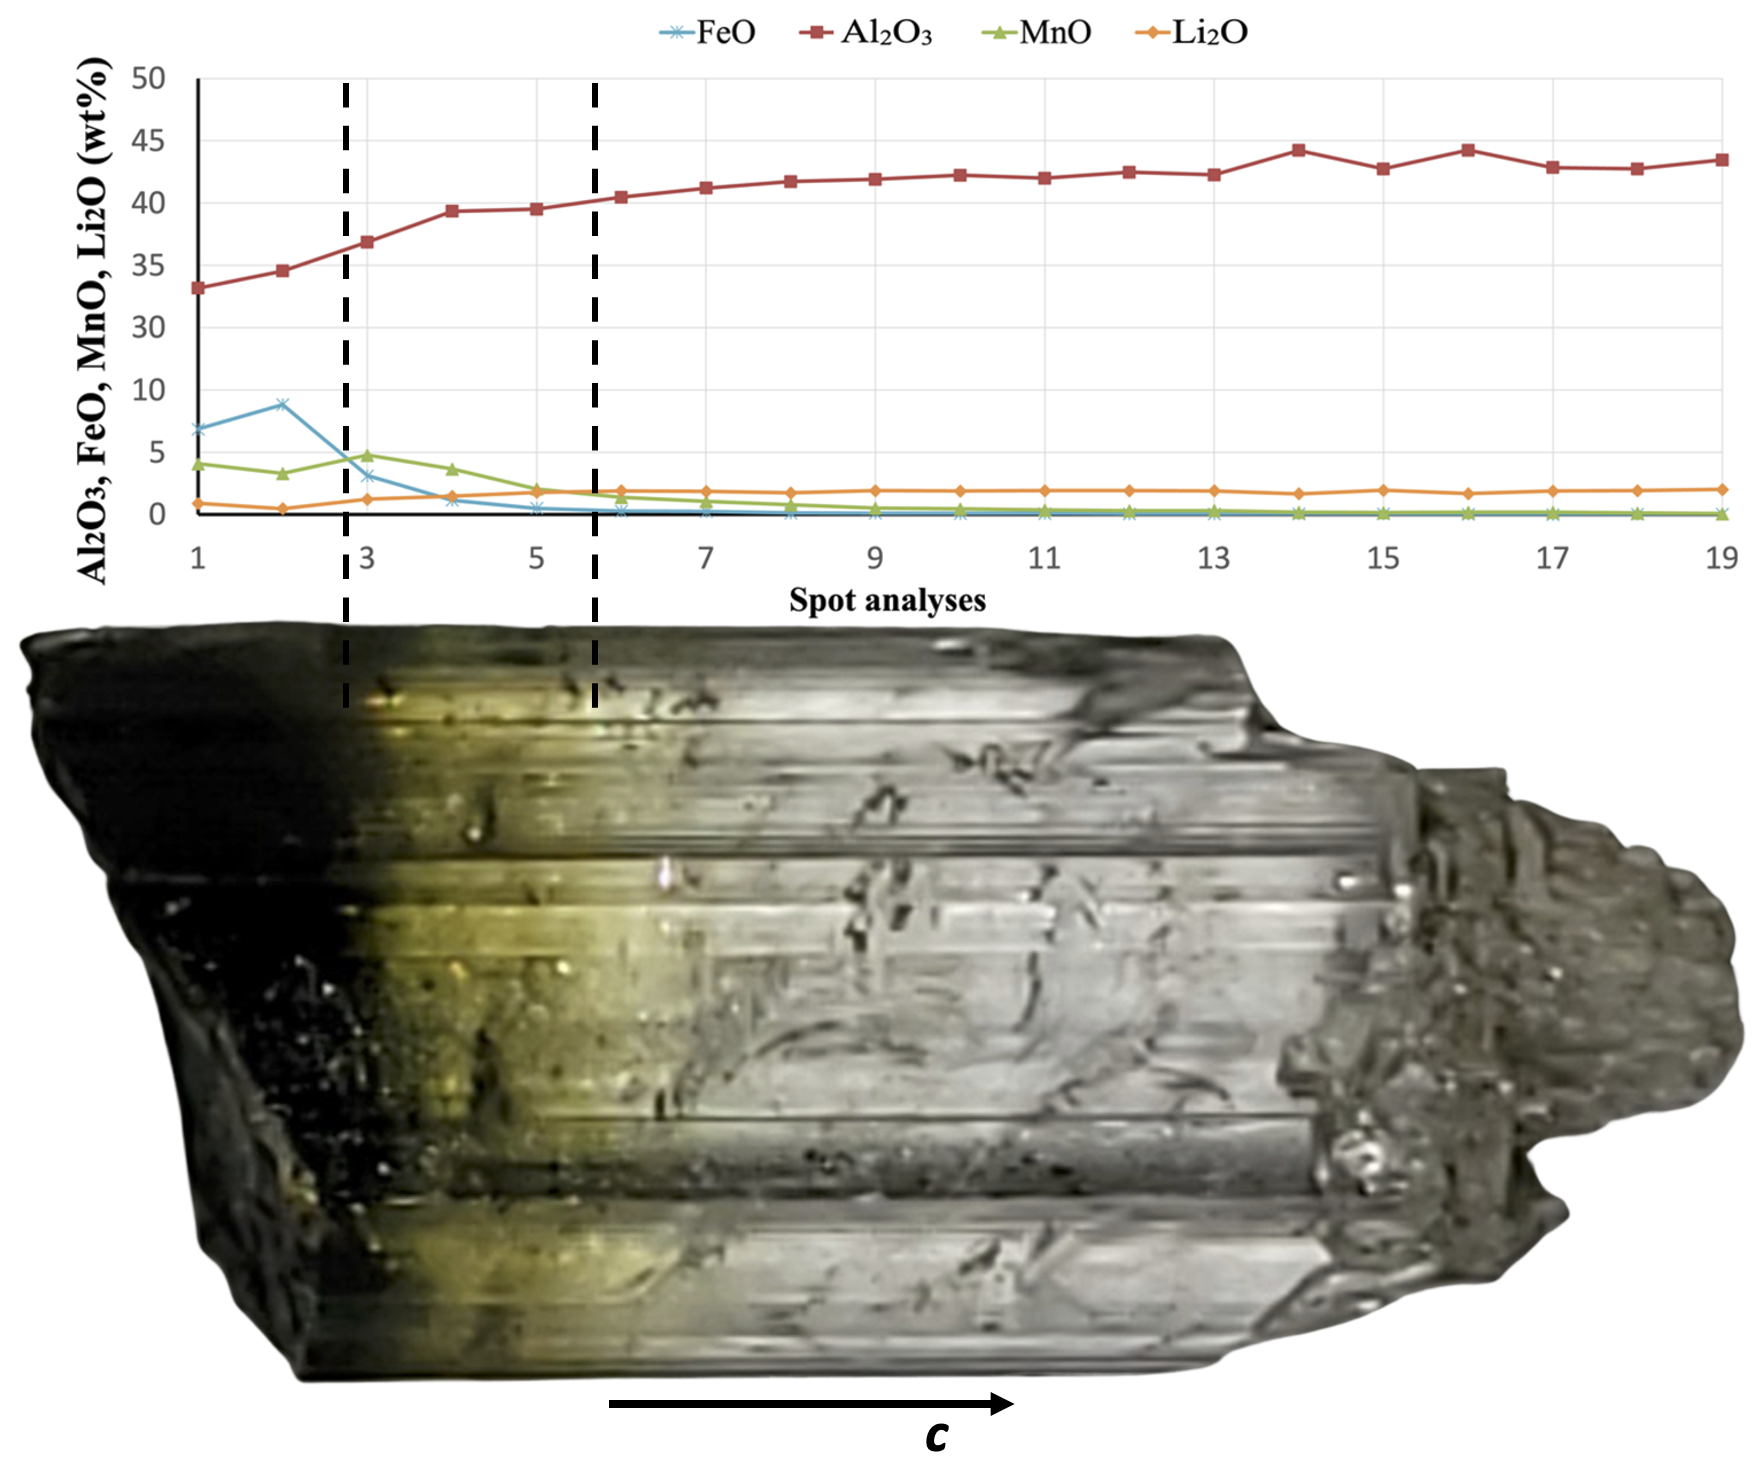
Figure 4Zoning of the tourmaline crystal containing elbaite from the Rosina pegmatite, San Piero in Campo, Elba island. Results of compositional analysis (wt %) obtained along a straight line parallel to the c axis (only selected oxides are reported). Photo of the neotype fragment, in reflected light, of colorless elbaite (on the right) and black to dark-green Mn-rich schorl (on the left). Field of view: about 1 × 3 cm.
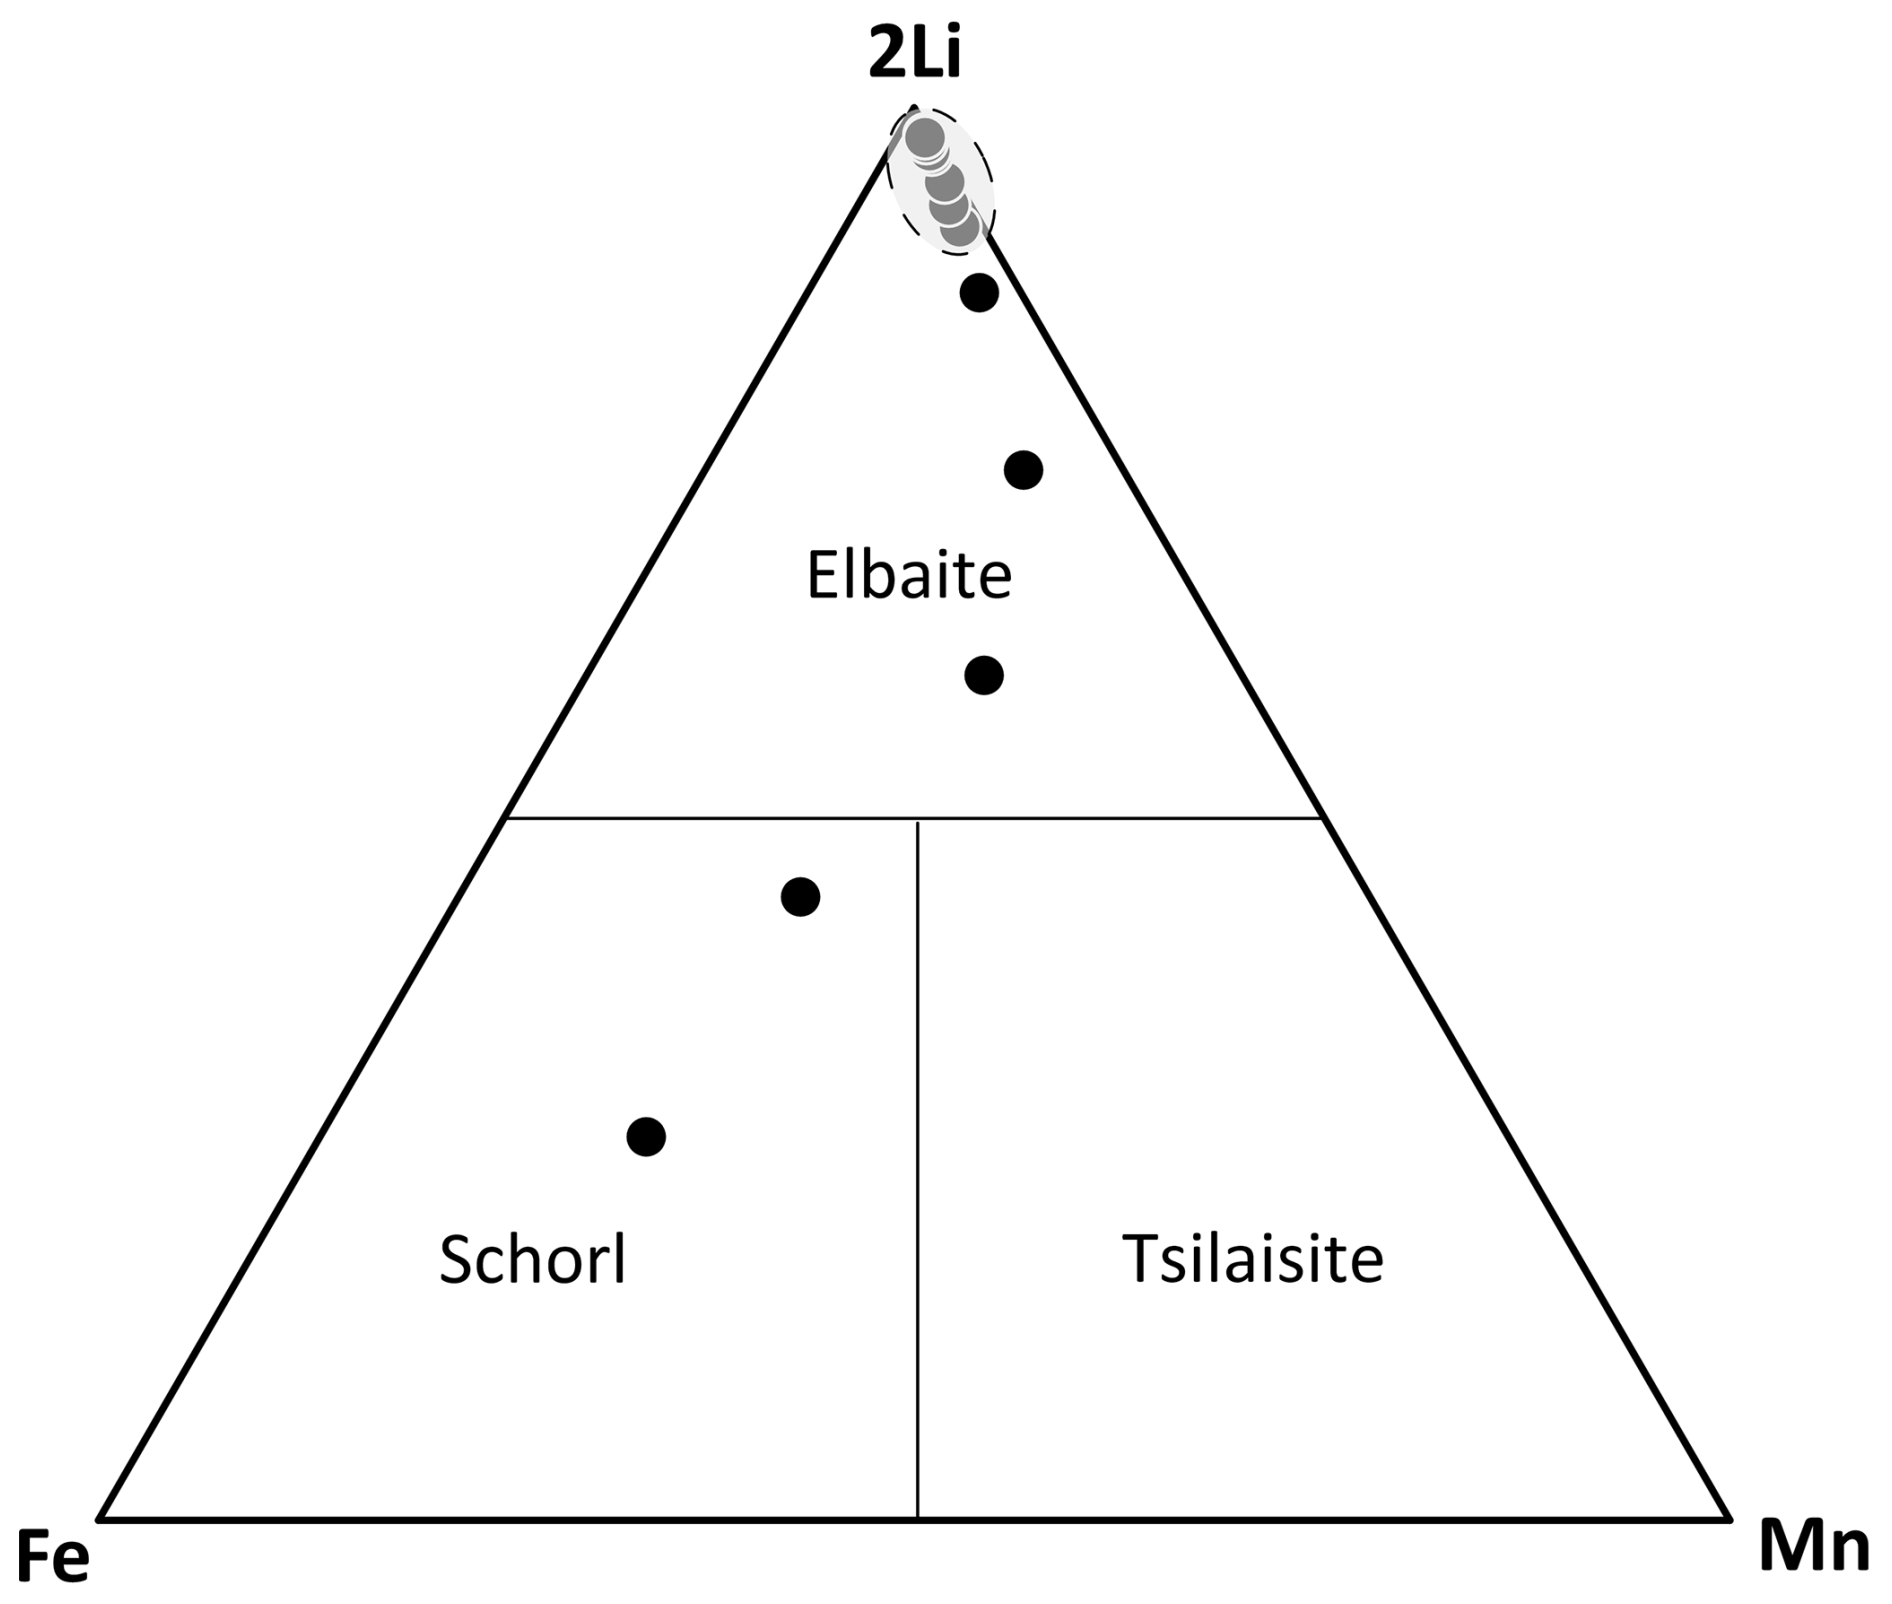
Figure 5The 2Li–Fe–Mn diagram showing the compositional trend of the studied crystal in Fig. 4.
Table 7Powder X-ray diffraction pattern of elbaite. Only the reflections with I≥ 5 % are listed. The eight strongest reflections are given in bold.

The oxidation states of Fe and Mn were determined by OAS as divalent. Lithium was determined by µ-LIBS. In accord with the structural information, the B content was assumed to occur also at the tetrahedrally coordinated T site, i.e., B > 3 atoms per formula unit (apfu); see below. The (OH) content and the formula were then calculated by charge balance with the assumption (Y + Z + T + B) = 18 apfu and 31 anions. The very good agreement between the number of electrons per formula unit (epfu) derived from EMPA and SREF (197.5 and 195.8 epfu, respectively) supports the above assumptions. Chemical data are given in Table 1.
In accord with Henry et al. (2011) and the structural information, the ion distributions in the tourmaline general formula, XY3Z6T6O18(BO3)3V3W, lead to the empirical formula:
The simplified formula is
The ideal formula is
which corresponds to (in wt %) SiO2 38.49, B2O3 11.15, Al2O3 40.82, Li2O 2.39, NaO 3.31, H2O 3.85, total 100.
Note that the empirical formula is consistent with a hydroxy-tourmaline belonging to the alkali group (Henry et al., 2011): it is Na-dominant at the X position of the general tourmaline formula, hydroxy-dominant at W with (OH) > O2− > F, and Al3+ dominant at Z. With regard to the Y position, the formula electroneutrality requires that the total charge at the Y site is +6 in the end-member formula: NaY(Y3)Σ6+Al6(Si6O18)(BO3)3(OH)3(OH). In accord with the dominant-valency rule and the valency-imposed double site occupancy, the dominant charge and atomic arrangements compatible with the Y population is (LiAl).
Elbaite is closely related to fluor-elbaite, Na(Li1.5Al1.5)Al6(Si6O18)(BO3)3(OH)3F, through a simple homovalent substitution; W(OH) = WF. Other relations may exist with various Li-tourmalines, such as rossmanite, □(LiAl2)Al6(Si6O18)(BO3)3(OH)3(OH)); fluor-rossmanite, □(LiAl2)Al6(Si6O18)(BO3)3(OH)3F; darrellhenryite, Na(LiAl2)Al6(Si6O18)(BO3)3(OH)3O; and fluor-liddicoatite, Ca(Li2Al)Al6(Si6O18)(BO3)3(OH)3F – involving complex heterovalent substitutions at various structural sites.
Chemical data indicate that the X site is predominantly occupied by Na (0.77 apfu) and □ (0.28 apfu). The mean bond length <X-O> of 2.671 Å is slightly shorter than the expected value for an XO9 polyhedron fully occupied by Na, which ranges between 2.69–2.70 Å, as reported by Bosi et al. (2012b) for oxy-chromium-dravite and Bačík and Fridrichová (2021) based on a broader dataset. A possible explanation for the shorter <X-O> compared to that observed in oxy-chromium-dravite may be attributed to the compression of the weak Na-O bond lengths (with a Pauling bond strength of about vu, valence unit) by the primary framework of ZAlO6 polyhedra, which are smaller than those of ZCrO6. The Y site is mainly occupied by Al (1.77 apfu) and Li (1.16 apfu), with minor amounts of Mn2+ and Fe2+ (up to 0.07 apfu) and trace amounts of Ti (0.003 apfu) and Cu2+ (0.002 apfu). The <Y-O> bond length of 1.989 Å is in excellent agreement with the occupancy of (Al1.8Li1.2), considering their ideal bond-length values: 1.906 Å and 2.09–2.11 Å for Al and Li, respectively (Bosi and Lucchesi, 2007; Bačík and Fridrichová, 2021). The comparison between the bond valence sum and the mean formal charge of Y (respectively, 2.06 and 2.19 vu; Table 6) indicates a negative deviation from the valence sum rule (Brown, 2016). This characteristic is typical of the Y site when occupied by Li (Bosi and Lucchesi, 2007). The Z site is fully occupied by Al, with the <Z-O> bond length of 1.906 Å, which perfectly agrees with the expected value (see Fig. 3 in Bosi and Andreozzi, 2013). The T site is dominated by Si (5.94 apfu) with minor B (0.06 apfu) content, supported by the <T-O> bond length of 1.616 Å (Table 5), which is slightly shorter than the ideal <TSi-O> length of 1.619 Å (Bosi and Lucchesi, 2007). Additionally, the refined scattering factor at the T site (= 13.71(5) electrons per site; Table 6) is lower than the atomic number of Si (= 14), supporting the presence of B (see the FTIR section, Sect. 4.3, above). The FTIR band at ∼ 3350 cm−1 further corroborates the presence of minor B along with Si at the T site. At the O1 site (W position in the general formula), (OH) is present (0.48 apfu), along with F (0.23 apfu) and O (0.29 apfu).
The bond-valence sum (BVS) calculation (Table 7) confirms the (OH) content at W using the equation proposed by Bosi (2013): W(OH) = = 0.46 apfu (vs. 0.48 apfu, as noted earlier). Experimental evidence for the presence of W(OH) is provided by the observed (OH)-stretching bands over 3600 cm−1 (see the FTIR section, Sect. 4.3, above).
The neotype material for elbaite originates from a nearly colorless crystal, characterized by a black to dark-green base. The variation in chemical composition (in wt %) along this crystal is presented in Fig. 4. The 2Li–Fe–Mn ternary diagram (Fig. 5) identifies the corresponding mineral species: a Mn-rich schorl zone in the darker regions and elbaite in the lighter areas of Fig. 4. Elbaite displays a tight cluster (Fig. 5) of 14 spot analyses, indicating its chemical homogeneity, which represents the neotype material. Throughout the entire crystal, a decrease in Fe and Mn content is observed, starting from an initial 11 wt %–12 wt %, which most likely occurred during the early stages of crystallization, and dropping to negligible levels due to the substitution of (Li + Al) → 2(Fe,Mn), described by the relation, in apfu, (Li + Al) = 3.04−1.13 (Fe + Mn) (r2=0.99 for 19 data derived from the EMPA spots).
Tourmaline is present in all rock units of the Rosina pegmatite as the only boron mineral occurring in the vein, with the exception of a very minor occurrence of hambergite in cavities, and it is progressively more abundant toward the core (and cavity-rich) zone of the vein. The tourmaline composition is strictly related to the chemical evolution of the zoned pegmatitic body, which is characterized by significantly different paragenesis of the different rock units, and it displays an average increasing geochemical evolution, with enrichments mainly of Li and Cs, toward the deepest sectors of the body, which is dipping at high angle in the monzogranite.
The precocious crystallization of biotite and sekaninaite in the pegmatitic rock, together with Fe-dominant tourmaline (schorl) characterizing the border zones of the pegmatite, allowed for an efficient removal of Mg, Ti, and most of the Fe from the crystallizing system. Subsequently, intermediate and core zones of the pegmatite crystallized; the remaining Fe was removed from the system by tourmaline, whose crystals, occurring as graphic texture aggregates with quartz and/or in comb textures pointing toward the core of the vein, evolved in the composition of Fe-free and Mn-rich fluor-elbaite.
The studied elbaite crystals occurred in cavities in the intermediate and deepest sectors of the pegmatitic body; the very low content of Mn and the low F can be interpreted as the result of spessartine and lepidolite formation, respectively. Indeed, between the intermediate and core zones of the pegmatite, a significant occurrence of almost pure spessartine is observed, which allowed for the removal of most of the Mn from the crystallizing medium.
Moreover, in the core zone, local masses of granular lepidolite formed, which were probably responsible for the removal of most of the F from the crystallizing system. In such pegmatite sectors, tourmaline crystals, when approaching cavities, rapidly evolved to Fe-free compositions as well as to low Mn and F compositions, resulting in the formation of relatively homogeneous and rather colorless elbaite prisms.
A CIF is deposited in the Supplement referred to below.
The supplement related to this article is available online at https://doi.org/10.5194/ejm-37-505-2025-supplement.
FB conceived the project and established the working group. FP selected the research material and collected field data. The starting material was characterized by FB, HS, PB, RL, UH, GT, and JS. The entire research team collaborated on both the discussion of the results and the writing of the manuscript.
At least one of the (co-)authors is a member of the editorial board of European Journal of Mineralogy. The peer-review process was guided by an independent editor, and the authors also have no other competing interests to declare.
Publisher's note: Copernicus Publications remains neutral with regard to jurisdictional claims made in the text, published maps, institutional affiliations, or any other geographical representation in this paper. While Copernicus Publications makes every effort to include appropriate place names, the final responsibility lies with the authors.
The comments provided by reviewers Andreas Ertl and Lenka Skřápková are greatly appreciated, as is the efficient handling of the manuscript by editor Sergey V. Krivovichev.
Funding was supported by Sapienza University of Rome (Prog. Università 2023 to Ferdinando Bosi). The study was also financially supported by the Ministry of Culture of the Czech Republic (long-term project DKRVO 2024-2028/1.II.b; National Museum, 00023272) for Jiří Sejkora.
This paper was edited by Sergey Krivovichev and reviewed by Andreas Ertl and Lenka Skřápková.
Agrosí, G., Bosi, F., Lucchesi, S., Melchiorre, G., and Scandale, E.: Mn-tourmaline crystals from island of Elba (Italy): Growth history and growth marks, Am. Mineral., 91, 944–952, https://doi.org/10.2138/am.2006.1978, 2006.
Altieri, A., Luppi, R., Skogby, H., Hålenius, U., Tempesta, G., Pezzotta, F., and Bosi, F.: Thermal treatment of the tourmaline Fe-rich princivalleite Na(Mn2Al)Al6(Si6O18)(BO3)3(OH)3O, Phys. Chem. Miner., 50, 27, https://doi.org/10.1007/s00269-023-01250-9, 2023.
Bačík, P. and Fridrichová, G.: Cation partitioning among crystallographic sites based on bond-length constraints in tourmaline-supergroup minerals, Am. Mineral., 106, 851–861, https://doi.org/10.2138/am-2021-7804, 2021.
Bertolini, A., Carelli, G., Francesconi, F., Francesconi, M., Marchesini, L., Marsili, P., Sorrentino, F., Cristoforetti, G., Legnaioli, S., Palleschi, V., Pardini, L., and Salvetti, A.: Modì: A New Mobile Instrument for in Situ Double-Pulse LIBS Analysis, Anal. Bioanal. Chem., 385, 240–247, https://doi.org/10.1007/s00216-006-0413-6, 2006.
Bosi, F.: Bond-valence constraints around the O1 site of tourmaline, Mineral. Mag., 77, 343–351, https://doi.org/10.1180/minmag.2013.077.3.08, 2013.
Bosi, F. and Andreozzi, G. B.: A critical comment on Ertl et al. (2012): “Limitations of Fe2+ and Mn2+ site occupancy in tourmaline: Evidence from Fe2+- and Mn2+-rich tourmaline”, Am. Mineral., 98, 2183–2192, https://doi.org/10.2138/am.2013.4534, 2013.
Bosi, F. and Lucchesi, S.: Crystal chemical relationships in the tourmaline group: structural constraints on chemical variability, Am. Mineral., 92, 1054–1063, https://doi.org/10.2138/am.2007.2370, 2007.
Bosi, F. and Skogby, H.: Oxy-dravite, Na(Al2Mg)(Al5Mg)(Si6O18)(BO3)3(OH)3O, a new mineral species of the tourmaline supergroup. Am. Mineral., 98, 1442–1448, https://doi.org/10.2138/am.2013.4441, 2013.
Bosi, F., Skogby, H., Agrosì, G., and Scandale, E.: Tsilaisite, NaMn3Al6(Si6O18)(BO3)3(OH)3OH, a new mineral species of the tourmaline supergroup from Grotta d'Oggi, San Pietro in Campo, island of Elba, Italy, Am. Mineral., 97, 989–994, doi.org/10.2138/am.2012.4019, 2012a.
Bosi, F., Reznitskii, L. and Skogby, H.: Oxy-chromium-dravite, NaCr3(Cr4Mg2)(Si6O18)(BO3)3(OH)3O, a new mineral species of the tourmaline supergroup, Am. Mineral., 97, 2024–2030, https://doi.org/10.2138/am.2012.4210, 2012b.
Bosi, F., Andreozzi, G.B., Agrosi, G., and Scandale, E.: Fluor-tsilaisite, NaMn3Al6(Si6O18)(BO3)3(OH)3F, a new tourmaline from San Piero in Campo (Elba, Italy) and new data on tsilaisitic tourmaline from the holotype specimen locality, Mineral. Mag., 79, 89–10, https://doi.org/10.1180/minmag.2015.079.1.08, 2015a.
Bosi, F., Skogby, H., Lazor, P., and Reznitskii, L.: Atomic arrangements around the O3 site in Al- and Cr-rich oxy-tourmalines: a combined EMP, SREF, FTIR and Raman study, Phys. Chem. Miner., 42, 441–453, https://doi.org/10.1007/s00269-015-0735-z, 2015b.
Bosi, F., Celata, B., Skogby, H., Hålenius, U., Tempesta, G., Ciriotti, M. E., Bittarello, E., and Marengo, A.: Mn-bearing purplish-red tourmaline from the Anjanabonoina pegmatite, Madagascar, Mineral. Mag., 85, 242–253, https://doi.org/10.1180/mgm.2021.20, 2021.
Bosi, F., Pezzotta, F., Altieri, A., Andreozzi, G. B., Ballirano, P., Tempesta, G., Cempírek, J., Škoda, R., Filip, J., Čopjacová, R., Novák, M., Kampf, A. R., Scribner, E. D., Groat, L. A., and Evans, R. J.: Celleriite, □(MnAl)Al6(Si6O18)(BO3)3(OH)3(OH), a new mineral species of the tourmaline supergroup, Am. Mineral., 107, 31–42, https://doi.org/10.2138/am-2021-7818, 2022.
Brown, I. D.: The chemical Bond in Inorganic Chemistry: The Bond Valence Model, 2nd edn., Oxford University Press, U.K., https://doi.org/10.1093/acprof:oso/9780198742951.001.0001, 2016.
Brown, I. D. and Altermatt, D.: Bond-valence parameters obtained from a systematic analysis of the Inorganic Crystal Structure Database, Acta Crystallogr. B, 41, 244–247, https://doi.org/10.1107/S0108768185002063, 1985.
Bruker AXS: Topas V6: General profile and structure analysis software for powder diffraction data, Bruker AXS [data set], 2016.
Cempírek, J., Houzar, S., Novák, M., Groat, L. A., Selway, J. B., and Šrein, V.: Crystal structure and compositional evolution of vanadium-rich oxy-dravite from graphite quartzite at Bítovánky, Czech Republic, J. Geosci., 58, 149–162, https://doi.org/10.3190/jgeosci.132, 2013.
Dunn, P. J. and Mandarino, J. A.: Formal definitions of type mineral specimens, Am. Mineral., 72, 1269–1270, 1987.
Ertl, A.: About the nomenclature and the type locality of elbaite: A historical review, Mitt. Österr. Mineral. Gesell., 154, 35–44, 2008.
Ertl, A., Hughes, J. M., Pertlik, F., Foit Jr., F. F., Wright, S. E., Brandstatter, F., and Marler, B.: Polyhedron distortions in tourmaline, Can. Mineral., 40, 153–162, https://doi.org/10.2113/gscanmin.40.1.153, 2002.
Fabre, C., Boiron, M. C., Dubessy, J., Chabiron, A., Charoy, B., and Crespo, T. M.: Advances in lithium analysis in solids by means of laser-induced breakdown spectroscopy: An exploratory study, Geochim. Cosmochim. Ac., 66, 1401–1407, https://doi.org/10.1016/S0016-7037(01)00858-4, 2002.
Gagné, O. C. and Hawthorne, F. C.: Comprehensive derivation of bond-valence parameters for ion pairs involving oxygen, Acta Crystallogr. B, 71, 562–578, https://doi.org/10.1107/S2052520615016297, 2015.
Gonzalez-Carreño, T., Fernandez, M., and Sanz, J.: Infrared and electron microprobe analysis in tourmalines, Phys. Chem. Miner., 15, 452–460, 1988.
Hawthorne, F. C.: Structural mechanisms for light-element variations in tourmaline, Can. Mineral, 34, 123–132, 1996.
Hawthorne, F. C. and Henry, D.: Classification of the minerals of the tourmaline group, Eur. J. Mineral., 11, 201–215, https://doi.org/10.1127/ejm/11/2/0201, 1999.
Henry, D. J. and Dutrow, B. L.: The incorporation of fluorine in tourmaline: Internal crystallographic controls or external environmental influences?, Can. Mineral, 49, 41–56, https://doi.org/10.3749/canmin.49.1.41, 2011.
Henry, D. J., Novák, M., Hawthorne, F. C., Ertl, A., Dutrow, B. L., Uher, P., and Pezzotta, F.: Nomenclature of the tourmaline-supergroup minerals, Am. Mineral., 96, 895–913, https://doi.org/10.2138/am.2011.3636, 2011.
Kutzschbach, M., Wunder, B., Rhede, D., Koch-Müller, M., Ertl, A., Giester, G., Heinrich, W., and Franz, G.: Tetrahedral boron in natural and synthetic HP/UHP tourmaline: evidence from Raman spectroscopy, EMPA, and single-crystal XRD, Am. Mineral., 101, 93–104, https://doi.org/10.2138/am-2016-5341, 2016.
Luppi, R.: Irradiation and heating of acroite-variety tourmalines: studies on color change, Master dissertation, Sapienza University of Rome, 70 pp., 2022 (in Italian).
Mandarino, J. A.: The Gladstone-Dale relationship. Part IV: the compatibility concept and its application, Can. Mineral, 19, 441–450, 1981.
Novák, M., Povondra, P., and Selway, J. B.: Schorl-oxy-schorl to dravite-oxydravite tourmaline from granitic pegmatites; examples from the Moldanubicum, Czech Republic, Eur. J. Mineral., 16, 323–333, https://doi.org/10.1127/0935-1221/2004/0016-0323, 2004.
Novák, M., Ertl, A., Povondra, P., Galiová, M. V., Rossman, G. R., Pristacz, H., Prem, M., Giester, G., Gadas, P., and Škoda, R.: Darrellhenryite, Na(LiAl2)Al6(BO3)3Si6O18(OH)3O, a new mineral from the tourmaline supergroup, Am. Mineral., 98, 1886–1892, https://doi.org/10.2138/am.2013.4416, 2013.
Orlandi, P. and Pezzotta, F.: Minerali dell'Isola d'Elba, i minerali dei giacimenti metalliferi dell'Elba orientale e delle pegmatiti del M.te Capanne, Novecento Grafico, Bergamo, Italy, 248 pp., 1996.
Pesquera, A., Gil-Crespo, P. P, Torres-Ruiz, F., Torres-Ruiz, J., and Roda-Robles, E.: A multiple regression method for estimating Li in tourmaline from electron microprobe analyses, Mineral. Mag., 80, 1129–1133, https://doi.org/10.1180/minmag.2016.080.046a, 2016.
Pezzotta, F.: Internal structures, parageneses and classification of the miarolitic (Li-bearing) complex pegmatites of Elba Island (Italy), Memorie della Società Italiana di Scienze Naturali e del Museo Civico di Storia Naturale di Milano, 30, 29–43, 2000.
Pezzotta, F.: A history of tourmaline from the Island of Elba, Mineral. Rec., 52, 669–720, 2021.
Pouchou, J. L. and Pichoir, F.: Quantitative analysis of homogeneous or stratified microvolumes applying the model “PAP”, in: Electron Probe Quantitation, edited by: Heinrich, K. F. J. and Newbury, D. E., Plenum, New York, 31–75, https://doi.org/10.1007/978-1-4899-2617-3_4, 1991.
Rizzo, F., Bosi, F., Tempesta, G., and Agrosì, G.: Compositional Variation and Crystal-Chemical Characterization of a Watermelon Variety of Tourmaline from Anjanabonoina, Central Madagascar, Crystals, 13, 1290, https://doi.org/10.3390/cryst13081290, 2023.
Rossman, G. R., Fritsch, E., and Shilgley, J. E.: Origin of color in cuprian elbaite from São José de Batalha, Paraíba, Brazil, Am. Mineral., 76, 1479–1484, 1991.
Schaller, W. T.: Beitrag zur Kenntnis der Turmalingruppe, Z. Krist., 51, 321–343, https://doi.org/10.1524/zkri.1913.51.1.321, 1913.
Sheldrick, G. M.: Crystal structure refinement with SHELXL, Acta Crystallogr. C, 71, 3–8, https://doi.org/10.1107/S2053229614024218, 2015.
Vernadsky, W.: Über die chemische Formel der Turmaline, Z. Krist., 53, 273–288, https://doi.org/10.1524/zkri.1914.53.1.273, 1914.
OL: objective lens; NA: numerical aperture; WD: working distance.
- Abstract
- Introduction
- Occurrence
- Appearance and physical and optical properties
- Experimental methods and results
- Chemical formulae of elbaite
- Discussion
- Petrogenesis of elbaite
- Data availability
- Author contributions
- Competing interests
- Disclaimer
- Acknowledgements
- Financial support
- Review statement
- References
- Supplement