the Creative Commons Attribution 4.0 License.
the Creative Commons Attribution 4.0 License.
 | 04 Jul 2025
Vesiculation dynamics – Part 1: Decompression-induced H2O vesicle formation in the Lower Laacher See phonolitic melt
Patricia Louisa Marks
Marcus Nowak
The Laacher See volcano is located in the East Eifel region of Germany, an area that remains volcanologically active, indicated by ongoing degassing and low-frequency seismic activities. Its last eruption, ∼ 13 000 years ago, was one of the most significant volcanic events in central Europe, characterized by explosive Plinian and phreatomagmatic eruptions with devastating environmental consequences. To contribute to understanding the eruption behavior of the Laacher See volcano, this experimental study focuses on the degassing behavior of the sodium-rich Lower Laacher See Tephra, part of the first highly differentiated melt ejected.
Systematic solubility and decompression experiments were conducted at superliquidus temperatures of 1323 K and at starting pressures of 200 MPa in an internally heated pressure vessel. H2O concentrations of 5.7 wt % and 5.0 wt % revealed saturation pressures of 198 and 156 MPa, respectively, resulting in saturation and slightly undersaturation conditions prior to decompression. The hydrated melts were then continuously decompressed at rates ranging from 0.064–1.7 MPa s−1 to final pressures between 110 and 30 MPa.
H2O concentrations in the residual glasses were measured using FTIR spectroscopy, for which the absorption coefficients for the synthesized glass composition were determined ( and ), as well as the H2O-dependent density equation . Upon reaching a sufficient supersaturation pressure of 80–130 MPa, all samples exhibited homogeneously dispersed and micrometer-sized vesicles in the sample volume. Each series showed maximal logVNDs (where VND is vesicle number density) of 5.1–5.7, irrespective of decompression rate, which seems difficult to reconcile with nucleation theory. The observed high VNDs are supposed to cause very fast near-equilibrium adjustment of H2O concentration in the melt by degassing.
Under the investigated experimental conditions, the results align with recent studies indicating that the decompression rate does not significantly affect potassium-rich phonolitic and phono-tephritic melts. These findings suggest that off-critical spinodal decomposition might be responsible in the rapid phase separation of hydrous, alkali-rich intermediate melts into H2O fluid and less hydrous melt, potentially enhancing the explosive eruption behavior.
- Article
(2577 KB) - Full-text XML
- Companion paper
-
Supplement
(74893 KB) - BibTeX
- EndNote


1.1 Laacher See setting
The Laacher See volcano, located in the East Eifel volcanic field in western Germany, stands as one of central Europe's youngest volcanoes, with its most recent eruption occurring years BP (relative to 1950 CE) (Reinig et al., 2021). This eruption ranks among the largest in Europe during the upper Pleistocene, with a volcanic explosivity index (VEI) of 6, comparable in magnitude to the 1991 eruption of Mount Pinatubo (Holasek et al., 1996). Over a span of fewer than 10 d, approximately 6.3 km3 of phonolitic magma, equivalent to 20 km3 of tephra, was explosively ejected through phreatomagmatic and Plinian eruptions (Wörner and Schmincke, 1984a; Schmincke et al., 1999; Harms and Schmincke, 2000). This eruption unleashed a minimum of around 1.9 Tg of sulfur, 6.6 Tg of chlorine, and 403 Tg of water vapor into the atmosphere, with a substantial portion reaching the stratosphere, likely exerting a significant influence on climate and the environment (Harms and Schmincke, 2000). For context, the mentioned 1991 eruption of Mt. Pinatubo resulted in an estimated global temperature decrease of 0.4 K (McCormick et al., 1995).
The temperatures and pressures within the Laacher See magma chamber were estimated to range from 1023 to 1033 K (750 to 760 °C) and 115 to 145 MPa at the uppermost section of the chamber, increasing to 1113 to 1133 K (840 to 860 °C) and 200 MPa at the mafic, more crystalline magma at the chamber's base. The upper boundary of the magma chamber was positioned at a depth of 5–6 km. Considering the volcanic depression's geometry and the volumes of erupted material, the overall height of the magma body was approximated to be 1–2 km (Wörner and Schmincke, 1984b; Harms et al., 2004).
The Laacher See tephra layers were dispersed across central Europe, embodying a chemically and mineralogically stratified magma chamber (Van den Bogaard and Schmincke, 1984, 1985; Wörner and Schmincke, 1984a). Initially, Plinian eruptions ejected the Lower Laacher See Tephra (LLST), characterized by highly differentiated, water-saturated, and exceptionally crystal-poor (<2 vol %) phonolites, representing the uppermost segment of the magma chamber. Highly evolved LLST glass inclusions were estimated to contain ∼5.7 wt % H2O using secondary ion mass spectrometry and the by-difference method, suggesting that the LLST magma was near water saturation at depth (Harms and Schmincke, 2000). Subsequent Plinian eruptions ejected less differentiated phonolitic magma, featuring a slightly reduced alkali content and crystal contents of up to 15 vol %, leading to the deposition of the Middle Laacher See Tephra (MLST). In the later stages of the eruption, phreatomagmatic activity produced a crystal-rich mafic phonolite (ULST, Upper Laacher See Tephra) with phenocryst concentrations of up to 55 vol %, attributed to occasional replenishment of hot basanite melt and mixing with the resident melt at the base of the magma chamber (Tomlinson et al., 2020).
Beyond analyzing natural volcanic products, experimental work is crucial for investigating and understanding the physicochemical processes within the magma chamber. While the study of erupted products yields information about the initial conditions of the magma chamber, it does not provide insights into the behavior of the magma during ascent. Experimental simulations of ascending magma, undergoing degassing and/or crystallization, offer valuable insights into the dynamic magma behavior under various conditions. Numerous studies about the Laacher See eruption at ∼13 ka have delved into pressure and temperature conditions, melt composition, volatile content, phase relations, fluid inclusion, crystal analysis, and other factors (e.g., Wörner and Schmincke, 1984a, b; Harms and Schmincke, 2000; Harms et al., 2004; Schmidt and Behrens, 2008; Schmidt et al., 2013; Tomlinson et al., 2020). However, the question of the actual phase separation behavior of the initial hydrous melt into fluid and less hydrous melt (terminated as degassing in this publication), which reveals the explosive potential of the volcano, has remained unanswered. Therefore, this study focuses on investigating the H2O degassing behavior of hydrous melt with LLST composition through systematic decompression experiments conducted under superliquidus conditions. Superliquidus conditions were chosen as it is crucial to start with relatively simple conditions before progressing to more complex systems. Accordingly, our initial focus is on the phase separation of the pure melt (homogeneous phase separation), prior to studying more complex systems, such as melts containing crystals. We selected the Laacher See composition as the melt composition as the Laacher See volcano has a history of explosive eruptions and continues to exhibit frequent seismic activity.
1.2 Cavitation: formation of gas vesicles in a liquid
The eruption dynamics of volcanic systems are dominated by the phase separation mechanism of H2O fluid from a hydrous silicate melt, the primary volatile component dissolved in magma. As magma ascends, the solubility of H2O decreases with decreasing pressure (e.g. Iacono-Marziano et al., 2007; Schmidt and Behrens, 2008), leading to progressive H2O supersaturation within the melt. Upon reaching a critical threshold, the melt degasses, forming H2O fluid vesicles within it or, in other more general words, small vapor-filled cavities form within the melt by exceeding its tensile strength, resulting in the rupturing of the melt structure (Brennen, 1995). This process of vesicle formation during decompression at constant temperatures is known as cavitation, which is widely used in other areas of natural science, particularly in the physicochemical literature, and was initially described by Reynolds in 1873 and further specified by Parsons in 1906. Cavitation involves the formation, growth, and collapse of vapor-filled cavities within a liquid.
The rupturing of the melt is strongly influenced by its tensile strength, defined by the intermolecular forces that hold the molecules together, preventing the formation of large cavities. This tensile strength measures the extent of pulling force the melt can withstand before breaking and is determined by the difference between the saturated vapor pressure and the melt pressure. When the tensile strength is exceeded, the melt ruptures, forming cavities. In the context of cavitation, the tensile strength and elasticity of the melt set the threshold for the pressure drop required to initiate vesicle formation. If the tensile stress surpasses the melt's elasticity, bonds break, forming cavities where H2O molecules assemble into vesicles. Consequently, tensile strength is a critical factor in cavitation, significantly influencing the formation and growth of vesicles and, subsequently, the melt's integrity and behavior. High tensile strength implies that the melt can withstand greater tension before failing, potentially delaying the onset, growth, and coalescence of vesicles, which may lead to abrupt and violent eruptions, such as those for rhyolitic compositions. Conversely, in melts with lower tensile strength, vesicles can grow and coalesce more readily, resulting in more constant and less-explosive eruptions, as is often observed for basaltic compositions.
While cavitation describes the process of the vesicle formation during depressurization, the mechanisms of homogeneous vesicle formation can be described by nucleation or spinodal decomposition. These two established homogeneous formation mechanisms will be briefly presented as an overview. These mechanisms are of great interest, as the number of fluid vesicles per unit volume of silicate melt (VND, vesicle number density) serves as a key parameter for quantifying the efficiency of fluid–melt separation and, consequently, the acceleration of magma ascent.
1.2.1 Homogeneous vesicle nucleation
Phase separation in supersaturated hydrous silicate melt is conventionally explained using nucleation theory (Navon and Lyakhovsky, 1998), where vesicles uniformly form throughout the melt. Homogeneous nucleation theory predicts that the nucleation rate, defined as the number of vesicles formed per unit volume per second, increases exponentially with the degree of supersaturation. Exceeding the H2O solubility limit of the homogeneous melt, which is characterized by the binode, leads to supersaturation of the melt. Further decompression into the metastable state leads to the onset of vesicle nucleation (e.g. Sahagian and Carley, 2020). According to the mechanical equilibrium approach of homogeneous nucleation, energy is required to create new interfaces of H2O vesicles within the silicate melt. Critically sized H2O clusters at the nanometer scale emerge within the metastable state of the hydrous melt (e.g., Hurwitz and Navon, 1994; Navon and Lyakhovsky, 1998). When H2O clusters (or nuclei) reach a critical radius, they either shrink or grow spontaneously due to diffusional loss or addition of an H2O molecule at the fluid–melt interface, respectively. Because clustering makes the formation of critical nuclei a statistical process, the spatial positions of nuclei in the melt also follow a statistical distribution, resulting in variable inter-nuclei distances. The exponential increase of the nucleation rate of surviving vesicles is influenced by factors such as surface tension, viscosity, supersaturation pressure (difference between internal vesicle pressure and ambient melt pressure), temperature through kinetic energy of molecules, H2O diffusivity, and the rate of decompression (e.g., Toramaru, 2006). Upon further decompression, existing vesicles expand by diffusional H2O uptake and decreasing external pressure, while simultaneously nucleation continues by the formation of new vesicles. This process persists until the number of vesicles in the melt volume is sufficient for H2O supersaturation to decrease solely through diffusion into the vesicles.
The nucleation theory suggests that VNDs should depend on decompression rate, with faster decompressions resulting in greater supersaturation pressures by exceeding the rate of volatile diffusion to newly formed vesicles (Hurwitz and Navon, 1994; Navon and Lyakhovsky, 1998; Gardner et al., 2023). The necessary H2O supersaturation pressure for homogeneous vesicle nucleation was experimentally determined by several studies to exceed 60–100 MPa for a range of silicate melt compositions (e.g. Hurwitz and Navon, 1994; Mourtada-Bonnefoi and Laporte, 1999, 2002; Mangan and Sisson, 2000; Iacono-Marziano et al., 2007; Hamada et al., 2010; Gardner and Ketcham, 2011; Gondé et al., 2011; Gardner et al., 2013; Gonnermann and Gardner, 2013; Fiege et al., 2014; Le Gall and Pichavant, 2016; Preuss et al., 2016; Hajimirza et al., 2019, 2021). However, nucleation theory tends to underestimate the vesicle nucleation rate to achieve high VNDs of ∼105 mm−3 observed in samples of phonolitic and phono-tephritic melts at moderate to low decompression rates (Allabar and Nowak, 2018; Allabar et al., 2020a, b; Gardner et al., 2023) and is not able to explain decompression-rate-independent VNDs. Therefore, off-critical spinodal decompositions has been proposed as an explanation for the high and constant VNDs across several orders of magnitude.
1.2.2 Spinodal decomposition
In contrast to nucleation, off-critical spinodal decomposition is a spontaneous phase separation process that occurs when a homogeneous hydrous melt becomes thermodynamically unstable at the lower limit of metastability, known as the spinodal region (Cahn, 1965; Debenedetti, 2000). When a hydrous silicate melt is decompressed through the metastable region, it may enter the off-critical spinodal region of the phase diagram. During this decompression, the melt traverses the metastable state, where supersaturation gradually increases. However, upon crossing the spinodal boundary, the melt reaches a state of extreme supersaturation, marking the onset of spinodal decomposition. Below the spinode, the H2O supersaturated melt becomes thermodynamically unstable to compositional fluctuations with wavelengths greater than a critical wavelength (Cahn, 1965). In this regime, the system no longer requires nucleation to phase separate; instead, it undergoes spontaneous and rapid decomposition driven by extreme supersaturation, leading to the growth of compositional fluctuations without an energy barrier. As phase separation is now characterized by the wavelength of these fluctuations, the concept of a critical nucleus radius, as in homogeneous nucleation, becomes irrelevant. Following the model of Cahn (1965), small compositional fluctuations with significant concentration differences in small volumes occur and amplify spontaneously, leading to the formation of H2O-rich and H2O-poor regions by uphill diffusion (Allabar and Nowak, 2018; Sahagian and Carley, 2020). This process creates a gradient in H2O concentration, transitioning from H2O-rich melt to nearly H2O-free melt without a sharp initial boundary. The critical wavelength of the H2O concentration fluctuations, which increase through uphill diffusion, determines the number of vesicles formed uniformly and spontaneously throughout the melt during decompression. This process results in a decompression-rate-independent high VND and uniformly sized vesicles, as observed in supersaturated phonolitic and phono-tephritic melts (Preuss et al., 2016; Allabar and Nowak, 2018; Allabar et al., 2020b; Sahagian and Carley, 2020; Gardner et al., 2023).
To determine whether the degassing behavior of phonolitic melt with LLST composition corresponds to homogeneous nucleation or off-critical spinodal decomposition, experiments were conducted in an internally heated pressure vessel (IHPV) at the University of Tübingen. These experiments included hydration and subsequent decompression, under both H2O-saturated and slightly H2O-undersaturated starting conditions.
2.1 Glass synthesis
Phonolitic glasses were synthesized according to the LLST G140 composition by Harms et al. (2004) (Table B1). To receive homogeneous starting glasses, the synthesis was conducted by mixing, milling, and melting analytical-grade oxide and carbonate powders following the experimental protocol of Marxer et al. (2015) and the improvement described in Allabar and Nowak (2018). Powder batches of 25 g of the LLST composition were loaded into Pt90Rh10 crucibles and heated at 1873 K for 6 h to decarbonize and melt the mixture. The melt was then rapidly quenched in water to induce tension cracks and fracturing of the glass. The shattered glass shards were then ground, mixed, and remelted at 1873 K for 1 h. The melt was air-cooled to the approximate glass transition temperature of ∼950 K, calculated with the model of Giordano et al. (2008), and transferred into a preheated furnace at ∼900 K. The furnace was then shut down to provide a cooling rate of ∼5 K min−1 until room temperature was reached. This procedure ensured crystal- and tension-free homogeneous glasses that are nearly free of air bubbles. Four syntheses with multiple batches (LLST_1a/b, LLST_2a/b/c, LLST_3a/b/c, and LLST_4a/b/c/d) were conducted to receive enough sample material for all experiments. The glass compositions were confirmed with electron probe microanalysis (EPMA) (Table B1). Cylinders of 3.6 or 5 mm in diameter were drilled from the homogeneous batches for the H2O solubility and decompression experiments.
2.2 Standard glass samples
Hydrated standard glass samples were prepared for the determination of near-infrared (NIR) linear molar absorption coefficients of dissolved hydrous species (molecular H2O (H2Om) and hydroxyl (OH)). The samples were synthesized using glass chips of 250–500 µm in diameter of LLST_1a. The 20 mm long cleaned and annealed Au80Pd20 tubes (4.0 mm o.d., 3.6 mm i.d.) were crimped on one side and welded shut. The tubes were then filled with glass chips and densified with a steel piston. An Eppendorf micropipette was used to insert water into the capsules. Seven samples were prepared to obtain glasses with 0.5 wt %, 1 wt %, 2 wt %, 3.24 wt %, 4 wt %, 5.5 wt %, and 7 wt % dissolved H2O. To control the amount of H2O added, the capsules were weighed after each preparation step to determine gravimetrically the H2O content (). After filling, the upper part of the capsule was crimped shut and welded. The capsules were heated in a compartment drier at 383 K for at least 1 h, then compressed to 200 MPa at room temperature and reheated to 383 K, and reweighed after each step to ensure tightness. Two samples each were hydrated together in the IHPV at 1523 K and 300 or 200 MPa (Table S1) at an intrinsic oxygen fugacity close to ΔlogQFM (Berndt et al., 2002). Pressure conditions were chosen to ensure H2O undersaturation (Schmidt and Behrens, 2008) to dissolve the complete amount of H2O in the melt and to avoid the formation of hydration bubbles that could affect the determination of H2O () dissolved in the quenched glasses with Karl Fischer titration (KFT; Preuss et al., 2016; Allabar et al., 2022). After 24 h, the capsules were quenched isobarically with about 16 K s−1 by switching off the furnace (Allabar et al., 2020b).
2.3 H2O solubility experiments
For the H2O solubility experiments, glass chips of 250–500 µm grain size as well as solid glass cylinders of 3.6 mm in diameter were used. To ensure H2O saturation of the melt, excess water of 8 wt % to 4 wt % H2O, dependent on the pressure conditions, was welded together with the LLST glass in 3.6 mm diameter Au80Pd20 capsules (Table 1). The capsule material was crimped and welded on both sides to seal the samples. Possible leakage of the capsules was tested by heating to 383 K and pressurizing to 200 MPa at ambient temperature as for the standard samples. The samples were hydrated under the same final pressure conditions as the subsequent decompression experiments (110–30 MPa). All samples were hydrated in the IHPV at 1523 K, then lowered to 1323 K with 10 K min−1, and held there for a further 30 min. Additionally, one sample was hydrated at 200 MPa and 1523 K and quenched immediately to validate the initial melt conditions at the hydration temperature. For the 200 MPa runs, the 110 MPa run, and the 30 MPa run, a sample with a glass cylinder and a sample with glass chips were both hydrated simultaneously in the IHPV for comparison. Only glass chip samples were used for the solubility experiments at 90, 80, 70, 50, and 40 MPa. The combined glass cylinder and glass chip samples were hydrated for 96 h, while the other glass chip samples were hydrated for 24 h due to the shorter diffusion distance of H2O initially distributed between the glass chips. These hydration times ensured homogeneous distribution and dissolution of H2O in the melt. One additional cylinder sample was hydrated at 200 MPa for 96 h at 1523 K, lowered with 10 K s−1 to 1123 K, and equilibrated there for another 24 h before quenching, to investigate the temperature-dependent solubility of H2O.
After hydration, the samples were isobarically and rapidly quenched at ∼97 K s−1 (MQ, medium quenching) or ∼150 K s−1 (RQ, rapid quenching) by melting the suspension wire of the capsule, which caused the capsule to fall into the cold part of the sample holder (Table 1; Berndt et al., 2002). Three hydration experiments (LLST_11H/Hg, LLST_12Hg, and LLST_13H/Hg) failed to melt the suspension wire, so they were quenched at ∼ 16 K s−1 (NQ, normal quenching) by switching off the electric furnace. Nevertheless, the quenching rate was sufficient to prevent the formation of quenching crystals, confirmed by optical microscopy and backscattered electron (BSE) imaging. All capsules of the solubility experiments were pierced before preparation with water bubbling out of the hole. This ensured that H2O still coexisted with the saturated melt during the hydration. The pierced capsules were then stored in a drying cabinet for 1 h at 383 K. This drying time was confirmed to be sufficient based on previous experiments, which were weighed for 3 h every 30 min after piercing and placement in the drying cabinet. The weight loss was then used to gravimetrically calculate the dissolved H2O content in the glass for each sample.
2.4 Decompression experiments
For the decompression experiments, glass cylinders of 5.3–7.5 mm in length and 5 mm in diameter were inserted into Au80Pd20 capsules (outer diameter: 5.4 mm, inner diameter: 5.0 mm). Two series of hydration melt conditions were performed by adding 5.7 wt % or 5.0 wt % H2O to the capsule, adjusting to H2O-saturated or slightly undersaturated conditions prior to decompression, respectively. The bottom of the capsules was closed with Au80Pd20 lids, and the upper capsule side was pressed into a three-sided star and welded. The tightness of the samples was tested by the same procedure as for the hydration of the glass standards and the H2O solubility experiments.
The samples were hydrated in the IHPV at 200 MPa and 1523 K for 96 h. After hydration, the temperature was isobarically reduced at 10 K min−1 to 1323 K, where the samples were thermally equilibrated for 0.5 h. The hydrous melts were then isothermally decompressed at 1.7, 0.17, and 0.064 MPa s−1 to final pressures (Pf) of 110, 90, 80, 70, 60, 50, 40, and 30 MPa. By reaching Pf, the samples were quenched isobarically with ∼150 K s−1 (Berndt et al., 2002) or 97 K s−1 to room temperature. During quenching, a further pressure drop of a few MPa may occur due to the drop of the sample into the cold zone of the sample holder. For this reason, the minimum recorded pressure (Pmin) is also listed in addition to the desired Pf (Table 2). The capsules were reweighed to ensure tightness and then punctured to determine the degassed H2O content gravimetrically as a first approximation.
2.5 Quantification of cooling rate
The rapid cooling from 1323 K to room temperature within a few seconds, corresponding to an average cooling rate of ∼150 K s−1 (Berndt et al., 2002), induces tension stress in the supercooled sample material. This often leads to tension cracks in the glass, which can cause further breakage and shattering during subsequent sample preparation. For this reason, we achieved a medium-quenching (MQ) rate that largely prevents stress-induced glass cracking but captures as close as possible the melt state in the quenched glass. Therefore, a 35 mm long brass cylinder was inserted at the bottom of the sample holder to keep the sample slightly closer to the hot zone of the furnace during cooling. This technique has already been described by Allabar et al. (2020a), who, additionally, placed a 1 cm long piece of platinum between the brass cylinder and the capsule and determined a quenching rate of 44±11 K s−1. To quantify the quenching rate of the actual setup, a glass cylinder with haplogranitic composition (AOQ = Ab38Or34Qz28; Holtz et al., 1995; Nowak and Behrens, 1997) was used as starting material for a hydration reference experiment under the same conditions as the LLST samples. Dependent on the H2O solubility, the sample was hydrated with 5.3 wt % H2O at 200 MPa and 1523 K for 96 h. The sample was then isobarically quenched by melting the suspension wire. To determine the quenching rate, the hydrous species geospeedometer of Zhang et al. (2000) was used, which is based on the homogeneous interconversion reaction between molecular H2O species and OH species in haplogranitic glass. For this purpose, a double-polished thin section of 200 µm thickness was prepared from the hydrated glass sample. The linear near-infrared absorption band intensities (A5230 and A4520) located at ∼5230 and 4520 cm−1 were determined by Fourier transform infrared (FTIR) spectroscopy with a spectral resolution of 4 cm−1, 32 scans per measurement cycle, and the application of a linear baseline correction according to Behrens et al. (1996). In total, 35 measurements across the sample resulted in a mean and cm−1. Normalization of A to 1 mm sample thickness results in and , giving a MQ cooling rate of 97 (−1/+22) K s−1.
2.6 Sample preparation
For FTIR spectroscopy, a glass slice was cut perpendicular to the cylinder axis from both ends of the glass standard samples. Each slice was then prepared as a thin section and polished on both sides. The residual sample material was used for the glass density determination and absolute H2O concentration measurements by KFT. For the H2O solubility and decompression experiments, the samples were sectioned through the middle of each sample parallel to the cylinder axis. One half of the sample was prepared as a thin section (∼200 µm) for FTIR spectroscopy and transmitted light microscopy. The thickness of each thin section was measured with a Mitutoyo digital micrometer (±3 µm). The other half was embedded in epoxy with subsequent polishing and double sputtering with 5 nm carbon for EPMA and scanning electron microscopy (SEM) image analysis.
3.1 Electron microprobe analysis
The bulk compositions of the nominally dry starting glasses were analyzed with a JEOL JXA 8230 electron microprobe. Wavelength-dispersive X-ray spectroscopy analyses were conducted using an acceleration voltage of 15 kV, a beam current of 10 nA, and a defocused beam with a diameter of 10 µm on the sample surface to optimize for Na analysis (e.g., Morgan and London, 2005; Stelling et al., 2008). Beam counting times were set to 10 s (Na), 16 s (K, Si, Ca, Al, Mg, Fe), and 30 s (Mn, Ti). Additional energy-dispersive X-ray spectroscopy (EDX) analyses were conducted using a focused beam with a diameter of 1 µm. Calibration standards were albite for Si, Al, and Na; strontium titanite for Ti; hematite for Fe; bustamite for Mn; diopside for Mg and Ca; and sanidine for K. To test the homogeneity of the glasses and the agreement with the desired glass composition, 15 points were measured across an entire glass cylinder section of each glass batch. A focused beam with a spot size of 1 µm was used to measure the crystal composition of the partially crystallized sample LLST_12Hg (Table B1).
3.2 Glass density determination
Glass densities of the hydrated standard glass samples were determined by the buoyancy method using a Sartorius Archimedes precision balance (±0.02 mg). For this purpose, the glass pieces of 43–208 mg were weighed in air and in water. The glass density was determined by the buoyancy, dependent on the weight difference.
3.3 Karl Fischer titration
Total H2O concentrations of the seven hydrous standard glasses were measured by KFT at the Institute of Mineralogy of the Leibniz University Hannover, Germany. A detailed description of this method is given by Behrens et al. (1996). Two to four KFT-derived H2O concentration results for the standard samples are given in Table S1.
3.4 FTIR spectroscopy
All thin sections were analyzed in the near-infrared range for the H2O concentrations with a Bruker Vertex 80v FTIR spectrometer, coupled with a Hyperion 3000 IR microscope. A halogen light source, a CaF2 beam splitter, a liquid-nitrogen-cooled InSb single-element detector, and a 15× Cassegrain objective were used for measurements, as well as the software OPUS 7 for evaluation. Homogeneous glasses were measured with the knife aperture set to 50 µm × 50 µm, while for extremely vesiculated samples the measuring range was set to 25 µm × 25 µm to still be able to determine the H2O content of the vesicle-free glass. Each measurement was tested to ensure that it was free of fluid vesicles by focusing through the thin section. Additionally, in highly vesiculated samples, the volumes of glass containing vesicles were measured with the knife aperture set to 50 µm × 50 µm. The samples were measured in transmission mode with 32 scans per spectrum at a spectral resolution of 4 cm−1. Air was measured as a reference for each new sample. Across each standard sample, 20 measurements were conducted to confirm the homogeneous distribution of H2O in the glasses. For the hydration samples, 15–24 measurements were taken along the longitudinal and transverse cylinder axes for each sample to confirm a homogeneous H2O concentration distribution throughout the sample. Decompression samples were also measured for their H2O content in horizontal and vertical profiles to detect a possible H2O concentration gradient throughout the cylinder. H2Om (∼5210 cm−1) and OH (∼4470 cm−1) absorbances were determined after applying a linear tangential baseline correction according to Behrens et al. (1996). Following the Lambert–Beer law, the concentrations of H2Om () and OH (cOH) were calculated using the glass density, linear molar absorption coefficients, and thickness of the samples. The sum of both H2O species gives the total dissolved H2O content () in the glass (Tables 1, 2).
3.5 Raman spectroscopy
Raman micro-spectroscopy was used to identify possible iron oxide nanolites, which range in size from less than 1 µm down to the nanometer scale and potentially influence vesiculation during decompression, if present (Di Genova et al., 2017a, b, 2018, 2020; Dubosq et al., 2022). While optical microscopy and SEM-BSE imaging can detect microlites in quenched glasses (between 1 and 100 µm in size, as defined by Murphy et al., 2000, and Mujin et al., 2017), they are unable to detect nanolites. Therefore, several hydration and decompression experiments quenched at 1523 or 1323 K were examined for the presence of nanolites or quenching phases. Raman scattering at 660–690 cm−1 is indicative for the most common nanolite phase of magnetite (Di Genova et al., 2017b, 2020; Scarani et al., 2022). Additionally, the microlites in sample LLST_12Hg, quenched at 1123 K, were measured for identification.
A Renishaw inVia confocal Raman micro-spectrometer was equipped with a 532 nm laser and a Peltier-cooled CCD detector. A 50× objective with a numerical aperture of 0.75 was used to collect spectra from 100–4500 cm−1 in a high confocality setting with three accumulations and an acquisition time of 10 s each. The laser was focused on the sample surface, while the intensity was set to 10 % (corresponding to ∼2.5 mW). The laser penetration depth in hydrous silicate glass can be up to ∼20 µm (Allabar et al., 2020b).
3.6 Quantitative image analysis
Overview and detailed surface images of the epoxy-embedded samples were acquired as BSE images using a Phenom XL microscope and a laser-scanning microscope for quantitative image analysis and determination of the VND. BSE images were acquired under vacuum conditions using the Phenom XL microscope equipped with a CeB6 source. Imaging was performed at an acceleration voltage of 10 kV and magnifications of up to 500× to resolve the appearance and size of vesicles. Images acquired with the VK-X120K confocal laser scanning microscope were taken at 20× or 50× magnification. Image stitching was performed with the appropriate microscope software that allowed for detailed overview images. The specific detailed image sections were selected from central parts of the samples to be analyzed by quantitative image analysis for the VND with ImageJ and CSDcorrections (Higgins, 2000), as described in Marxer et al. (2015) and Preuss et al. (2016).
3.7 Transmission light microscopy
Vesicles in each thin section were quantified using the Zeiss Axio Image M2M microscope and the TrackWorks software. Each measurement was performed by focusing through the sample in a predefined area, counting each vesicle, and measuring the vesicle diameter in this area, resulting in an analyzed sample volume that was used to normalize the number of vesicles to 1 mm3 of vesicle-free glass. The errors of the transmitted light microscopy (TLM) analyses are calculated using error propagation, assuming errors of 5 % for vesicle size and vesicle number as well as ±3 µm for sample thickness.
4.1 LLST standard glasses
EPMA measurements confirm the homogeneous glass composition of each synthetic batch close to the Lower Laacher See Tuff composition G140 reported in Harms et al. (2004) (Table B1). The glasses are free of crystals, pre-existing bubbles, or cracks. The glass density of hydrous standard glasses decreases linearly with increasing H2O content (Fig. 1a). However, the density of the nominally dry glass (2442±5.9 g L−1) is slightly lower than the linear trend of the hydrous glasses predicts. This is attributed to a pressure dependence on density, as the dry glasses were synthesized at 1 bar (Behrens et al., 1996; Balzer et al., 2020; Allabar et al., 2022) and were therefore not included for the linear regression calculation. Fitting a linear regression line through the measured densities of hydrous glasses yields a linear density function of LLST [g L−1] as a function of [wt %]:
Linear molar absorption coefficients for LLST were calculated from the H2Om and OH absorbances, measured by FTIR spectroscopy (Table S1). The spectra were baseline corrected to determine the peak heights at ∼5210 and ∼4470 cm−1. Mean absorptions of these spectra show increasing absorbances with increasing H2O content. With the known from KFT analysis of each sample, the normalized absorbances were obtained by rearranging the Lambert–Beer law:
The and cOH are the species concentrations of dissolved H2O in wt %, A is the height of the respective absorbance band, d is the sample thickness (in cm), ρ is the density (in g L−1), and ε is the absorption coefficient (in L (mol cm)−1). Plotting the normalized absorbances against each other with the weighted least-square regression yields a straight line whose intersections with the y and x axes obtain the absorption coefficients of H2Om and OH, respectively. The molar absorption coefficients are and (Fig. 1b).
A comprehensive description and classification of the molar absorption coefficients, including comparisons with related studies (Carroll and Blank, 1997; Larsen and Gardner, 2004; Iacono-Marziano et al., 2007; Schmidt and Behrens, 2008; Schmidt et al., 2013; Fanara et al., 2013; Table C1) and determinations of the coefficients, have been provided in Appendix C.
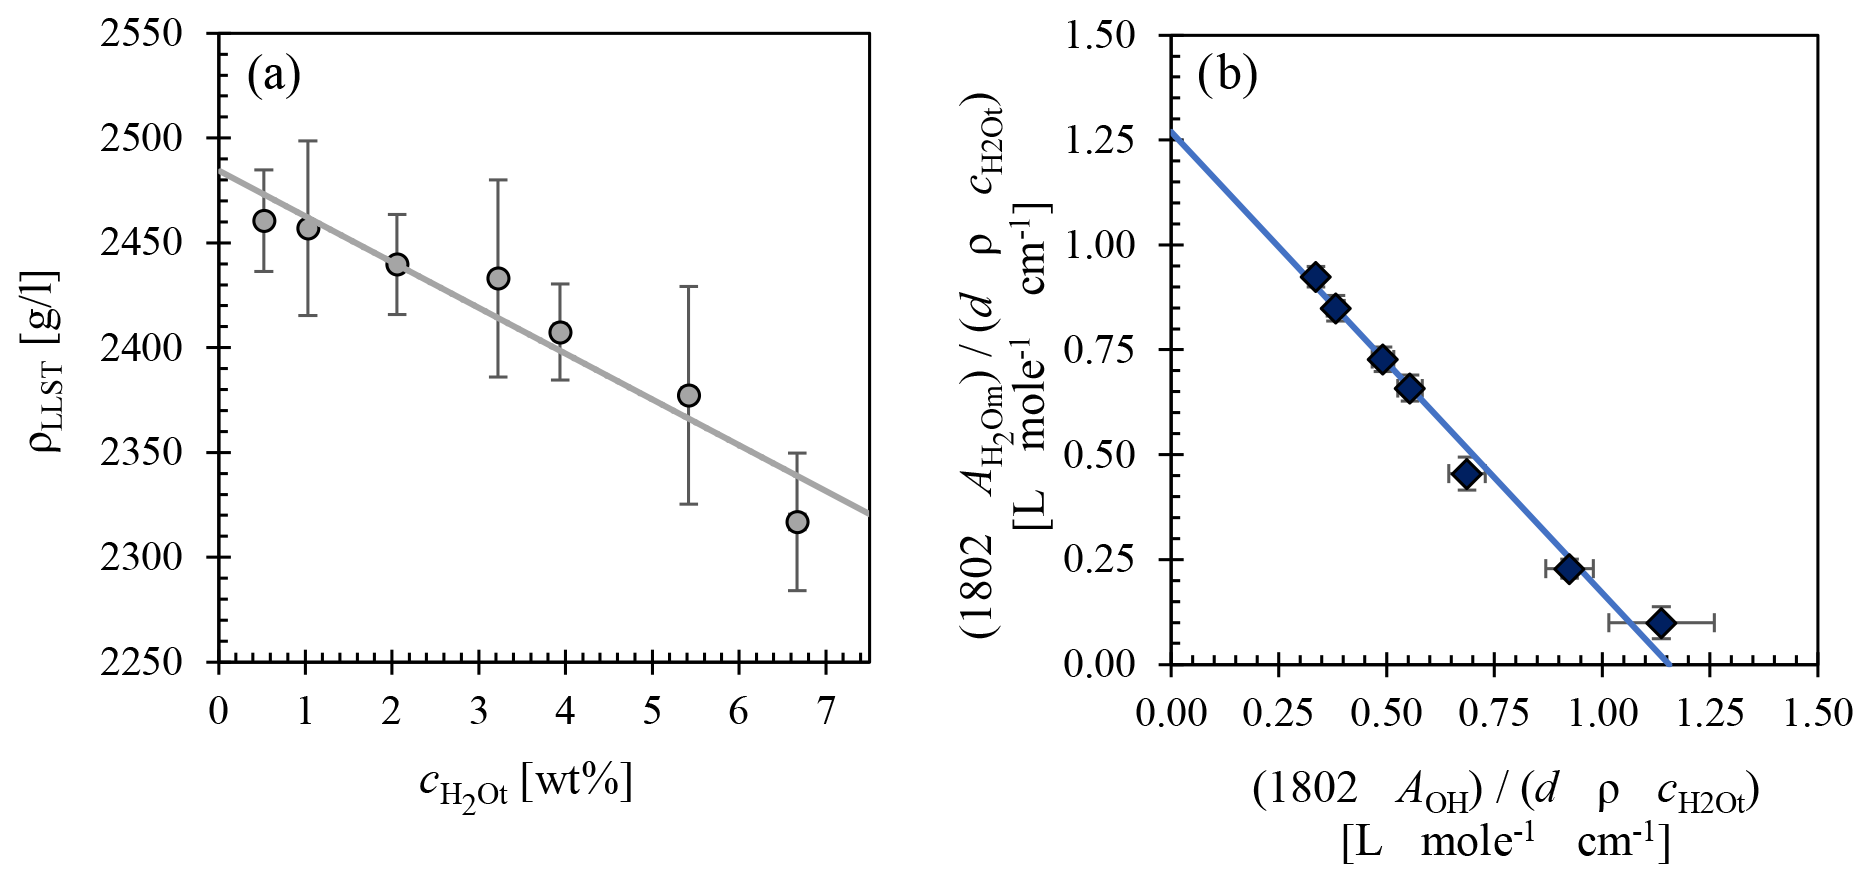
Figure 1(a) LLST glass density as a function of (i.e., ) determined from hydrous glasses only. (b) Normalized absorbances of H2Om and OH from NIR measurements of the hydrous standard glasses. The weighted least-squares regression calculated from these data provides the molar absorption coefficients of H2Om in the y-axis intercept () and OH in the x-axis intercept ().
4.2 Quenched glasses
Examination of synthesized dry starting glasses using EMPA, TLM, and Raman spectroscopy result in crystal and vesicle-free glasses (Fig. 2a). The microscopic analyses with a Zeiss Axio Image M2M microscope at 1000× magnification of quenched hydrated glass samples with H2O contents >2 wt % show tiny light-diffraction rings, indicative of objects with sizes of ≤0.5 µm (Airy, 1834; Fig. 2b–f). No differences in the size and object number density (OND, in mm−3) were found, regardless of the quenching rate, of 2.2 wt %–5.7 wt %, , or Pf. The size of the objects seems to remain constant at ≤0.5 µm as well as the logOND, ranging between 5.2 to 5.6. The appearance of the small objects observed in the quenched hydrous glasses is independent of the experimental conditions and is not influenced by the presence of H2O vesicles (Fig. 2c). No direct contact between objects and vesicles was detected. However, the absence of the small objects in the boundary region of the glass to the capsule walls of the hydrated samples is striking (Fig. 2e). The width of the object-free zones ranges from ∼10 to ∼100 µm, depending on the respective position in the sample. In all samples, the glass above the bottom of the capsule has a particularly large object-free zone. The identification of the small objects with the SEM, up to 7700× magnification, and the Raman micro-spectroscopy were not successful, which might be due to the small object size and minimal intersection probability. Also, no Raman signal at ∼660–690 cm−1 indicative of iron oxides (Di Genova et al., 2017b; Scarani et al., 2022) was detected. However, several EDX measurements using the EPMA revealed that the objects are AuPd particles. This is surprising, as the melting point of Au80Pd20 is ∼1603 K at ambient pressure, well above the hydration and equilibration temperature. Similar objects were also found in experimental products of other compositions, such as the 39 ka Campanian Ignimbrite (CI) melt composition (Preuss et al., 2016). Quenched melt samples with platinum as capsule material exhibit the same behavior with the appearance of small Pt particles. Such precious metal particles (Au, Pt, Pd, Re, Rh) have already been observed in several studies, both in geological samples and synthetic silicate glasses, and are described in the literature as micronuggets (Ertel et al., 2001; Mallmann and O'Neill, 2007; Lorand et al., 2010; Blaine et al., 2011; Bondar et al., 2022). Although this phenomenon is well known, its origin has not yet been clarified. It could reflect redox reactions occurring during the experimental runs and may also be responsible for the diffusion of Fe from the silicate melt into the metal capsules (Bondar et al., 2022). We assume that the objects precipitated during the quenching of the melt, as no objects are found in each sample in the outer area of the glass volume with the fastest cooling rate. However, the investigation of their occurrence is beyond the scope of this study and will not be examined further here.
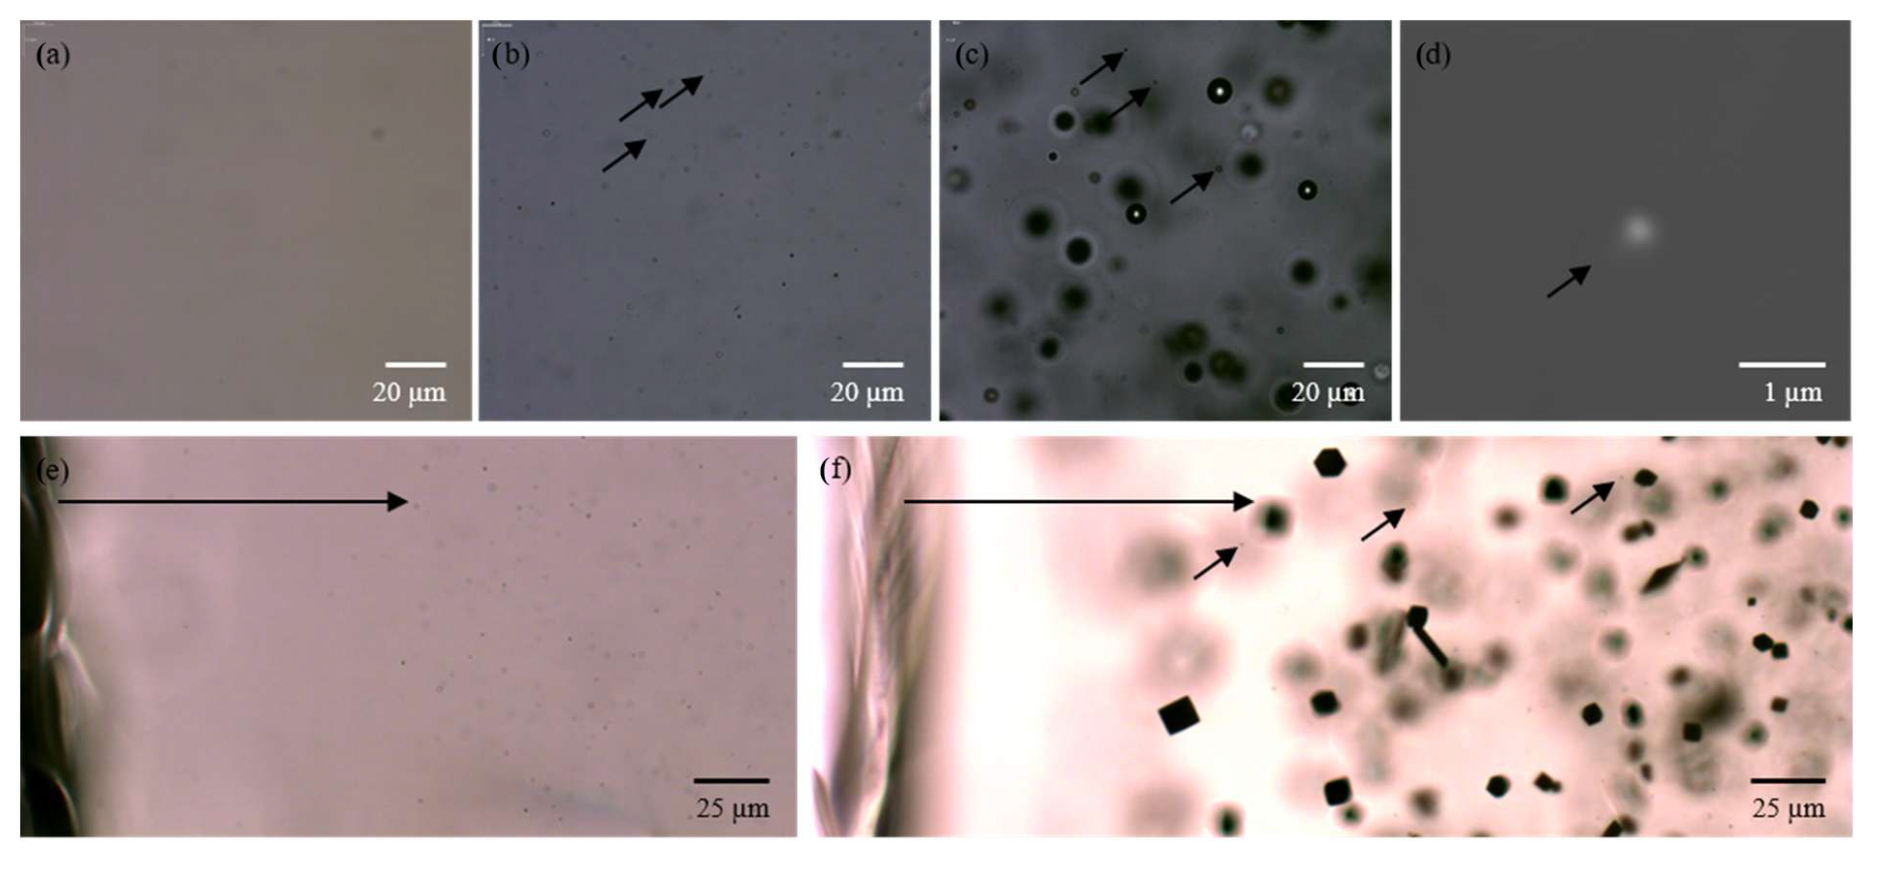
Figure 2(a) Starting glass of the glass synthesis batch LLST_4b, no discernible objects with optical microscopy, SEM, EPMA, and Raman spectroscopy. (b) Solubility sample LLST_4Hg with marked objects ≤0.5 µm ( wt %, 1323 K, Peq=110 MPa, RQ). (c) decompression sample LLST_7D with marked objects ( wt %, 1323 K, MPa s−1, Pf=50 MPa, MQ). (d) BSE image of LLST_4Hg; marked object was identified as a AuPd micronugget by EDX measurements using the EPMA. (e) LLST_32D: The object-free zone from the capsule rim is marked by the arrow ( wt %, 1323 K, MPa s−1, Pf=110 MPa, MQ). (f) LLST_12Hg: The object-free zone from the capsule rim is marked by the arrow, while small arrows indicate objects in the glass partially crystallized with hematite ( wt %, 1123 K, Pf=200 MPa, NQ).
4.3 H2O solubility
The H2O solubility () at various conditions, including 1523 K and 200 MPa; 1323 K at 200, 110, 90, 80, 70, 50, 40, and 30 MPa; and 1123 K at 200 MPa, was determined using FTIR micro-spectroscopy and is presented in Fig. 3. The analysis of several different measuring positions through each glass sample revealed a homogeneous distribution of H2O. Comparison of solubility data between samples with glass cylinders and glass shards used as starting material showed agreement within analytical error, with the glass shard samples consistently exhibiting a slightly higher H2O content of 1.2 %–3.6 % relative. The H2O solubility equation (Eq. 5) was derived from a least-squares regression of the obtained solubility data (Table 1). In the case of double determination of the H2O concentrations, the values of the glass cylinder samples were used. Generally, increases with pressure at constant temperature. Furthermore, the results obtained at different temperatures at 200 MPa show an increase in H2O solubility with decreasing temperature. The measured H2O concentration at 1523 K is 5.45±0.26 wt %, at 1323 K is 5.83±0.27 wt %, and at 1123 K is 6.16±0.27 wt % (Table 1). This observation aligns with findings by Schmidt and Behrens (2008) regarding phonolitic melts of the Laacher See volcano and the Montaña Blanca volcano from Tenerife, Spain (Fig. C1). From the solubility series at 1323 K, a pressure-dependent (in MPa) H2O solubility (in wt %) equation was derived:
From this, an H2O saturation pressure (Psat) of 156 MPa for of 5.0 wt % and 198 MPa for of 5.7 wt % was obtained for the decompression series. This leads to two distinct starting conditions at the beginning of decompression at 1323 K: one with H2O saturation at 5.7 wt % and the other H2O undersaturated at 5.0 wt %.
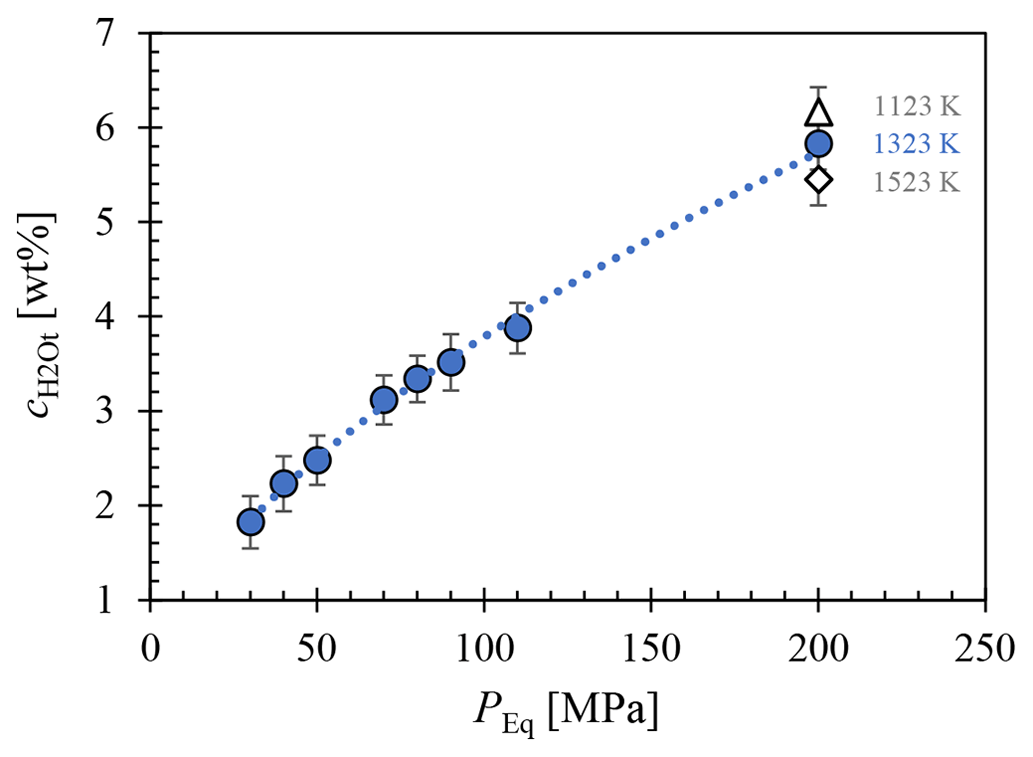
Figure 3Measured of LLST glass hydrated at 200, 110, 90, 80, 70, 50, 40, and 30 MPa and at 1323 K (blue circles), 1523 K (open diamond), and 1123 K (open triangle), determined by FTIR spectroscopic analysis. A pressure-dependent equation was derived from the data for 1323 K: .
In addition to the H2O concentration, homogeneously dispersed crystals of 5–10 µm in size were measured in LLST_12Hg (Fig. 2f). The crystallization is attributed to the subliquidus conditions at 1123 K. Raman spectroscopy and EPMA identified these crystals as magnetite, with an average composition of 78.2 wt % FeO, 6.5 wt % MnO, 5.1 wt % Al2O3, 1.3 wt % TiO2, and 0.8 wt % MgO (Table B1).
4.4 Decompression experiments
All decompression samples are free of microlites. Consistently present across all samples are fringe zones. These are represented by large fringe vesicles at the interface between the capsule and the melt (Fig. S1). The size of those vesicles increases with decreasing decompression rate and Pf. Next to the fringe vesicles is the fringe zone, characterized by a vesicle-free area due to the depletion of H2O from the melt into the fringe vesicles during decompression. The size of the fringe zone expands with decreasing decompression rate, explaining the necessity of a large sample diameter for slow decompression rates. In addition to exhibiting fringe vesicles, decompression samples might also show growth of pre-existing air bubbles originally present within the glass (Fig. S1). These bubbles form H2O-rich vesicles during hydration prior to decompression and remain easily distinguishable from the surrounding smaller and uniform vesicles due to their significantly larger size after decompression and quenching (50–100 times the size of the uniform tiny vesicles; samples: 3D, 7D, 17D, 20D, 27D, 35D, 36D, 47D; Fig. 4). A comprehensive overview of all decompression samples is included in the Supplement (Figs. S2 and S3).
Generally, all decompression series undergo three stages from the highest to the lowest Pf: (i) the first occurrence of observable vesicle formation, (ii) complete vesiculation of the entire central sample volume and vesicle growth, and (iii) the onset of vesicle coalescence (companion paper Part 2, Marks and Nowak, 2025). The required pressure interval between Psat and the pressure at which the first vesicles can be observed in glass is given by the supersaturation pressure (PSS). Hydrous melts decompressed at a rate of 0.064 MPa s−1 exhibit the first occurrence of homogeneously formed vesicles at a Pf of 80 MPa, regardless of an initial H2O concentration () of either 5.7 wt % or 5.0 wt % (Table 2). The same applies to melts decompressed at a rate of 0.17 MPa s−1. However, a significant difference in Pf is observed in melts decompressed at the fastest rate of 1.7 MPa s−1. Here, the appearance of the first vesicles decreases to a Pf of 70 MPa for a of 5.7 wt % and further down to 50 MPa for a of 5.0 wt % (Table 2, Figs. S2, S3). A consistent observation across all samples is that the initial vesicle-containing regions at the highest Pf are not vesiculated throughout the entire central sample volume. Instead, small localized areas, positioned variably in the upper, middle, or lower regions, exhibit a high number of tiny vesicles, measuring 2–4 µm. The following stage of complete vesiculation and vesicle growth within the central sample volume is observed across all decompression series. At faster decompression rates of 0.17 and 1.7 MPa s−1, this stage spans a broad pressure interval of 20–40 MPa. In contrast, at the slowest decompression rate of 0.064 MPa s−1, vesicle coalescence is observable after complete vesiculation, corresponding to a pressure decrease of 10 MPa.
4.4.1 Decompression rate
The importance of the influence of decompression rate on vesicle formation is demonstrated by the comparison between samples LLST_34D and LLST_43D. Both samples contained a of 5 wt %, were hydrated under identical conditions, and decompressed to the same desired Pf of 50 MPa, whereby the recorded data of LLST_34D showed a Pmin of 50 MPa and that of 43D showed a Pmin of 46 MPa. After decompression, both samples underwent medium quenching with 97 K s−1. The samples are identical except for one key difference: sample LLST_43D was continuously decompressed at a rate of 1.7 MPa s−1, whereas sample LLST_34D experienced a reduction in decompression rate to ∼0.9 MPa s−1 towards the end of decompression (Fig. D1). This resulted in an increased decompression time of 11 s for sample LLST_34D compared to sample LLST_43D. This deceleration in decompression rate resulted in complete vesiculation of the melt throughout the volume of the slightly slower decompressed sample LLST_34D (Fig. D1), in contrast to sample LLST_43D, which, at the higher and constant decompression rate, exhibited vesiculation only in the central part of the melt volume.
Various parameters have been quantified in all samples, including the VND, vesicle size, glass porosity, melt porosity, and of the quenched glasses. All these parameters depend on each other. At a first step, they are described independently of each other for characterization purposes. Sample areas displaying incipient coalescence were intentionally excluded from analysis, as these constitute the primary focus within an extended dataset of the second companion paper (Marks and Nowak, 2025).
4.4.2 Vesicle number density
The VND was determined by TLM in areas of the samples exhibiting a homogeneous distribution of vesicles (Fig. S1). The logVNDs range from 4.0 up to 5.7 across all and decompression rates (Fig. 5). However, there is a slight trend towards an increase in logVND with decreasing Pf. The logVND increases on average by 1 log unit, from 4.5 at Pf of 80 MPa to 5.5 at Pf of 30 MPa. Comparative analysis using TLM and surface imaging via the laser-scanning microscope, combined with CSDcorrections for sample LLST_17D, yielded consistent results (TLM: logVND = 5.68, CSD: logVND = 5.59). Samples decompressed with 1.7 MPa s−1 show logVND values clustering between 4.8 and 5.4, while logVND of slower-decompressed samples (0.17–0.064 MPa s−1) range from 4.0 to 5.7. This indicates that a discernible dependence of VND on the decompression rate could not be verified.
4.4.3 Vesicle size
The vesicles in the quenched glasses are uniformly sized within each sample, with diameters steadily increasing from ∼2 to ∼14 µm as Pf decreases for each decompression and series (Fig. 5). The optical transparency of the glasses diminishes with increasing vesicle size and number, finally becoming opaque, as observed in samples 20D, 17D, and 42D. In reflected light images, this opacity is seen as white, milky glass, whereas in TLM images the highly vesiculated sample areas appear black (see the Supplement).
4.4.4 Porosities
Glass porosities (Φglass) of vesiculated samples were calculated based on the number and sizes of vesicles per mm−3 of silicate glass (Table 2, Fig. 5). These porosities range from 0.1 vol % to a maximum of 10 vol %. Additional, equilibrium melt porosities (Φeq) at Pf were calculated according to Gardner et al. (1999), using the melt density ρmelt (Ochs and Lange, 1999) and the molar volume of H2O fluid (Duan and Zhang, 2006; Table 2):
Equilibrium porosities were added to the same diagram as the glass porosities, with the series of 5.0 wt % and 5.7 wt % indicated by yellow and red colors, respectively (Fig. 5). The calculated Φeq range from 18 vol % to 56 vol % with decreasing Pf. High Pf values of 80 or 70 MPa correspond to melt porosities of 18 vol %–22 vol %, while lower Pf values of 40 or 30 MPa result in melt porosities of 42 vol %–56 vol %.
4.4.5 H2O concentrations
H2O concentrations of decompressed LLST samples are presented in Fig. 6. Additionally, of 5.7 wt % and 5.0 wt % were plotted, along with calculated from the solubility data (Eq. 5, Fig. 3). Samples that contained vesicles in the beam path could not be evaluated, because they yielded unrealistically high virtual values, reaching up to 10 wt %. This is particularly relevant for samples that reached the stage of complete vesiculation. At this stage, the VND is so high that the size of glass areas is insufficient for the beam to pass through without interference from the vesicles (Table 2). Consequently, only values from samples where the IR beam exclusively penetrated glass were included in the plot. Figure 6 displays of samples from the 5.0 wt % series data which are related to depleted glass regions around pre-existing bubbles or fringe zones. Therefore, they do not represent the residual values of glass in vesiculated areas and are marked as unfilled symbols.
In general, the values of decompressed samples are consistently far above the expected equilibrium concentrations at Pf (Fig. 6). Both 5.7 wt % and 5.0 wt % series share a common characteristic: the difference in between the non-vesiculated samples and rises from 1 wt % at the highest Pf to 2 wt % until vesicle formation initiates. Subsequently, irrespective of the Pf, all analyzable glass sample areas consistently exhibit a difference of approximately 2 wt %.
Despite the absence of observable vesicles in the glass samples decompressed to Pf of 100 and 90 MPa, the measured is systematically 0.1 wt % to 0.2 wt % lower than the originally measured amount of H2O, related to supersaturation and reduced pressure. This observed reduction may be attributed to different structural states of the melts before quenching. The molar absorption coefficients of the H2O and OH absorption bands were determined in glasses quenched from H2O undersaturated melts, whereas the melts decompressed to 110–90 MPa were significantly supersaturated with H2O. Consequently, a lower density compared to the melts at higher pressure before quenching could be expected. However, adjusting the density to slightly lower values would yield a higher calculated H2O content. We suggest that the apparent reduction in H2O contents in non-degassed supersaturated samples is related to slightly different melt structures and H2O species concentrations before quenching, causing minor changes in the absorption coefficients of the glasses compared to the standard glasses quenched from higher pressures. Therefore, it is likely that the actual remains constant within the sample volume of decompressed and non-degassed samples.
The decompression series with of 5.7 wt % and a rate of 1.7 MPa s−1 shows only a minor decrease in from Pf of 110 to 80 MPa, where the first vesicles appear in glass (5.52 wt % to 5.43 wt %, respectively). The decompression series at the slower rate of 0.17 MPa s−1 exhibits a significantly faster drop in from 5.52 wt % at 110 MPa to 4.99 wt % at 90 MPa. Due to the high number of vesicles, undisturbed measurements were no longer possible below 80 MPa. The samples decompressed at the slowest rate of 0.064 MPa s−1 show an increased decline in from 90 to 70 MPa, with measured around large pre-existing or already coalesced vesicles. There is a strong reduction in the residual H2O content of the glass, from 5.43 wt % at 90 MPa to 4.86 wt % at 70 MPa.
It seems that samples of all decompression series at of 5.0 wt % maintain a constant down to 70 MPa, regardless of decompression rate. However, this observation holds true only for the highest decompression rate of 1.7 MPa s−1. Vesicle formation can be observed in samples decompressed with 1.7 MPa s−1 at a Pf of 50 MPa. Consequently, all samples with a higher Pf remain vesicle-free and are therefore suitable for FTIR measurements. The rapid decompression rate results in a very short decompression time (total ∼1 min, ∼35 s from Psat), insufficient for significant diffusion of dissolved H2O into the fringe vesicles at the capsule walls. A decrease in of 0.6 wt % is observed at 50 MPa, attributed to vesicle formation within the melt volume. Glass volumes between vesicles of samples decompressed to 40 and 30 MPa could not be measured due to the high VNDs.
In the samples of the experimental series at of 5.0 wt % with a decompression rate of 0.17 MPa s−1, values were maintained down to a Pf of 90 MPa. Vesicle formation commenced at 80 MPa, but the number and size of the vesicles at this pressure prevented the acquisition of sufficient glass volumes for undisturbed measurements. Consequently, there is a data gap for Pf values of 80, 70, and 50 MPa. In the sample decompressed to 40 MPa, tiny pre-existing air-bubbles were already present in the glass. Similar to fringe vesicles, a fringe zone formed around these vesicles, where H2O was previously depleted during decompression. Therefore, the value related to a Pf of 40 MPa does not reflect the equilibrium H2O content in the melt but is expected to be higher than the in the glass interstices of the homogeneous vesicles volume. Due to early H2O depletion in the fringe zone surrounding the pre-existing vesicles, the remaining H2O supersaturation was insufficient in the fringe zone to enable further vesicle formation during decompression to Pf. Consequently, the actual values in the glass interstices of the uniform vesicle volumes are expected to be below the plotted concentration of 4.25 wt %.
The samples of the series with the slowest decompression rate of 0.064 MPa s−1 exhibit the same behavior as the samples decompressed with 0.17 MPa s−1. Down to a Pf of 90 MPa, is close to and remains nearly constant. Due to the high VND, a data gap exists in the Pf range of 80 to 60 MPa. H2O concentrations could only be measured again at Pf starting from 50 MPa. In this case as well, was determined in H2O-depleted fringe zones around pre-existing vesicles due to the lack of sufficiently large glass areas in the uniformly vesiculated sample volume. Consequently, at a Pf of 50 MPa the of the interstitial glass should be lower than 4.47 wt %.
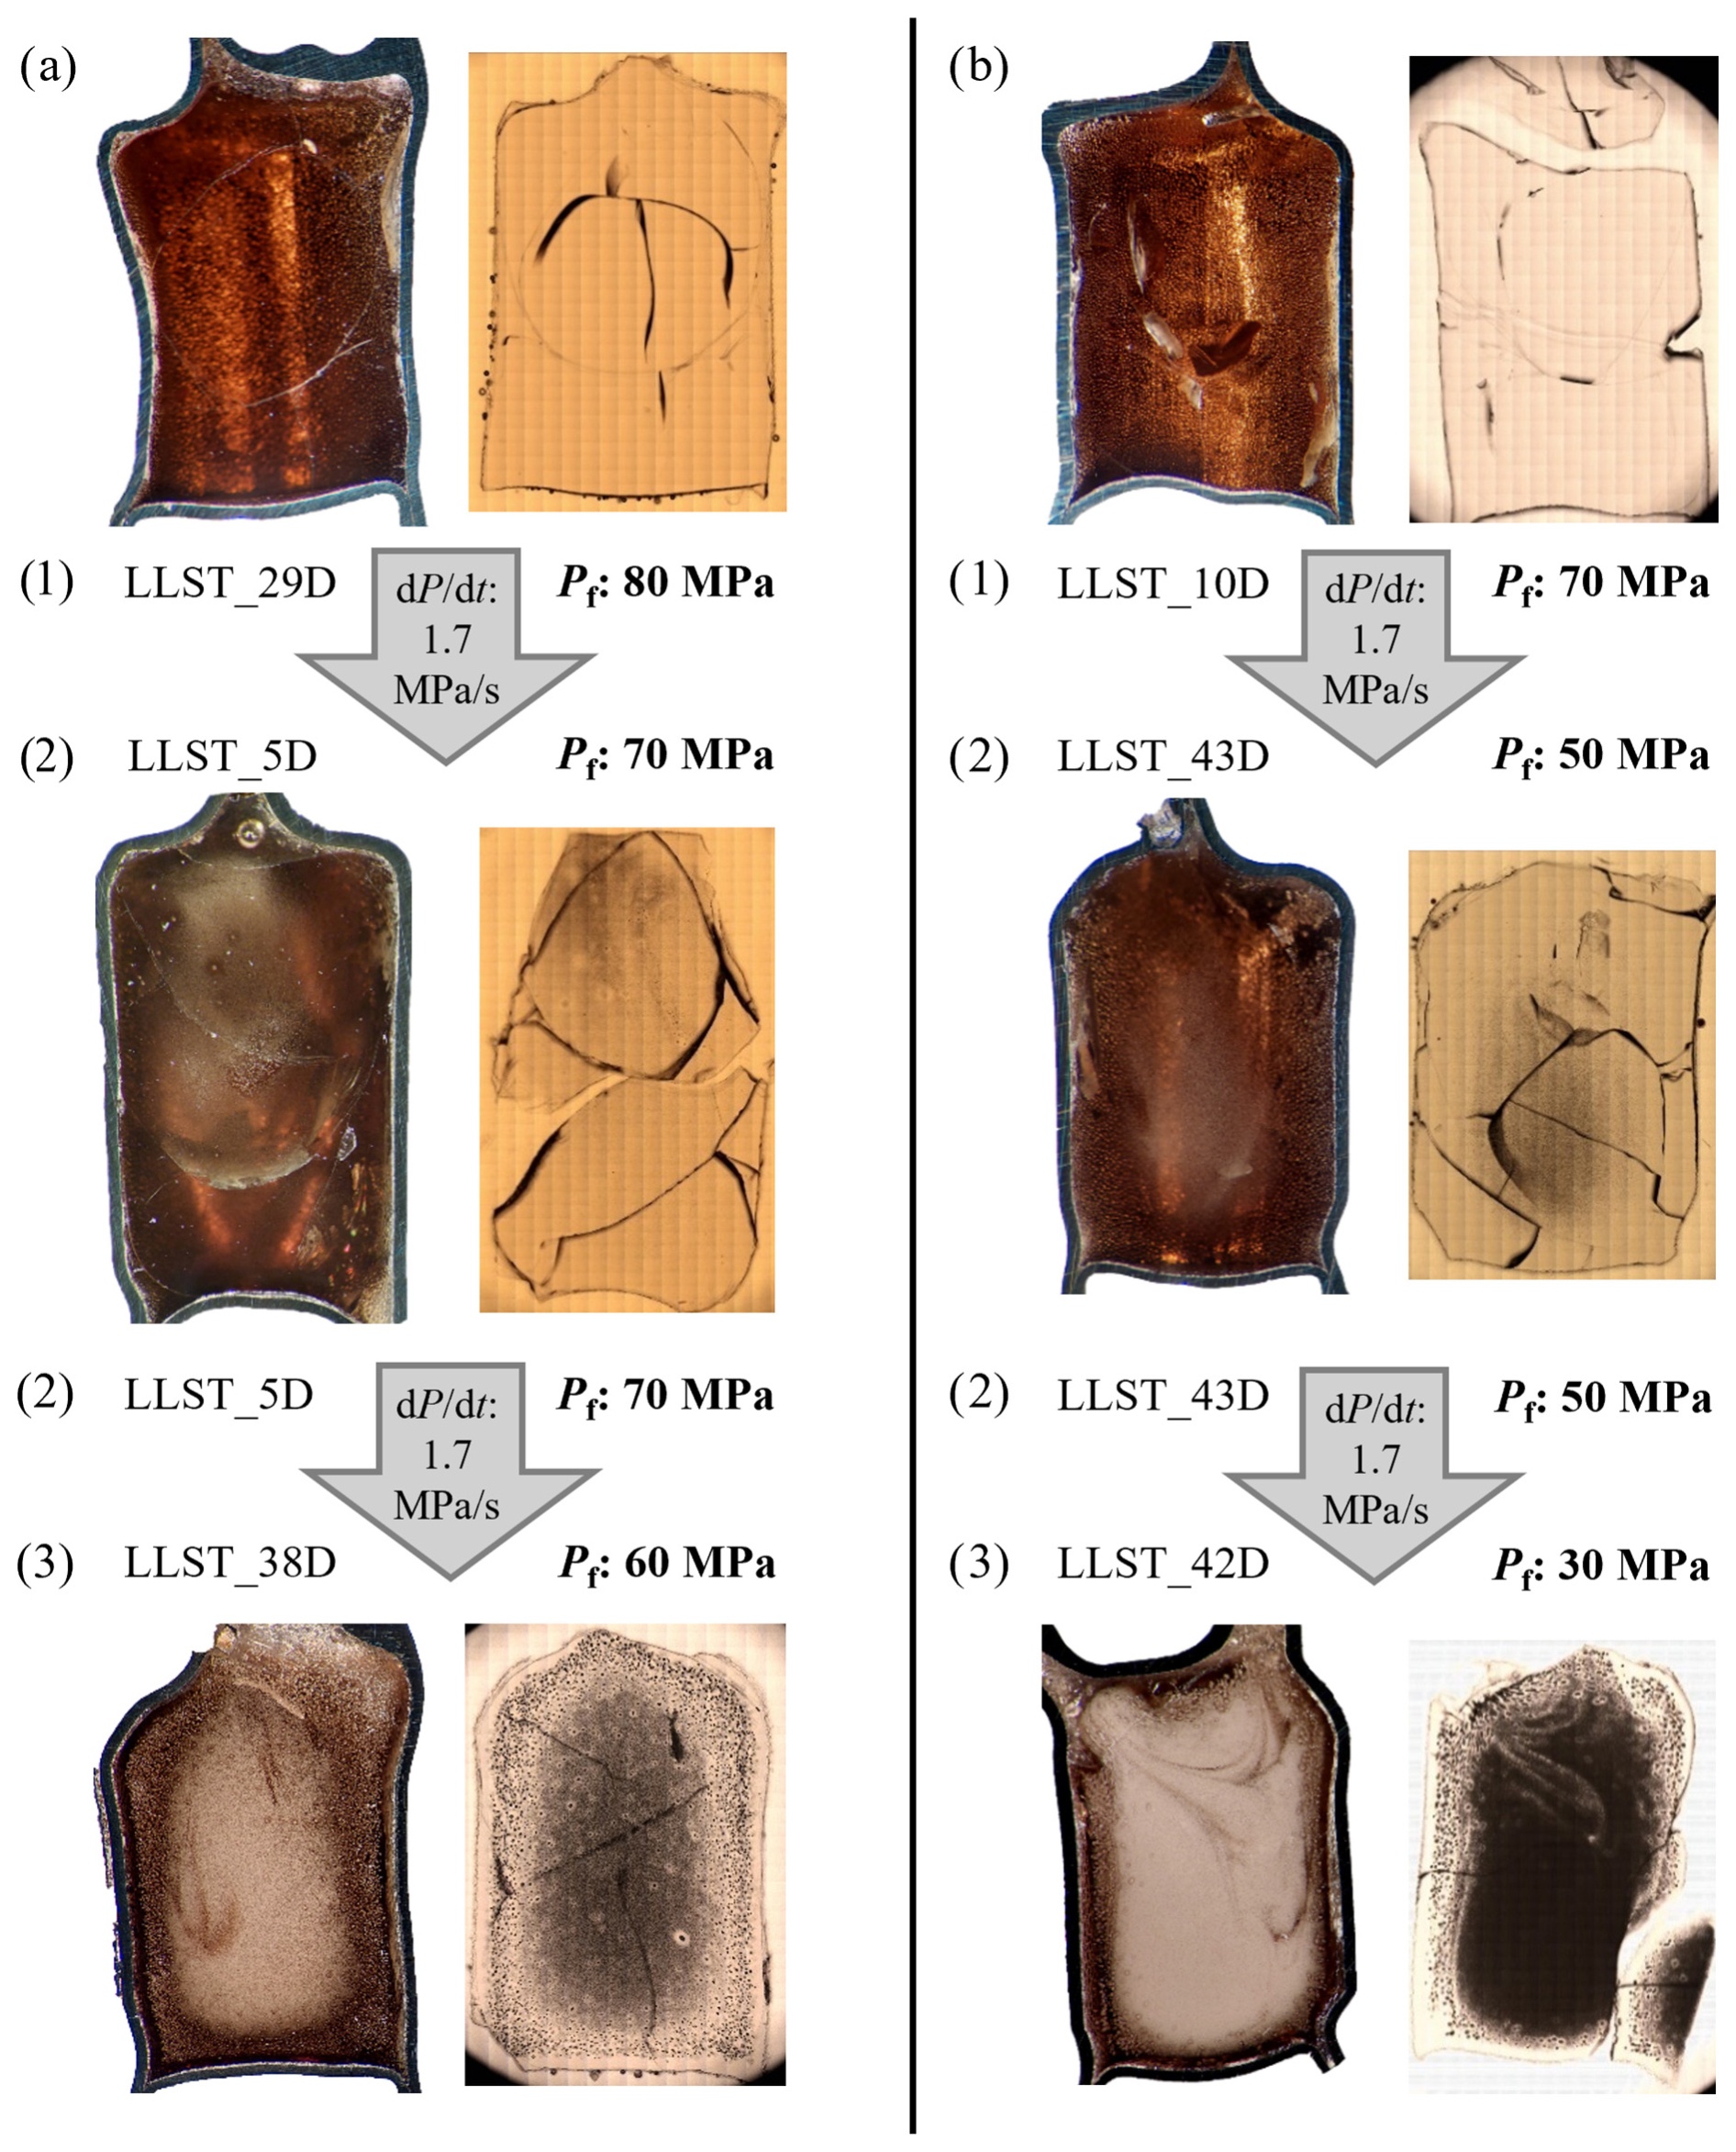
Figure 4Decompression series illustrating vesicle formation during pressure decrease. Samples were initially hydrated with ∼5.7 wt % or 5.0 wt % H2O (corresponding to a and b) at 200 MPa, then decompressed to Pf of 80–30 MPa. An overview of all series with decompression rates of 1.7, 0.17, or 0.064 MPa s−1 is provided in Figs. S2 and S3. All series follow the same progression: (1) No visible vesicle formation due to insufficient PSS; (2) vesicle formation observable, primarily in specific regions of the sample; and (3) vesicle formation throughout the sample, reaching maximum VND. In both displayed samples, partial vesicle coalescence is observed in the intermediate regions between the sample center and the capsule wall. Each sample originally had a capsule inner diameter of 5 mm.
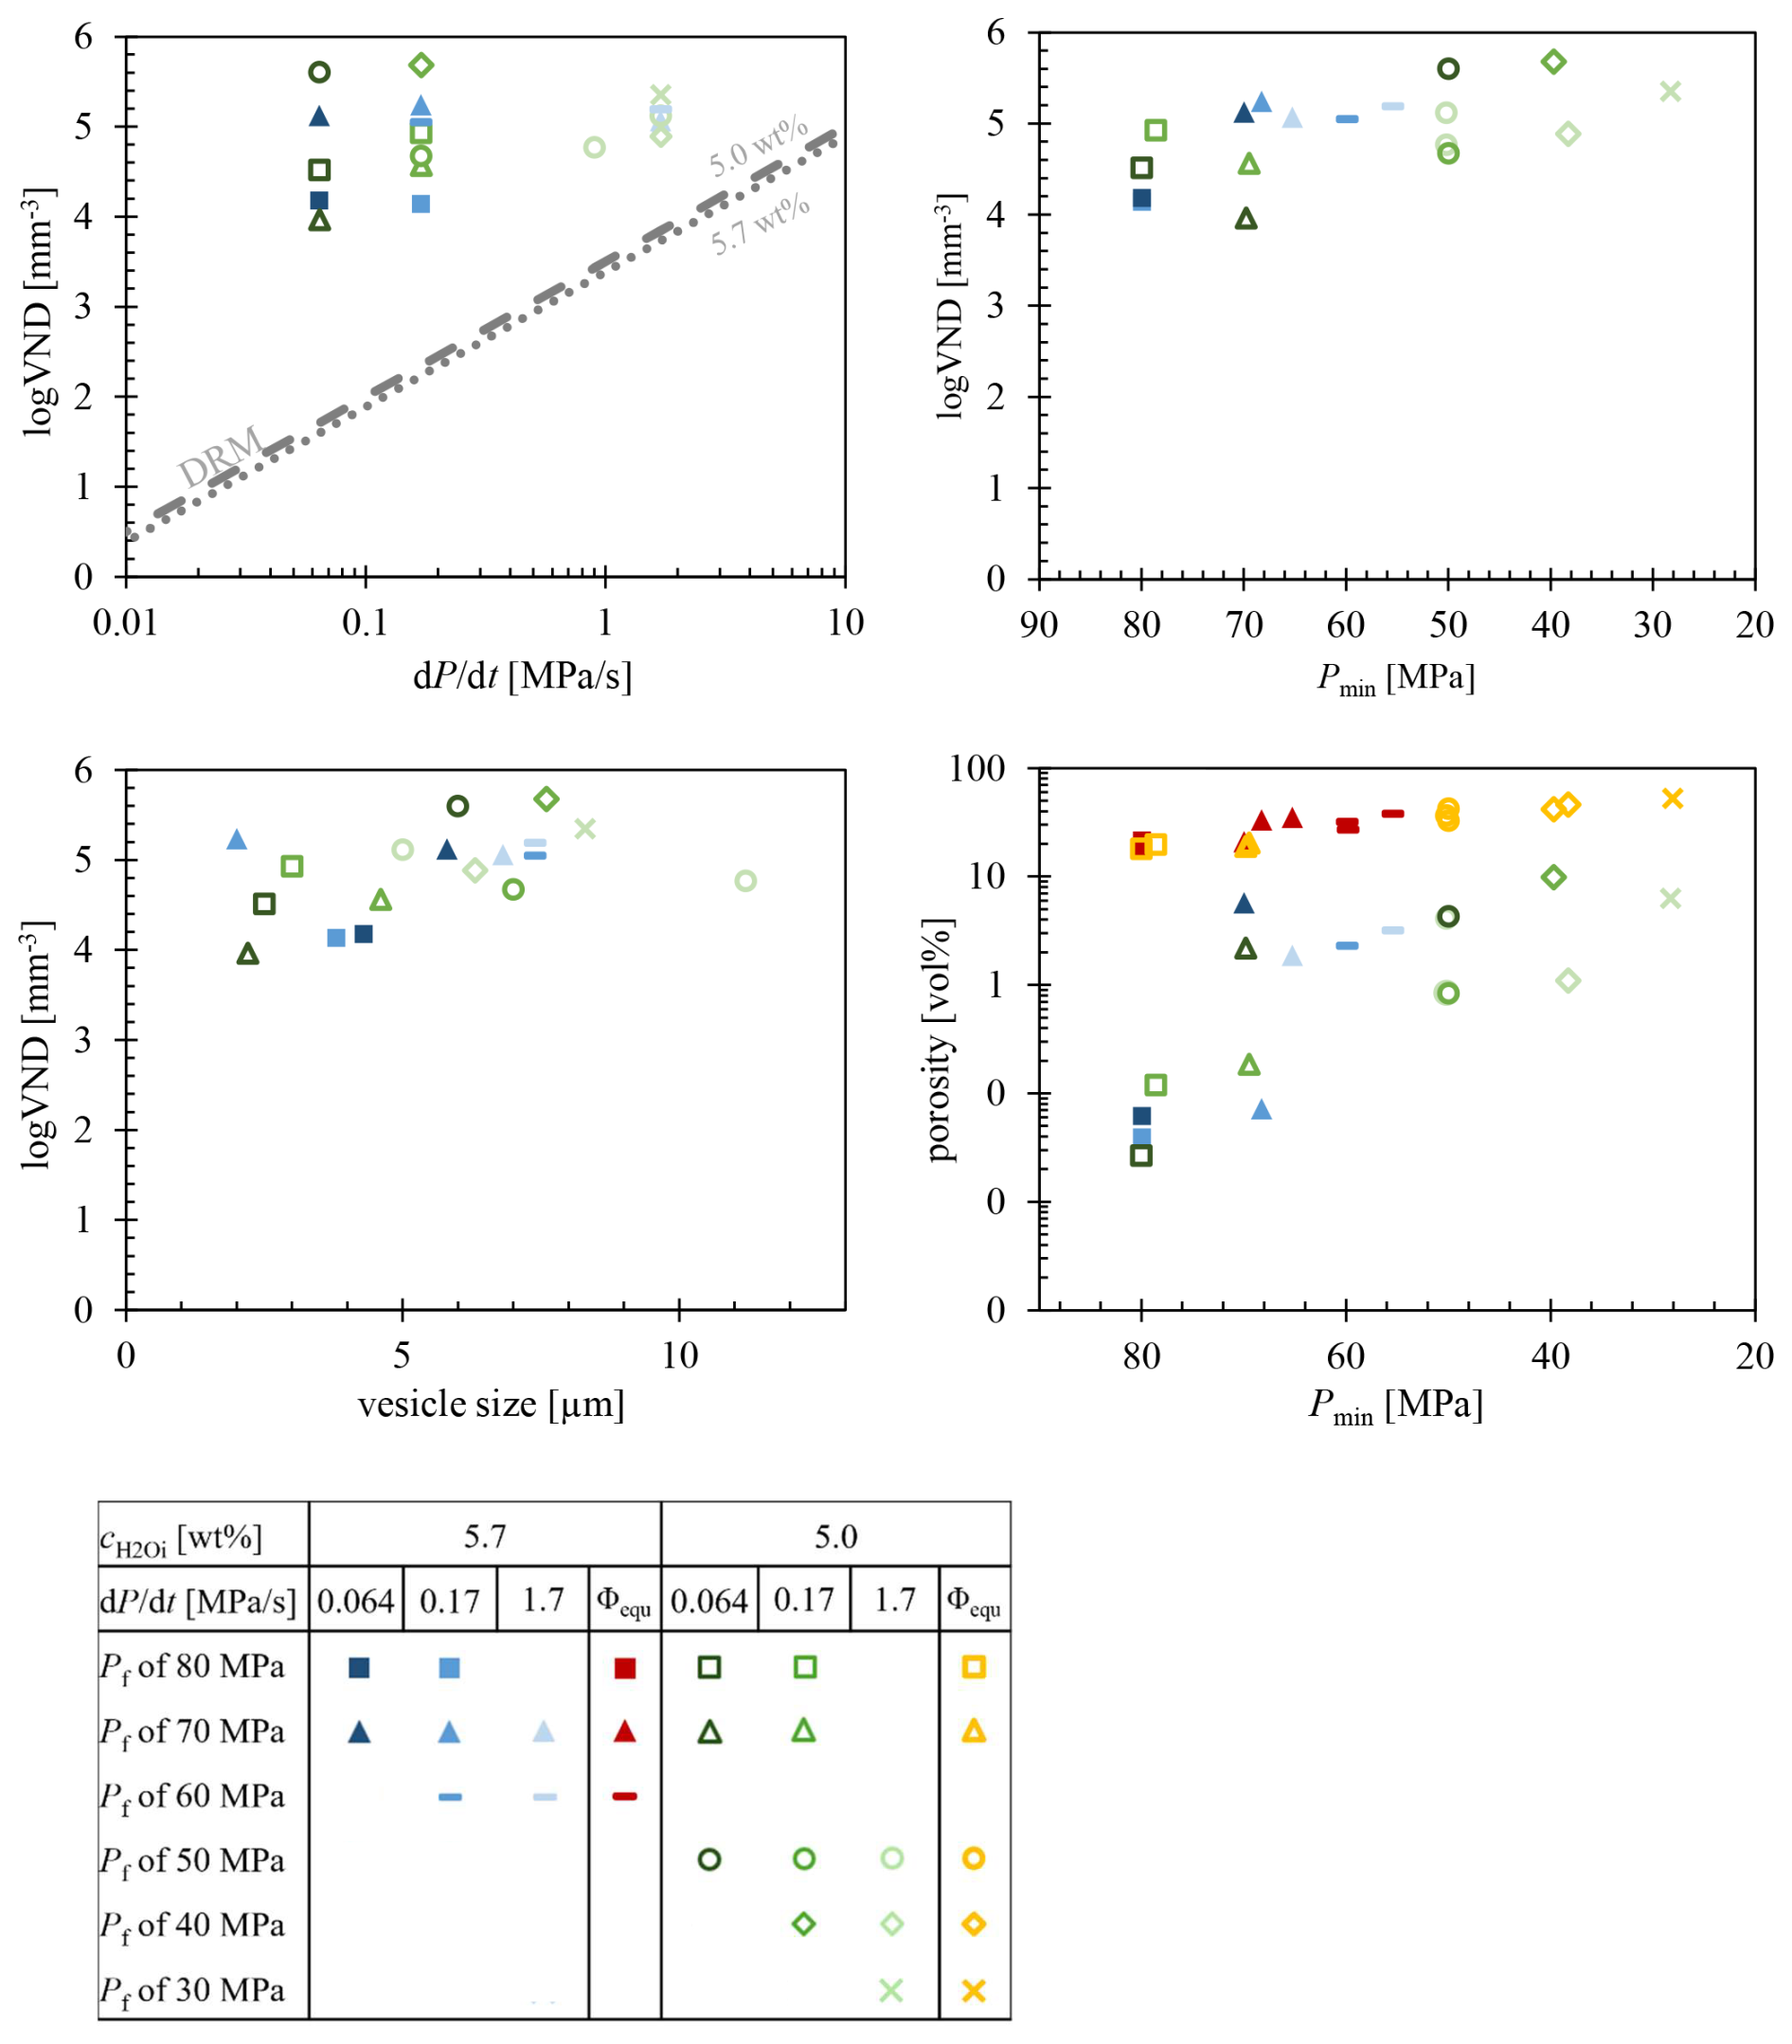
Figure 5The logVND data plots of decompressed LLST samples. In conjunction with the glass porosity plotted in standard colors, the calculated equilibrium melt porosity has been included in the logVND–porosity diagram. Red data points denote a of 5.7 wt %, while yellow data points represent a of 5.0 wt %.
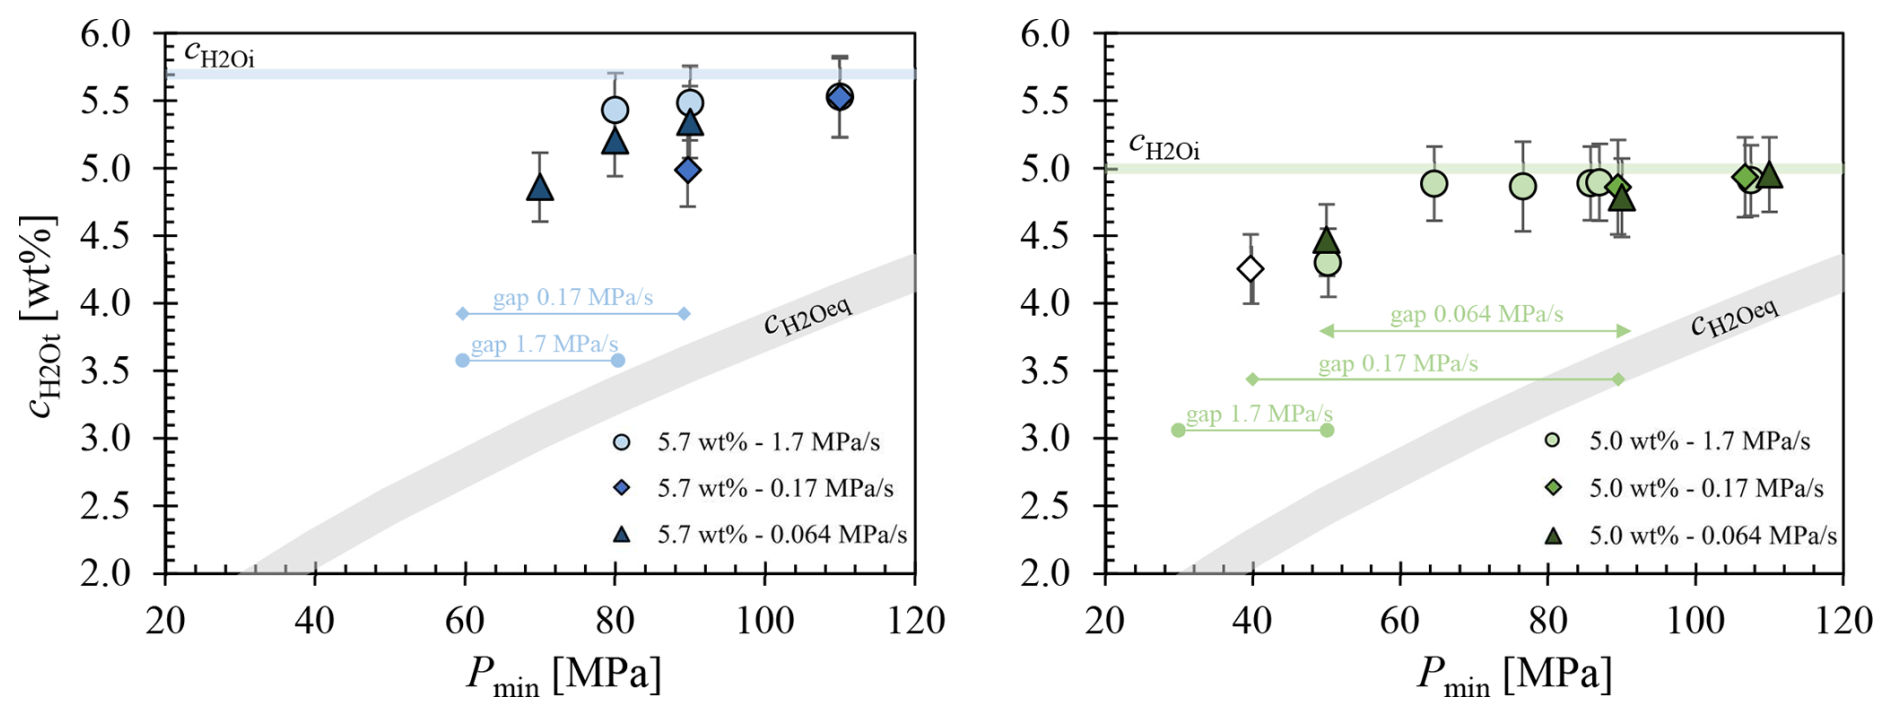
Figure 6The residual of the glasses is plotted against Pmin of the decompressed samples. Only of samples that were able to be measured undisturbed by vesicles in the near-infrared beam path are shown. Blue symbols indicate samples with of 5.7 wt %, while green symbols show samples with of 5.0 wt %. The legend corresponding to the decompression rates is provided in the lower right corner. The curve was calculated according to Eq. (5). Symbols without fill color represent of vesicle-free and H2O-depleted glass regions around pre-existing bubbles or fringe zones and do not represent residual of vesiculated glass regions.
Table 1Conditions and results of solubility experiments. In the solubility section, samples labeled with an “H” were produced using glass pieces, whereas those labeled with “Hg” were derived from an initial glass cylinder. Decompression experiments were hydrated at 200 MPa for 96 h at 1523 K and thermally equilibrated for 0.5 h at 1323 K prior to decompression. Quenching rates: RQ: ∼150 K s−1 (Berndt et al., 2002), MQ: ∼97 K s−1, NQ: ∼16 K s−1 (Allabar et al., 2020b).
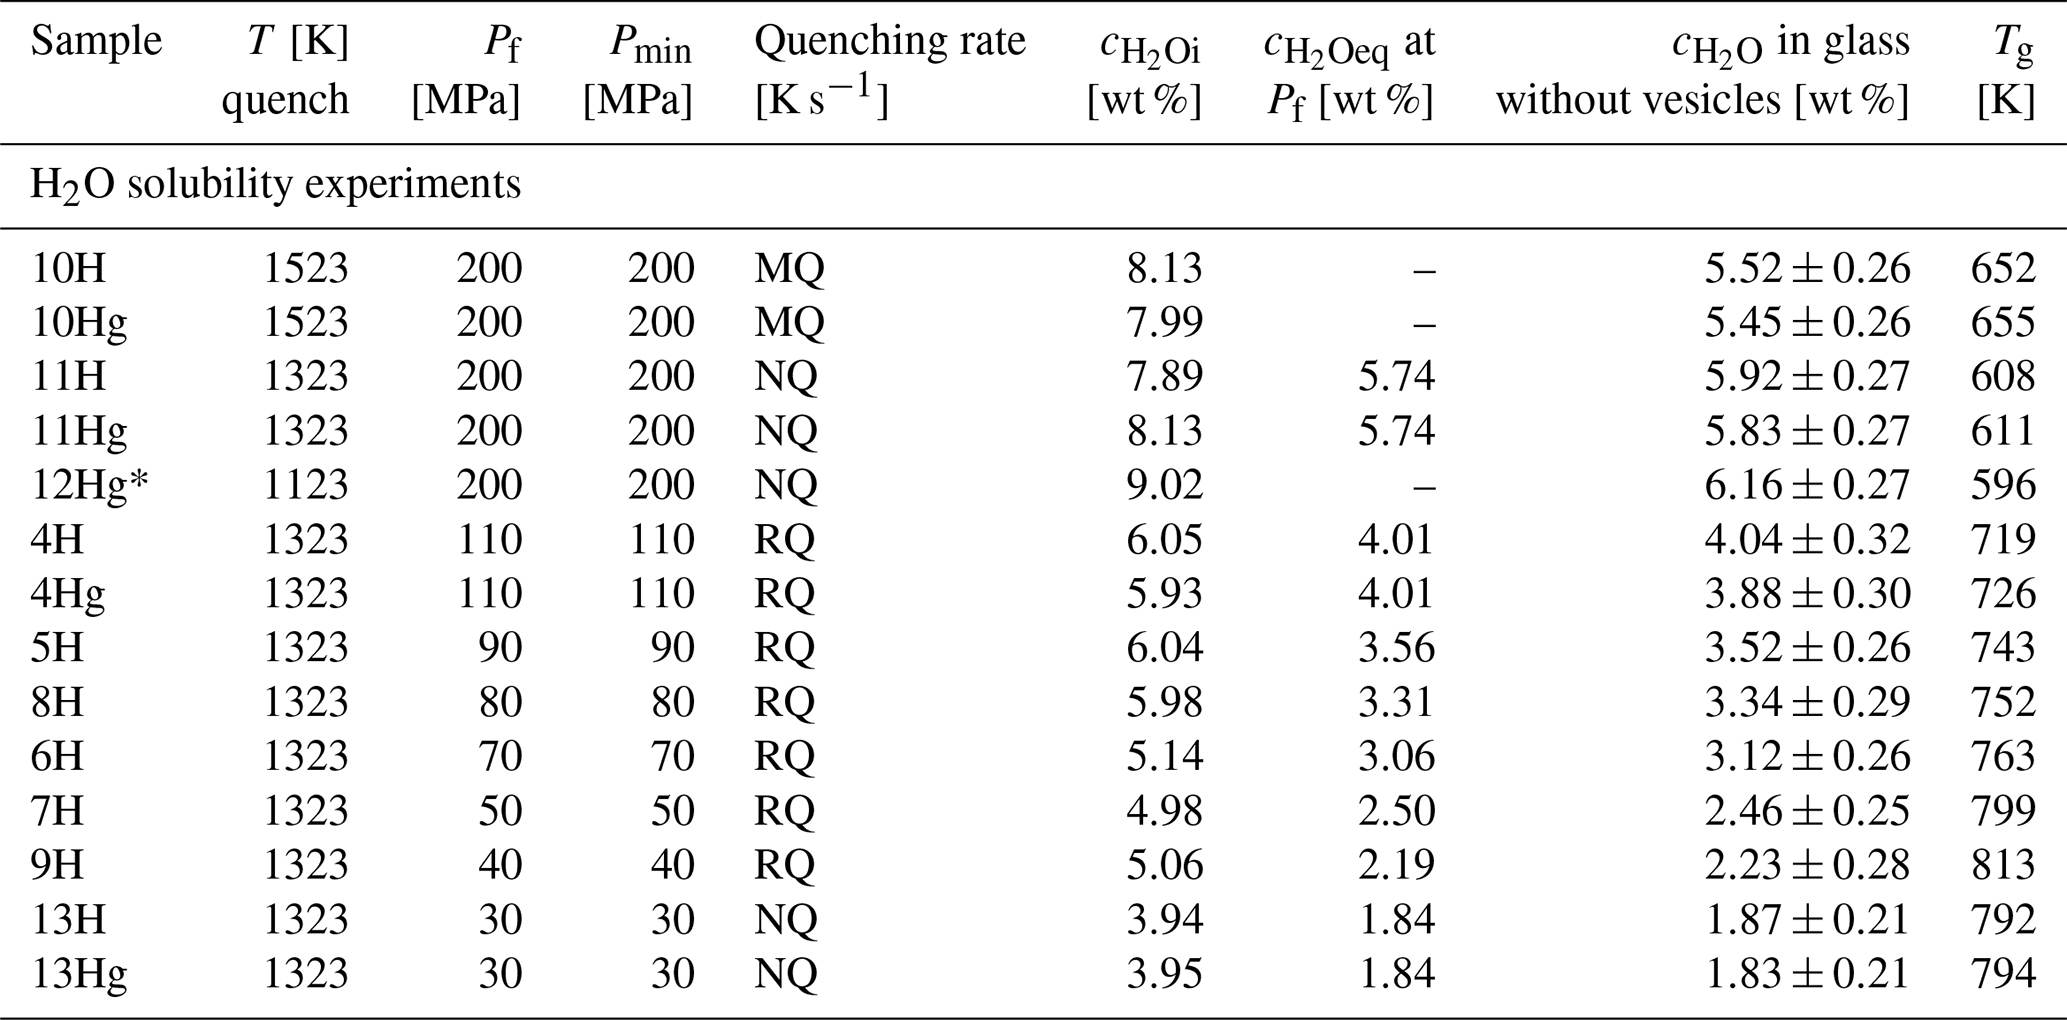
* 24 h at 1123 K
Table 2Decompression samples were hydrated at 200 MPa for 96 h at 1523 K and thermally equilibrated for 0.5 h at 1323 K prior to decompression. Quenching rates: RQ: ∼150 K s−1 (Berndt et al., 2002); MQ: ∼97 K s−1; NQ: ∼16 K s−1 (Allabar et al., 2020b).
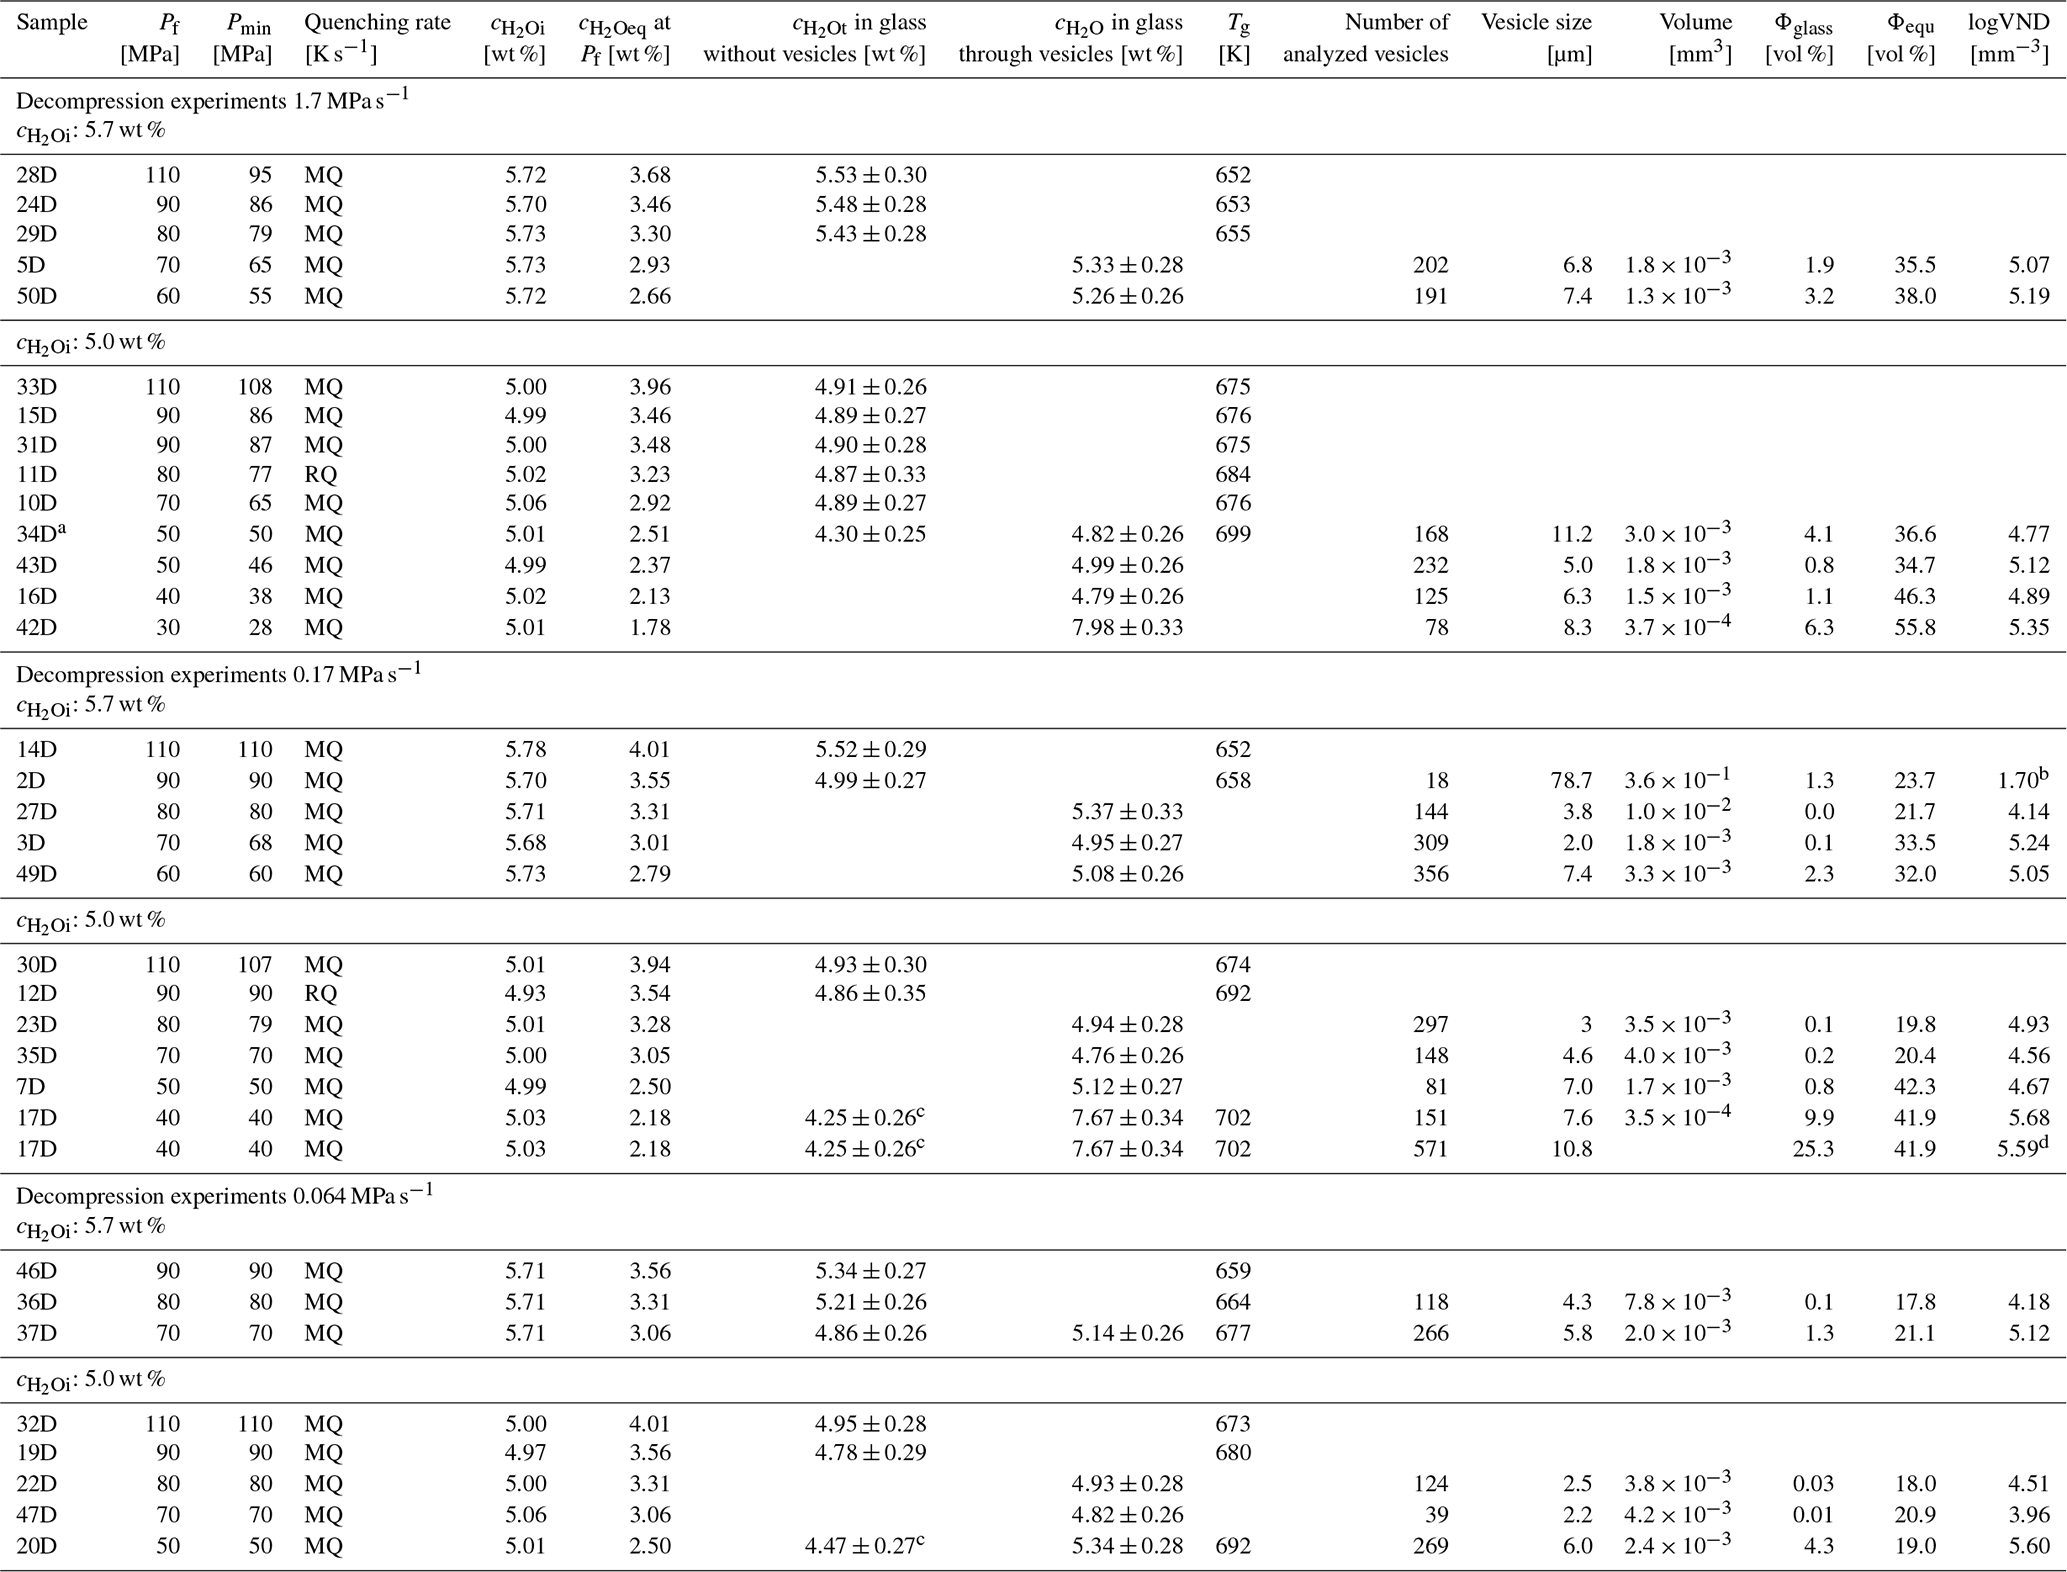
a of 0.9 MPa s−1 in the end of decompression; see Fig. D1. b pre-existing bubbles; c determined in depleted areas; d determined by CSDcorrections.
5.1 Decompression samples
5.1.1 Onset of vesicle formation, PSS determination, and its problem
To investigate the homogeneous vesicle formation of the LLST melt, decompression series with two different initial H2O concentrations were conducted. Regarding the solubility experiments, H2O saturation prior to decompression was nearly achieved for the 5.7 wt % series, as the determined Psat at 1323 K was 198 MPa, which closely matches the hydration pressure of 200 MPa. For the series with a of 5.0 wt %, Psat was calculated to be 156 MPa (Eq. 5). Consequently, while supersaturation of the melt occurs immediately at 5.7 wt % after the start of decompression, a pressure decrease of ∼40 MPa must first be achieved before supersaturation begins at ∼156 MPa for the 5.0 wt % series.
This initial Psat difference and the associated PSS, determined as the pressure difference between Psat and the pressure at which vesicles are first observed, do not influence the observed onset of vesicle formation within the frame of the analyzed 10 MPa intervals for the two series. At slower decompression rates (0.064 and 0.17 MPa s−1) and a Pf of 80 MPa, the first vesicles appear in the glass. However, at a faster decompression rate of 1.7 MPa s−1, lower Pf values are required: 70 MPa for the 5.7 wt % series and 60–50 MPa for the 5.0 wt % series. Consequently, the PSS necessary for vesicle formation in the 5.7 wt % series is 120 MPa at the slower decompression rates, increasing to 130 MPa at 1.7 MPa s−1. In contrast, the PSS for the 5.0 wt % series is 80 MPa at 0.064 and 0.17 MPa s−1, rising to 100–110 MPa at the fast decompression rate. Therefore, the observable onset of vesicle formation necessitates a higher PSS of ∼40 MPa for the initially saturated melt compared to the initially slightly undersaturated melt at slower decompression rates. Nonetheless, faster decompression rates demand an even higher PSS, corresponding to a lower Pf of 10 to 20–30 MPa, depending on .
To date, we are unable to fully explain this behavior. However, we propose that phase separation may have occurred at higher Pf and lower PSS, but the H2O resorption process during cooling might have resulted in the complete dissolution of the already formed vesicles. Resorption of H2O from the fluid vesicles into the melt during quenching (McIntosh et al., 2014; Allabar and Nowak, 2020) is driven by the increasing solubility of H2O in phonolitic melt with decreasing temperature at pressures <300 MPa (Schmidt and Behrens, 2008). This effect is more pronounced for the 5.7 wt % series, due to the higher diffusivity with greater , as well as the low melt viscosity, which decreases with higher residual (Giordano et al., 2008). The resorption of H2O from vesicles back into the melt was demonstrated by Allabar and Nowak (2020) for samples containing 4 wt %–5 wt % residual in the glass. The effect was quantifiable due to the large vesicle size of ∼20 µm. Resorption halos of 3 and 10 µm were detected around the vesicles, depending on the quenching rate (>100 and 44 K s−1, respectively). The high quenching rate of >100 K s−1 is comparable to the quenching rate determined in these experiments, which was 97 K s−1, although slightly slower, thereby enhancing the effect of greater resorption. Therefore, if we assume vesicles of ∼1 µm in diameter at high Pf of 90 or 110 MPa, these vesicles would have dissolved completely. The effect of resorption is particularly pronounced in the samples of the 5.7 wt % series, as evidenced by a comparison of vesicle sizes. While the vesicle diameters in the glasses of the 5.0 wt % series are initially very small, measuring 2.2, 3.0, and 5.0 µm for decompression rates of 0.064, 0.17, and 1.7 MPa s−1, respectively, the first analyzable vesicle diameters in the 5.7 wt % series are significantly larger at 4.3, 3.8, and 6.8 µm, which is roughly double the size. However, the molar volume of H2O increases sharply with decreasing pressure, causing expansion to have an increasingly significant role at lower pressures. This effect is more pronounced in the 5.0 wt % series, where vesicle formation occurs at lower Pf, favoring the appearance of the first analyzable vesicle sizes. Therefore, it is reasonable to infer that smaller vesicles were initially present in the decompressed melts of the 5.7 wt % series at higher Pf. However, these vesicles likely dissolved completely due to resorption during the quenching process.
5.1.2 Glass vs. melt porosities
The vesicles in each individual sample are of uniform size within the resolution range. Following the onset of vesicle formation, subsequent decompression led to vesicle growth without significant change in VND (Fig. 5). For maximal logVNDs ranging from 5.1 to 5.7, a mean-vesicle distance (x) of ∼7 to 9 µm was calculated based on Hertz (1908) () for a random vesicle distribution. This inter-vesicle distance is sufficiently small to enable near-equilibrium and near-equilibrium porosity to be achieved within seconds through H2O diffusion during further decompression, as can be estimated using the H2O diffusivity reported by Schmidt et al. (2013). However, for all samples, the glass porosities are with 0.01 %–10 % significantly lower than the calculated equilibrium porosities prior to quenching, yielding values between 18 %–56 % (Table 2, Fig. 5). These equilibrium porosities exceed the measured glass porosities by a factor of 10 to 100. This discrepancy can be attributed to vesicle shrinkage resulting from the reduction in the molar volume of H2O (Marxer et al., 2015) and the resorption of H2O from the fluid vesicles into the melt during quenching (McIntosh et al., 2014; Allabar et al., 2020a). Allabar et al. (2020b) determined a fictive temperature (Tf) at which vesicle shrinkage stops, up to 200 K above the glass transition temperature (Tg) for a cooling rate of 44 K s−1. To calculate Tf, Tg was first calculated according to Giordano et al. (2008), which is dependent on in the melt. Lower increases Tg (Giordano et al., 2008), and the temperature where vesicles are preserved in the glass is higher at the same quenching rate. Based on the expected near-equilibrium degassing with near-equilibrium , we can assume that was reached in the melt at a high logVND of ∼5.5. The Tg was calculated for the determined Pf where vesicles are preserved in the glass after quenching, ranging from 745 to 787 K at the specific observable onset of vesicle formation at the cooling rate of 97 K s−1. Adding 200 K to reach Tf yields K, covering all samples. This results in temperature differences from the degassing temperature (1323 K) of 350 K. Considering the more than double the cooling rate (97 K s−1 compared to 44 K s−1) reduces the shrinkage and resorption time to 3–4 s instead of ∼9 s as valid for Allabar et al. (2020b). Therefore, the resorption halos around the vesicles in our samples should be smaller than the 3 to 10 µm determined by the authors, yet the effect remains observable in the measured . However, we suggest that during decompression near-equilibrium conditions were established at the maximum logVNDs, where homogeneous vesicle formation occurred. A more detailed discussion of porosity including an extended dataset is addressed in the associated coalescence companion paper (Marks and Nowak, 2025).
5.1.3 Total H2O content
The high logVND of ∼5.5 and inter-vesicle distances of 7–9 µm should enable near equilibrium degassing. However, the in the residual glass are 1 wt %–2 wt % higher than at Pf. The values close to at higher Pf correlate with the absence of vesicles or with the lowest logVNDs of ∼4, related to resorption.
The effect of resorption of H2O back into the melt during quenching, has already mentioned in vesicle formation, as well as in glass porosity, and plays also in analyzing a crucial role. The of the glass between vesicles does not represent dissolved in the melt at Pf prior to quenching due to H2O resorption from the fluid phase back into the melt (McIntosh et al., 2014; Allabar et al., 2020b). During all stages where vesicles were present, resorption took place and increased the in the residual melt, and therefore in the measured glass areas. A simplified calculation illustrates the absorption effect during quenching. During the assumed cooling duration of 4 s within the quenching process, H2O diffusion distances were calculated according to the diffusion equation of Schmidt et al. (2013), assuming for 1323 K as well as Tf of 965 K. Covering all samples at different Pf and their corresponding , H2O diffusion distances of 22–19 µm for 1323 K and 5–3 µm for 965 K were calculated. Therefore, even with the decreasing diffusion coefficient at decreasing temperature, at least a resorption distance of 3 µm can be achieved, which is responsible for the high in the residual glasses. Importantly, the interstitial glass of the samples, where equilibrium degassing is expected due to the short inter-vesicle distance, was not measurable due to the high VND, preventing FTIR measurements of glass without vesicles in the measured volume. These stages are marked in Fig. 6 by the gaps, according to each decompression series. The subsequent stages of beginning coalescence again allowed measurements in the residual glass, although between large vesicles. Disequilibrium is expected again in these cases, due to the increased vesicle distances, explaining the high . The H2O content in the residual glass is analyzed in detail in Marks and Nowak (2025), incorporating an extended dataset that examines the transition of during maximum VND to the onset and progression of coalescence.
These observations are similar to those of Allabar et al. (2020b) on K-phonolite melt of the Vesuvius AD79 eruption (VAD79). Their decompressed samples also exhibited high residual of about 2 wt % above , despite calculations indicating near-equilibrium conditions in all experiments due to sufficiently high H2O diffusivity and small inter-vesicle distances at a 10 µm scale at high logVNDs of 4.6 to 6.3, which are quite similar to the VNDs of this study.
The parameters measured in the glass, such as and porosity, do not reflect the melt conditions during decompression. Vesicles form at a sufficiently high PSS, grow during continuous decompression, and shrink during quenching with simultaneous resorption of H2O from the fluid vesicles back into the melt, potentially to the extent of complete dissolution. These factors are enhanced by depolymerized melt structures due to the lower viscosity as well as increased diffusivity resulting from high . To minimize these effects, it is essential to quench the melt as quickly as possible when analyzing and quantifying these parameters, while also considering the potential cost of sample breakage.
5.1.4 Decompression-rate-independent VND
To determine the degassing mechanism of the LLST melt, VNDs were quantified in vesiculated samples. This allowed us to distinguish between a decompression-rate-dependent behavior (where VND increases with increasing decompression rate and thus a significant increase of VND with Pf) and a decompression-rate-independent behavior (where VND remains constant across different decompression rates). The decompression-rate-dependent VND can be explained by nucleation theory, where vesicles form only to the extent necessary to reduce supersaturation, resulting in a range of vesicle sizes within a single sample as new vesicles form when the existing ones are insufficient (Navon and Lyakhovsky, 1998). Based on this theory, Toramaru (2006) established a decompression rate meter (DRM) that derives magma ascent velocity using VNDs of volcanic ejecta. For comparison, the DRM was applied to hydrous LLST melt used in our study considering the physicochemical key parameters.
C: initial total H2O concentration (number of molecules per cubic meters [m−3]); σ: surface tension of the vesicle–melt interface [N m−1]; k: Boltzmann constant ( [J K−1]); T: temperature [K]; Psat: H2O saturation pressure [Pa]; D: H2O diffusivity in the silicate melt [m2 s−1]; Vm: volume of an H2O molecule in the melt m3 (Burnham and Davis, 1971); : decompression rate [Pa s−1]
The model assumes that each H2O molecule is a potential vesicle nucleation site and that nucleation ceases during decompression when the VND reaches a level where vesicle distances are sufficiently small for a diffusion-controlled decrease in H2O concentration below a supersaturation threshold needed for further vesicle nucleation (Toramaru, 2006). Using the DRM, the logVND as a function of can be calculated by considering diffusivity, surface tension, and the H2O content via the saturation pressure (Psat). The required H2O diffusivity (logD) was calculated by Eq. (8), according to Schmidt et al. (2013):
The surface tension was calculated according to Shea (2017) and was predicted to be 0.1231 N m−1 for 5.7 wt % H2O and 0.1411 N m−1 for 5.0 wt %. Applying these values in the DRM, the linear logVND trend with the fixed slope of would match our experimentally determined maximum logVND of 5.7 at an unrealistically high decompression rate of ∼30 MPa s−1.
In contrast to nucleation theory, the determined maximum logVNDs of 5.1–5.7 with uniformly sized vesicles across all decompression rates indicate a decompression-rate-independent behavior for the LLST melt. This behavior might indicate an off-critical spinodal decomposition process, which has been observed in supersaturated K-phonolitic melts (Allabar and Nowak, 2018; Allabar et al., 2020b).
Slight variations in the logVND of 4–5.7 determined in quenched glasses are likely related to resorption processes. Glass samples with logVNDs of 4–5 indicate the early stages of degassing, primarily seen in samples with high Pf of 80 and 70 MPa. In these cases, a small number of vesicles formed during decompression appear to have survived the quenching, potentially due to slight differences in vesicle size. It is also plausible that smaller vesicles with numerous neighboring vesicles underwent resorption, thereby favoring the growth of larger vesicles. The vesicles that underwent resorption would have continued to grow if the melt had been subjected to further decompression, as observed in samples quenched at lower Pf, showing high logVNDs with 5.1–5.7. However, such minor variations in vesicle size could not be resolved within the scope of this study and with the analytical methods employed. Consequently, it is expected that the majority of minimally smaller vesicles dissolved during the quenching process. This is also reflected in the vesicle sizes in the glass, generally ranging between 2 and 5 µm for samples with Pf of 80 and 70 MPa. Increased vesicle sizes related to vesicle growth are observed for samples at lower Pf, which also correspond to the highest logVNDs, with values of 5.1–5.7 representing the VND of the vesicle formation process unaffected by extinction related to resorption. The VND keeps constant down to a Pf of 70–60 MPa for samples with of 5.7 wt % and Pf of 50–30 MPa for samples with of 5.0 wt %, caused by the different ΔPSS values. These samples also correspond to the highest porosities, measured in glass with up to 10 vol %. However, in the series with 0.17 and 0.064 MPa s−1, a third stage of vesiculation was observed. The VNDs of all series show a slight decrease in logVND by 0.1 to 0.2 at 0.17 MPa s−1 and even 0.5 to 0.8 at 0.064 MPa s−1, which is correlated to the observed onset of coalescence. A detailed analysis of the coalescence behavior in the LLST melt, based on an extended dataset, is presented in the corresponding coalescence paper (Marks and Nowak, 2025).
The data from Allabar and Nowak (2018) and Allabar et al. (2020a, b) are particularly comparable to this study due to a similar experimental design and bulk composition. Allabar and Nowak (2018) observed vesicle formation in the hydrous VAD79 composition with 5.3 wt % H2O at Pf of ≤100 MPa, showing homogeneously distributed vesicles with logVNDs of 4.8–5.4, irrespective of decompression rates ranging from 0.024 to 1.7 MPa s−1. Further decompression to 70 MPa did not change VND but only led to vesicle growth, similar to the behavior of LLST melt. Thus, the results of VAD79 and LLST show a decompression-rate-independent behavior. A decompression-rate-dependent behavior would follow the DRM line, as calculated using the Toramaru (2006) model (Fig. 5).
Despite the suggested independence of the initial VND on the decompression rate, an apparent dependence of VND on the onset of the observable vesicle formation was observed. The Pf of the highest logVNDs shifted towards faster decompression rates. While at 5.0 wt % H2O and 0.064 MPa s−1 the highest logVND is measured at a Pf of 50 MPa, Pf decreased to 40 MPa at 0.17 MPa s−1 and even to 30 MPa at 1.7 MPa s−1 (Table 2). Partially, there is a correlation between the observable onset of vesicle formation in the glass and the vesicle formation in the melt, which is evident when comparing the respective PSS values (see Sect. 5.1.1 “Onset of vesicle formation”).
However, the data show an apparent clustering of logVNDs between 4.8 and 5.4 covering all samples at 1.7 MPa s−1, while slower-decompressed samples at 0.17–0.064 MPa s−1 range from logVNDs of 4.0 to 5.7. This might be an artifact of the decompression time. With decreasing decompression rate, the decompression time increases significantly. For comparison, decompression from 200 to 70 MPa requires 76 s (1.2 min) at 1.7 MPa s−1, 765 s (13 min) at 0.17 MPa s−1, and 2031 s (34 min) at 0.064 MPa s−1. This longer decompression time at slower rates leads to increased vesicle growth. Thus, the beginning of vesicle formation at the fast decompression rate is not resolvable due to the rapid decompression within a few seconds and subsequent resorption and shrinkage during quenching, as this process may effectively erase already formed vesicles if they are particularly small.
Besides the decompression rate independence in VND, we want to highlight the independence of VND on prior to decompression, as both H2O series cover the same range of logVND (Fig. 5). This observation differs slightly from the data of Allabar and Nowak (2018) and Allabar et al. (2020a). They conducted a set of decompression experiments at a constant temperature of 1323 K and a decompression rate of 0.17 MPa s−1, while varying the initial H2O content. The experimental set from Allabar and Nowak (2018) with a of 5.3 wt % H2O was extended to include experiments with higher (∼6.3 wt %) and lower (∼3.3 and ∼4.3 wt %). While our data show a VND independent of , Allabar et al. (2020a) showed a -dependent (∼3.3 wt %–6.3 wt %) logVND with minimum numbers of formed vesicles around logVNDs of ∼5 for of 5 wt %. They observed that logVND increases significantly towards both lower and higher values by an order of magnitude.
However, there are some notable features in the dataset from Allabar et al. (2020a). Although the influence of on logVND is emphasized, some samples with almost identical initial conditions exhibit different VNDs. For example, sample CD83 has a logVND of 5.78, while sample CD42 has a logVND of 4.98, a difference of 0.8 log units. CD83 had a of 5.46 wt % and was decompressed at 0.17 MPa s−1 to Pf of 80 MPa. CD42 had a of 5.20 wt % and was decompressed at the same rate to a Pf of 90 MPa. Although remained almost the same, the sample with the lower Pf (CD83) had a significantly higher VND. This observation aligns with our findings for the LLST samples. Further samples from Allabar et al. (2020a) confirm this trend. Their lowest logVND of 4.60 corresponds to the sample with the highest Pf of 100 MPa. Although this Pf is 20 MPa above the pressure determined here for the onset of vesicle observation, it supports the observation of partial extinction of the smallest vesicles during quenching at early stages of degassing.
However, their observation that determines the VND of initial phase separation and the evolution of vesiculation during decompression cannot be confirmed for the LLST composition. Still, our observation of the increasing VND towards lower Pf is supported by their experiments with VAD79, albeit not as clearly as with LLST. Nonetheless, an effect of on the VND for LLST composition cannot be entirely ruled out. Further decompression experiments with significantly different values would be necessary for such an analysis.
We can state that both Na2O-rich and K2O-rich phonolitic melt compositions result in the same decompression-rate-independent vesicle formation process. There is evidence that the enrichment of alkalis, especially in phonolites, allows off-critical spinodal decomposition to occur at crustal pressures (Allabar and Nowak, 2018), whereas spinodal decomposition of critical compositions like hydrous rhyolites would require high pressures of >1 GPa (Bureau and Keppler, 1999). During further decompression of the system, recurring supersaturation of the melt is prevented by downhill diffusion of H2O into existing vesicles, as demonstrated by increasing vesicles sizes with decreasing Pf (Fig. 5). This is consistent with our observations of increasing vesicle size with decreasing pressure while the VND remains constant. Hence, off-critical spinodal decomposition could explain the high VNDs in decompressed hydrous silicate melts by enabling the spontaneous phase separation of H2O without relying on the nucleation process.
The experimental results in this study offer critical parameters of the phonolite melt, such as equilibrium H2O solubility, ΔPSS, VND, and melt porosity, that can improve melt degassing simulations. Our findings show that high VNDs are consistently observed under both H2O-saturated and H2O-undersaturated conditions, independent of the decompression rate. During vesiculation, logVND values ranging from 5.1 to 5.7 were recorded, with uniform vesicle sizes across samples, suggesting that degassing is potentially driven by spinodal decomposition rather than by classical nucleation theory. At these high VND levels, near-equilibrium degassing from the melt into adjacent vesicles is expected during decompression. Further decompression experiments at lower final pressures are presented in Marks and Nowak (2025) to trace the subsequent degassing pathway potentially triggering explosive eruptions through rapid vesicle expansion and increased buoyancy or, alternatively, promote effusive behavior through coalescence and the formation of percolation channels.
In recent decades, optimal experimental conditions – from starting material to sample preparation – have been developed to study H2O vesicle formation in hydrous silicate melt during decompression. The following outlines the key components of the successful experimental protocol.
Starting material. Previous research has utilized natural porous volcanic rock or glass powders as the starting material for experiments. Adjusting conditions to create H2O supersaturation during the synthesis of hydrous melt (e.g., Larsen and Gardner, 2004; Gardner and Denis, 2004; Gardner, 2007; Larsen, 2008; Mongrain et al., 2008; Shea et al., 2010; Cichy et al., 2011) can result in the formation of hydration vesicles in the sample volume before decompression (e.g., Gardner et al., 1999; Larsen and Gardner, 2004; Iacono-Marziano et al., 2007). Likewise, even under H2O-undersaturated conditions, the synthesis process induces the formation of N2–H2O vesicles due to entrapped air in the pores of the glass powder used (Preuss et al., 2016), resulting from the very low solubility of N2 even at high pressures and temperatures (Keppler et al., 2022). These pre-existing fluid vesicles within the melt volume experience growth during subsequent decompression, leading to a reduction in the H2O content of the melt. Consequently, the supersaturation of the melt, necessary for the formation of new vesicles, may be decreased before extensive homogeneous vesicle formation can occur (Preuss et al., 2016; Allabar and Nowak, 2018; Allabar et al., 2020b). Therefore, for observing homogeneous vesicle formation the initial glass porosity should be below a critical value of ∼6 vol % (Preuss et al., 2016).
Sample size and decompression time. A crucial factor influencing vesiculation is the decompression timescale, which is determined by factors such as the initial pressure, saturation pressure, decompression rate, and the final pressure (e.g., Mangan and Sisson, 2000; Preuss et al., 2016). The diffusion-controlled loss of volatiles into vesicles, which are nucleated heterogeneously and early at the interface between the capsule and melt, dictates the diameter of the sample necessary to maintain a sufficiently sized unaffected melt volume at the center of the sample (Fig. S1; Preuss et al., 2016; Allabar and Nowak, 2018; Allabar et al., 2020a, b). Additionally, for low-viscosity hydrous melts, the ascent of vesicles formed heterogeneously at the bottom of the capsule into the melt volume imposes a constraint on the available time for decompression (Allabar and Nowak, 2018). These constraints necessitate the use of the largest technically feasible sample capsule diameter and length for investigating vesicle formation.
Continuous decompression. In previous studies, vesicle formation has been observed to vary significantly depending on the decompression strategies employed (Nowak et al., 2011; Marxer et al., 2015). Rapid decompression to a final pressure followed by annealing for a specified duration (Larsen and Gardner, 2004; Gardner, 2012), as well as multi-step decompression involving high rates of 2.5–10 MPa s−1 to the final pressure, followed by periods of isobaric annealing (Gardner et al., 1999; Larsen and Gardner, 2004), do not constitute true continuous decompression of the melt, making it challenging to determine vesicle formation. The assumption of continuous decompression during the annealing period at the final pressure is erroneous. On the other hand, this method can assess nucleation rates in hydrous melts showing vesicle nucleation by rapid decompression and annealing at different times at a constant reduced pressure (Gardner, 2012; Hajimirza et al., 2019). If the phase separation mechanism is unknown, we suggest true continuous decompression achievable through a fine-dosing decompression valve (Nowak et al., 2011; Marxer et al., 2015; Preuss et al., 2016; Allabar and Nowak, 2018).
Quenching rate. To analyze the vesiculation process at different decompression rates and final pressures, the melts have to be quenched to glass as fast as possible. During isobaric cooling of the vesiculated melt, vesicle shrinkage occurs (Allabar et al., 2020a), especially in low-viscosity melts like hydrous phonolitic compositions. This shrinkage is related to the decrease in the molar volume of H2O (Marxer et al., 2015) and H2O resorption from the vesicles back into the melt, driven by the increased solubility of H2O with decreasing temperature (McIntosh et al., 2014). Therefore, to account for vesicle shrinkage and H2O resorption, the determination of porosities and residual H2O concentrations in melts requires back-calculation based on the vesiculated glasses. The cooling of decompressed vesiculated melts as rapidly as possible minimizes vesicle shrinkage (Allabar et al., 2020b). However, it is important to note that rapidly quenched glass samples contain tension cracks and therefore tend to shatter during sample preparation. In this study, it was determined that cooling rates of up to ∼100 K s−1 are sufficient to prevent the sample from shattering.
Sample preparation. When preparing decompression samples for analysis, it is crucial to cut them parallel to the cylinder axis. This approach provides the most comprehensive overview and ensures that all important areas of the sample are analyzed (Preuss et al., 2016). Perpendicular sections at different heights may overlook critical regions, especially the initial stages of vesicle formation, which are often visible only in specific sample volumes (top or bottom).
Table B1Mean value of microprobe analysis of LLST_1a,b/2a,b,c/3a,b,c/4a,b,c,d,e. LLST_G140 is from Harms et al. (2004). Mean crystal composition of eight measurements in sample LLST_12Hg, equilibrated for 24 h at 1123 K. Note that NBO/T represents non-bridging oxygen per tetrahedron.
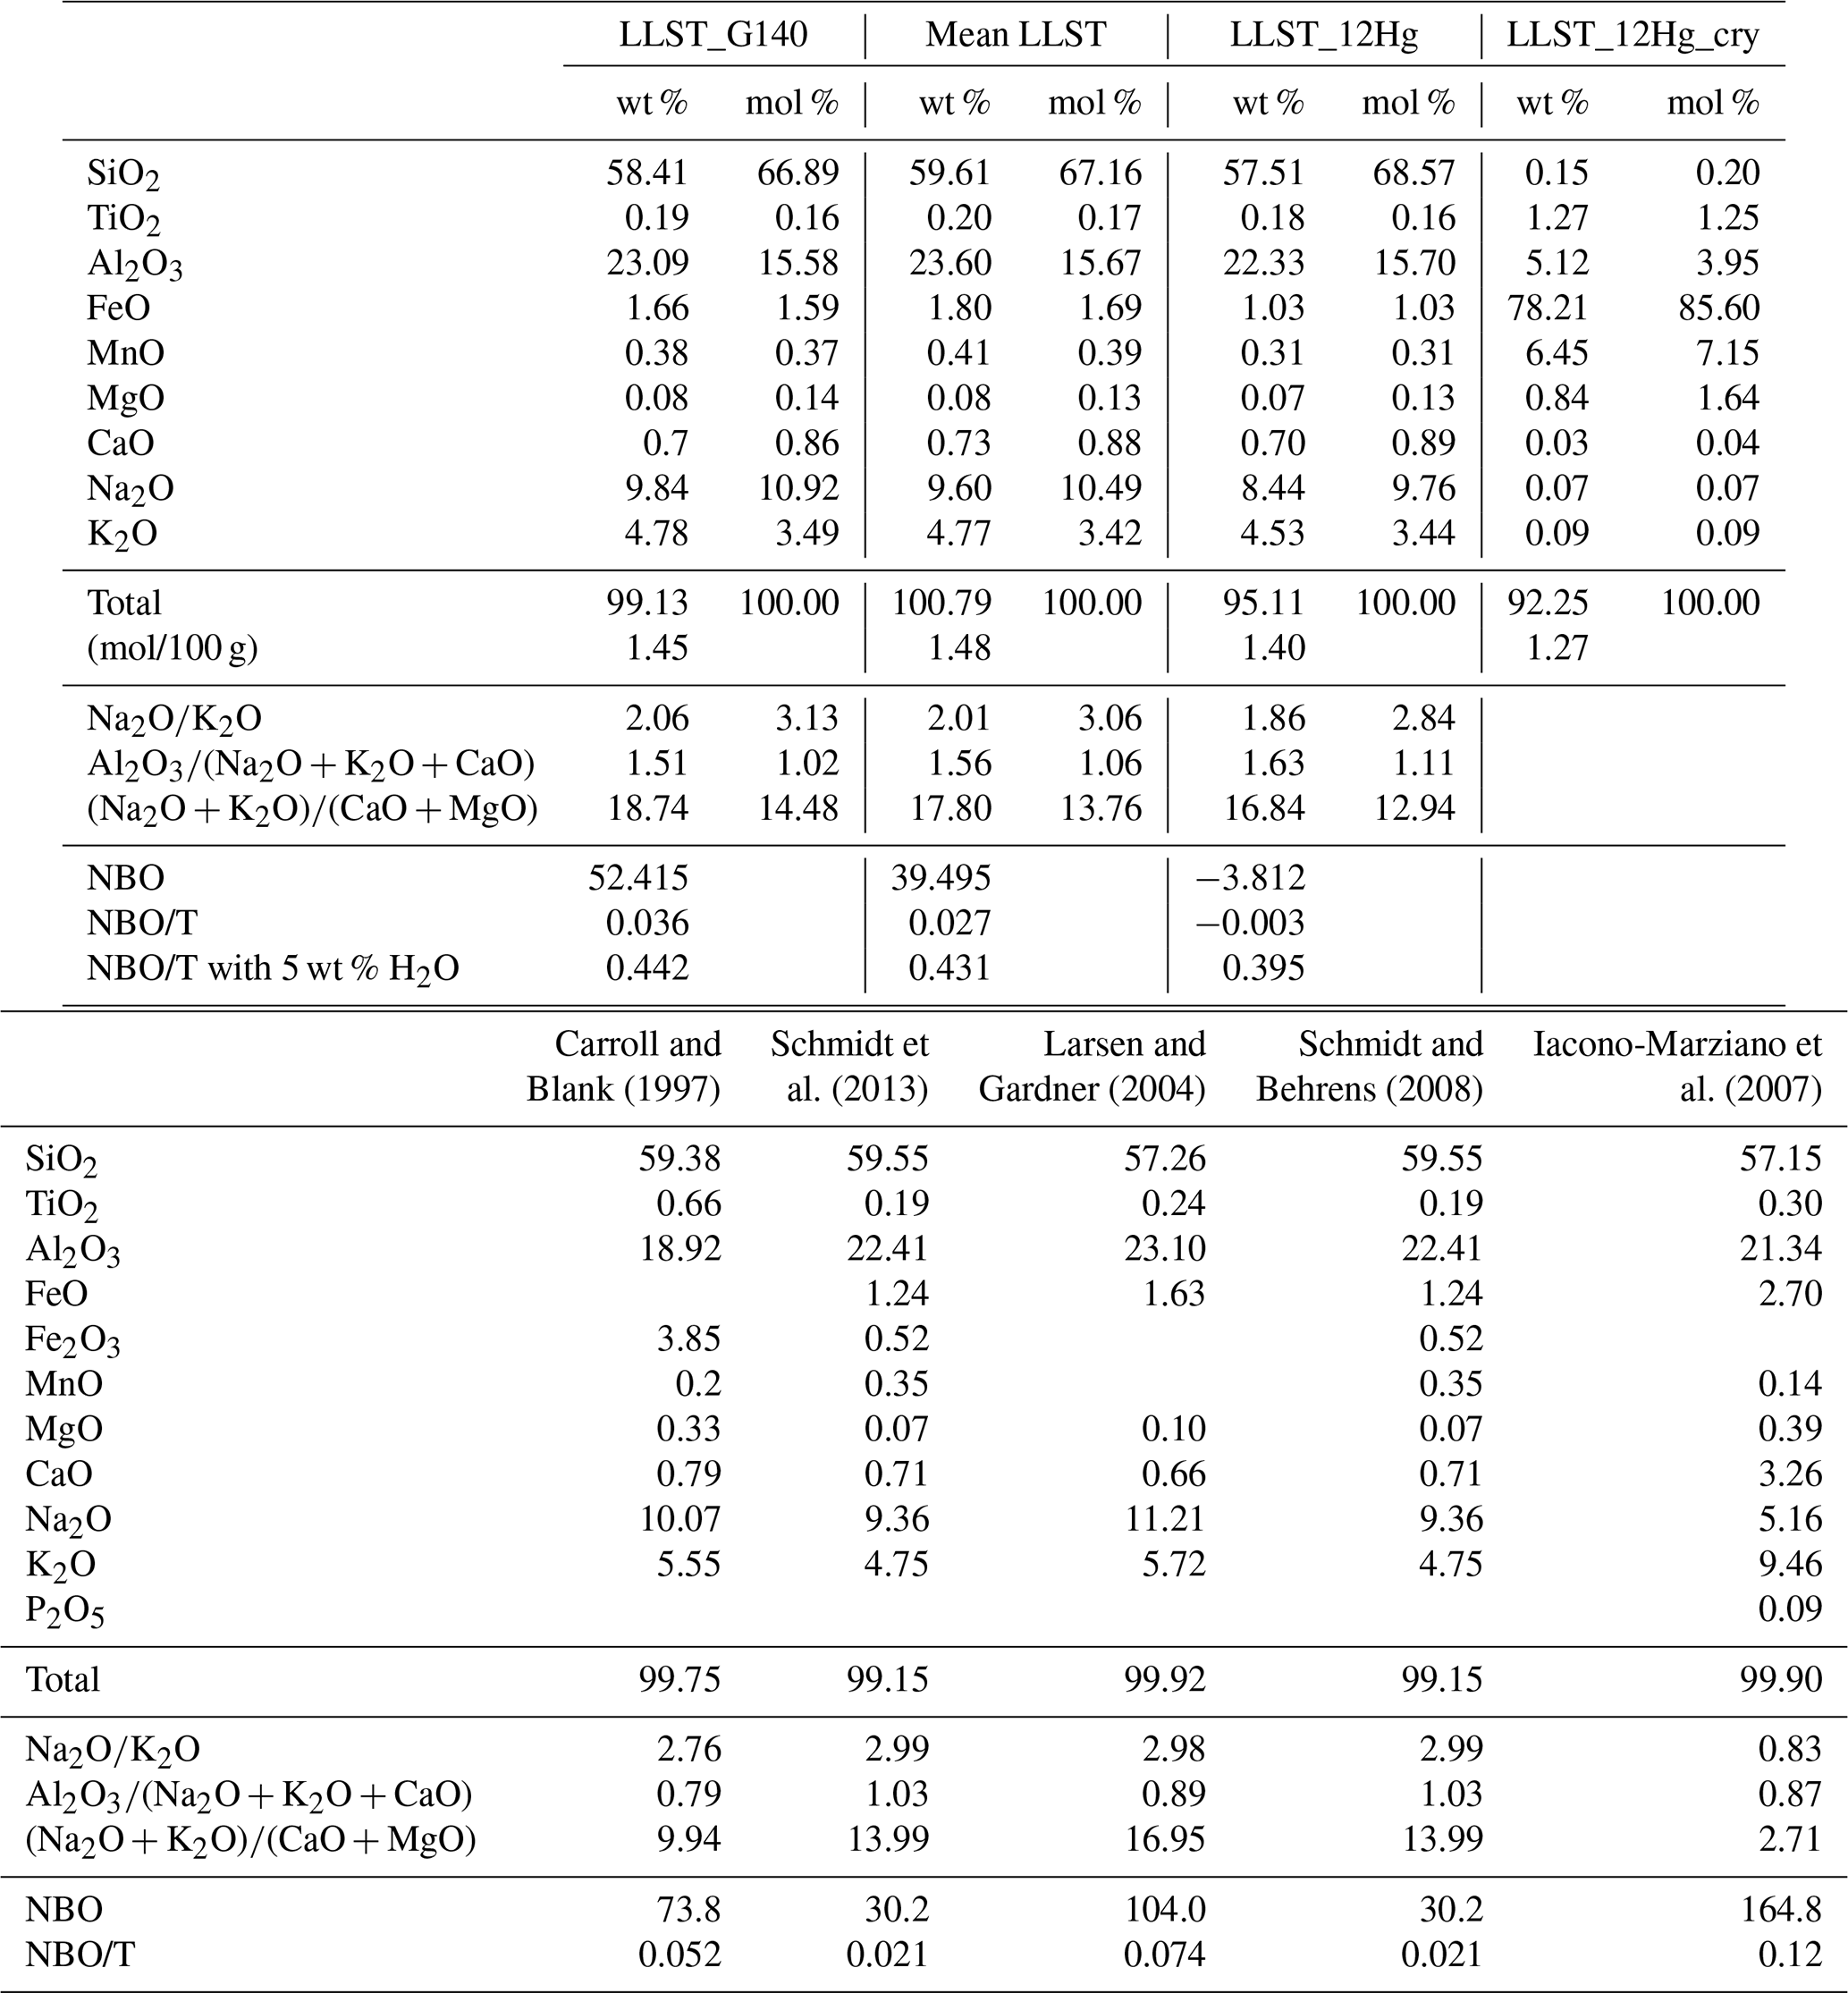
NIR absorption coefficients related to the absorption bands at 5210 cm−1 (molecular H2O) and 4470 cm−1 (OH groups) and total H2O solubilities were determined for the synthesized LLST composition in this study. Although NIR absorption coefficients for phonolite have been previously reported in the literature (Carroll and Blank, 1997; Larsen and Gardner, 2004; Iacono-Marziano et al., 2007; Schmidt and Behrens, 2008; Schmidt et al., 2013; Fanara et al. (2013); Table C1), certain inconsistencies exist that could lead to significant errors in the evaluation of . The listed authors are referred to in this section as C&B, L&G, IM et al., S&B, S et al., and F et al., respectively.
The initial differences are evident in the bulk glass composition. L&G, S&B and S et al., used glass compositions based on the analyses by Harms et al. (2004), referred to as G140. The compositions show good agreement to G140 (Table B1). Specifically, the comparison of the alkali-alumina ratios results in values of 1.02 for G140, 1.09 for S&B, 1.03 for S et al. and 1.06 for our composition. However, only S et al. synthesized their composition using oxide and carbonate powders, whereas L&G used natural starting material, which contained several hundreds to thousands of ppm of chlorine, fluorine and P2O5 (Harms and Schmincke, 2000), potentially influencing H2O solubility (e.g. Holtz et al., 1993; Webster et al., 1999). Similarly, C&B used natural starting materials from the IIA subunit of the Montaña Blanca pumice deposit (MBP), Tenerife. In addition to minor deviations in the major element composition compared to G140, these samples also contain several hundreds to thousands of ppm of chlorine, fluorine and P2O5 (Ablay et al., 1995). F et al. also synthesized their glass composition, which was based on the composition of the ULST, corresponding to a potassium-rich phonolite melt (Wörner and Schmincke, 1984a).
In addition to the glass composition, the synthesis of the hydrated samples might be an important factor. While C&B and L&G conducted the hydration of their samples in cold-seal pressure vessel (CSPV), with the oxygen fugacity typically close to the nickel / nickel oxide buffer (ΔlogNNO ±1, e.g. Matthews et al., 2003; Martel and Schmidt, 2003), the synthesis of the hydrous glasses used for the determination of and εOH is not documented by S et al. The authors only state that the linear absorption coefficients of previously synthesized LSP-II glasses with known H2O contents were determined. However, based on the hydration of glass cylinders for other experiments in their paper using the IHPV (ΔlogQFM + 3.5), it is assumed that the mentioned samples were also hydrated in the IHPV. Only the samples from F et al. were confirmed to have been synthesized in the IHPV under oxidation conditions identical to those in this study.
Another discrepancy may be the baseline correction used for the evaluation of the measured NIR absorption spectra. The choice of baseline correction can significantly affect the relative H2O species concentrations (Behrens et al., 1996; Ohlhorst et al., 2001). Various baseline corrections are known, each with different advantages and disadvantages depending on the bulk composition. Common baselines include straight lines at the base of the ∼5200 and ∼4500 cm−1 bands (Withers and Behrens, 1999), two Gaussians fitted to the iron-related band at ∼5700 cm−1 and the molecular H2O-related band at ∼4000 cm−1 (Ohlhorst et al., 2001), and (as in our determination) fitting a straight line through the high- and low-frequency minima of the ∼5200 cm−1 peak and extending it below the 4500 cm−1 peak (Behrens et al., 1996).
S et al. and F et al. applied two straight lines between the high- and low-frequency minima of the ∼5200 and ∼4500 cm−1 peaks. This implies that the absorption coefficients are not directly comparable due to the different baseline corrections. Nevertheless, assuming hydration in the IHPV, the coefficients could be applied to our samples if the baseline correction used in both studies were applied to our samples.
In contrast, C&B also determined and εOH by FTIR spectroscopy but for the MBP composition. Unfortunately, they did not explain how they performed the baseline correction. However, Fig. 1 in their paper shows an applied baseline correction that resembles the baseline correction using “flexicurves” (Schmidt et al., 1999). Both factors could explain why the values of and εOH are inverted, with 1.10 and 1.25, respectively, compared to our coefficients of 1.27 and 1.15 L mol−1 cm. Despite these discrepancies, both sets of absorption coefficients agree reasonably well, with our self-determined coefficients lying between the published values of S&B and S et al.
Despite the determination of the linear absorbances of the ∼5200 and ∼4500 cm−1 peaks, can also be determined in the mid-infrared region by measuring the absorption of the fundamental OH stretching vibration at ∼3600 cm−1 (ε3600), as applied by L&G and S&B. A significant issue with using ε3600, as noted by S&B, is that the fundamental OH stretching vibration has a very high absorption, necessitating extremely thin samples. Consequently, their sample thicknesses ranged from 9.5 to 36.5 µm, which significantly increased the uncertainties. Furthermore, L&G only mentioned in their paper that they did not calibrate their own coefficient but used an ε3600 value of 81 L mol−1 cm for this peak in the composition, given by a personal communication. Similarly, S&B used an ε3600 value of 67 L mol−1 cm from Stolper (1982), which is valid for their analyzed glass compositions of albite, rhyolite, and basalt. Additionally, different baseline corrections were used in S&B and Stolper (1982). Nevertheless, the stated in S&B should be valid, as they were also determined using thermogravimetry.
Table C1Absorption coefficients of H2O and OH combination bands and the fundamental OH stretch vibration, hydration conditions, and starting material of LLST and phonolite samples. C&B refers to Carroll and Blank (1997), S et al. to Schmidt et al. (2013), L&G to Larsen and Gardner (2004), S&B to Schmidt and Behrens (2008), and IM et al. to Iacono-Marziano et al. (2007). LLST and LSP-II refer to natural G140 (Harms et al., 2004). MBP stands for Montaña Blanca pumice deposit, Tenerife. Albite (Al), rhyolite (Rt), and basalt (B) are given in Stolper (1982).
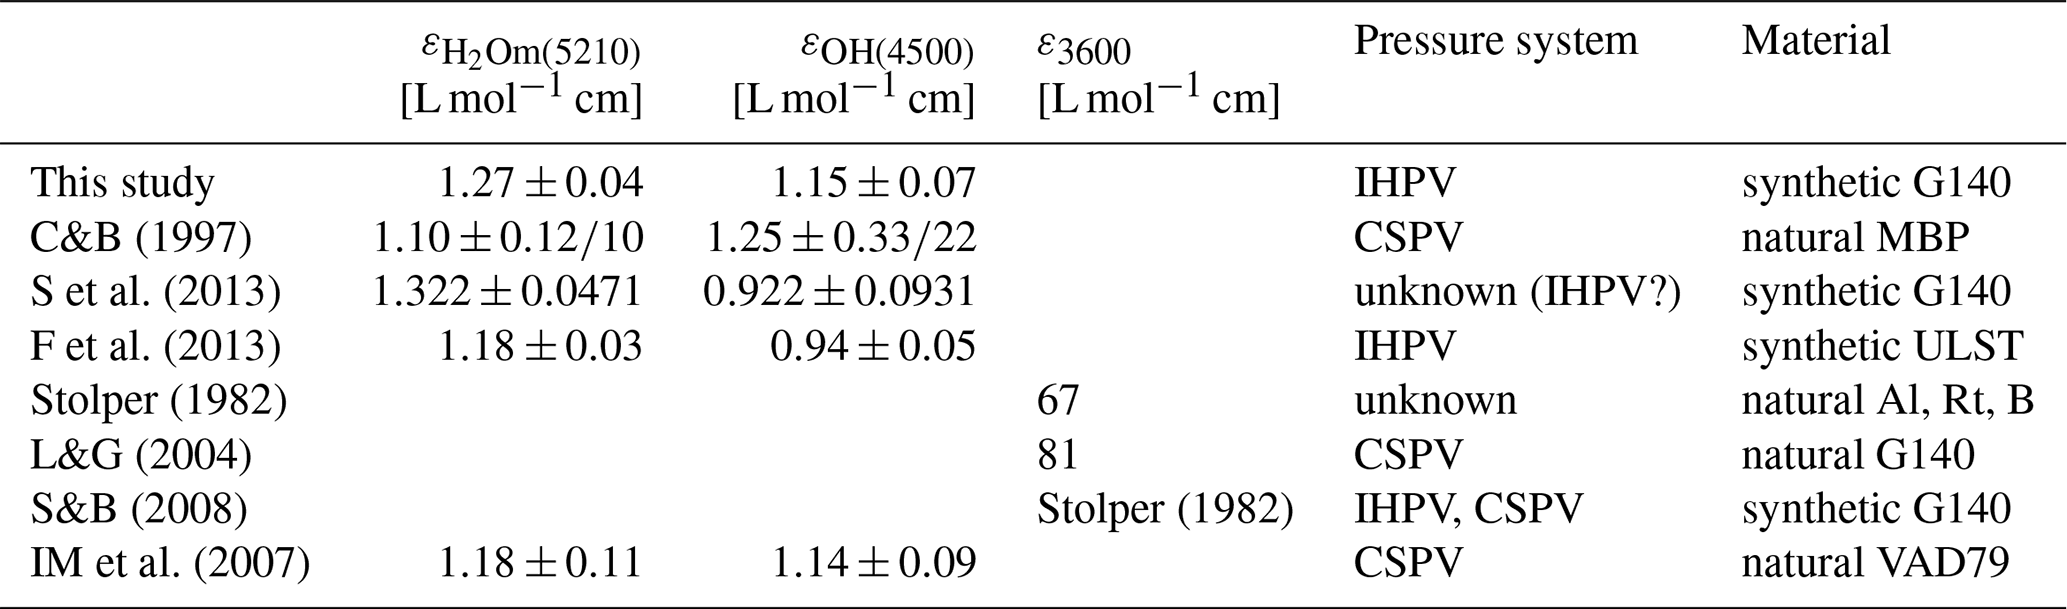
Additionally, density measurements of H2O-undersaturated samples containing ∼1–8 wt % H2O were performed by S et al., and samples containing 0.5 wt %–5.5 wt % H2O by F et al. using the Archimedean principle. Density equations were derived for the LSP-II composition with and for the ULST composition as . No correction is required for the density equation and should therefore be very similar to our density equation (Eq. 1). Test calculations using the equations of this study and of S et al. for 1 wt %–6 wt % H2O show perfect agreement at higher concentrations (6 wt %: g L−1, g L−1), while at lower H2O concentrations, such as 1 wt %, the density differs within the range of error (1 wt %: g L−1, g L−1). These slight deviations may be due to slight variations in the melt composition. However, within the range of error, both equations are consistent. Among the equations analyzed, only that proposed by F et al. exhibits a greater deviation, yielding values of 2443.6 and 2500.6 g L−1 for 6 wt % and 1 wt %, respectively. This discrepancy likely correlates with stronger variations in bulk composition.
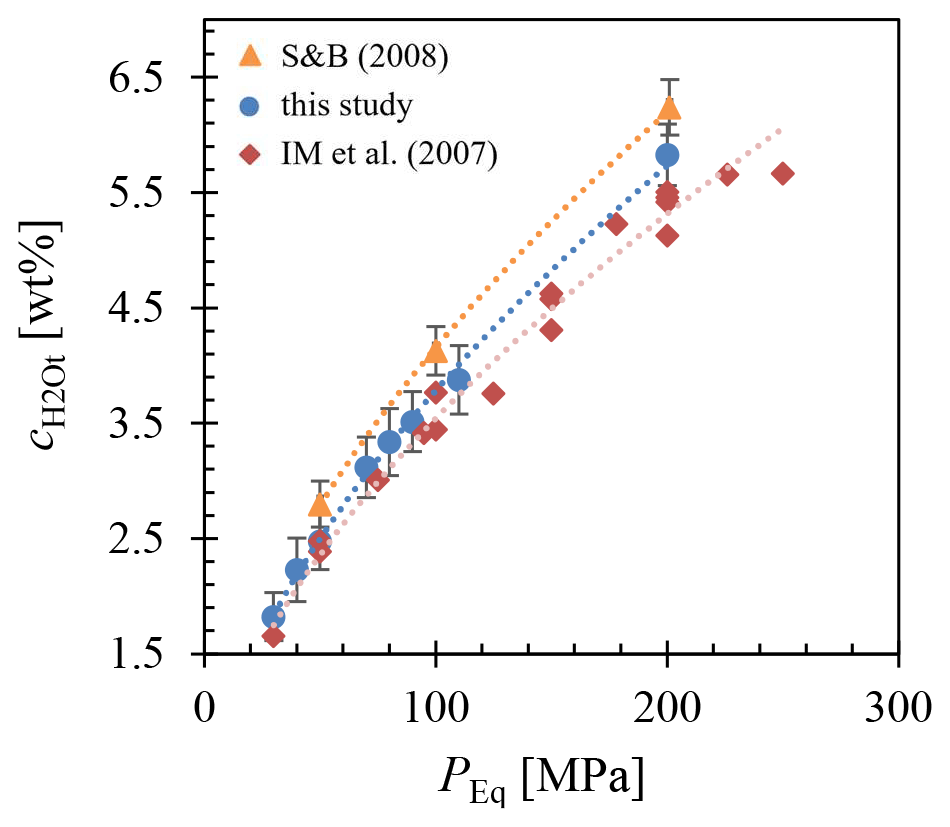
Figure C1H2O solubilities corresponding to the G140 composition (Harms et al., 2004) in the IHPV according to Schmidt and Behrens (2008) at 1273 K, this study at 1323 K, and Iacono-Marziano et al. (2007) at 1323 K for the VAD79 composition.
The H2O solubility equation (Eq. 5) was derived from solubility experiments conducted at 1323 K using the synthetic LLST glass, representing the equilibrium degassing path during decompression. Comparable experimental data are available from S&B for the same G140 composition (Harms et al., 2004) and from IM et al. using natural K-rich phonolite melt from the Vesuvius “white pumice” AD79 eruption (VAD79) (Table B1). The data relevant to our experimental conditions are presented in Fig. C1. From S&B, only three data points are included, specifically those hydrated in the IHPV at 1273 K between 201 and 50 MPa, to enable a direct H2O solubility comparison at ∼1300 K. In contrast, IM et al. provided an extensive dataset of H2O solubility experiments at 1323 K over a pressure range of 250–30 MPa, with experiments conducted in TZM (titanium–zirconium–molybdenum alloy) CSPV. Notably, although not depicted in the diagram, all datasets consistently indicate a negative temperature dependence of H2O solubility, meaning that lower temperatures result in higher H2O solubilities (S&B; IM et al.).
The experiments by S&B utilized glass powder samples. The H2O content of the glasses was determined by thermogravimetry (TG) using a Setaram™ TGA 92. For samples containing small hydration bubbles, the glass was ground to a fine powder to crack the water-filled vesicles. TG measurements for another MBP composition were verified with KFT measurements, showing good agreement within the error range, expecting similar results with LSP-II. As shown in Fig. C1, the data exhibit slightly increased H2O solubilities compared to our data. The data differ by ∼0.5 wt % at 200 MPa, with 6.24 wt % reported by S&B and 5.7 wt % in our dataset. However, this deviation decreases at lower pressures, with a difference of about 0.3 wt % at 50 MPa, where S&B recorded 2.8 wt % and LLST was measured to 2.48 wt %. The slight deviation can be attributed to the small temperature differences of 50 K between S&B at 1273 and 1323 K in this study, as well as differences in absorption coefficients. However, within the scope of the error, the solubilities are in agreement. The solubility equation resulting from the data is given as [wt %].
Similarly, IM et al. used glass powders and determined the specific absorption coefficients for their melt composition (Tables B1, C1), although they did not detail the baseline correction process. Nevertheless, the H2O solubility values are in close agreement with those obtained in this study. The data exhibit systematically lower H2O solubilities, with a slight increase in misfit at higher H2O solubilities and pressures, reaching up to 0.3 wt % at 200 MPa (5.4 wt %) compared to 5.7 wt % for our LLST composition, but nearly identical values for lower pressures as for 30 MPa with 1.7 wt % at VAD79 compared to 1.8 wt % H2O for LLST. This discrepancy is within the range of error and could be attributed to differences in starting materials, experimental methods, and absorption coefficients. The solubility equation resulting from the data is given as [wt %].
The well-examined effect of the alkali content and the ratio may contribute to this discrepancy. The reversed ratio in VAD79 compared to LLST, specifically the increased K-content and decreased Na-content, led to a decrease in H2O solubility by approximately 6 % (Schmidt and Behrens, 2008). An additional effect was shown by S&B, where an increase in the ratio resulted in a roughly 4 % increase in H2O solubility. A similar effect of alkali content on H2O solubility was identified in trachytic (Di Matteo et al., 2004) and in rhyolitic melts (Holtz et al., 1995; Allabar et al., 2022), although the effect was more pronounced in those compositions. Therefore, both the reversed ratio and the significantly higher concentrations of MgO and CaO in the VAD79 composition (Table B1) can explain the slightly lower H2O solubility values.
Despite these findings, the H2O solubility curve for the LLST composition in this study falls between the previously published solubility curves. Although there are slight differences in composition, , and analytical methods, the solubilities agree within an error margin of approximately 0.5 wt %. Therefore, minor experimental deviations do not significantly impact the evaluation of , and Eq. (5) can be applied in further studies with similar objectives.
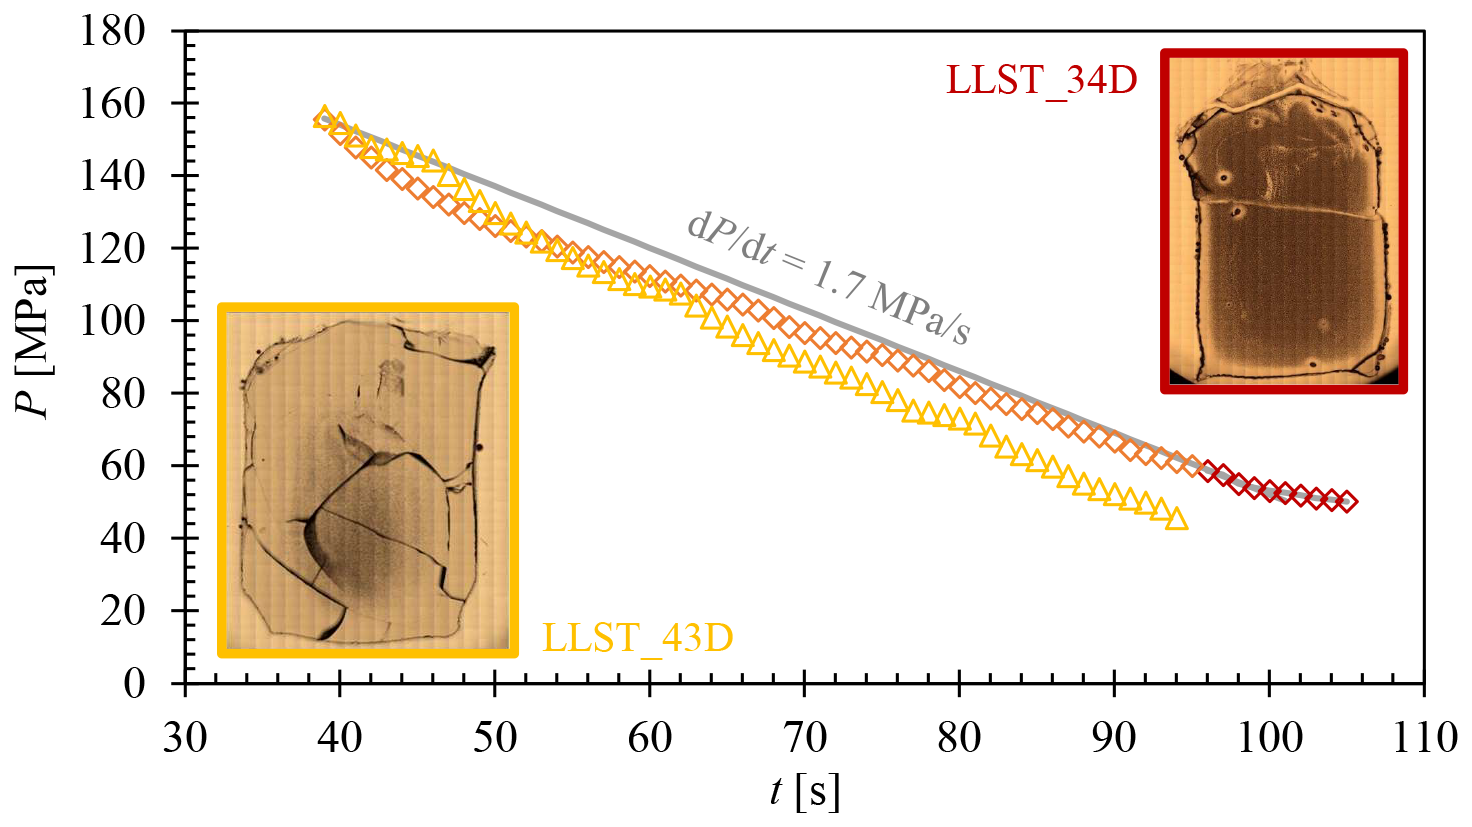
Figure D1Decompression paths originating from the saturation pressure of ∼156 MPa are depicted for samples LLST_34D (represented by orange and red diamonds) and LLST_43D (yellow triangles). Additionally, an ideal decompression path of 1.7 MPa s−1 is illustrated in gray for comparative analysis. Both samples share similar experimental parameters: of 5 wt %, Pf of 50 MPa, and quenching rate of 97 K s−1. However, sample 34D experienced a reduction in to ∼0.9 MPa s−1 towards the end of decompression, while 43D maintained a constant of 1.7 MPa s−1. The variance in and the associated longer decompression time caused the complete vesiculation of the sample volume in 34D, while 43D shows the incipient stage of vesicle formation.
All data derived from this research are presented in the enclosed tables, figures, and the Supplement.
The supplement related to this article is available online at https://doi.org/10.5194/ejm-37-385-2025-supplement.
PLM: conceptualization, sample preparation, experiments, analysis and evaluation, software, visualization, writing of the original draft, organization; MN: conceptualization, supervision, manuscript revision.
The contact author has declared that neither of the authors has any competing interests.
Publisher's note: Copernicus Publications remains neutral with regard to jurisdictional claims made in the text, published maps, institutional affiliations, or any other geographical representation in this paper. While Copernicus Publications makes every effort to include appropriate place names, the final responsibility lies with the authors.
This article is part of the special issue “Probing the Earth: experiments on and for our planet”. It is a result of the EMPG 2023 conference, Milan, Italy, 12–15 June 2023.
We acknowledge the support of the Open Access Publishing Fund of the University of Tübingen. We thank Sebastian Staude for his support during the electron probe microanalysis. We thank Barbara Maier and Annette Flicker for technical support, Simone Schafflick for the high-quality sample preparation and Dennis Eul for support in the laboratory.
This research has been supported by the Deutsche Forschungsgemeinschaft (grant no. NO378/15-1).
This open-access publication was funded by the Open Access Publication Fund of the University of Tübingen.
This paper was edited by Simone Tumiati and reviewed by Yves Moussallam and one anonymous referee.
Ablay, G. J., Ernst, G. G. J., Marti, J., and Sparks, R. S. J.: The ∼ 2 ka subplinian eruption of Montaña Blanca, Tenerife, Bull. Volcanol., 57, 337–355, https://doi.org/10.1007/BF00301292, 1995.
Airy, G. B.: On the Diffraction of an Object-glass with Circular Aperture, Transactions of the Cambridge Philosophical Society, 5, 283–291, 1834.
Allabar, A. and Nowak, M.: Message in a bottle: Spontaneous phase separation of hydrous Vesuvius melt even at low decompression rates, Earth Planet. Sc. Lett., 501, 192–201, https://doi.org/10.1016/j.epsl.2018.08.047, 2018.
Allabar, A. and Nowak, M.: High spatial resolution analysis of H2O in silicate glass using attenuated total reflection FTIR spectroscopy coupled with a focal plane array detector, Chem. Geol., 556, 119833, https://doi.org/10.1016/j.chemgeo.2020.119833, 2020.
Allabar, A., Dobson, K. J., Bauer, C. C., and Nowak, M.: Vesicle shrinkage in hydrous phonolitic melt during cooling, Contrib. Mineral. Petr., 175, 21, https://doi.org/10.1007/s00410-020-1658-3, 2020a.
Allabar, A., Salis Gross, E., and Nowak, M.: The effect of initial H2O concentration on decompression-induced phase separation and degassing of hydrous phonolitic melt, Contrib. Miner. Petrol., 175, 22, https://doi.org/10.1007/s00410-020-1659-2, 2020b.
Allabar, A., Petri, P. L., Eul, D., and Nowak, M.: An empirical H2O solubility model for peralkaline rhyolitic melts, Contrib. Mineral. Petr., 177, 52, https://doi.org/10.1007/s00410-022-01915-8, 2022.
Balzer, R., Behrens, H., Waurischk, T., Reinsch, S., Müller, R., Kiefer, P., Deubener, J., and Fechtelkord, M.: Water in alkali aluminosilicate glasses, Front. Mater., 7, 85, https://doi.org/10.3389/fmats.2020.00085, 2020.
Behrens, H., Romano, C., Nowak, M., Holtz, F., and Dingwell, D. B.: Near-infrared spectroscopic determination of water species in glasses of the system MAlSi3O8 (M = Li, Na, K): an interlaboratory study, Chem. Geol., 128, 41–63, https://doi.org/10.1016/0009-2541(95)00162-X, 1996.
Berndt, J., Liebske, C., Holtz, F., Freise, M., Nowak, M., Ziegenbein, D., Hurkuck, W., and Koepke, J.: A combined rapid-quench and H2-membrane setup for internally heated pressure vessels: Description and application for water solubility in basaltic melts, Am. Mineral., 87, 1717–1726, https://doi.org/10.2138/am-2002-11-1222, 2002.
Blaine, F., Linnen, R., Holtz, F., and Bruegmann, G.: The effect of Cl on Pt solubility in haplobasaltic melt: implications for micronugget formation and evidence for fluid transport of PGEs, Geochim. Cosmochim. Ac., 75, 7792–7805, https://doi.org/10.1016/j.gca.2011.10.010, 2011.
Bondar, D., Zandonà, A., Withers, A.C., Fei, H., Di Genova, D., Miyajima, N., and Katsura, T.: Rapid-quenching of high-pressure depolymerized hydrous silicate (peridotitic) glasses, J. Non-Crystalline Sol., 578, 121347, https://doi.org/10.1016/j.jnoncrysol.2021.121347, 2022.
Brennen, C. E.: Cavitation and Bubble Dynamics, Oxford University Press, Inc., ISBN 0-19-509409-3, 1995.
Bureau, H. and Keppler, H.: Complete miscibility between silicate melts and hydrous fluids in the upper mantle: experimental evidence and geochemical implications, Earth Planet. Sc. Lett., 165, 187–196, https://doi.org/10.1016/S0012-821X(98)00266-0, 1999.
Burnham, C. W. and Davis, N. F.: The role of H2O in silicate melts, 1: P−V −T relations in the system NaAlSi3O8–H2O to 10 kilobars and 1000 °C, Am. J. Sci., 270, 54–79, https://doi.org/10.2475/ajs.270.1.54, 1971.
Cahn, J. W.: Phase separation by spinodal decomposition in isotropic systems, J. Chem. Phys., 42, 93–99, https://doi.org/10.1063/1.1695731, 1965.
Carroll, M. R. and Blank, J. G.: The solubility of H2O in phonolitic melts, Am. Min., 82, 549–556, https://doi.org/10.2138/am-1997-5-615, 1997.
Cichy, S. B., Botcharnikov, R. E., Holtz, F., and Behrens, H.: Vesiculation and microlite crystallization induced by decompression: a case study of the 1991–1995 Mt Unzen Eruption (Japan), J. Petrol., 52, 1469–1492, https://doi.org/10.1093/petrology/egq072, 2011.
Debenedetti, P. G.: Phase separation by nucleation and by spinodal decomposition: fundamentals, in: Supercritical Fluids, edited by: Kiran, E., Debenedetti, P. G., and Peters, C. J., Nato Science Series E, 366, 123–166, https://doi.org/10.1007/978-94-011-3929-8_5, 2000.
Dubosq, R., Schneider, D. A., Zhou, X., Gault, B., Langelier, B., and Please, P.: Bubbles and atom clusters in rock melts: A chicken and egg problem, J. Volcanol. Geoth. Res., 428, 107574, https://doi.org/10.1016/j.jvolgeores.2022.107574, 2022.
Di Genova, D., Kolzenburg, S., Wiesmaier, S., Dallanave, E., Neuville, D. R., Hess, K. U., and Dingwell, D. B.: A compositional tipping point governing the mobilization and eruption style of rhyolitic magma, Nature, 552, 235–238, https://doi.org/10.1038/nature24488, 2017a.
Di Genova, D., Sicola, S., Romano, C., Vona, A., Fanara, S., and Spina, L.: Effect of iron and nanolites on Raman spectra of volcanic glasses: A reassessment of existing strategies to estimate the water content, Chem. Geol., 475, 76–86, https://doi.org/10.1016/j.chemgeo.2017.10.035, 2017b.
Di Genova, D., Caracciolo, A., and Kolzenburg, S.: Measuring the degree of “nanotilization” of volcanic glasses: Understanding syn-eruptive processes recorded in melt inclusions, Lithos, 318–319, 209–218, https://doi.org/10.1016/j.lithos.2018.08.011, 2018.
Di Genova, D., Brooker, R. A., Mader, H. M., Drewitt, J. W. E., Longo, A., Deubener, J., Neuville, D. R., Fanara, S., Shebanova, O., Anzellini, S., Arzilli, F., Bamber, E. C., Hennet, L., La Spina, G., and Miyajima, N.: In situ observation of nanolite growth in volcanic melt: A driving force for explosive eruptions, Sci. Adv., 6, eabb0413, https://doi.org/10.1126/sciadv.abb0413, 2020.
Di Matteo, V., Carroll, M. R., Behrens, H., Vetere, F., and Brooker, R. A.: Water solubility in trachytic melts, Chem. Geol., 213, 187–196, https://doi.org/10.1016/j.chemgeo.2004.08.042, 2004.
Duan, Z. H. and Zhang, Z. G.: Equation of state of the H2O, CO2, and H2O-CO2 systems up to 10 GPa and 2573.15 K: molecular dynamics simulations with ab initio potential surface, Geochim. Cosmochim. Ac., 70, 2311–2324, https://doi.org/10.1016/j.gca.2006.02.009, 2006.
Ertel, W., O'Neill, H. S. C., Sylvester, P. J., Dingwell, D. B., and Spettel, B.: The solubility of rhenium in silicate melts: implications for the geochemical properties of rhenium at high temperatures, Geochim. Cosmochim. Ac., 65, 2161–2170, https://doi.org/10.1016/S0016-7037(01)00582-8, 2001.
Fanara, S., Behrens, H., and Zhang, Y.: Water diffusion in potassium-rich phonolitic and trachytic melts, Chem. Geol., 346, 149–161, https://doi.org/10.1016/j.chemgeo.2012.09.030, 2013.
Fiege, A., Holtz, F., and Cichy, S. B.: Bubble formation during decompression of andesitic melts, Am. Mineral., 99, 1052–1062, https://doi.org/10.2138/am.2014.4719, 2014.
Gardner, J. E.: Heterogeneous bubble nucleation in highly viscous silicate melts during instantaneous decompression from high pressure, Chem. Geol., 236, 1–12, https://doi.org/10.1016/j.chemgeo.2006.08.006, 2007.
Gardner, J. E.: Surface tension and bubble nucleation in phonolite magmas, Geochim. Cosmochim. Ac., 76, 93–102, https://doi.org/10.1016/j.gca.2011.10.017, 2012.
Gardner, J. E. and Denis, M.-H.: Heterogeneous bubble nucleation on Fe-Ti oxide crystals in highsilica rhyolitic melts, Geochim. Cosmochim. Ac., 68, 3587–3597, https://doi.org/10.1016/j.gca.2004.02.021, 2004.
Gardner, J. E. and Ketcham, R. A.: Bubble nucleation in rhyolite and dacite melts: temperature dependence of surface tension, Contrib. Miner. Petrol., 162, 929–43, https://doi.org/10.1007/s00410-011-0632-5, 2011.
Gardner, J. E., Hilton, M., and Carroll, M. R.: Experimental constraints on degassing of magma: isothermal bubble growth during continuous decompression from high pressure, Earth Planet. Sc. Lett., 168, 201–218, https://doi.org/10.1016/S0012-821X(99)00051-5, 1999.
Gardner, J. E., Ketcham, R. A., and Moore, G.: Surface tension of hydrous silicate melts: constraints on the impact of melt composition, J. Volcanol. Geoth. Res., 267, 68–74, https://doi.org/10.1016/j.jvolgeores.2013.09.007, 2013.
Gardner, J. E., Wadsworth, F. B., Carley, T. L., Llewellin, E. W., Kusumaatmaja, H., and Sahagian, D.: Bubble Formation in Magma, Annu. Rev. Earth Planet. Sci., 51, 131–154. https://doi.org/10.1146/annurev-earth-031621-080308, 2023.
Giordano, D., Potuzak, M., Romano, C., Dingwell, D. B., and Nowak, M.: Viscosity and glass transition temperature of hydrous melts in the system CaAl2Si2O8-CaMgSi2O6, Chem. Geol., 256, 203–215, https://doi.org/10.1016/j.chemgeo.2008.06.027, 2008.
Gondé, C., Martel, C., Pichavant, M., and Bureau, H.: In situ bubble vesiculation in silicic magmas, Am. Mineral., 96, 111–124, https://doi.org/10.2138/am.2011.3546, 2011.
Gonnermann, H. M. and Gardner, J. E.: Homogeneous bubble nucleation in rhyolitic melt: experiments and non-classical theory, Geochem. Geophys. Geosyst., 14, 4758–4773, https://doi.org/10.1002/ggge.20281, 2013.
Hajimirza, S., Gonnermann, H. M., Gardner, J. E., and Giachetti, T.: Predicting homogeneous bubble nucleation in rhyolite, J. Geophys. Res.-Sol. Ea., 124, 2395–2416, https://doi.org/10.1029/2018JB015891, 2019.
Hajimirza, S., Gardner, J. E., and Gonnermann, H. M.: Experimental demonstration of continuous bubble nucleation in rhyolite, J. Volcanol. Geoth. Res., 421, 107417, https://doi.org/10.1016/j.jvolgeores.2021.107417, 2021.
Hamada, M., Laporte, D., Cluzel, N., Koga, K. T., and Kawamoto, T.: Simulating bubble number density of rhyolitic pumices from Plinian eruptions: constraints from fast decompression experiments, Bull. Volcanol., 72, 735–746, https://doi.org/10.1007/s00445-010-0353-z, 2010.
Harms, E. and Schmincke, H. U.: Volatile composition of the phonolitic Laacher See magma (12,900 yr BP): implications for syn-eruptive degassing of S, F, Cl and H2O, Contrib. Miner. Petrol., 138, 84–98, https://doi.org/10.1007/PL00007665, 2000.
Harms, E., Gardner, J. E., and Schmincke, H. U.: Phase equilibria of the Lower Laacher See Tephra (East Eifel, Germany): constraints on pre-eruptive storage conditions of a phonolitic magma reservoir, J. Volcanol. Geoth. Res., 134, 135–148, https://doi.org/10.1016/j.jvolgeores.2004.01.009, 2004.
Hertz, P.: Über den gegenseitigen durchschnittlichen Abstand von Punkten, die mit bekannter mittlerer Dichte im Raume angeordnet sind, Math. Ann., 67, 387–398, https://doi.org/10.1007/BF01450410, 1908.
Higgins, M. D.: Measurement of crystal size distributions, Am. Mineral., 85, 1105–1116, https://doi.org/10.2138/am-2000-8-901, 2000.
Holasek, R. E., Self, S., and Woods, A. W.: Satellite observations and interpretation of the 1991 Mount Pinatubo eruption plumes, J. Geophys. Res., 101, 27635–27655, https://doi.org/10.1029/96JB01179, 1996.
Holtz, F., Dingwell, D. B., and Behrens, H.: Effects of F, B2O3 and P2O5 on the solubility of water in haplogranite melts compared to natural silicate melts, Contrib. Miner. Petrol., 113, 492–501, https://doi.org/10.1007/BF00698318, 1993.
Holtz, F., Behrens, H., Dingwell, D. B., and Johannes, W.: H2O solubility in haplogranitic melts: Compositional, pressure, and temperature dependence, Am. Mineral., 80, 94–108, https://doi.org/10.2138/am-1995-1-210, 1995.
Hurwitz, S. and Navon, O.: Bubble nucleation in rhyolitic melts: experiments at high pressure, temperature, and water content, Earth Planet. Sc. Lett., 122, 267–80, https://doi.org/10.1016/0012-821X(94)90001-9, 1994.
Iacono-Marziano, G., Schmidt, B. C., and Dolfi, D.: Equilibrium and disequilibrium degassing of a phonolitic melt (Vesuvius AD 79 “white pumice”) simulated by decompression experiments, J. Volcanol. Geoth. Res., 161, 151–164, https://doi.org/10.1016/j.jvolgeores.2006.12.001, 2007.
Keppler, H., Cialdella, L., Couffignal, F., and Wiedenbeck, M.: The solubility of N2 in silicate melts and nitrogen partitioning between upper mantle minerals and basalt, Contrib. Miner. Petrol., 177, 83, https://doi.org/10.1007/s00410-022-01948-z, 2022.
Larsen, J. F.: Heterogeneous bubble nucleation and disequilibrium H2O exsolution in Vesuvius K-phonolite melts, J. Volcanol. Geoth. Res., 175, 278–288, https://doi.org/10.1016/j.jvolgeores.2008.03.015, 2008.
Larsen, J. F. and Gardner, J. E.: Experimental study of water degassing from phonolitic melts: implications for volatile oversaturation during magmatic ascent, J. Volcanol. Geoth. Res., 134, 109–124, https://doi.org/10.1016/j.jvolgeores.2004.01.004, 2004.
Le Gall, N. and Pichavant, M.: Homogeneous bubble nucleation in H2O- and H2O-CO2-bearing basaltic melts: results of high temperature decompression experiments, J. Volcanol. Geoth. Res., 327, 604–621, https://doi.org/10.1016/j.jvolgeores.2016.10.004, 2016.
Lorand, J.-P., Alard, O., and Luguet, A.: Platinum-group element micronuggets and refertilization process in Lherz orogenic peridotite (northeastern Pyrenees, France), Earth Planet. Sc. Lett., 289, 298–310, https://doi.org/10.1016/j.epsl.2009.11.017, 2010.
Mallmann, G. and O'Neill, H. S. C.: The effect of oxygen fugacity on the partitioning of Re between crystals and silicate melt during mantle melting, Geochim. Cosmochim. Ac., 71, 2837–2857, https://doi.org/10.1016/j.gca.2007.03.028, 2007.
Mangan, M. and Sisson, T.: Delayed, disequilibrium degassing in rhyolite magma: decompression experiments and implications for explosive volcanism, Earth Planet. Sc. Lett., 183, 441–455, https://doi.org/10.1016/S0012-821X(00)00299-5, 2000.
Marks, P. L. and Nowak, M.: Vesiculation dynamics – Part 2: Decompression-induced H2O vesicle growth, onset, and progression of coalescence, Eur. J. Mineral., 37, 413–435, https://doi.org/10.5194/ejm-37-413-2025, 2025.
Martel, C. and Schmidt, B. C.: Decompression experiments as an insight into ascent rates of silicic magmas, Contrib. Miner. Petrol., 144, 397–415, https://doi.org/10.1007/s00410-002-0404-3, 2003.
Marxer, H., Bellucci, P., and Nowak, M.: Degassing of H2O in a phonolitic melt: A closer look at decompression experiments, J. Volcanol. Geoth. Res., 297, 109–124, https://doi.org/10.1016/j.jvolgeores.2014.11.017, 2015.
Matthews, W., Linnen, R. L., and Guo, Q.: A filler-rod technique for controlling redox conditions in cold-seal-pressure vessels, Am. Mineral., 88, 701–707, https://doi.org/10.2138/am-2003-0424, 2003.
McCormick, M. P., Thomason, L. W., and Trepte, C. R.: Atmospheric effects of the Mt. Pinatubo 1991 eruption, Nature, 373, 399–404, https://doi.org/10.1038/373399a0, 1995.
McIntosh, I. M., Llewellin, E. W., Humphreys, M. C. S., Nichols, A. R. L., Burgisser, A., Schipper, C. I., and Larsen, J. F.: Distribution of dissolved water in magmatic glass records growth and resorption of bubbles, Earth Planet. Sc. Lett., 401, 1–11, https://doi.org/10.1016/j.epsl.2014.05.037, 2014.
Mongrain, J., Larsen, J. F., and King, P. I.: Rapid water exsolution, degassing, and bubble collapse observed experimentally in K-phonolitic melts, J. Volcanol. Geoth. Res., 173, 178–184, https://doi.org/10.1016/j.jvolgeores.2008.01.026, 2008.
Morgan, G. and London, D.: Effect of current density on the electron microprobe analysis of alkali aluminosilicate glasses, Am. Mineral., 90, 1131–1138, https://doi.org/10.2138/am.2005.1769, 2005.
Mourtada-Bonnefoi, C. C. and Laporte, D.: Experimental study of homogeneous bubble nucleation in rhyolitic magmas, Geophys. Res. Lett., 26, 3505–3508, https://doi.org/10.1029/1999gl008368, 1999.
Mourtada-Bonnefoi, C. C. and Laporte, D.: Homogeneous bubble nucleation in rhyolitic magmas: an experimental study of the effect of H2O and CO2, J. Geophys. Res., 107, 2066, https://doi.org/10.1029/2001JB000290, 2002.
Mujin, M., Nakamura, M., and Miyake, A.: Eruption style and crystal distributions: Crystallization of groundmass nanolites in the 2011 Shinmoedake eruption. Am. Mineral., 102, 2367–2380, https://doi.org/10.2138/am-2017-6052CCBYNCND, 2017.
Murphy, M. D., Sparks, R. S. J., Barkley, J., Carroll, M. R., and Brewer, T. S.: Remobilization of andesite magma by intrusion of mafic magma at the Soufriere Hills Volcano, Montserrat, West Indies, J. Petrol., 41, 21–42, https://doi.org/10.1093/petrology/41.1.21, 2000.
Navon, O. and Lyakhovsky, V.: Vesiculation processes in silicic magmas, in: The Physics of Explosive Volcanic Eruptions, edited by: Gilbert, J. S. and Sparks, R. S. J., Geological Society, London, Special Publications, 145, 27–50, ISBN 1-86239-020-7, 1998.
Nowak, M. and Behrens, H.: An experimental investigation on diffusion of water in haplogranitic melts, Contrib. Miner. Petrol., 126, 365–376, https://doi.org/10.1007/s004100050256, 1997.
Nowak, M., Cichy, S. B., Botcharnikov, R. E., Walker, N., and Hurkuck, W.: A new type of high pressure low-flow metering valve for continuous decompression: First 86 experimental results on degassing of rhyodacitic melts, Am. Mineral., 96, 1373–1380, https://doi.org/10.2138/am.2011.3786, 2011.
Ochs, F. A. and Lange, A. R.: The density of hydrous magmatic liquids, Science, 283, 1314–1317, https://doi.org/10.1126/science.283.5406.1314, 1999.
Ohlhorst, S., Behrens, H., and Holtz, F.: Compositional dependence of molar absorptivities of near-infrared OH− and H2O bands in rhyolitic to basaltic glasses, Chem. Geol., 174, 5–20, https://doi.org/10.1016/S0009-2541(00)00303-X, 2001.
Preuss, O., Marxer, H., Ulmer, S., Wolf, J., and Nowak, M.: Degassing of hydrous trachytic Campi Flegrei and phonolitic Vesuvius melts: Experimental limitations and chances to study homogeneous bubble nucleation, Am. Mineral., 101, 859–875, https://doi.org/10.2138/am-2016-5480, 2016.
Reinig, F., Wacker, L., Jöris, O., Oppenheimer, C., Guidobaldi, G., Nievergelt, D., Adolphi, F., Cherubini, P., Engels, S., Esper, J., Land, A., Lane, C., Pfanz, H., Remmele, S., Sigl, M., Sookdeo, A., and Büntgen, U.: Precise date for the Laacher See eruption synchronizes the Younger Dryas, Nature, 595, 66–69, https://doi.org/10.1038/s41586-021-03608-x, 2021.
Sahagian, D. and Carley, T. L.: Explosive volcanic eruptions and spinodal decomposition: A different approach to deciphering the tiny bubble paradox, Geochem. Geophys. Geosys., 21, 1–9, https://doi.org/10.1029/2019GC008898, 2020.
Scarani, A., Zandonà, A., Di Fiore, F., Valdivia, P., Putra, R., Miyajima, N., Bornhöft, H., Vona, A., Deubener, J., Romano, C., and Di Genova, D.: A chemical threshold controls nanocrystallization and degassing behaviour in basalt magmas, Commun. Earth Environ., 3, 284, https://doi.org/10.1038/s43247-022-00615-2, 2022.
Schmidt, B. C. and Behrens, H.: Water solubility in phonolite melts: Influence of melt composition and temperature, Chem. Geol., 256, 259–268, https://doi.org/10.1016/j.chemgeo.2008.06.043, 2008.
Schmidt, B. C., Holtz, F., and Pichavant, M.: Water solubility in haplogranitic melts coexisting with H2O-H2 fluids, Contrib. Miner. Petrol., 136, 213–224, https://doi.org/10.1007/s004100050533, 1999.
Schmidt, B. C., Blum-Oeste, N., and Flagmeier, J.: Water diffusion in phonolite melts, Geochim. Cosmochim. Ac., 107, 220–230, https://doi.org/10.1016/j.gca.2012.12.044, 2013.
Schmincke, H. U., Park, C., and Harms, E.: Evolution and environmental impacts of the eruption of Laacher See Volcano (Germany) 12,900 a BP, Quaternary Int., 61, 61–72, https://doi.org/10.1016/S1040-6182(99)00017-8, 1999.
Shea, T.: Bubble nucleation in magmas: a dominantly heterogeneous process?, J. Volcanol. Geoth. Res., 343, 155–170, https://doi.org/10.1016/j.jvolgeores.2017.06.025, 2017.
Shea, T., Gurioli, L., Larsen, J. F., Houghton, B. F., Hammer, J. E., and Cashman, K. V.: Linking experimental and natural vesicle textures in Vesuvius 79AD white pumice, J. Volcanol. Geoth. Res., 192, 69–84, https://doi.org/10.1016/j.jvolgeores.2010.02.013, 2010.
Stelling, J., Botcharnikov, R. E., Beermann, O., and Nowak, M.: Solubility of H2O- and chlorine-bearing fluids in basaltic melt of Mount Etna at T=1050–1250 °C and P= 200 MPa, Chem. Geol., 256, 102–110, https://doi.org/10.1016/j.chemgeo.2008.04.009, 2008.
Stolper, E.: Water in silicate glasses: an infrared spectroscopic study, Contrib. Miner. Petrol., 81, 1–17, https://doi.org/10.1007/BF00371154, 1982.
Tomlinson, E. L., Smith, V. C., and Menzies, M. A.: Chemical zoning and open system processes in the Laacher See magmatic system, Contrib. Miner. Petrol., 175, 19, https://doi.org/10.1007/s00410-020-1657-4, 2020.
Toramaru, A.: BND (bubble number density) decompression rate meter for explosive volcanic eruptions, J. Volcanol. Geoth. Res., 154, 303–316, https://doi.org/10.1016/j.jvolgeores.2006.03.027, 2006.
Van den Bogaard, P. and Schmincke, H. U.: The Eruptive Center of the Late Quaternary Laacher See Tephra, Geologische Rundschau, 73, 933–980, https://doi.org/10.1007/BF01820883, 1984.
Van den Bogaard, P. and Schmincke, H. U.: Laacher See Tephra: A widespread isochronous late Quaternary tephra layer in Central and Northern Europe, Geol. Soc. Am. Bull., 96, 1554–1571, https://doi.org/10.1130/0016-7606(1985)96<1554:LSTAWI>2.0.CO;2, 1985.
Webster, J. D., Kinzler, R. J., and Mathez, E. A.: Chloride and water solubility in basalt and andesite melts and implications for magmatic degassing, Geochim. Cosmochim. Ac., 63, 729–738, 1999.
Withers, A. C. and Behrens, H.: Temperature induced changes in the NIR spectra of hydrous albitic and rhyolitic glasses between 300 and 100 K, Phys. Chem. Mineral., 27, 119–132, https://doi.org/10.1007/s002690050248, 1999.
Wörner, G. and Schmincke, H. U.: Mineralogical and chemical zonation of the Laacher see tephra sequence, J. Petrol., 25, 805–835, https://doi.org/10.1093/petrology/25.4.805, 1984a.
Wörner, G. and Schmincke, H. U.: Petrogenesis of the zoned Laacher See Tephra, J. Petrol. 25, 836–851, https://doi.org/10.1093/petrology/25.4.836, 1984b.
Zhang, Y., Xu, Z., and Behrens, H.: Hydrous species geospeedometer in rhyolite: Improved calibration and application, Geochim. Cosmochim. Ac., 64, 3347–3355, https://doi.org/10.1016/S0016-7037(00)00424-5, 2000.
- Abstract
- Introduction
- Experimental techniques
- Analytical techniques
- Results
- Discussion
- Conclusion
- Appendix A: Experimental setting
- Appendix B
- Appendix C: Review of H2Om and OH molar absorption coefficients and H2O solubility
- Appendix D
- Data availability
- Author contributions
- Competing interests
- Disclaimer
- Special issue statement
- Acknowledgements
- Financial support
- Review statement
- References
- Supplement