the Creative Commons Attribution 4.0 License.
the Creative Commons Attribution 4.0 License.
 | 10 Mar 2025
Analyzing petrographic characteristics and trace element distribution of high-purity quartz deposits from the Peshawar Basin, Pakistan: insights into processing and purification techniques
Ibrar Khan
Xiaoyong Yang
Mei Xia
Zhenhui Hou
This study examined the potential of quartz vein ore from the Peshawar Basin, Pakistan, as a raw material for producing high-grade, high-purity quartz sand. These samples were purified using a combination of methods including crushing, magnetic separation, ultrasonic cleaning, flotation, high-temperature calcination, water quenching, and acid leaching. Impurities in the quartz vein samples were analyzed through optical microscopy, SEM-CL, Raman spectroscopy, XRD, ICP-OES, and ICP-MS. Petrographic analysis revealed that the main impurities in quartz consisted of fluid inclusions, most of which were concentrated along the microfractures. After purification, the refined quartz sand exhibited a smooth surface with an extremely low concentration of gas–liquid inclusions. The ICP-OES bulk solution analysis of the raw quartz samples showed that the NB-1 SiO2 content is 99.989 wt %, NB-2 99.989 wt %, and NB-3 99.990 wt %. The total impurity content in raw quartz ore was 104.73 µg g−1 for NB-1, 102.25 µg g−1 for NB-2, and 95.01 µg g−1 for NB-3. After purification, the ICP-MS analysis indicates the SiO2 content in processed quartz was 99.999 wt % for NB-1, 99.997 wt % for NB-2, and 99.998 wt % for NB-3, and the total for the 13 impurity elements' content of refined quartz sand was 12.08 µg g−1 for NB-1, 34.57 µg g−1 for NB-2, and 16.79 µg g−1 for NB-3. The main impurity elements, Li and Al, were found in the following concentrations: NB-1 contained 2.06 µg g−1 of Li and 9.16 µg g−1 of Al, NB-2 had 3.23 µg g−1 of Li and 30.15 µg g−1 of Al, and NB-3 showed 2.09 µg g−1 of Li and 13.68 µg g−1 of Al. These impurities can be further reduced using more advanced techniques. Based on these results, these purified quartz sands are suitable for producing high-purity quartz products (4N7 to 4N9) that meet the standard requirements for crucible preparation for industrial applications. Therefore, these quartz vein ores are considered potential resources for high-purity quartz (HPQ).
- Article
(5672 KB) - Full-text XML
- BibTeX
- EndNote


Quartz is a widely occurring mineral in the Earth's crust that significantly contributes to the formation of numerous rock types across different geological environments (Götze et al., 2021). These settings encompass hydrothermal formations, such as quartz veins and pegmatites; sedimentary deposits, such as sandstone and chert; and metamorphic deposits in the form of quartzite (Götze, 2009). Hydrothermal vein quartz is a type of quartz that is generated by hydrothermal fluids and has a high concentration of SiO2. It is frequently associated with minerals including feldspar, pyrite, hematite, and mica and exhibits many gas–liquid inclusions (Chen et al., 2022). Because of their unique mineralization environment, quartz minerals have exceptional physical and chemical qualities, in addition to being abundant in reserves (Ding et al., 2009). Quartz has widespread applications in various fields owing to its chemical and physical properties (Englert et al., 2009). In industries such as glassmaking, ceramics, and construction, lower-grade quartz with SiO2 <99.95 % is commonly used (Englert et al., 2009). Advanced industries such as optical fiber transmission, aircraft production, semiconductor integrated circuits, precision optical instruments, and related sectors require high-purity quartz with a silicon dioxide content of about 99.95 % (Haus, 2005; Haus et al., 2012; Moore, 2005; Müller et al., 2007).
Currently, high-purity quartz is considered an important resource in every country across the globe. Based on SiO2 purity, high-purity quartz products are typically divided into four grades: ultra-high purity (SiO2 ≥ 99.998 % or 4N8), high purity (SiO2 ≥ 99.995 % or 4N5), medium purity (SiO2 ≥ 99.99 % or 4N), and standard purity (SiO2 ≥ 99.9 % or 3N). These grades are determined by considering the raw ore quality, detection strategies, current purification techniques, and industry quality requirements (Wang, 2022). In areas like North Carolina, Russia's Khanty-Mansi Autonomous Okrug, Norway's Nordland County, Australia's Queensland, and Mauritania's Nouadhibou city, 4N high-purity quartz extraction is well established (Zhang et al., 2023). Furthermore, 5N high-purity quartz production and purification technologies have advanced to a highly developed state. For instance, Unimin Corporation in the US is able to obtain impurity levels in its goods as low as 8 µg g−1 (Wang, 2021; Zhang et al., 2023).
The development of quality standards for HPQ relies on the concentrations of trace elements in quartz. Several criteria have been established to meet the precise demand for quartz quality for advanced technological applications, including the following. The HPQ must adhere to strict regulations concerning the concentration limits of various elements: Al must be below 30 µg g−1, Ti below 10 µg g−1, Na below 8 µg g−1, K below 8 µg g−1, Li below 5 µg g−1, Ca below 5 µg g−1, Fe below 3 µg g−1, P below 2 µg g−1, and B <1 µg g−1 (Müller et al., 2012). Throughout the quartz crystal growth process, various impurities, including lattice impurities, interstitial impurities, and inclusions, were integrated. To acquire HPQ sand, it is necessary to eliminate impurities through a series of subsequent processes, including crushing, calcination, water quenching, screening, magnetic separation, color separation, flotation, acid leaching, chlorination, and other purification techniques (Li et al., 2021; Yin et al., 2019). The HPQ sand produced by the Unimin Corporation in the US has a SiO2 content of over 99.9 % and an Al content of less than 8 µg g−1, Fe of less than 0.05 µg g−1, and Ti of less than 1.3 µg g−1. Additionally, its IOTA standard has been acknowledged globally, and its HPQ products have an exceptional purity of 99.9994 % (Vatalis et al., 2014). Quartz formation occurs under low-temperature, low-pressure conditions (100–300 °C), which favor the development of high-purity quartz with minimal impurities.
This study focuses on the investigation of three vein quartz ore samples (NB-1, NB-2, and NB-3) collected from the Peshawar Basin, Pakistan. The samples underwent various analytical techniques, such as optical microscopy, SEM, Raman spectrometry, XRD, beneficiation processes, and trace element analysis by ICP-MS. The quality criteria for HPQ were assessed using a series of purification processes, including crushing and screening, magnetic separation, ultrasonic cleaning, flotation, calcination, water quenching, and acid leaching. These processes were performed to evaluate the suitability of vein quartz for industrial applications that require high-purity quartz.
The Peshawar Basin, situated in northwest Pakistan, has significant geological importance because of its complex tectonic setting within the Himalayan orogeny. The Himalayan orogen, which spans southern Asia, has been significantly affected by the collision of the Indian and Eurasian plates. The Peshawar Basin, situated in the intermontane region of northwestern Pakistan, was formed approximately 2.8 million years ago by the uplift of the Attock-Cherat Range (Cornwell, 1998). Covering an area of 8300 km2, the basin lies in the northern part of the Attock-Cherat Range and is positioned atop the Main Boundary Thrust (MBT), as shown in Fig. 1. The Peshawar Plain Alkaline Igneous Province (PPAIP), first identified by Kempe and Jan (1970), extends westward from the right bank of the Tarbela Dam, where it joins the Tarbela Alkaline Complex (TAC) and reaches the Durand Line at the Pakistan–Afghanistan border. Permian rift-related magmatism of the PPAIP persisted for approximately 40 million years. This prolonged magmatic activity was instrumental in Pangean continental rifting and the commencement of the Neo-Tethyan Ocean (Kempe, 1973; Ahmad et al., 2013). Subsequent studies by Ashraf and Chaudary (1977) proposed that the intrusion of alkaline rocks might have occurred in two stages: one at the end of the early Tertiary period during Himalayan orogenic and metamorphic episodes, and a second stage during the late Tertiary, associated with continued tectonic activity. The northern part of the Peshawar Plain Alkaline Igneous Province (PPAIP) is primarily composed of alkaline igneous rocks, mainly granites, as illustrated in Fig. 1 (Ahmad et al., 2013). Situated within the basin, the PPAIP contributes to further geological diversity in the region. This alkaline province is particularly notable for its distinct alkaline igneous rocks, such as syenites and nepheline syenites, which intrude into the sedimentary and metamorphic sequences of the basin. The presence of these alkaline rocks signifies considerable magmatic activity and enhances the complex geochemical and mineralogical characteristics of the region (Kempe and Jan, 1980). Numerous studies have documented the occurrence of alkaline igneous rocks in the Peshawar Basin, collectively referred to as the PPAIP, through extensive analyses and geodynamic interpretations (Pogue et al., 1992; Ahmad et al., 2013). The Malakand–Swat–Buner region, characterized by metasediments and granitic intrusions, lies to the north, northeast, and northwest of the basin.
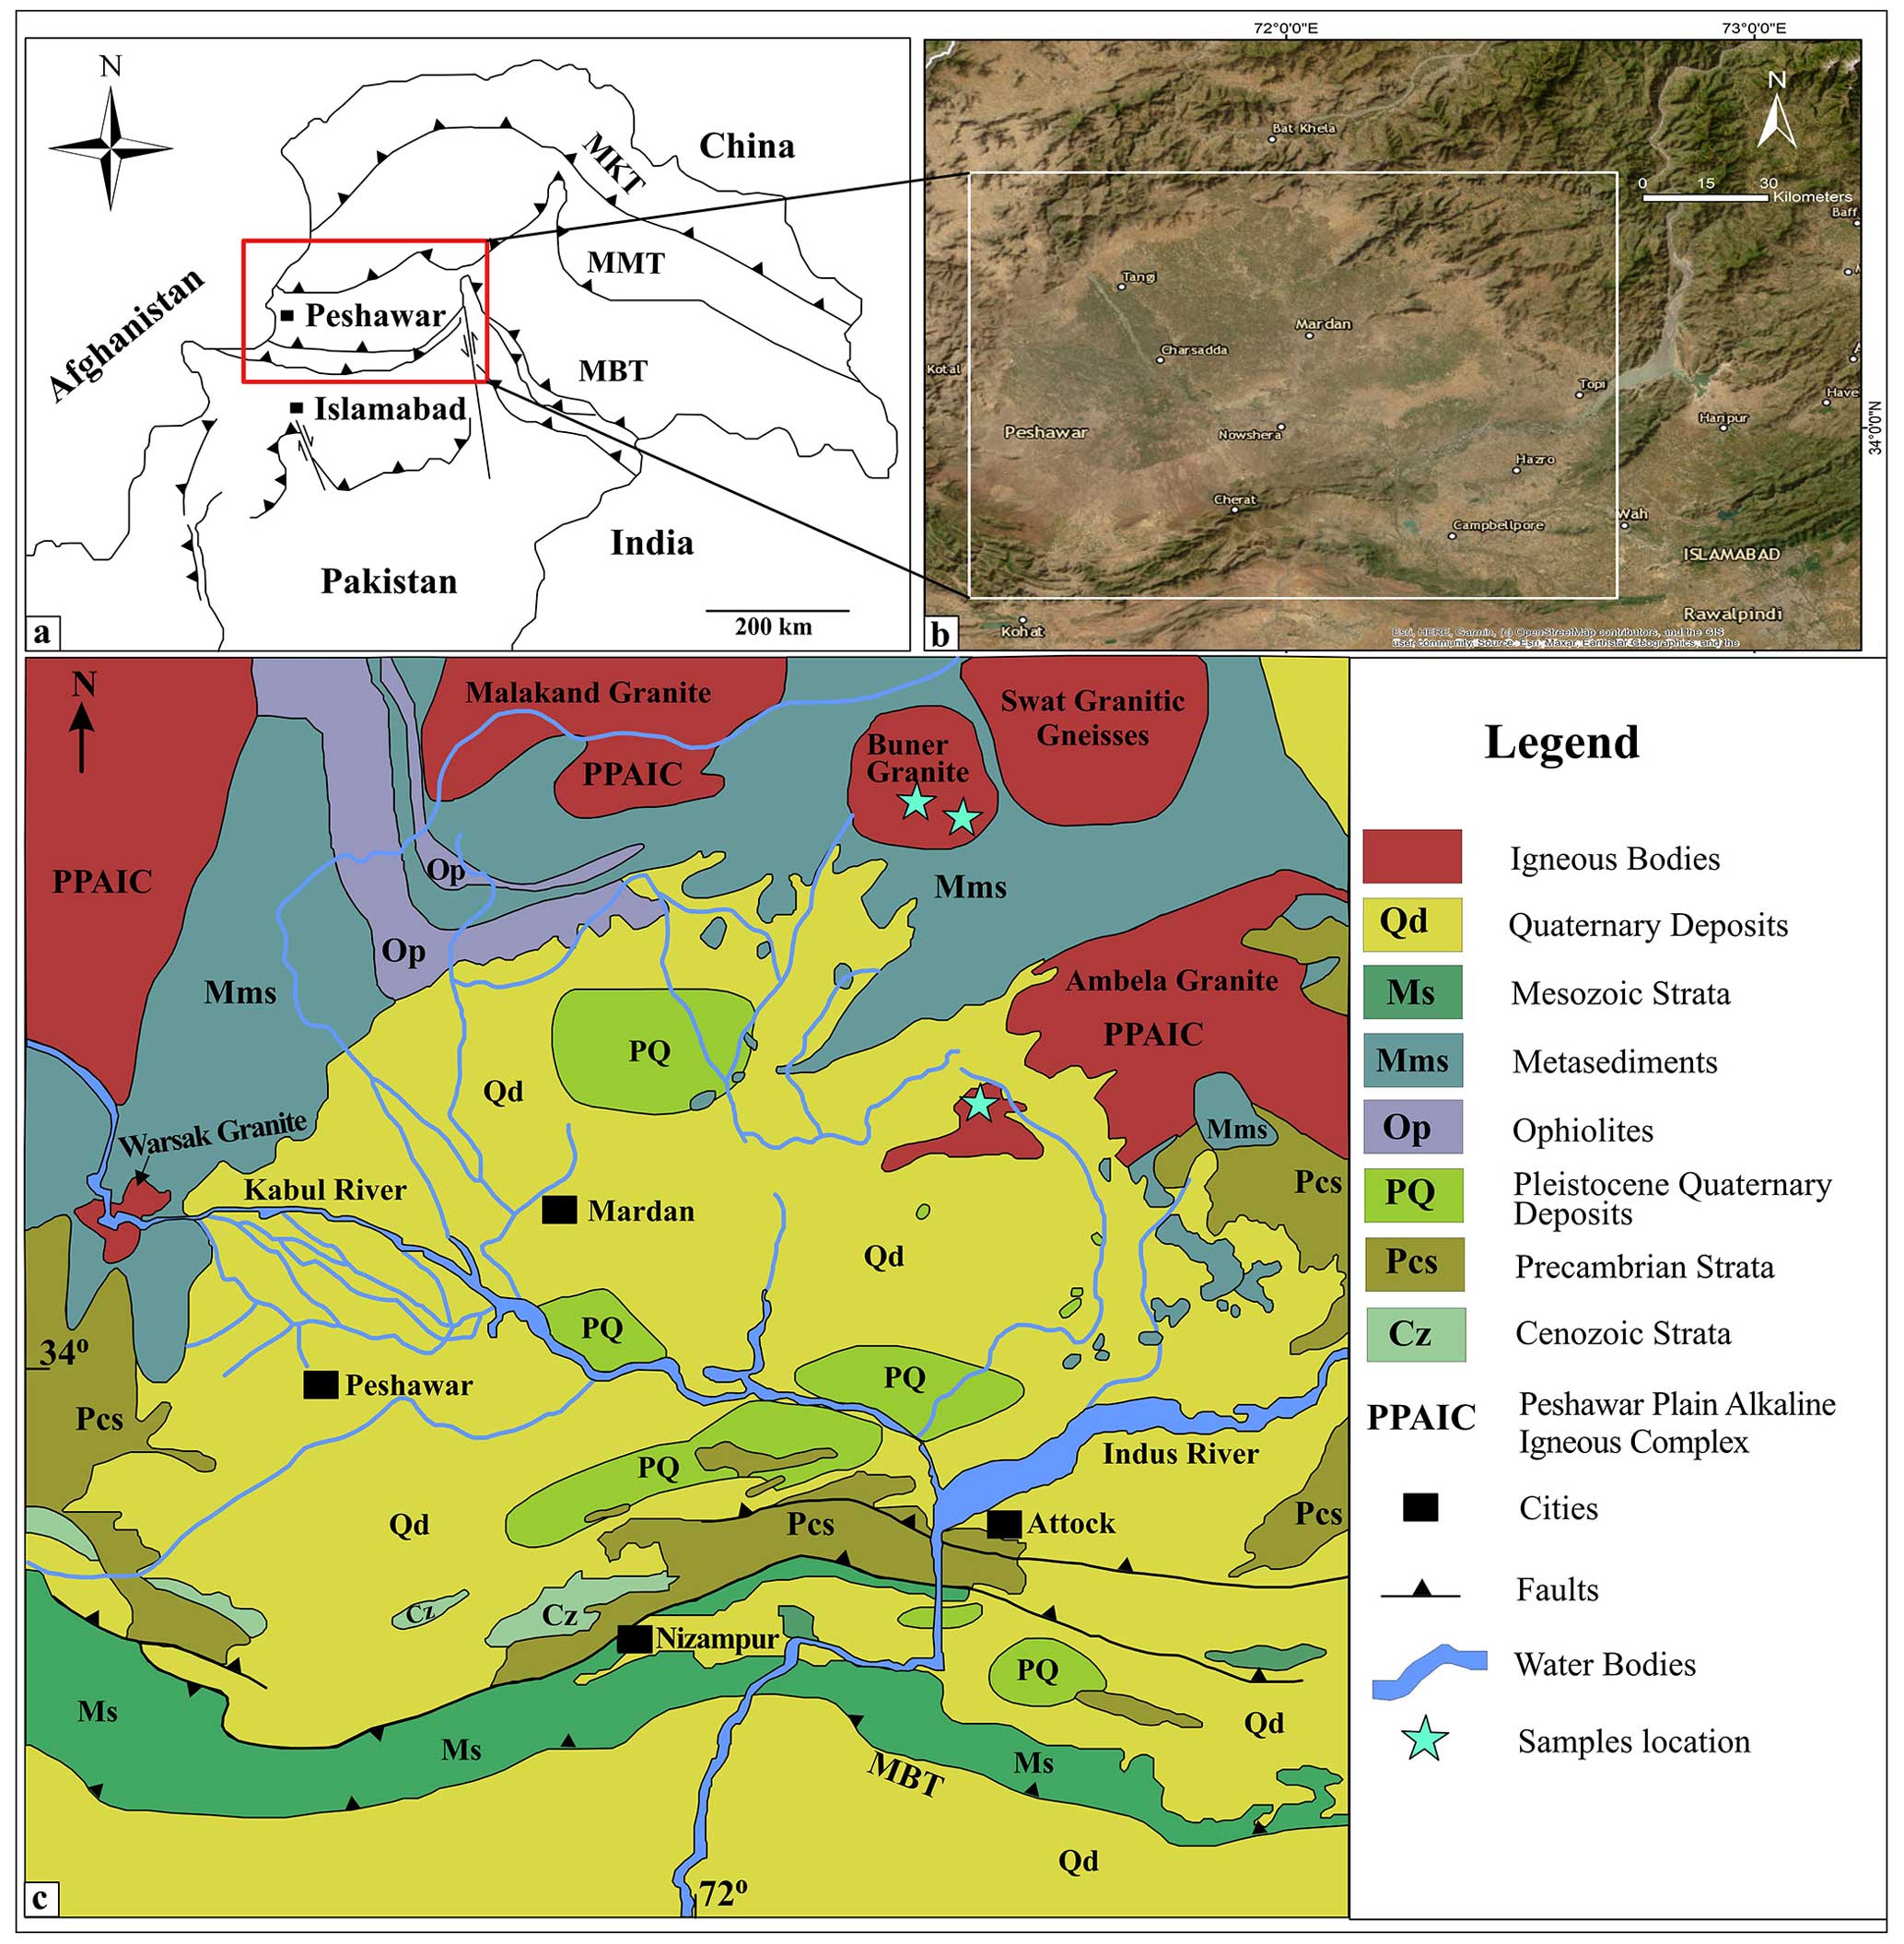
Figure 1(a) The Peshawar Basin location highlighted on the tectonic map of north Pakistan, (b) topographic map of the Peshawar Basin, and (c) geological map of the Peshawar Basin and adjoining areas (modified after Bibi et al., 2019; Kazmi and Jan, 1997).
The calc-alkaline Ambela granitic complex is a major host of quartz veins, with significant occurrences in the Utla-Gadoon and Chingalai regions. These veins are associated with alkaline magmatic events that occurred during the formation of the Ambela batholith and its related complexes. In Utla, quartz is the predominant mineral (15 %–69 %) in most rocks, with some veins containing over 90 % quartz and accessory feldspars cutting across megaporphyritic granites. Some veins in the area have SiO2 contents as high as 95.75 % (Sajid et al., 2014). These quartz veins are closely linked to alkaline magmatic events in both the Ambela granitic complex and Gohati rhyolites. Additionally, the granitic plutons in the Swat and Buner areas are primarily composed of gneissic and undeformed phases, including the Malakand, Mura, Chinglai, and Ilum formations. The Ilum granite gneiss, part of the Swat–Buner schistose group, is a coarse-grained, porphyritic, light-gray, sheet-like body that exhibits well-developed gneissosity (Butt and Shah, 1985). It consists mainly of quartz and microcline, with minor amounts of muscovite and biotite, along with accessory minerals, such as magnetite, limonite, garnet, and tourmaline. Granite exhibits potassic characteristics and contains xenoliths from country rocks. Both the Malakand and Ilum granites are formed through alkaline magmatism (Butt and Shah, 1985). In the area near Amluk Derra, undeformed gray granite was found alongside gneissic granite. This gray granite has a medium- to coarse-grained texture and hypidiomorphic granular structure. In contrast to the Mansehra granite gneiss across the Indus, this granite lacks pegmatitic facies (Shams, 1969). Within the contact aureole of the Ilum granite, several types of hydrothermal veins have been identified, including pure quartz veins, quartz–feldspar veins, quartz–feldspar–epidote–muscovite veins, quartz–feldspar–muscovite–beryl veins, quartz–feldspar–monazite–zircon veins, and smoky quartz–uranothorite veins. These veins indicate a range of mineralizations associated with the alteration processes of granite (Butt and Shah, 1985).
Most quartz grains exhibit undulose extinction, while some show mortar or flaser textures, suggesting syntectonic recrystallization due to shearing and deformation (Passchier and Trouw, 2005). The selected samples are representative of the quartz veins, characterized by their mineralogical features and textural variations.
3.1 Optical microscopic observation
Microscopic analysis of the NB-1, NB-2, and NB-3 vein quartz samples was conducted using double-polished thin sections. The petrological features of the quartz samples, such as grain size, fluid and mineral micro-inclusion composition, and microstructure, were analyzed and characterized using transmission polarizing microscopy (TPM, Nikon DS-RI2 JAPAN).
3.2 Scanning electron microscope (SEM) and cathodoluminescence (CL)
Backscattered electron (BSE) imaging, quartz cathodoluminescence (CL) imaging, and mineral identification were performed using a TESCAN MIRA3 scanning electron microscope (SEM, TESCAN, Czech Republic) equipped with a Gatan Chroma CL2 cathodoluminescence system (Gatan, UK) and an EDAX GENESIS APEX Apollo energy dispersive spectrometer (EDS, EDAX, USA). These analyses were conducted at the CAS Key Laboratory of Crust-Mantle Materials and Environments, University of Science and Technology of China (USTC), Hefei. BSE imaging and EDS measurements were performed at 15 kV and 15 nA, while CL imaging was conducted at 10 kV and 15 nA.
3.3 Raman spectrometry analysis
A confocal Raman microspectrometer (HORIBA LabRAM HR Evolution) was used to examine fluid and mineral micro-inclusions in quartz at the CAS Key Laboratory of Crust-Mantle Materials and Environments, USTC, Hefei. This system, equipped with confocal optics, employed a 532 nm Ar laser with a power output of 500 mW and an air-cooled CCD detector. The measurements were performed using a beam diameter of 1 µm, a slit width of 200 µm, a confocal aperture of 100 µm, and gratings with 600 grooves mm−1. A 100× objective lens was used with two accumulations per measurement and an acquisition time of 3 s. To ensure the instrument's stability and accuracy, polycrystalline and monocrystalline silicon samples, along with a silicon metal reference with a measured value of 520.7 cm−1, were analyzed both before and after each session.
3.4 Chemical composition analysis by ICP-MS
The University of Science and Technology of China's CAS Key Laboratory of Crust-Mantle Materials and Environments is where impurity analysis in quartz was conducted. This study used an Agilent 7700e quadrupole ICP-MS or a PerkinElmer ELAN DRC II in conjunction with a Coherent ArF excimer UV laser ablation system with a wavelength of 193 nm (GeoLas Pro). For quality control, one replicate was included for every 10 samples, and a standard solution prepared from GBW07837 quartz reference material was simultaneously analyzed. An Agilent 7700e quadrupole ICP-MS, running at a 1.0 L min−1 nebulized gas flow and of 1350 W RF power, was used to evaluate this solution. At a flow rate of 3.5 mL min−1, helium was added as the collision gas to lessen the impact of impurities on polyatomic ions. The calibration curve for the standard solution was constructed using 13 elements from Yanak steel with concentrations of 10, 40, 100, and 200 parts per billion (ppb). The ICP-MS sample preparation involved an acid-dissolution method, wherein a 50 mg sample was treated with a mixture of HF and HNO3 acids. To obtain precise impurity data through bulk analysis, it is necessary to transform solid samples into liquid form. The methods employed for dissolving silicate samples can be categorized into two main approaches: high-pressure digestion using HF or a combination of HF and other acids (e.g., HClO4, HNO3, HCl, or H2SO4) (Liang et al., 2000; Zhang et al., 2012; Aldabe et al., 2013; Chen et al., 2017) and alkali flux fusion. Decomposing geological materials in acid mixtures containing HF within sealed systems at elevated temperatures and pressures has proven to be more effective than open-system methods. This closed-system approach not only enhances the ability to digest resistant minerals but also boosts the overall decomposition efficiency (Zhang et al., 2012).
3.5 X-ray powder diffraction (XRD)
X-ray powder diffraction (XRD) analysis was used to examine the phase and structural compositions of the three treated quartz sand samples. Graphite-monochromatized Cu Kα radiation (λ=0.154056 nm) was employed for the analysis using a Rigaku SmartLab X-ray diffractometer (Japan). Scanning was performed over a 2θ range of 10–50° at a rate of 0.02° s−1.
3.6 Purification experiment
We used a series of procedures, including calcination, water quenching, grinding, flotation, and acid leaching, to purify the three raw-vein quartz samples. Every purification technique was tailored to the distinctive attributes of the different contaminants found in the quartz ore. The selection of an appropriate purification technique is typically guided by the nature of the impurities. To achieve optimal purification, it is beneficial to integrate multiple methods in a systematic and coordinated manner (Al-Maghrabi, 2004). The experimental process was conducted according to the flowchart shown in Fig. 2.
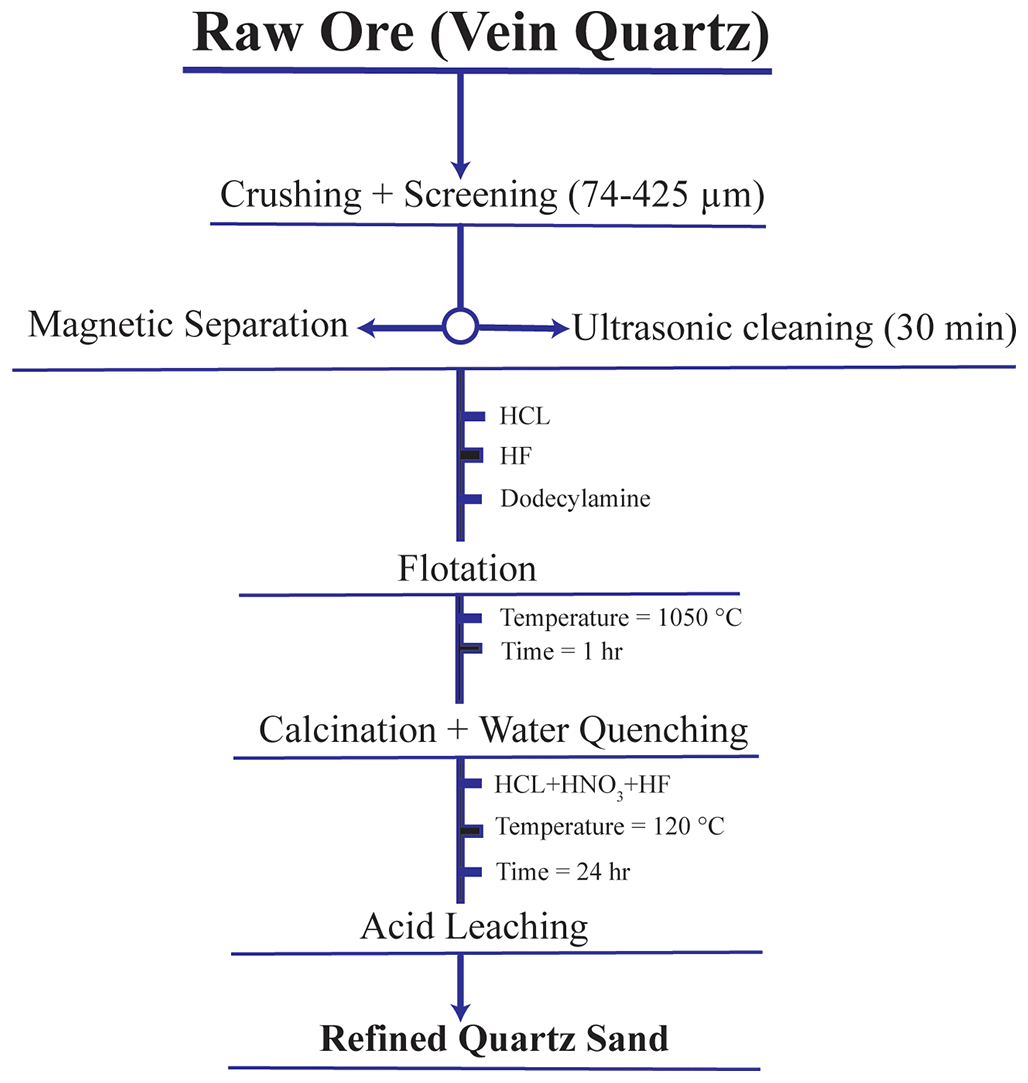
Figure 2The experimental flowchart for purification of quartz samples including NB-1, NB-2, and NB-3. HCl: hydrochloric acid; HNO3: nitric acid; HF: hydrofluoric acid; CHN: dodecylamine (DDA).
3.6.1 Quartz sand-making process
Separating quartz and related minerals from the ore and determining the impurities in the quartz are the goals of producing quartz sand. In the process of quartz ore mining, significant quantities of clay minerals, cement compounds, and metal oxide films accumulate on the quartz surface, which contains high contents of Al and Fe (Xie et al., 2024). After being thoroughly cleaned and dried, the raw quartz ore was crushed into pieces ranging in size from 20 to 50 mm. Subsequently, it was finely grounded to achieve the desired outcome. The resulting material was then calcined at 900 °C for approximately 1 h, followed by rapid cooling using water. Quartz sand was then ground and crushed to achieve the desired grain size. Quartz was sorted using standard nylon sieves into different fractions of the desired size range of 425–74 µm (40–200 mesh). Sieving controls the particle size, removes oversized and undersized particles, and ensures uniformity, allowing for the collection of fractions for further research, as depicted in Fig. 2.
3.6.2 Magnetic separation
Owing to the presence of a higher amount of mechanically entrained iron in the quartz sand crushed by the crusher and considering the constraints of the laboratory settings, it is advisable to utilize powerful magnets to selectively remove this iron content from the quartz sand particles that meet the required size criteria. The use of a strong magnetic separator can improve the experimental results.
3.6.3 Ultrasonic cleaning
The SiO2 quartz sand concentration decreased with increasing particle grain size, but the amounts of impurity minerals containing iron and aluminum exhibited the opposite pattern. This pattern is particularly prominent in quartz sand, in which clay minerals are present in significant amounts (Zhu et al., 1999). Despite the relative purity of these three-vein quartz samples, they still contained some clay minerals rich in Fe and Al adhering to their surface owing to the mining process. Therefore, ultrasonic cleaning is required to eliminate surface impurities from the quartz sand. The required quartz sand was further purified using an ultrasonic vibration machine. This process involves maintaining a stable mixture with a water content of approximately one-third at a constant temperature of 100 °C. A beaker containing pure water was filled with quartz sand. Subsequently, warm water was poured into a beaker. The solution was then stirred for approximately 30 min. During this time frame, the water was replaced every 5 min to ensure optimal efficiency. Following the ultrasonic treatment, the quartz sand underwent two additional washing cycles to further enhance its purity.
3.6.4 Flotation
Quartz and feldspar typically coexist in nature, posing challenges for their effective separation because of their similar crystal structures and surface characteristics. Flotation, a commonly used method that relies on differences in hydrophobicity (such as heavy minerals, feldspar, or mica) of particle surfaces, is widely employed to separate various minerals. During flotation, hydrophobic mineral particles adhere to air bubbles and float to the surface as a froth, whereas hydrophilic particles sink (Haus et al., 2012; Jiang et al., 2022; Larsen and Kleiv, 2016). The variation in hydrophobicity across the mineral particle surfaces plays a crucial role in the efficient separation of quartz from silicate minerals. The interaction with collectors, depressants, activators, and pH regulators can significantly enhance the surface hydrophobicity of these mineral particles (Pan et al., 2022). Acid, alkaline, and neutral flotation are common traditional flotation techniques for quartz–feldspar separation. The hydrophilic quartz particles sink to the bottom of the flotation cell in acid and neutral flotation, whereas the hydrophobic feldspar particles cling to the bubbles and float to the top. In contrast, alkaline flotation reverses this process (Jiang et al., 2022). In this study, an effective and convenient flotation method was employed to purify quartz sand by separating feldspar from it. This was achieved using HF as an activator and dodecyl amine and sodium dodecyl sulfonate surfactants as cationic collectors in a pH range of 2–3 (Demir et al., 2003; Shimoiizaka et al., 1976).
An XFD-12 flotation machine with a 0.5 L capacity and stirring capability was utilized to conduct a flotation experiment. The air injection rate was maintained at 1600 rpm and 0.25 m3 h−1. Initially, a 100 g sample of quartz sand, composed of particles varying in size from 74 to 425 µm, was added to the flotation cell and thoroughly blended with distilled water. To obtain a pH range between 2 and 3, a catalyst of 0.4 mL was introduced. After swirling for 2 min, 1 mL of sodium dodecyl sulfonate and 1 mL of dodecyl amine, both at a concentration of 5 %, were added to the slurry. Flotation was performed for 10 min. Subsequently, the resulting foam and sediment products composed of quartz sand were collected and placed in distinct containers.
3.6.5 High-temperature calcination–water quenching
The main goal of this technique is to reveal surface impurities such as lattice inclusions and other mineral impurities or to isolate them individually. This process significantly influences the removal of impurities, particularly fluid contaminants, and other mineral inclusions. During the transformation of quartz into different crystal types, the associated volume changes and the expansion and bursting of inclusions generate numerous microcracks. The creation and deepening of these microcracks are further enhanced by water quenching and sample cooling because of the significant thermal stress gradient that occurs during rapid quenching (Zuo et al., 2022). This process releases quartz fluid inclusions and previously encapsulated minerals, and the high-temperature phase transformation enriches the quartz surface with elements, such as Al, Li, Na, and K, making impurity removal more efficient (Pan et al., 2022). Following the flotation process, the samples underwent high-temperature calcination at ∼ 1050 °C for approximately 1 h. To ensure complete cleaning, samples were subjected to three rounds of ultrasonic cleaning. Finally, quartz sand was cleaned, dried, and prepared for further leaching tests. Each of these steps improves the effectiveness of the chemical leaching process.
3.6.6 Acid leaching
Acid leaching is a very efficient way to remove any metal contaminants from a quartz ore sample, whether they are in the ore's crystalline structure, on the surface, or inside cracks. Mica and feldspar are the two remaining silicate minerals that were also eliminated by this method. The purity of quartz ore is significantly increased by acid leaching using sulfuric acid, hydrochloric acid, oxalic acid, and hydrofluoric acid (Du et al., 2011; Tuncuk and Akcil, 2016; Yang et al., 2017). HF is known for its ability to dissolve various silicate minerals, including residual mica and feldspar, and its high corrosiveness. This also causes moderate dissolution of quartz, which exposes certain inclusions within the quartz. Furthermore, HF easily diffuses into the quartz lattice, where it reacts with and dissolves metal atoms. Therefore, adding a specific amount of HF can improve the acid leaching purification process (Su et al., 2004). To ensure that an appropriate amount of HF is used and to prevent the dissolution of more quartz, it is recommended that mixed acids be used. Previous research has demonstrated that combining acids can create a synergistic effect and result in better impurity removal; consequently, the use of mixed acids is common in acid leaching, and hot-pressure acid leaching is often employed for the deep purification of quartz sand (Zhong et al., 2014; Zhong et al., 2021).
After flotation of the quartz sand, followed by calcination and water quenching, 10 g of the sample was placed in 50 mL Teflon cups that had already been cleaned. The samples were subjected to a 24 h acid leaching procedure at 80 °C, utilizing a combination of hydrochloric acid (HCl), nitric acid (HNO3), and hydrofluoric acid (HF) in the system (30 mL of HCl acid, 10 mL of HNO3, and 10 mL of HF acid). After acid leaching, the quartz sand samples were vacuum-dried in an oven for 30 min at approximately 120 °C. Subsequently, the specimens underwent a thorough rinsing process, consisting of three cycles using ultrapure water. To improve the effectiveness of purification, acid leaching can corrode the visible impurities on the surfaces of quartz grains and penetrate their interiors through small fissures. This method is particularly beneficial for the breakdown of aluminosilicate minerals and removal of surface iron resulting from the combination of quartz and impurities (Lin et al., 2020).
4.1 Characteristics of hand specimen
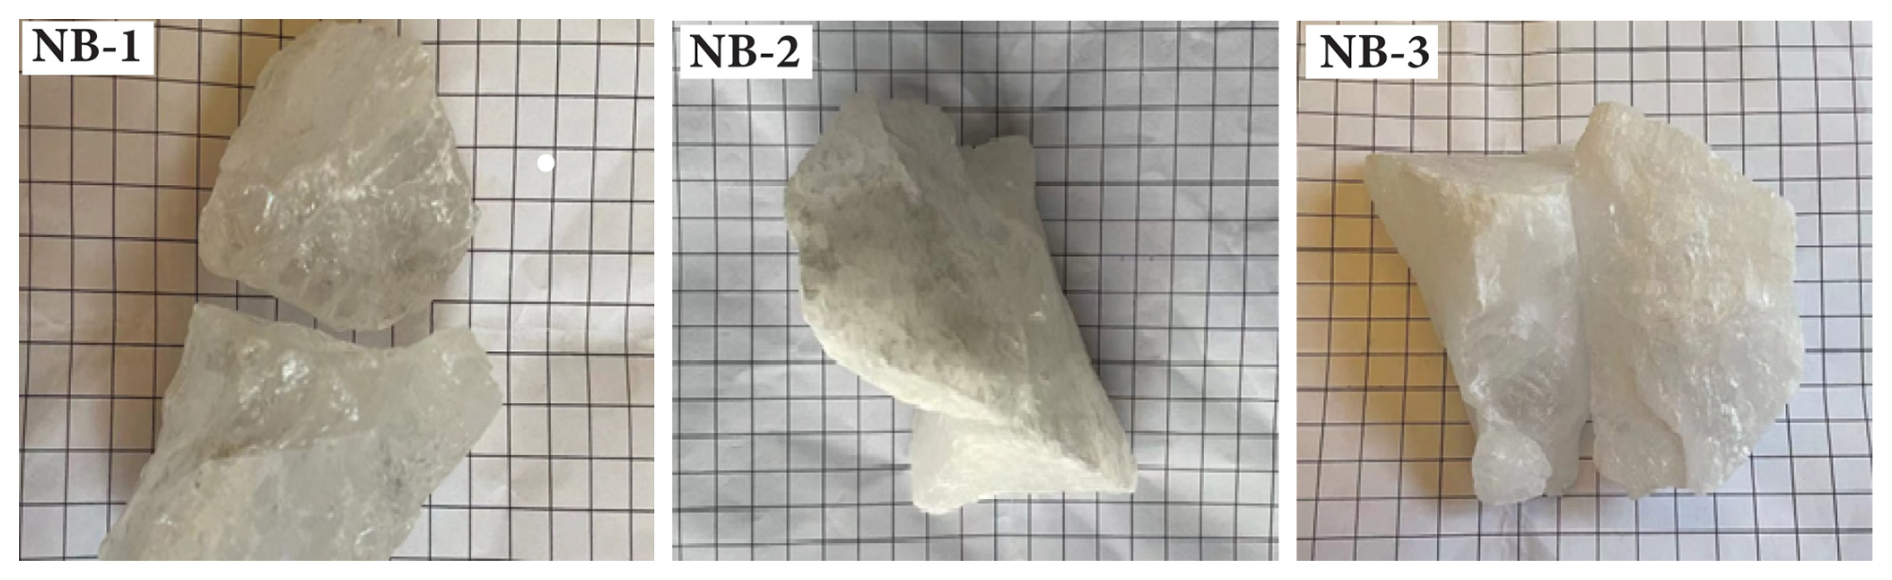
A common method to examine the quality of HPQ raw materials involves visually inspecting ore hand specimens for their structure, particle size, color, transparency, cracks, and impurities using the naked eye.
Upon examination of the hand specimens, it was observed that quartz sample NB-1 exhibited a high level of transparency, but NB-2 and NB-3 displayed low transparency (Fig. 3). Additionally, NB-2 appeared milky white, and NB-3 appeared gray-white, with both exhibiting an oily luster. There are no visible associated minerals under the naked eye, and scanning electron microscopy reveals pure quartz. These samples were of high purity and quality and possessed the basic characteristics of high-purity quartz raw materials.
4.2 Characteristics of fluid inclusions
The current study specifically examined three samples: NB-1, NB-2, and NB-3. Figure 4 shows the microphotographs of the quartz samples, specifically highlighting the fluid inclusions. However, the challenges associated with eliminating certain impurities vary. Coexisting minerals can be easily extracted. The main types of impurities found in natural quartz are fluids and mineral inclusions. The number, size, distribution, composition, and morphological features of these inclusions play a major role in determining the quality of the vein quartz raw materials (Götze, 2012). Because the inclusions are enclosed in quartz crystals, beneficiation procedures are difficult to remove. Mineral inclusions are often less common in high-quality vein quartz raw materials, whereas fluid inclusions are more common (Xia et al., 2024). The three primary types of inclusions found in natural quartz are fluid inclusions, melt inclusions, and mineral inclusions. In theory, quartz can also host specific coexisting minerals such as micro-and submicron inclusions. Quartz originating from igneous or pegmatitic sources often features silicate melt inclusions, which are small, approximately 1–300 µm, glassy or crystalline silicate melt droplets (Frezzotti, 2001; Webster, 2006). During quartz mineralization, fluids confined inside the crystal produce inclusions that are frequently found in quartz. Mineral inclusions are often less common in high-quality vein quartz raw materials; however, fluid inclusions are more common (Xia et al., 2024). Most metallic impurity elements present in quartz, such as Na, K, Ca, Mg, Ba, Mn, and rare earth elements (REEs), are also present in fluid inclusions (Blankenburg et al., 1994; Götze, 2009; Götze et al., 2004). Fluid inclusions significantly affect quartz quality and the range of applications. In the glass industry, bubbles are generated when gas and liquid inclusions are present during the melting process. The presence of these bubbles has a direct impact on the mechanical and optical characteristics of quartz glass (Gemeinert et al., 1992; Kitamura et al., 2007).
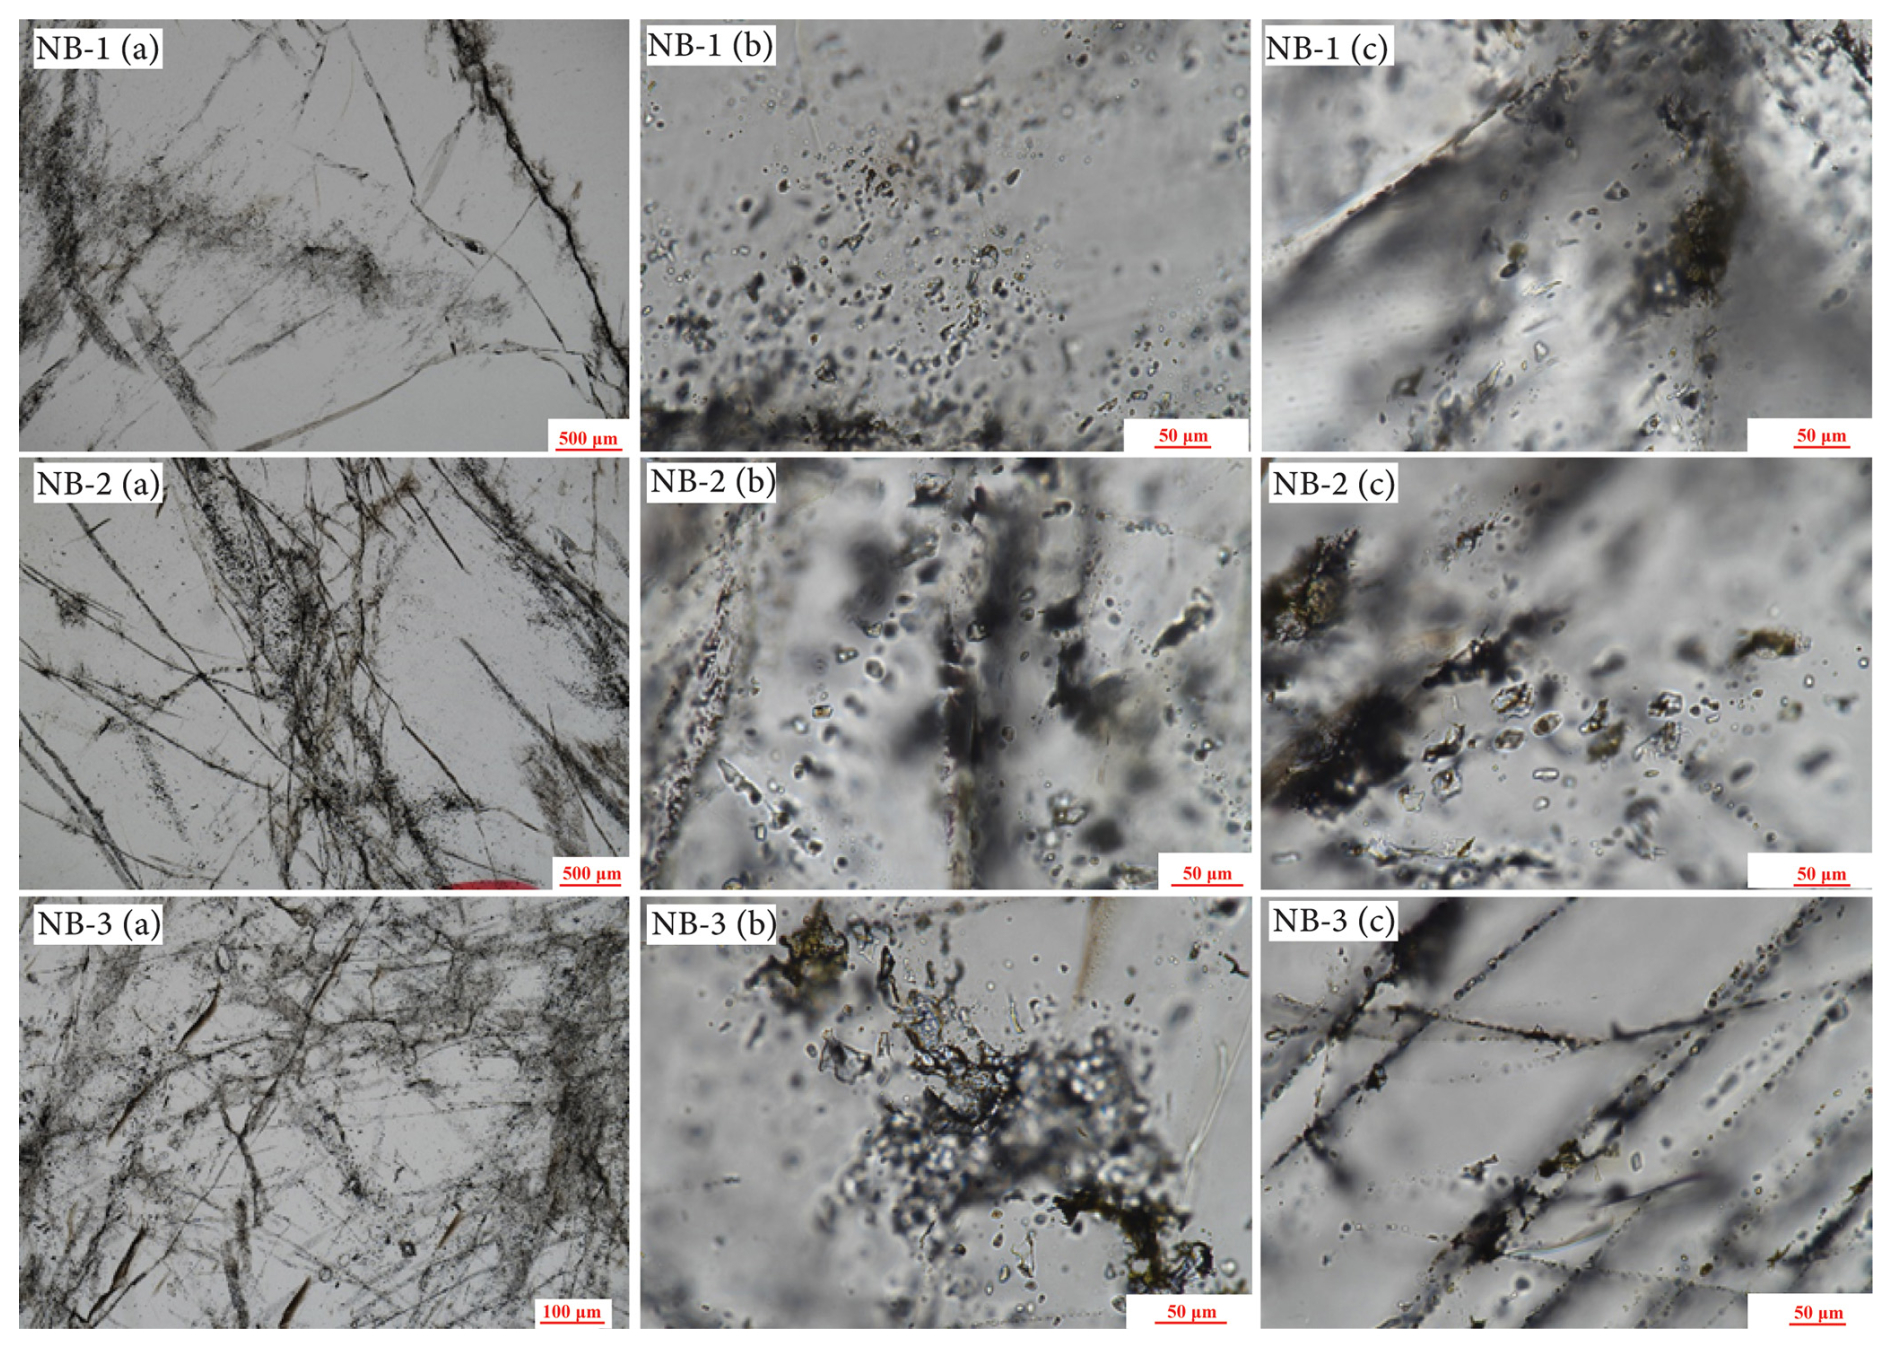
Figure 4Optical microphotographs of quartz crystals and fluid inclusions from NB-1, NB-2, and NB-3 show distinctive characteristics. In NB-1 (a, b, and c), the quartz surface features numerous vapor–liquid two-phase fluid inclusions arranged directionally, and a large number of tiny fluid inclusions were distributed at the grain junction. NB-2 (a, b, and c) has some grains that are internally clear, with many tiny fluid inclusions present on the quartz surface and at the grain junctions. Similarly, NB-3 (a, b, and c) displays a large number of small fluid inclusions distributed on the quartz surface and at the grain junctions, and the quartz surface resembles vapor inclusions arranged in a scratch-like direction.
Optical microscopy revealed that the particle sizes of the three quartz samples were very large. The insides of the grains of samples NB-1 and NB-2 are clean (Fig. 4). Fluid inclusions, often found in quartz veins, are mostly composed of primary and secondary inclusions. The quality of high-purity quartz raw materials is significantly affected by the quantity, size, distribution, and composition of inclusions. Secondary fluid inclusions are the predominant type of inclusions observed in high-quality vein quartz. Additionally, a substantial number of tiny fluid inclusions are uniformly distributed throughout the surface and at the intersections of the grains. The grain surfaces and junctions are heavily packed with a multitude of tiny fluid inclusions. Moreover, a considerable quantity of undiluted liquid phase and gas–liquid two-phase fluid inclusions, resembling marks, were organized on the quartz surface. These inclusions had the highest concentrations. None of the three samples included any solid inclusions, and scanning electron microscopy did not detect any symbiotic minerals. The samples mostly contained pure quartz with fluid inclusions at the interface between the surface and grains. The primary constituents of these inclusions were carbon dioxide (CO2) and water (H2O), which can be easily eliminated by subsequent processing and purification. These vein quartz samples predominantly consist of secondary fluid inclusions (Fig. 4). Processing and purification methods are more effective for removing pure liquid-phase inclusions and larger gas–liquid two-phase inclusions. Furthermore, the majority of the regions within the crystals exhibited minimal or no inclusion. Based on the characteristics of the inclusions, these vein quartz samples are considered to be of very high quality as raw materials.
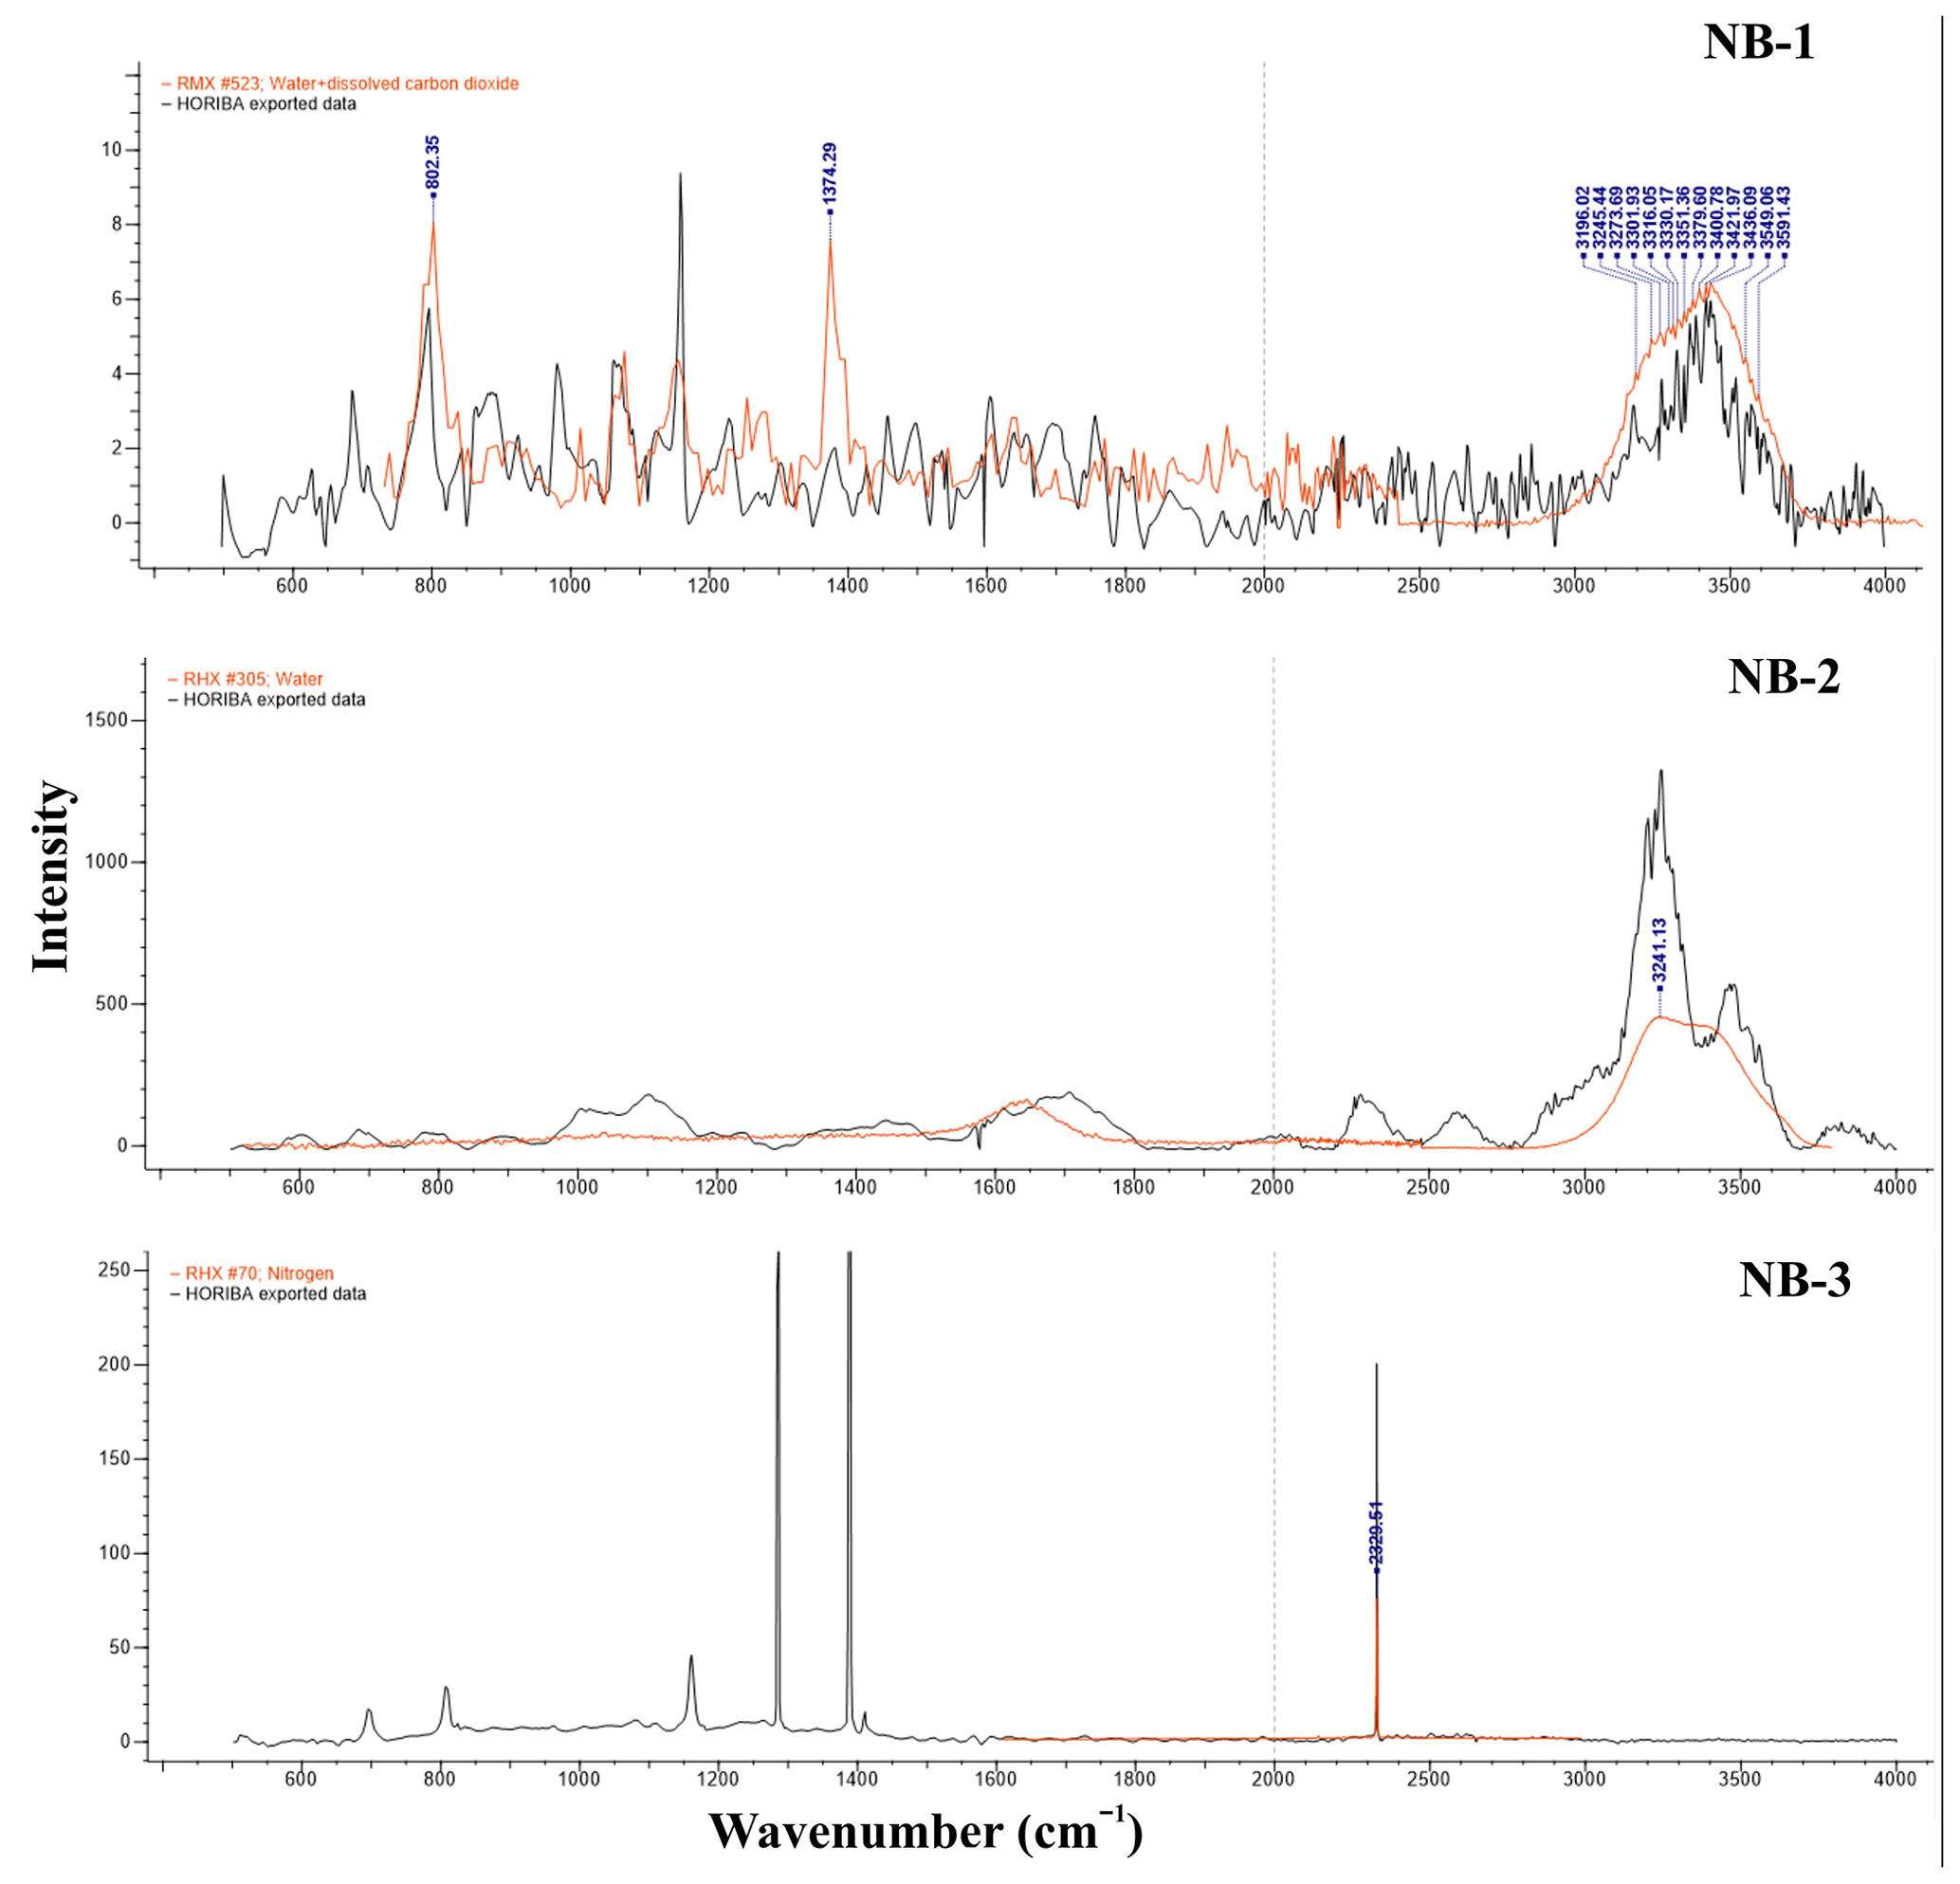
Raman spectroscopy analysis of inclusions in three quartz samples revealed the presence of gas–liquid inclusions. For the NB-1 sample, distinct CO2 peaks were identified at 802.35 and 1374.29 cm−1, with H2O peaks detected in the range of 3100–3600 cm−1 (Fig. 6). The NB-2 sample exhibited a peak at 3241.13 cm−1, which is indicative of pure liquid H2O inclusions. In contrast, the NB-3 sample displayed a prominent peak at 2331.54 cm−1, characteristic of nitrogen (N2). These inclusion features suggest that the quartz from these three veins is of exceptionally high quality, making it suitable for high-purity quartz (HPQ) applications as a raw material (Xia et al., 2024; Müller et al., 2012).
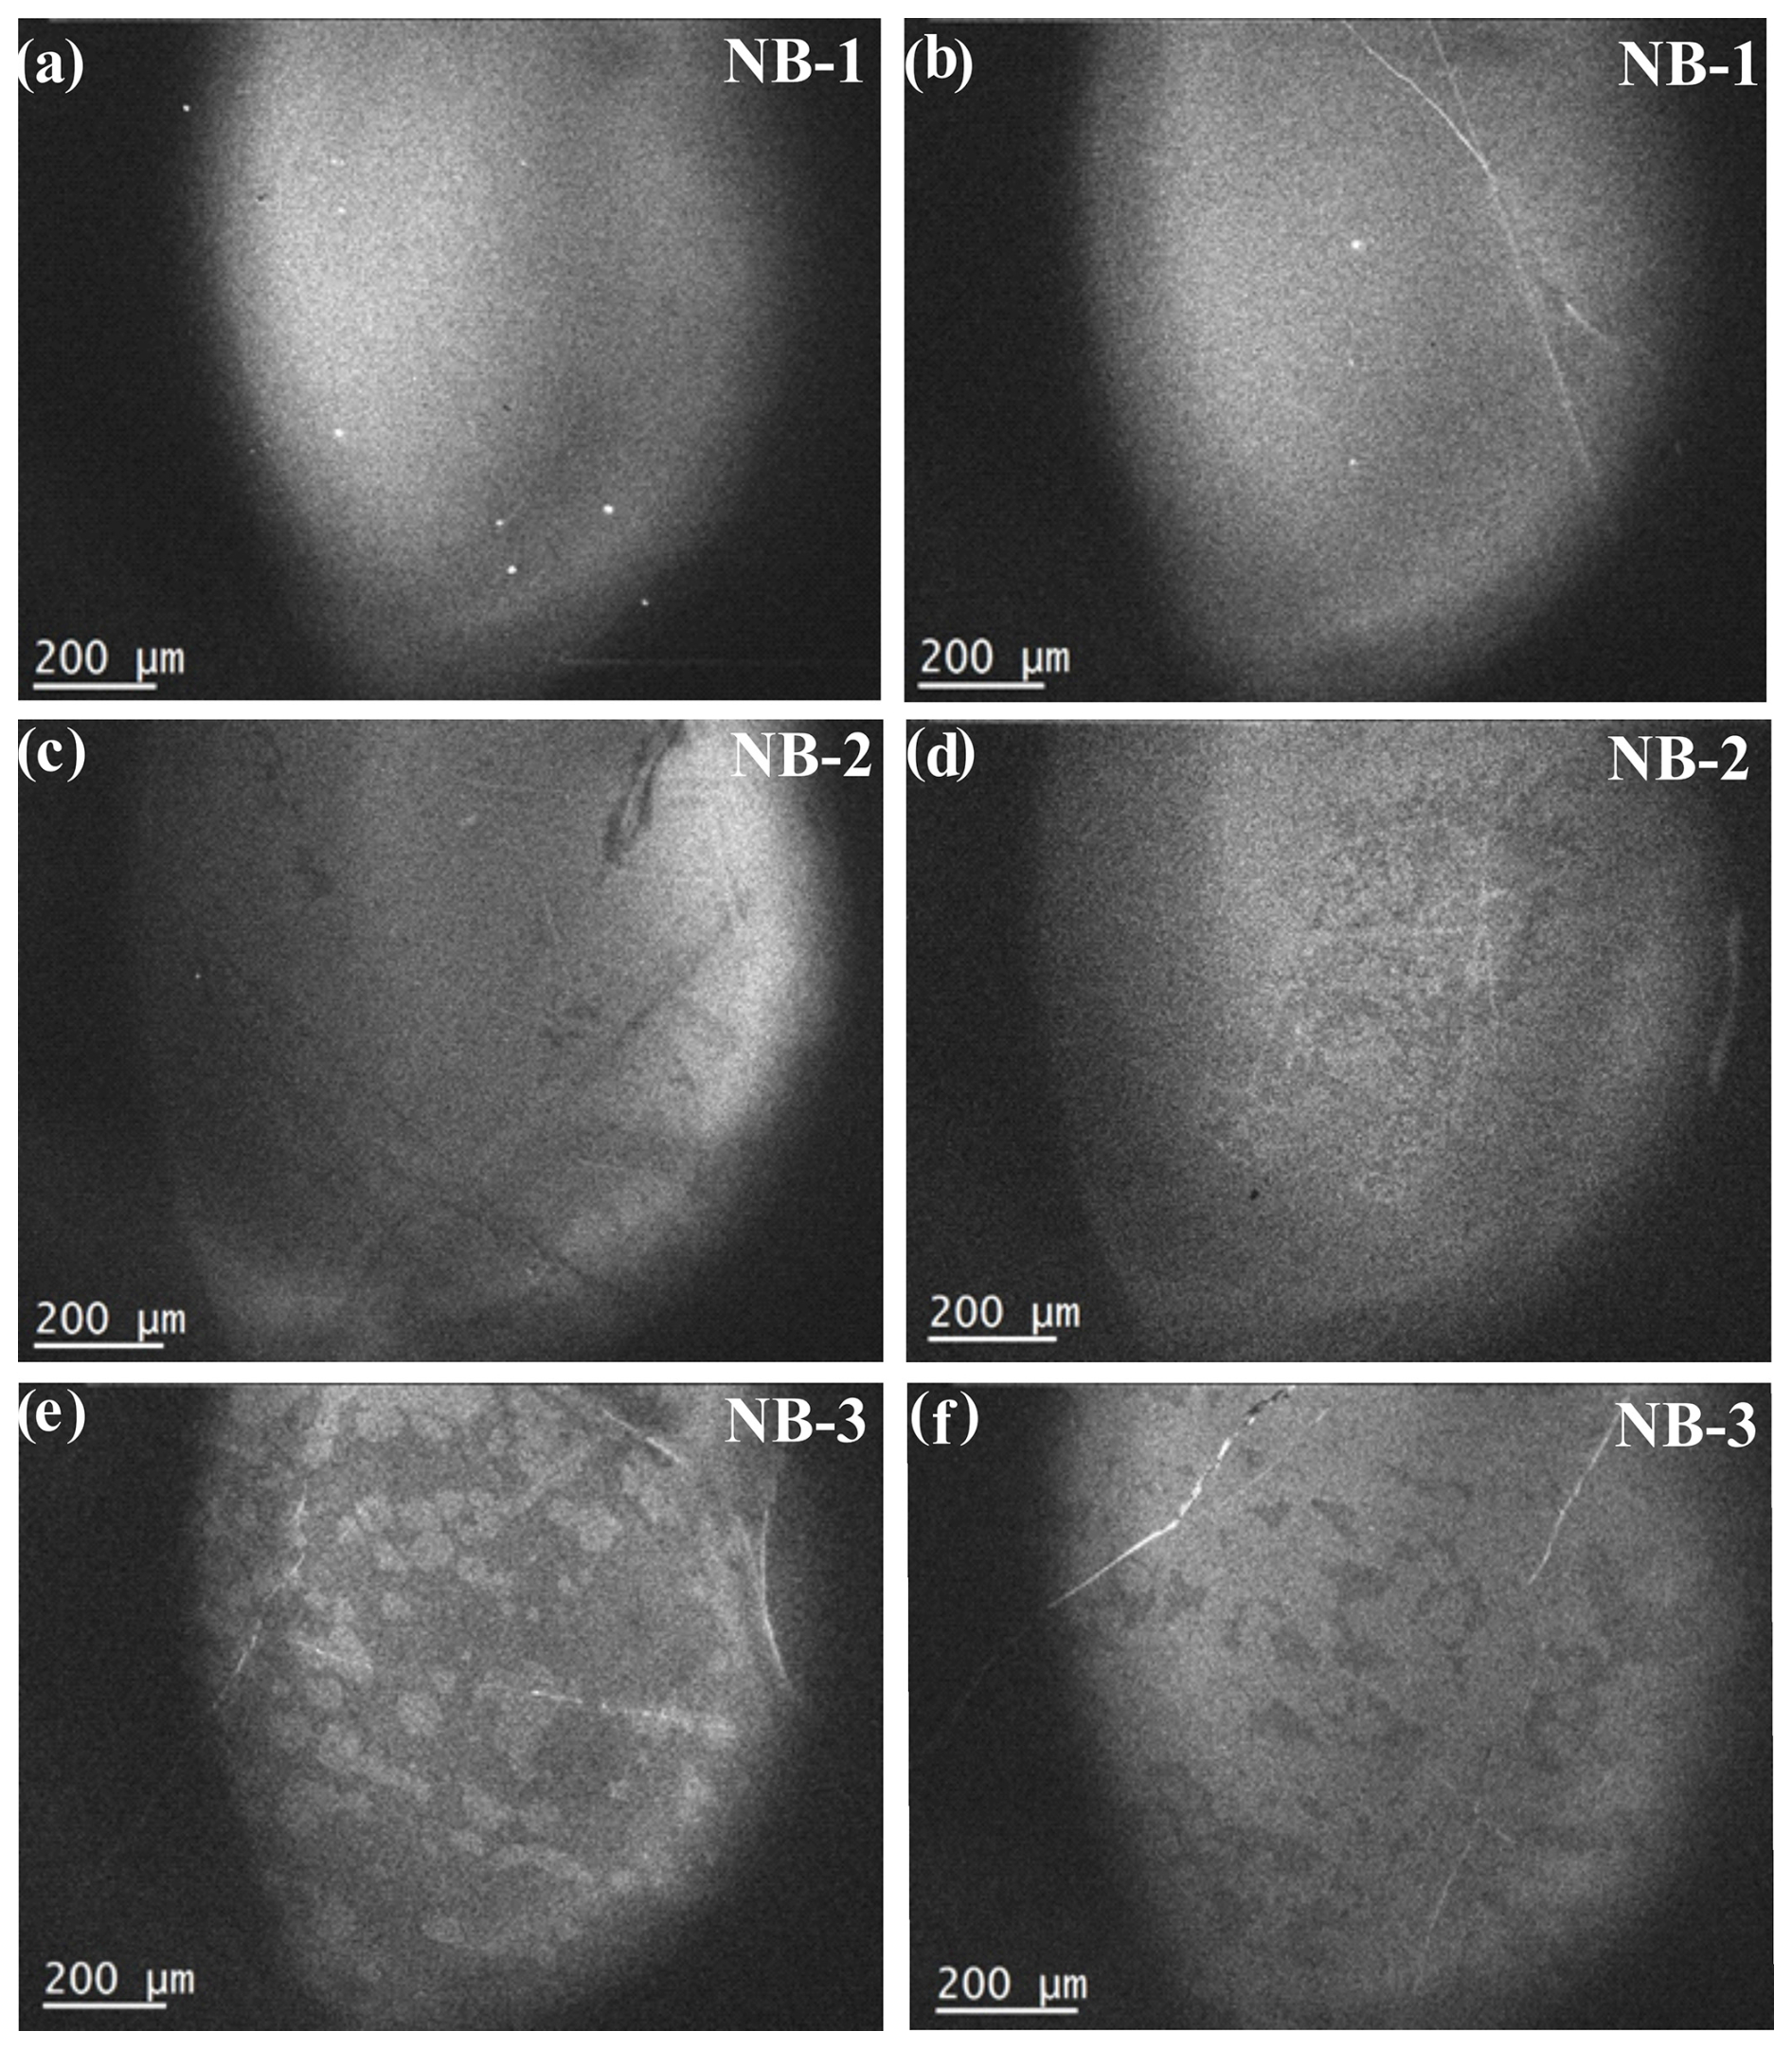
4.3 Cathodoluminescence of the NB-1, NB-2, and NB-3 vein quartz
The cathodoluminescence (CL) texture of NB-1 vein quartz is relatively simple to form in a relatively stable environment, with only a few white microstripes that represent minor changes within the structural lattice. The linear features may represent fractures or healed cracks, or they may indicate inclusions of fluid bubbles (Fig. 5a, b). The CL texture of NB-2 vein quartz has dark and faint stripes, which might be the trails of fluid movements and have alternating bright and dark bands, indicating localized structural defects. The uniform brightness indicates more homogeneous conditions during the quartz growth (Fig. 5c, d). The CL texture of NB-3 showed patches of alternating dark and bright luminescence. The dark areas contain a trail of fluid movement trapped during crystallization. The texture also contained bright lines that may suggest fractures, which may be due to the presence of structural defects (Fig. 5e, f). The visible growth zoning and microfractures in the CL images of these three-vein quartz samples suggest dynamic conditions typical of hydrothermal activity, where quartz crystallized incrementally from silica-saturated fluids. Zoning reflects changes in temperature, pressure, or fluid composition, whereas fractures indicate post-crystallization stress. This simple texture reveals weak hydrothermal activity after the formation of the original quartz (Xia et al., 2023).
4.4 Purification process
The quartz purification process involves three main stages: pretreatment, physical purification, and chemical purification. Pre-treatment encompasses various steps such as crushing, washing, de-silting, screening, and grinding (Kohobhange et al., 2018; Yang et al., 2019). During the extraction of quartz ore, a significant amount of clay minerals adheres to the quartz surface, along with metal oxide films containing high levels of Fe and Al. As the quartz particles were ground to the desired industrial granularity of 0.425–0.074 mm (40–200 mesh), the surface content of impurities, such as Fe and Al, increased. These impurities could be effectively reduced by rubbing and liming. Physical purification involves processes such as color sorting, magnetic separation, and flotation (Peçanha et al., 2019; Yang et al., 2020). Magnetic separation is particularly effective for removing magnetic minerals from quartz sand. Flotation is highly efficient in separating silicate minerals associated with quartz, such as feldspar and mica. This method exploits the differences in the surface hydrophobicity between minerals (Jiang et al., 2022).
High-temperature calcination is the main step in chemical purification, followed by acid leaching and water quenching (Li et al., 2021). High-temperature calcination causes inclusions within quartz sand to burst and form microcracks. Quenching deepens these cracks, making it easier for acid leaching to dissolve inclusions and remove lattice impurities, thereby achieving thorough purification. There are two common methods for high-temperature calcination: raw ore calcination and sand calcination. Raw ore calcination, followed by thermal-assisted comminution, helps prevent the quartz from being over-ground. Sand calcination enhances the exposure of inclusions and lattice impurities because of finer particles and larger surface area. After calcination, the quartz samples underwent hot-pressed acid leaching, where the HF in the leaching agent corroded the quartz surfaces and widened the cracks formed during calcination and quenching. This allowed the leaching solution to penetrate the quartz crystals, chemically react with impurities, and dissolve inclusions and lattice impurity elements. While SEM analysis of NB-1, NB-2, and NB-3 quartz ores revealed no associated minerals, flotation experiments were conducted as a precaution to identify any potential undiscovered impurities, ensuring the selection of the optimal experimental approach. Moreover, it aims to break down inclusions and eliminate impurities using methods such as leaching impurities through calcination–water quenching and acid leaching (Zhang et al., 2023). The experimental process was conducted according to the flowchart shown in Fig. 2.
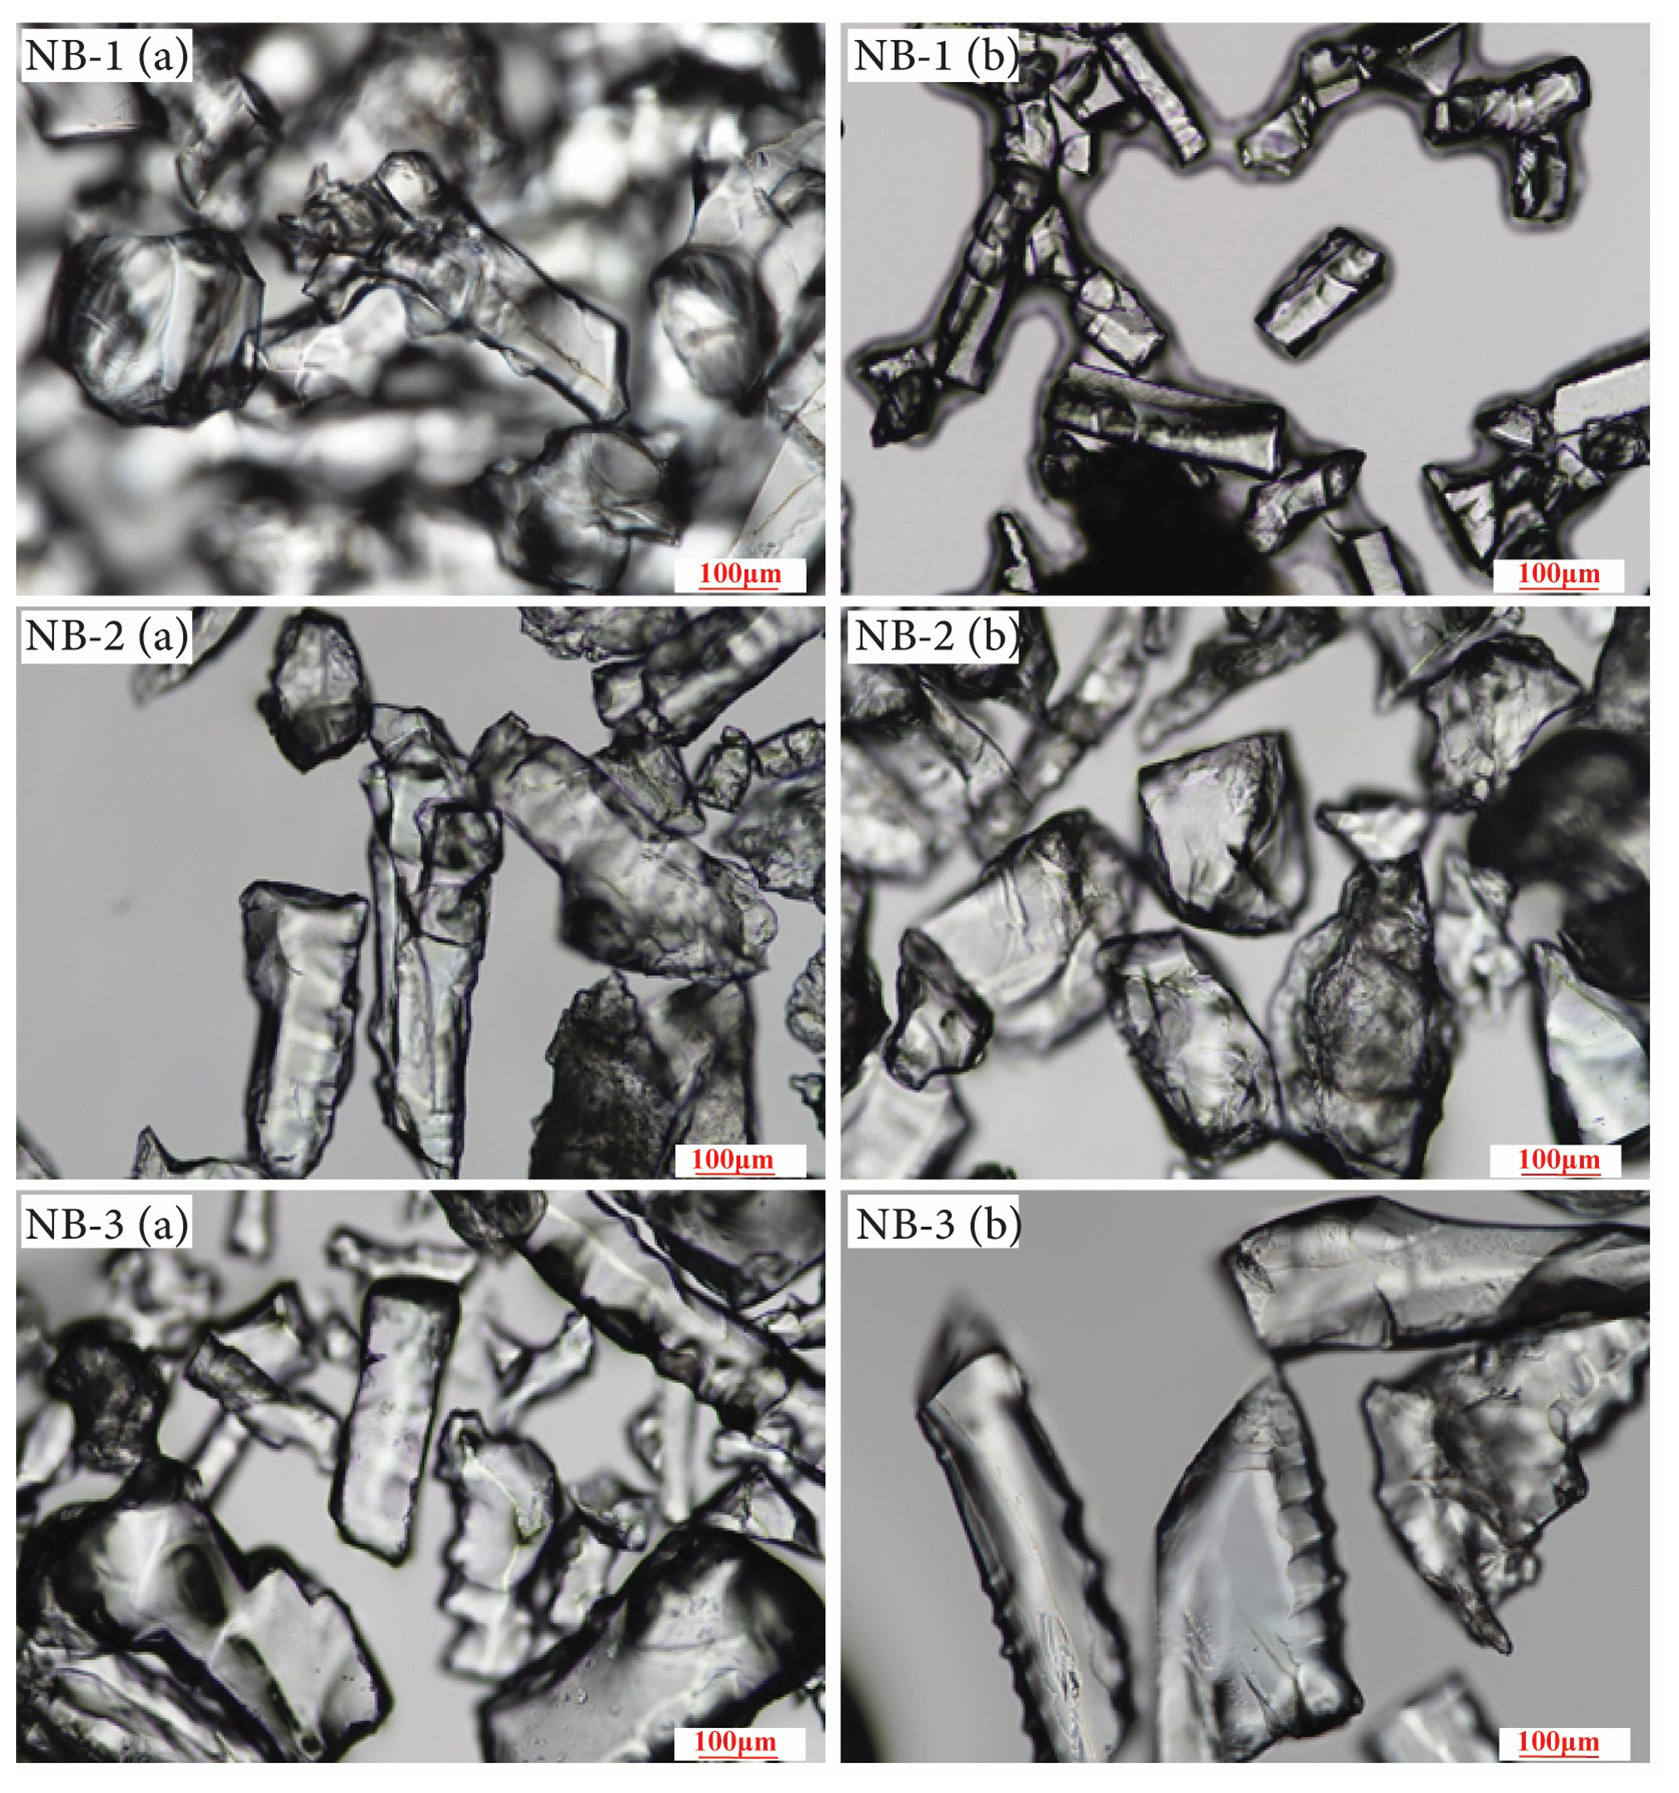
4.5 Microstructure and XRD analysis of vein quartz sand
The optical microphotographs in Fig. 7 show three processed quartz sand samples. These images highlight remarkably similar microscopic structures across the processed samples, featuring smooth and clean surfaces, and prominent microcrack distributions. These cracks, which were formed by high-temperature calcination and acid corrosion, were arranged in approximately parallel. The gas–liquid inclusion content in these quartz sands is even lower, with hardly any residual gas–liquid inclusions observed. Therefore, based on the inclusion characteristics, NB-1, NB-2, and NB-3 quartz sands are deemed to be of high quality.
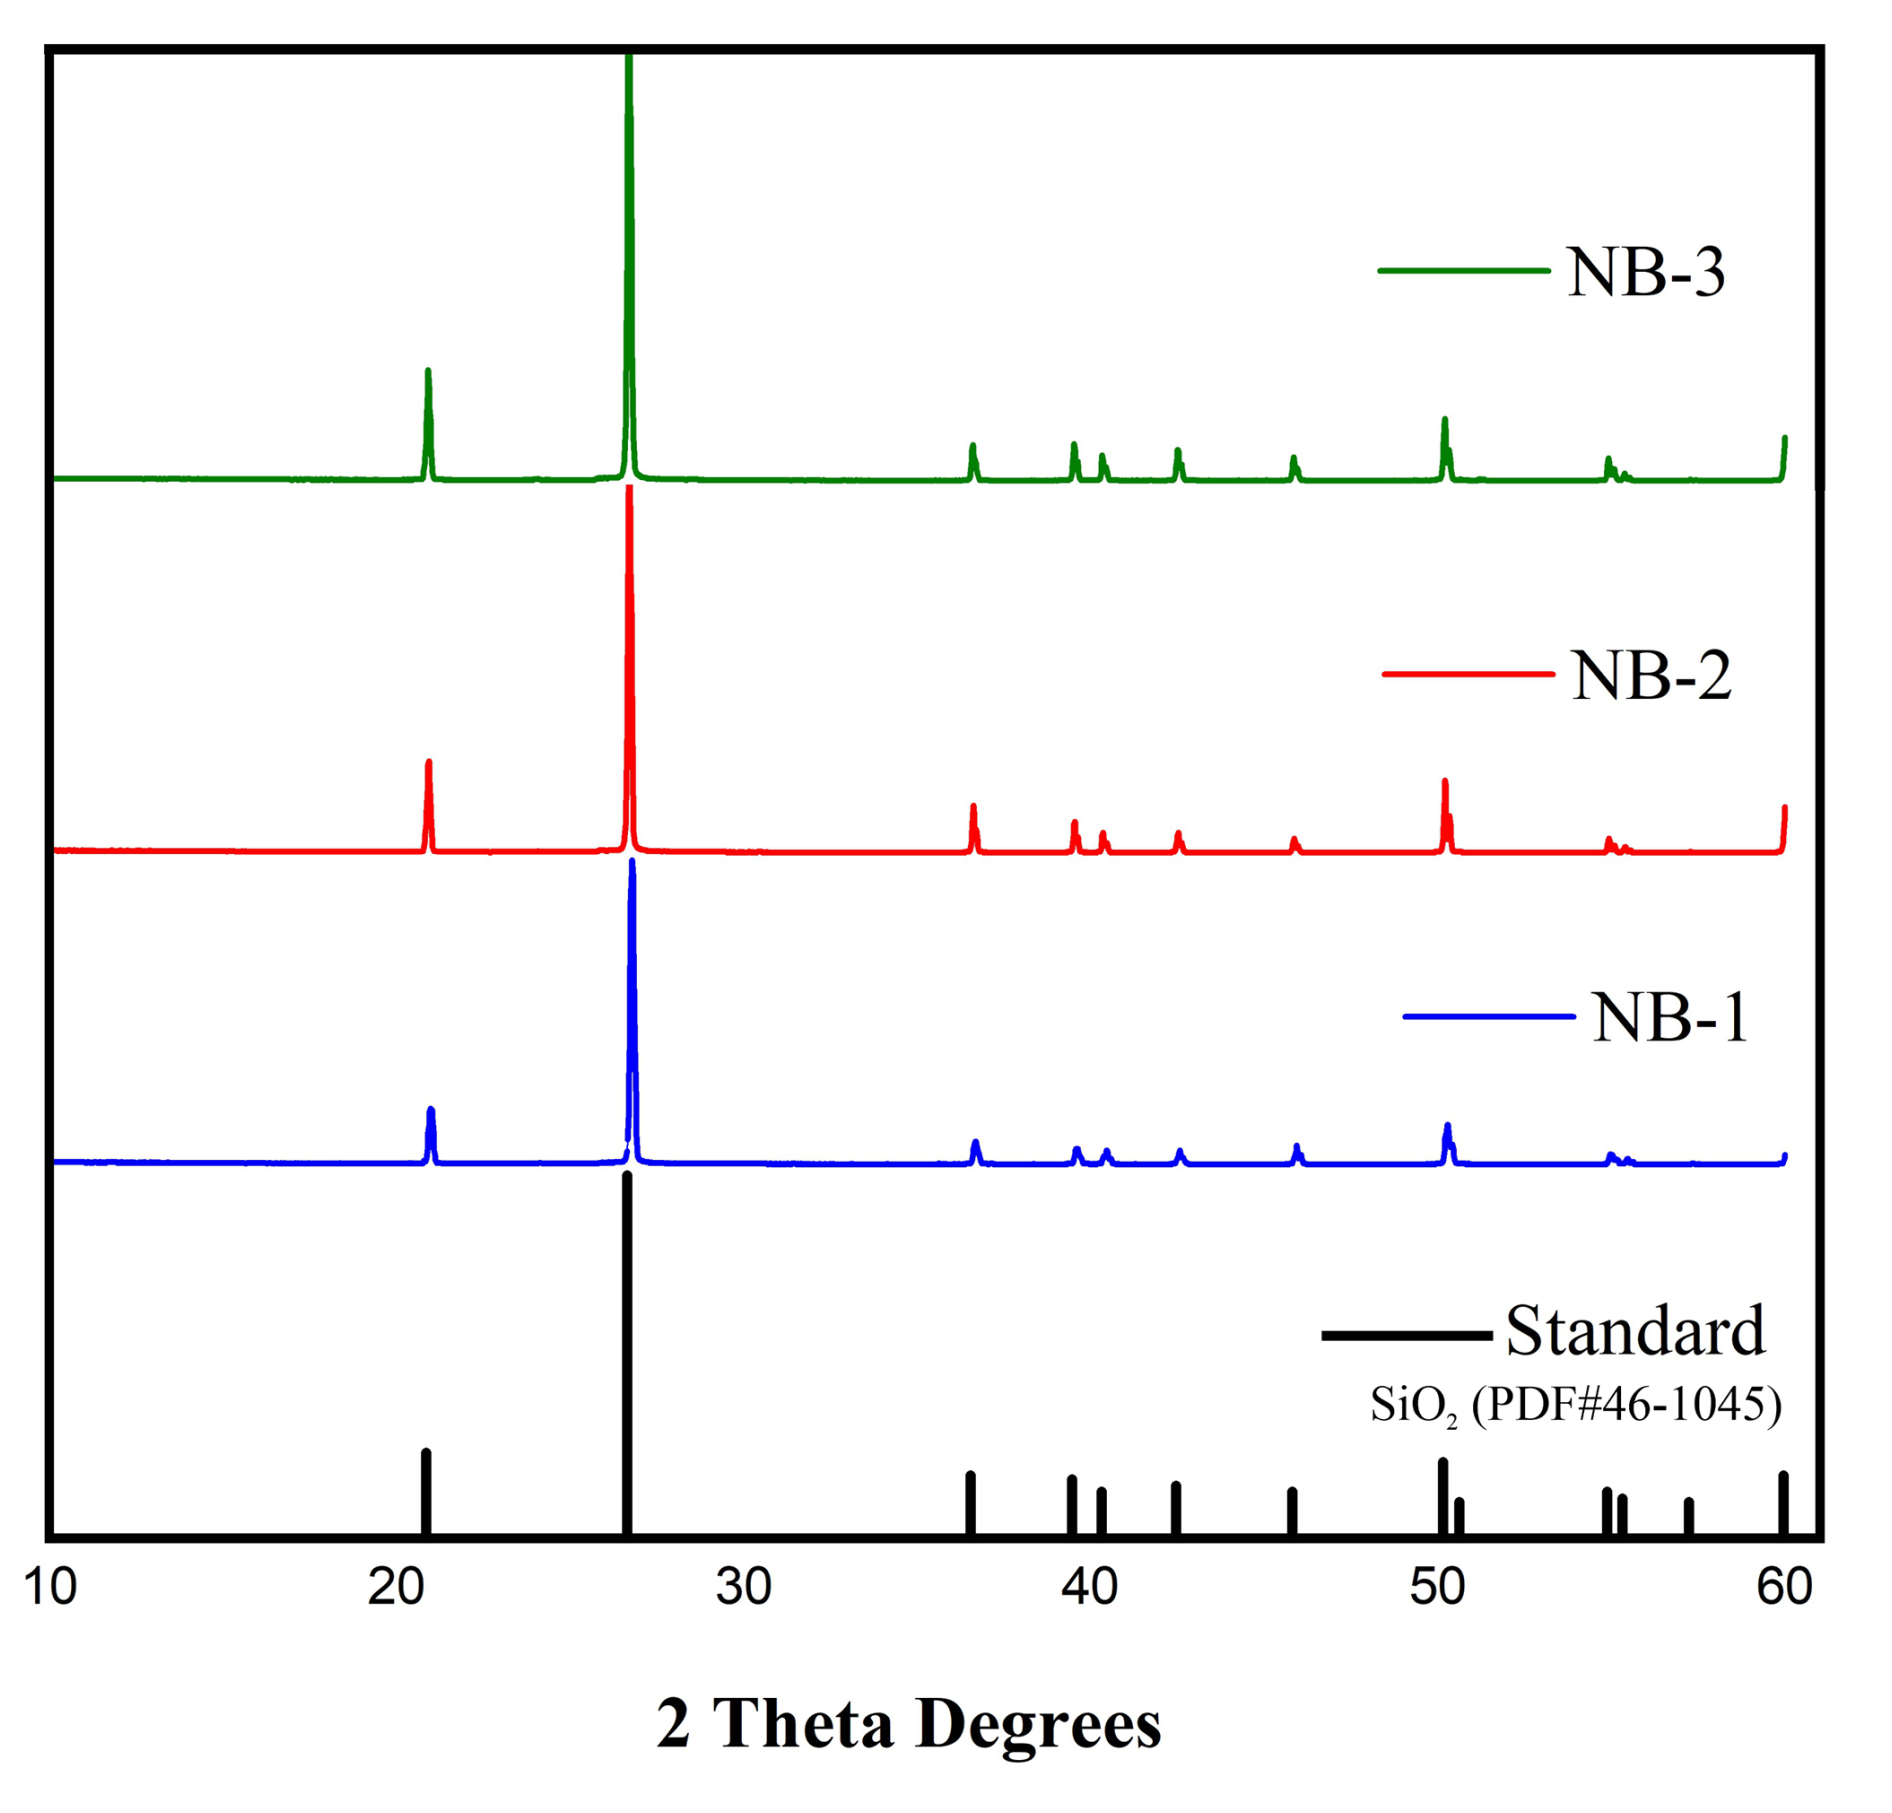
The X-ray diffraction (XRD) analysis of the quartz sample revealed a diffraction pattern consistent with that of the SiO2 reference powder file (PDF no. 46-1045) from the International Centre for Diffraction Data (ICDD). This confirms that all three treated quartz sands are purely composed of the quartz mineral phase (Fig. 8).
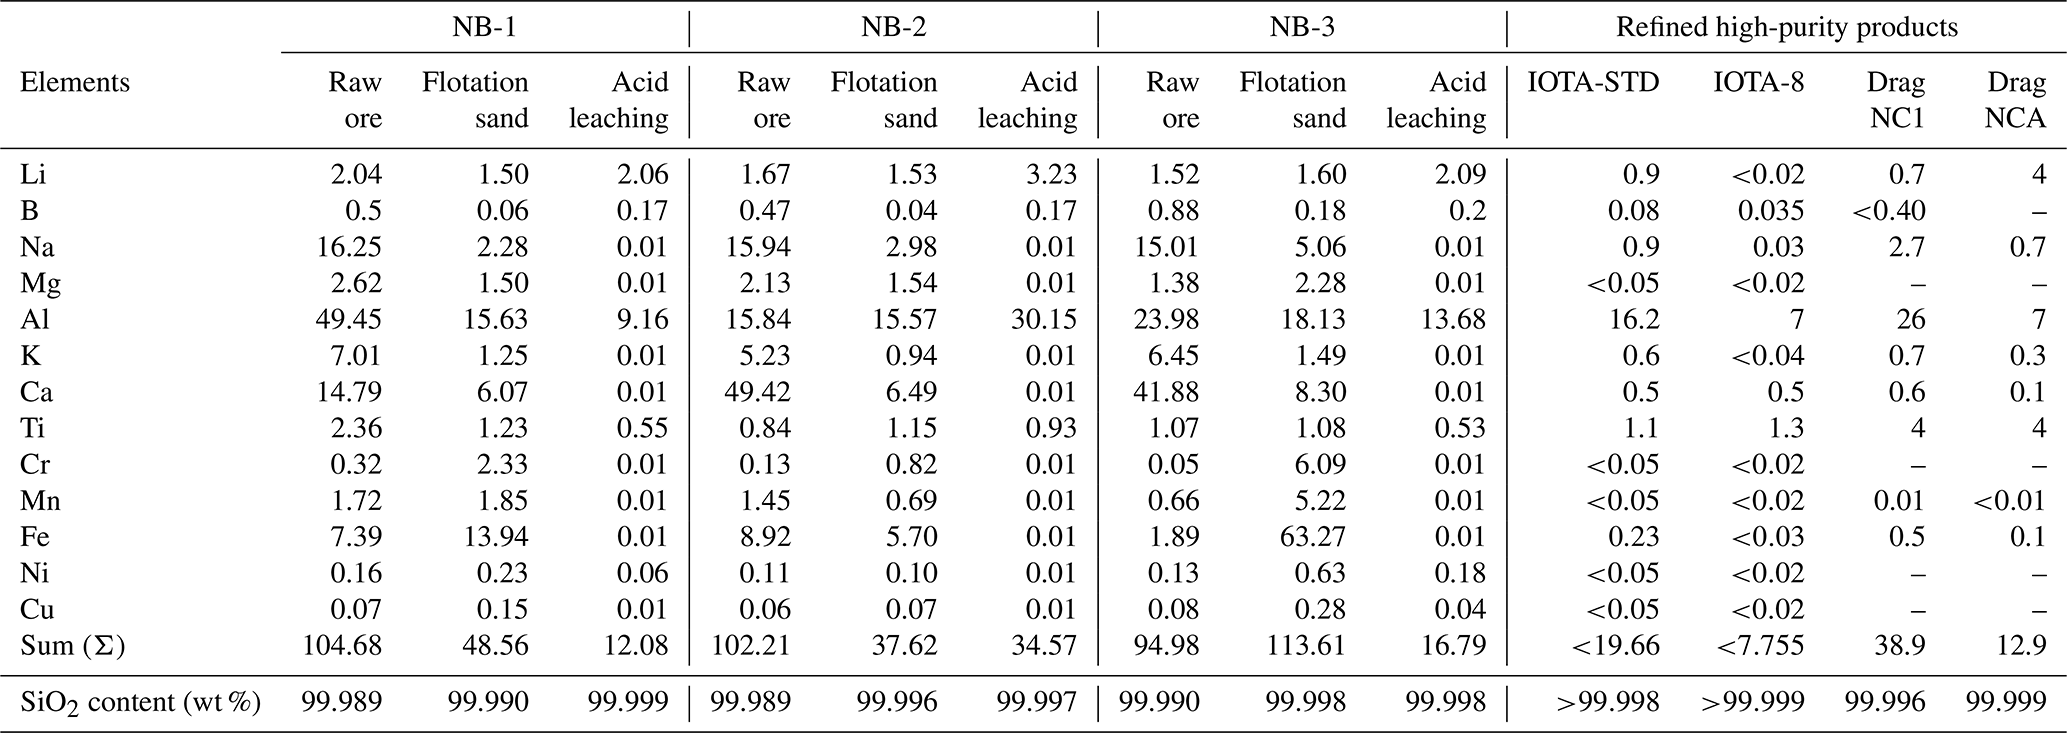
Table 1Concentrations of trace elements of raw and processed vein quartz samples (NB-1, NB-2, and NB-3) were determined using ICP-OES and ICP-MS analysis. The concentrations are presented in µg g−1.
SiO2 (wt %) = .
4.6 Chemical composition of raw ore and refined quartz sand
The SiO2 content and impurity levels in the raw quartz ore play a crucial role in determining its quality, purification potential, economic value, and possible uses. These factors significantly influence the overall value and applicability of the raw quartz material. The quality and purifying potential of quartz are influenced by the SiO2 and impurity levels in the raw ore, which ultimately defines the raw material ore's economic worth and future application sector. These elements have a major impact on the raw quartz material's overall value and suitability. According to the ICP-OES compositional analysis of the unprocessed ore quartz results presented in Table 1, the NB-1 sample contained 99.987 wt % SiO2; the main impurity elements are Li (2.04 µg g−1), Na (16.25 µg g−1), Mg (2.62 µg g−1), Al (49.45 µg g−1), Ca (14.79 µg g−1), Ti (2.36 µg g−1), and Fe (7.39 µg g−1); and the sum of the 13 impurity elements' content was 104.68 (µg g−1). In NB-2 the SiO2 content of the raw ore was 99.989 wt %; the main impurity contents are Li (1.67 µg g−1), Na (15.94 µg g−1), Mg (2.13 µg g−1), K (5.23 µg g−1), Ca (49.42 µg g−1), and Fe (8.92 µg g−1); and the total impurity content was 102.21 µg g−1. The NB-3 samples have an SiO2 content of 99.990 wt %; the main impurity elements are Li (1.52 µg g−1), Na (15.01 µg g−1), Mg (1.38 µg g−1), Al (23.98 µg g−1), K (6.45 µg g−1), and Ca (41.88 µg g−1); and the total impurity content was 94.98 µg g−1. The impurity element Al is relatively high in the NB-1 and NB-3 samples are due to lattice impurities. The high amounts of Na, Mg, K, and Ca may be due to fluid inclusions, and the iron oxide films on the surface may contribute to the high Fe content. The flotation purification results are presented in Table 1 and Fig. 9a. The SiO2 contents of NB-1, NB-2, and NB-3 are 99.990 wt %, 99.996 wt %, and 99.988 wt %, respectively, and the total amount of impurities in these three-vein quartz samples is shown in Fig. 9b and Table 1. After acid leaching purification, solution ICP-MS analysis was used to determine the amounts of trace elements in NB-1, NB-2, and NB-3, and the results are shown in Table 1. Quartz treated from the three veins showed notable differences in the total amount of elemental impurities. Following pre-treatment, physical purification, and chemical purification, the total impurity content in the refined quartz sand was within the limit, as described by Müller et al. (2012). The data in Table 1 clearly demonstrate the purification efficiency of trace elements in the processed quartz samples. The cumulative sum of analyzed components in these samples is consistently lower than 1000 µg g−1. The absence of grain size variations indicates that mineral inclusions resulting from milling have been mostly eliminated during processing. After purification, the impurity element sums in NB-1, NB-2, and NB-3 quartz sand samples are 12.08, 34.57, and 16.79 µg g−1, respectively (Fig. 9b). The SiO2 contents of the treated quartz sands were 99.999 wt %, 99.997 wt %, and 99.998 wt % (Fig. 9b). The primary impurities identified were Al and Li, with trace amounts of Ti. More detailed results on the impurity element contents are shown in Table 1, and the main impurity contents are illustrated in Fig. 9c.
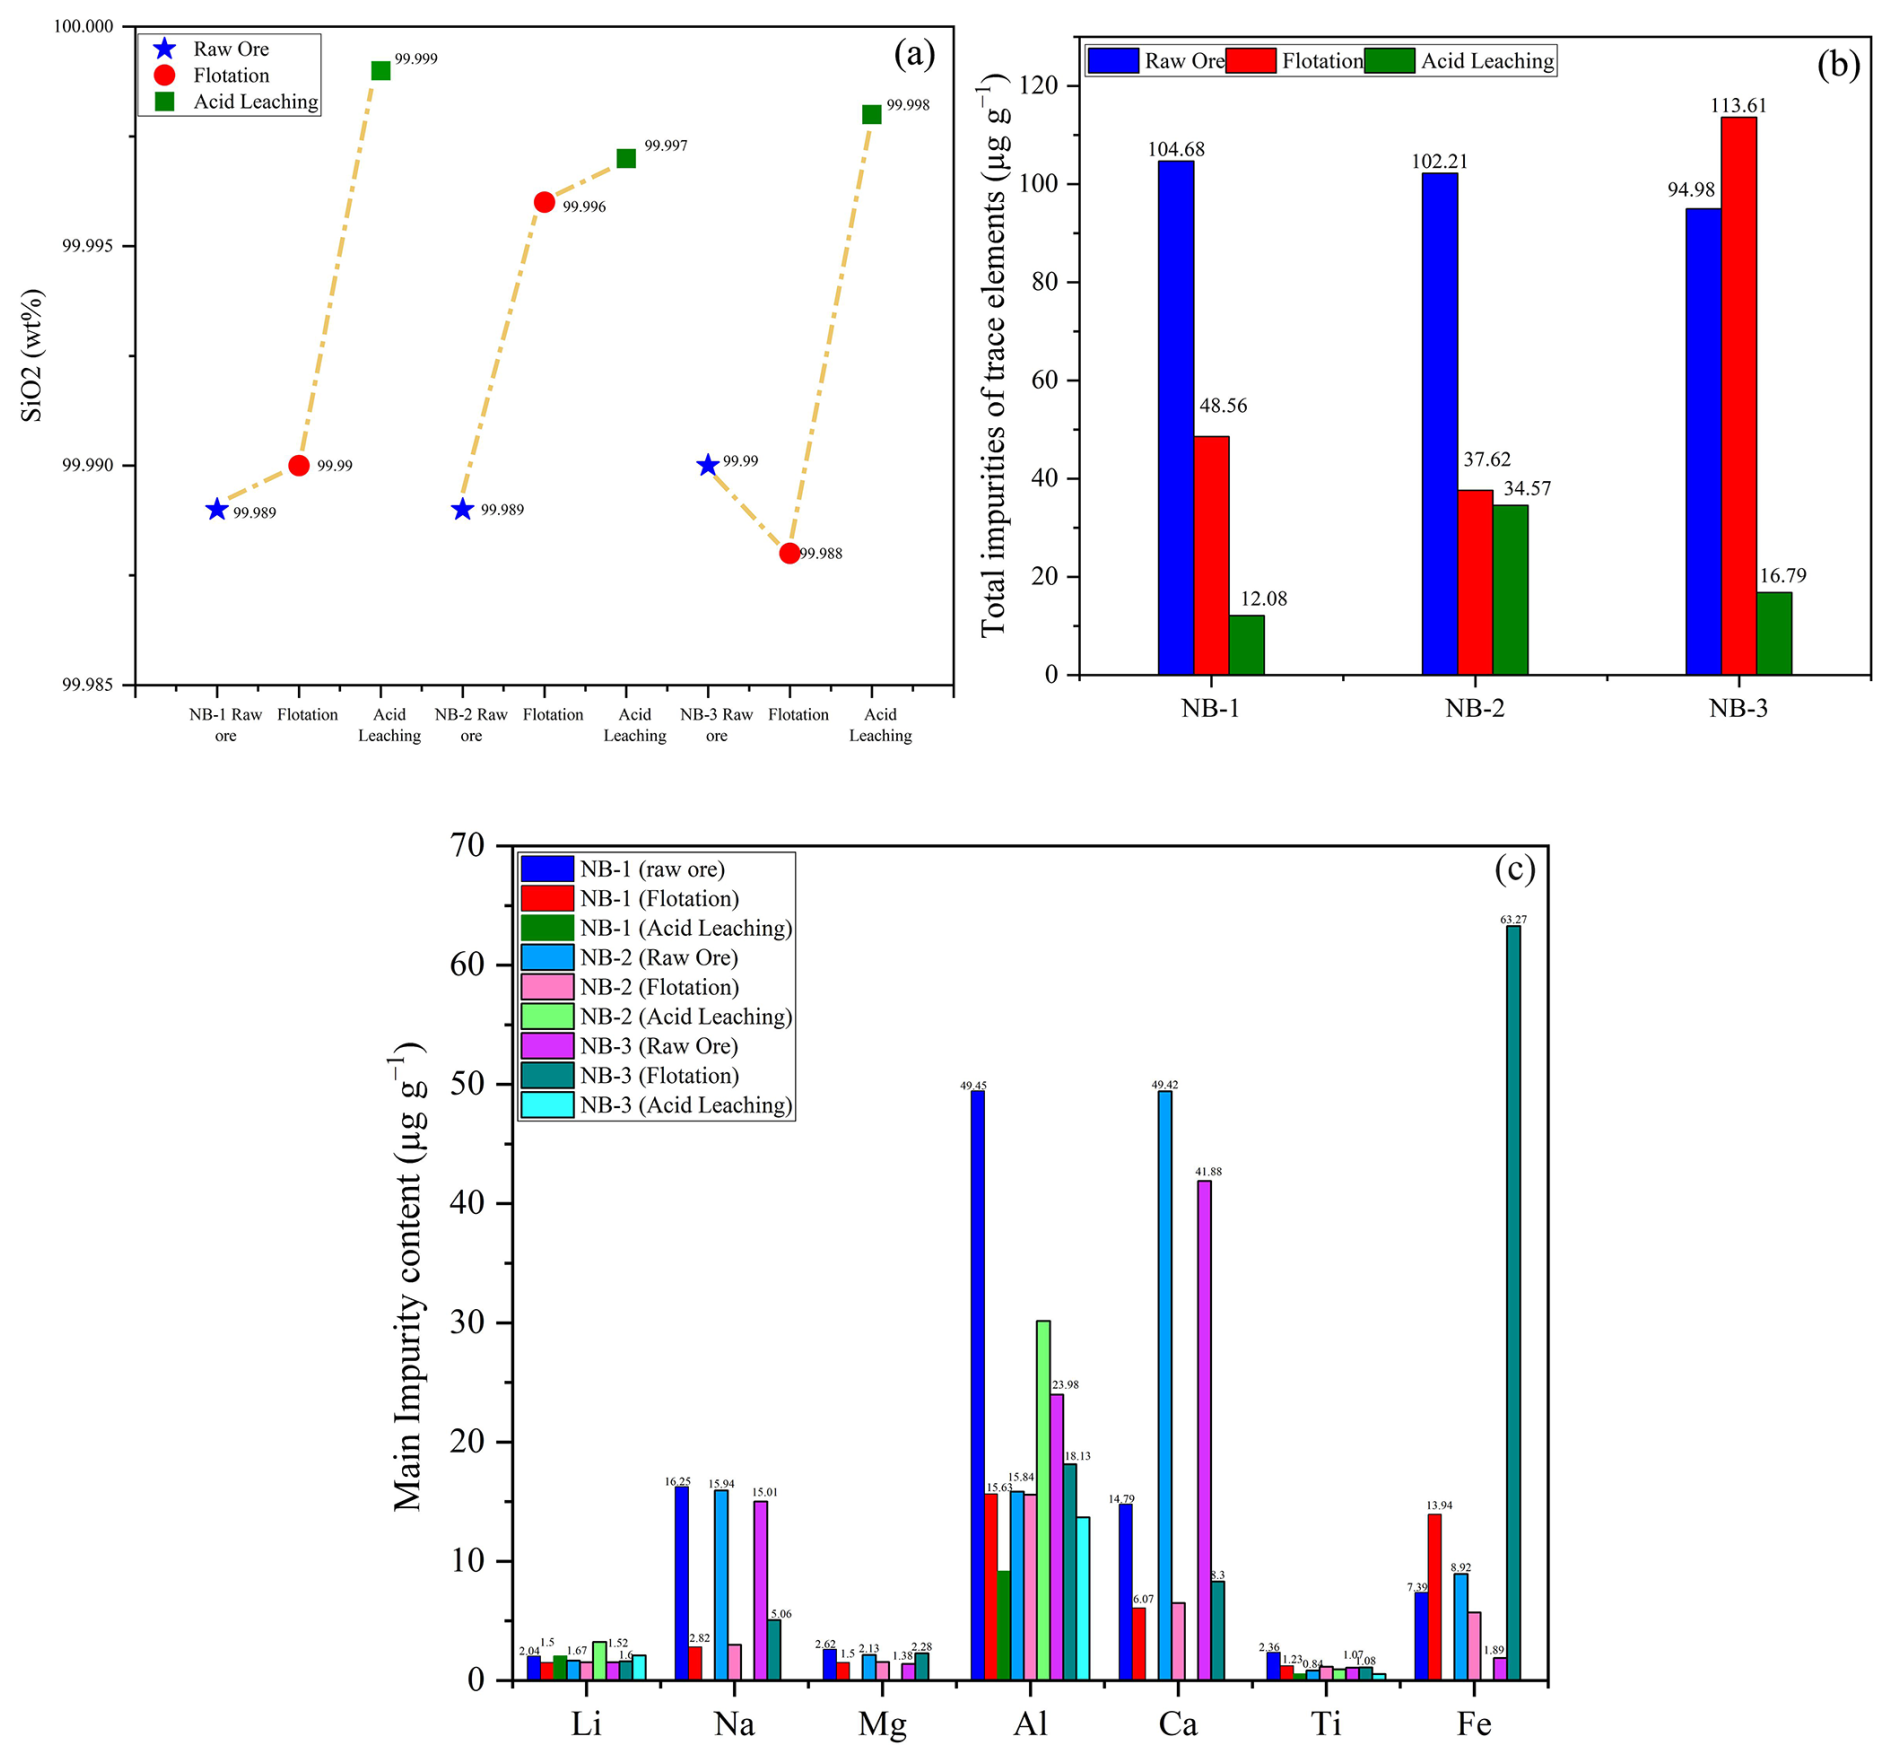
Figure 9The SiO2 and impurity element content in raw ore and after purifications (flotation and acid leaching). (a) The content of SiO2. (b) Total amount of the impurity element contents before and after purifications and (c) the main impurity element content.
A quartz sample from the NB-1 vein was analyzed and found to have the lowest concentration of trace elements among the studied deposits, indicating its high quality. The total impurity content in the processed 40–200 mesh fraction of NB-1 is 12.08 µg g−1 and is below the maximum allowable concentration for high-purity quartz (HPQ). The refined NB-1 sample shows relatively low levels of aluminum (9.16 µg g−1), titanium (0.55 µg g−1), and iron (0.01 µg g−1), with lithium at 2.06 µg g−1 (Fig. 9c). The concentrations of potassium, sodium, and calcium are less than the upper limits specified for HPQ by Müller, et al. (2012). Overall, the levels of Al, Ti, Li, Na, and Fe in this quartz are within acceptable HPQ standards. The total impurity content of 12.08 µg g−1 is notably lower than the HPQ maximum impurity limit of 50 µg g−1. The processed quartz sample from the NB-2 vein shows a somewhat high Al concentration (30.15 µg g−1) and a very low Fe concentration (0.01 µg g−1). The Li, Na, and Ti contents (3.23, 0.01, and 0.93 µg g−1, respectively) in the quartz are within the acceptable range for high-purity quartz. However, the Al content exceeded the HPQ requirements compared with the NB-1 and NB-3 samples. The total elemental content in NB-2 is up to 34.57 µg g−1, which meets the HPQ standards, as illustrated in Fig. 10 (Harben, 2002). The processed quartz sand of the NB-3 vein also had a lower impurity content of total trace elements than NB-2. The total impurity content sum in the processed sand is 16.79 µg g−1. Low concentrations of Al, Li, Ti, and Fe (13.68, 2.09, 0.53, and 0.01 µg g−1) are found in the refined quartz. Furthermore, the alkali and alkaline earth element concentrations of K, Na, and Ca are 0.01 µg g−1, which is within the upper content limits for high-purity quartz (HPQ) as described by Müller et al. (2012).
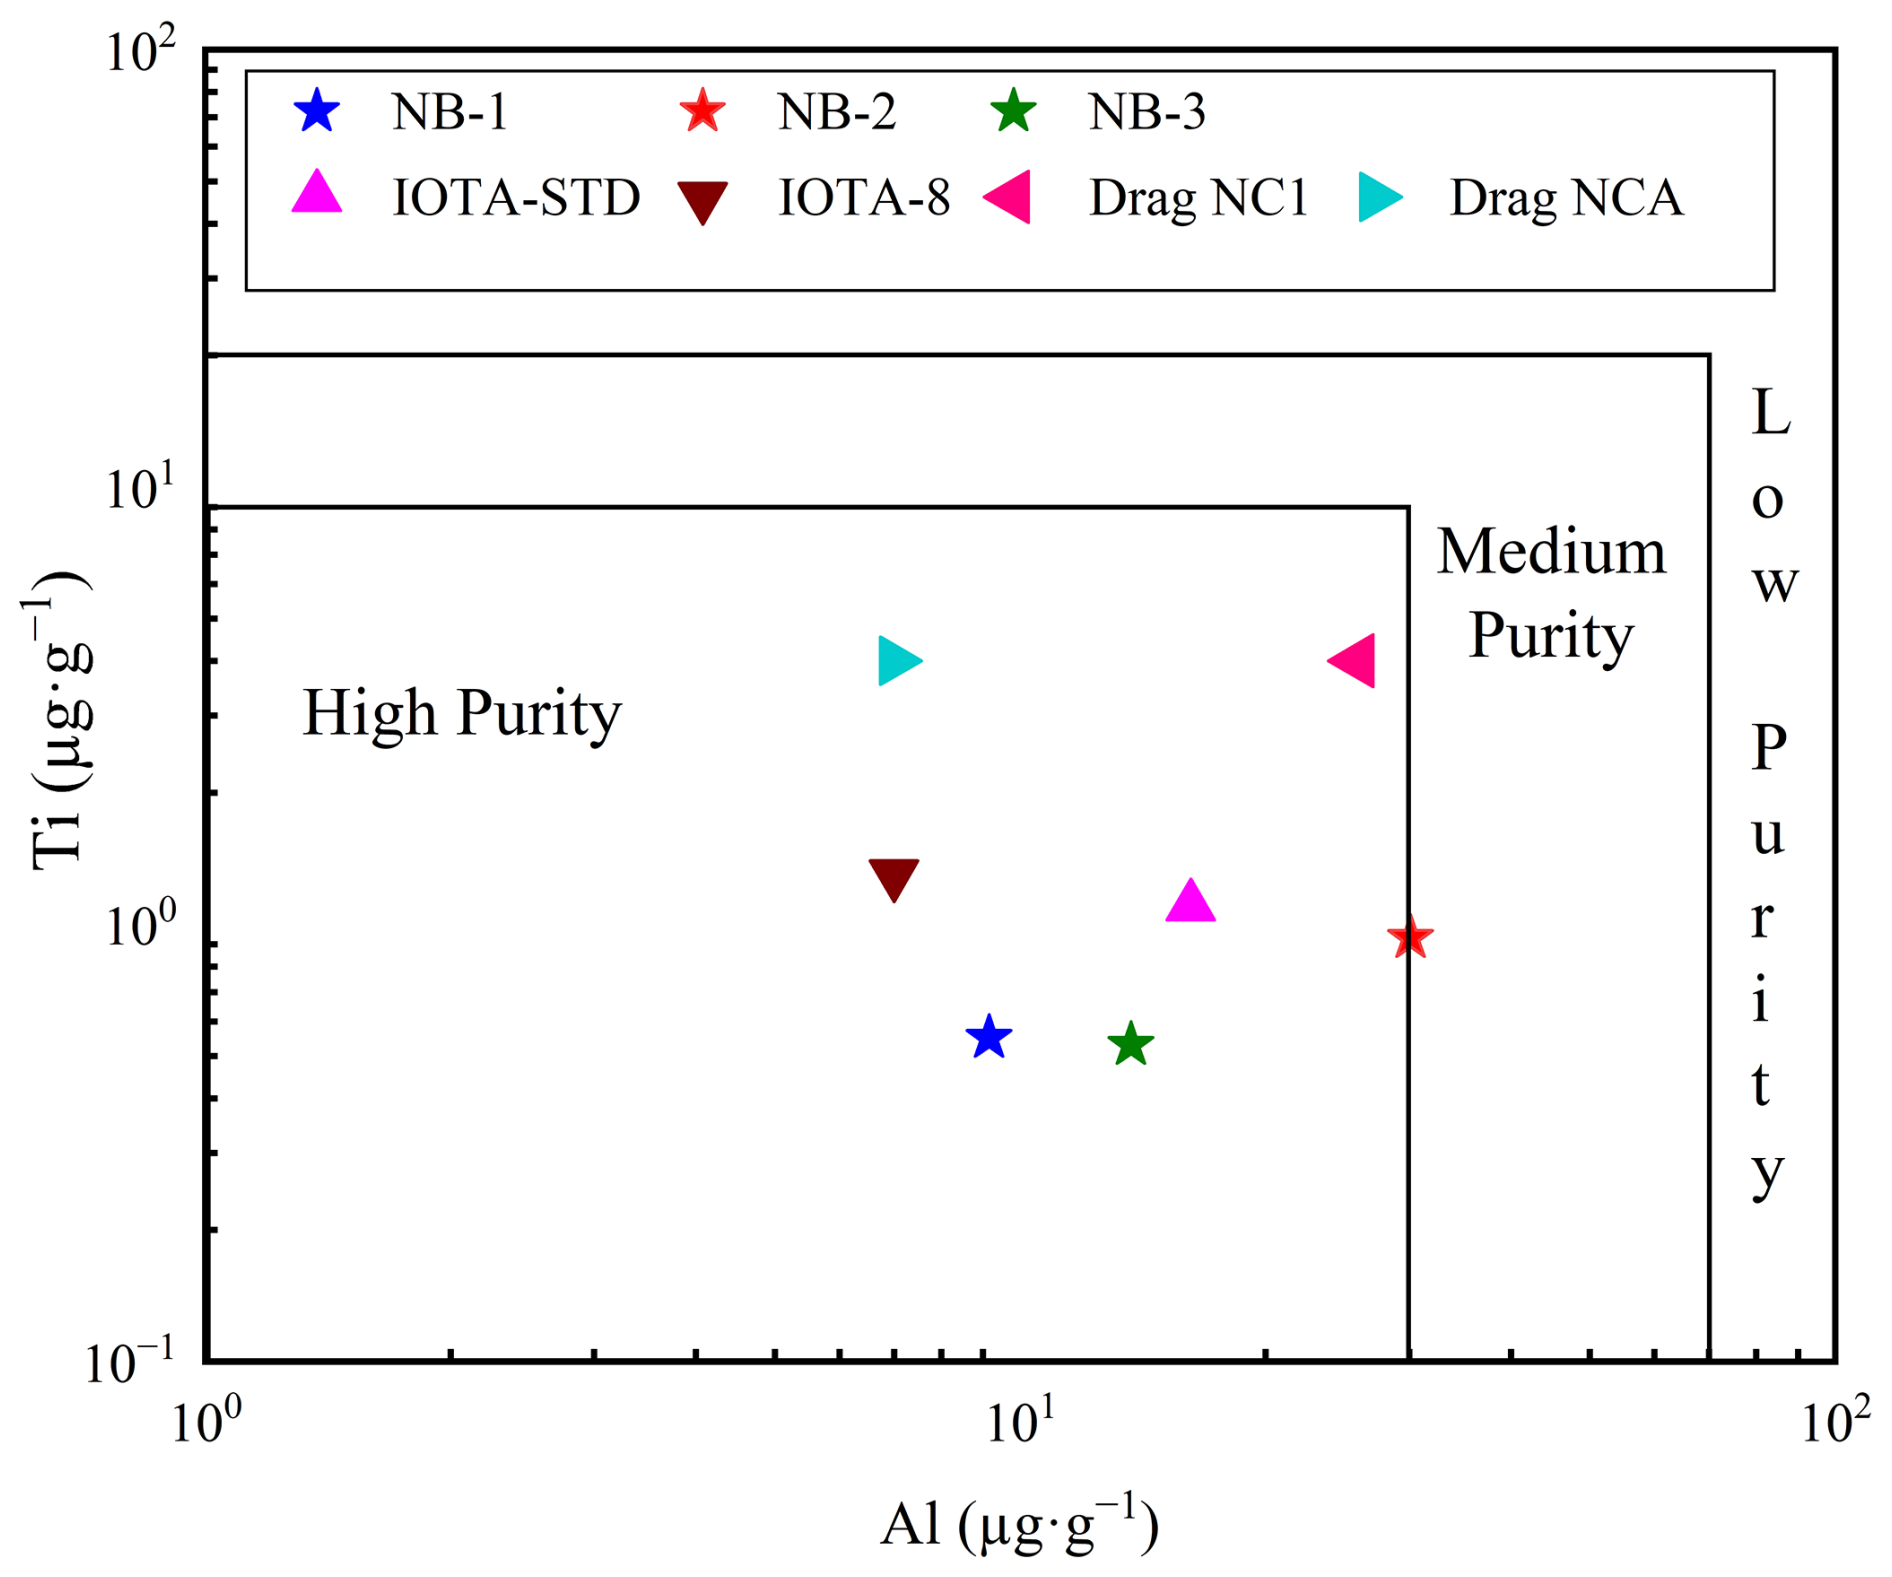
Figure 10Al vs. Ti plot of NB-1, NB-2, and NB-3 purified quartz sand and HPQ products (Müller et al., 2007). Quartz sand with Al < 30 µg g−1 and Ti < 10 µg g−1 is considered as HPQ.
The six essential impurity components influencing HPQ performance are Al, Ti, Ca, K, Na, and Li, as indicated in Table 1, which are based on an extensive analysis and investigation of pertinent standard data for crucibles carried out by prior companies, which were shown to have a substantial impact on the performance of high-purity quartz (HPQ) after a thorough evaluation and analysis of standard data for crucibles from prior companies. The refined quartz sand from NB-2 only reaches a purity of 99.997 % (4N7), but the SiO2 purity of the quartz sand generated from the NB-1 and NB-3 vein quartz is comparable to Unimin Corporation's IOTA-STD quartz products, reaching 99.999 wt % and 99.998 wt % (4N8 and 4N9), respectively (Wang, 2022). Furthermore, the NB-2 refined quartz sand has significantly higher levels of lattice impurities, particularly Al and Li, compared to Unimin Corporation's IOTA-STD products. Because these impurities cannot be removed through purification procedures, their application restricts their use as semiconductor crucible materials.
4.7 Economic evaluation of high-purity quartz
The primary goal of this study was to evaluate and characterize the potential of these three samples as HPQ resources in Pakistan. According to the standards set by Harben (1995) and Müller et al. (2012), there should be no more than 50 µg g−1 total impurities in high-purity quartz, with particular upper limits for every element. The main impurities in quartz include Al, Li, Ca, and Ti. When these impurities are integrated into the crystal lattice, they become difficult to eliminate during the processing of raw quartz, leading to high chemical purification costs. Consequently, Al and Ti are commonly used as indicators of quartz quality because they are the most common trace elements that can influence the physical and optical properties of quartz (Müller et al., 2007). Al impurities can lead to defects in the quartz lattice, whereas Ti influences color and transparency through the formation of color centers (Shah et al., 2022). Their concentrations are essential to assess the suitability of quartz for high-purity applications in electronics and optics.
Figure 10 shows the levels of Al and Ti in the processed quartz sand samples NB-1, NB-2, and NB-3 as well as in the premium quartz products made by Unimin Corporation in the USA (Iota STD and Iota 8) and Norwegian Crystallites in Norway (e.g., Drag NCA and Drag NC1) (Müller et al., 2007; Wang, 2022). The quality indicator trace element Al content is 16.20 µg g−1 and that for Ti is 1.10 µg g−1, which are the IOTA-STD (standard product) flagship products of Unimin Corporation in the United States. The Al content in the NB-1 and NB-3 samples (9.16 and 13.68 µg g−1) is relatively lower than the IOTA-STD and Drag NC1 products, whereas the Ti content of these three processed quartz sands is also lower than the IOTA-STD, IOTA-8, Drag NCA, and Drag NC1 products. Although NB-2 has a slightly higher Al content (30.15 µg g−1), the refined quartz sand still meets the quality requirements set by the IOTA standard and falls within the HPQ category (Fig. 10). NB-1 and NB-3 quartz have even lower Al levels than IOTA-STD, and their Ti and Al contents are comparable to those of the commercial powders. In contrast, the Al concentration of NB-2 was higher than that of IOTA-STD. Furthermore, the total impurity contents of these refined quartz samples are 12.08 µg g−1 for NB-1, 34.57 µg g−1 for NB-2, and 16.79 µg g−1 for NB-3. The presence of residual silicate melts and fluid inclusions could contribute to the Al, Ca, and Fe contents in the treated quartz sand samples. It is possible to further reduce impurity levels using advanced processing techniques such as radiation treatments (Belashev and Skamnitskaya, 2009), electrical fragmentation (Dal et al., 2011), and hot chlorination treatment (Haus et al., 2012; Lin et al., 2018). Additionally, oxidizing calcination is a useful method for removing non-metallic elements such as B and P because their oxidation states become unstable at higher temperatures (Lin et al., 2020). The total impurity content and SiO2 contents of NB-1 (99.999 wt %), NB-2 (99.997 wt %), and NB-3 (99.998 wt %) are shown in Table 1. Three quartz vein samples (NB-1, NB-2, and NB-3) were selected to represent variability within the quartz deposits of the Peshawar Basin. These samples were collected from different locations within the basin, based on preliminary geological surveys that identified areas with promising quartz vein occurrences. These were chosen to reflect the typical impurity profiles and mineralogical characteristics of the quartz veins in the region. We believe that these three samples are representative of the broader quartz ore resources in the Peshawar Basin and offer valuable insights into the potential for producing high-purity quartz. As a result, these quartz samples are considered high-purity and capable of producing high-end products (Wang, 2022), possibly providing future HPQ resource materials.
The present research analyzed the trace element composition of three vein quartz samples from Pakistan. These samples underwent petrographic examination and were assessed for impurity element postprocessing. The primary conclusions derived from this study are as follows.
Petrographic analysis revealed that the main impurities in quartz found in NB-1, NB-2, and NB-3 consisted of fluid inclusions, most of which were concentrated along the microstructures. The purified quartz sand had a smooth surface and contained a particularly low amount of gas–liquid inclusions.
The SiO2 contents of quartz sand from the purification processes, including pre-treatment, physical treatment, and chemical treatment of NB-1, NB-2, and NB-3, were 99.999 wt %, 99.997 wt %, and 99.998 wt %, respectively; the purity of SiO2 reaches the 4N7–4N9 high-purity quartz material series, and the residual impurity elements Li and Al are mainly lattice impurity elements, which are challenging to remove through purification. The sum of total trace element content in NB-1 is 12.08 µg g−1, that in NB-2 is 34.57 µg g−1, and that in NB-3 is 16.79 µg g−1. As a result, these refined quartz sands meet the requirements for their industrial application in the production of crucibles, and vein quartz can be used to produce high-end, high-purity quartz products.
All data derived from this research are presented in Figs. 1, 2, 3, 4, 5, 6, 7, 8, 9, and 10 and Table 1.
IK: conceptualization, methodology, and writing (original draft preparation). XY: supervision, methodology, review and editing, and funding acquisition. MX: conceptualization, writing (review and editing), formal analysis, and investigation. ZH: formal analysis and investigation.
The contact author has declared that none of the authors has any competing interests.
Publisher's note: Copernicus Publications remains neutral with regard to jurisdictional claims made in the text, published maps, institutional affiliations, or any other geographical representation in this paper. While Copernicus Publications makes every effort to include appropriate place names, the final responsibility lies with the authors.
We are grateful to Shao-yi-qing Qu, Jamuna Thapa Magar, Li-ting Sun and Yue Qiu for their help with purification experiments.
This study has been financially supported by grants from the National Key Research and Development Program on Strategic Mineral Resources Development and Utilization (grant no. 2024YFC2910101), Strategic Priority Research Program (Category A) of the Chinese Academy of Sciences (grant no. XDA0430301), and the National Natural Science Foundation of China (grant nos. 42230801 and 42030801).
This paper was edited by Alessio Langella and reviewed by Xinsong Wang and Shen Gao.
Ahmad, I., Khan, S., Lapen, T., Burke, K., and Jehan, N.: Isotopic ages for alkaline igneous rocks, including a 26 Ma ignimbrite, from the Peshawar plain of Northern Pakistan and their tectonic implications, J. Asian Earth Sci., 62, 414–424, https://doi.org/10.1016/j.jseaes.2012.10.025, 2013.
Aldabe, J., Santamaría, C., Elustondo, D., Lasheras, E., and Santamaría, J. M.: Application of microwave digestion and ICP-MS to simultaneous analysis of major and trace elements in aerosol samples collected on quartz filters, Analytical Methods, 5, 554–559, 2013.
Al-Maghrabi, M. N. H.: Improvement of low-grade silica sand deposits in Jeddah area, Journal of King Abdulaziz University: Engineering Sciences, 15, 113–128, 2004.
Ashraf, M. and Chaudary, M. N.: A discovery of carbonatite from Malakand, Geological Bulletin of Punjab University, 14, 91–94, 1977.
Belashev, B. Z. and Skamnitskaya, L. S.: Irradiation methods for removal of fluid inclusions from minerals, Materials and Geoenvironment, 56, 138–147, 2009.
Bibi, M., Wagreich, M., Iqbal, S., and Jan, I. U.: Regional sediment sources versus the Indus River system: The Plio-Pleistocene of the Peshawar basin (NW-Pakistan), Sediment. Geol., 389, 26–41, https://doi.org/10.1016/j.sedgeo.2019.05.010, 2019.
Blankenburg, H. J., Götze, J., and Schulz, H.: Quarzrohstoffe: mit 80 Tabellen, Deutscher Verlag für Grundstof-Findustrie: Leipzig-Stuttgart, Germany, 296 pp., ISBN 3342005432, 9783342005438, 1994.
Butt, K. A. and Shah, Z.: Discovery of blue beryl from Ilum granite and its implications on the genesis of emerald mineralization in Swat district, Geological Bulletin University of Peshawar, 18, 75–81, 1985.
Chen, L. H., Li, Q., and Jiang, T.: Comprehensive utilization of tailings in quartz vein-hosted gold deposits, Minerals, 12, 1481, https://doi.org/10.3390/min12121481, 2022.
Chen, S., Wang, X., Niu, Y., Sun, P., Duan, M., Xiao, Y., and Xue, Q.: Simple and cost-effective methods for precise analysis of trace element abundances in geological materials with ICP-MS, Sci. Bull., 62, 277–289, 2017.
Cornwell, K.: Quaternary break-out flood sediments in the Peshawar Basin of Northern Pakistan, Geomorphology, 25, 225–248, https://doi.org/10.1016/S0169-555X(98)00061-0, 1998.
Dal, M. E., Tranell, G., Gaal, S., Raaness, O. S., Tang, K., and Arnberg, L.: Study of pellets and lumps as raw materials in silicon production from quartz and silicon carbide, Metall. Mater. Trans. B, 42, 939–950, https://doi.org/10.1007/s11663-011-9529-y, 2011.
Demir, C., Gülgonul, I., Bentli, I., and Çelik, M. S.: Differential separation of albite from microcline by monovalent salts in HF medium, Mining, Metallurgy & Exploration, 20, 120–124, https://doi.org/10.1007/BF03403143, 2003.
Ding, Y. Z., Lu, J. W., and Yin, W. Z.: Research on purifying low-grade quartz ore by flotation, Metal Mine, 5, 84–87, 2009.
Du, F., Li, J., Li, X., and Zhang, Z.: Improvement of iron removal from silica sand using ultrasound-assisted oxalic acid, Ultrason. Sonochem., 18, 389–393, https://doi.org/10.1016/j.ultsonch.2010.07.006, 2011.
Englert, A. H., Rodrigues, R. T., and Rubio, J.: Dissolved air flotation (DAF) of fine quartz particles using an amine as collector, Int. J. Miner. Process., 90, 27–34, https://doi.org/10.1016/j.minpro.2008.10.001, 2009.
Frezzotti, M. L.: Silicate-melt inclusions in magmatic rocks: applications to petrology, Lithos, 55, 273–299, https://doi.org/10.1016/S0024-4937(00)00048-7, 2001.
Gemeinert, M., Gaber, M., Hager, I., Willfahrt, M., and Bortschuloun, D.: On correlation of gas-liquid-inclusion's properties and melting behaviour of different genetic quartzes for production of transparent fused silica, Neues Jahrbuch für Mineralogie. Abhandlungen, 165, 19–27, 1992.
Götze, J.: Chemistry, textures and physical properties of quartz—geological interpretation and technical application, Mineral. Mag., 73, 645–671, https://doi.org/10.1180/minmag.2009.073.4.645, 2009.
Götze, J.: Mineralogy, geochemistry and cathodoluminescence of authigenic quartz from different sedimentary rocks. Quartz: Deposits, Mineralogy and Analytics, Springer Berlin Heidelberg, Germany, 287–306, ISSBN 978-3-642-22160-6, 2012.
Götze, J., Plötze, M., Graupner, T., Hallbauer, D. K., and Bray, C. J.: Trace element incorporation into quartz: a combined study by ICP-MS, electron spin resonance, cathodoluminescence, capillary ion analysis, and gas chromatography, Geochim. Cosmochim. Ac., 68, 3741–3759, https://doi.org/10.1016/j.gca.2004.01.003, 2004.
Götze, J., Pan, Y., and Müller, A.: Mineralogy and mineral chemistry of quartz: A review, Mineral. Mag., 85, 639–664, https://doi.org/10.1180/mgm.2021.72, 2021.
Harben, P. W.: The industrial minerals handy book: A guide to markets, specifications, & prices, 2nd edn., Industrial Minerals Division, Metal Bulletin, UK, 296 pp., http://pascal-francis.inist.fr/vibad/index.php?action=getRecordDetail&idt=6190195 (last access: 15 December 2024), 1995.
Harben, P. W.: The industrial mineral handy book: A guide to markets, specifications and prices, 4th edn., Industrial Mineral Information, Worcester Park, UK, 412 pp., ISBN 1904333044, 9781904333043, 2002.
Haus, R.: Processing: high demands on high purity, Industrial Minerals, 457, 62–69, 2005.
Haus, R., Prinz, S., and Priess, C.: Assessment of high purity quartz resources. Quartz: Deposits, Mineralogy and Analytics, Springer Berlin Heidelberg, Germany, 29–51, https://doi.org/10.1007/978-3-642-22161-3, 2012.
Jiang, X., Chen, J., Ban, B., Song, W., Chen, C., and Yang, X.: Application of competitive adsorption of ethylenediamine and polyetheramine in direct float of quartz from quartz-feldspar mixed minerals under neutral pH conditions, Miner. Eng., 188, 107850, https://doi.org/10.1016/j.mineng.2022.107850, 2022.
Kazmi, A. H. and Jan, M. Q.: Geology and tectonics of Pakistan, Graphic Publishers, Karachi, 528 pp., ISBN 969-8375-00-7, 1997.
Kempe, D. R. C.: The petrology of the Warsak alkaline granites, Pakistan, and their relationship to other alkaline rocks of the region, Geol. Mag., 110, 385–404, https://doi.org/10.1017/S0016756800036189, 1973.
Kempe, D. R. C. and Jan, M. Q.: An alkaline igneous province in the North-West Frontier province, West Pakistan, Geol. Mag., 107, 395–398, https://doi.org/10.1017/S0016756800056260, 1970.
Kempe, D. R. C. and Jan, M. Q.: The Peshawar plain alkaline igneous province, NW Pakistan, Special Issue, Geological Bulletin University of Peshawar, 13, 71–78, 1980.
Kitamura, R., Pilon, L., and Jonasz, M.: Optical constants of silica glass from extreme ultraviolet to far infrared at near room temperature, Appl. Optics, 46, 8118–8133, https://doi.org/10.1364/AO.46.008118, 2007.
Kohobhange, S. P. K., Manoratne, C. H., Pitawala, H. M. T. G. A., and Rajapakse, R. M. G.: The effect of prolonged milling time on comminution of quartz, Powder Technol., 330, 266274, https://doi.org/10.1016/j.powtec.2018.02.033, 2018.
Larsen, E. and Kleiv, R. A.: Flotation of quartz from quartz-feldspar mixtures by the HF method, Miner. Eng., 98, 49–51, https://doi.org/10.1016/j.mineng.2016.07.021, 2016.
Li, F., Jiang, X., Zuo, Q., Li, J., Ban, B., and Chen, J.: Purification mechanism of quartz sand by combination of microwave heating and ultrasound assisted acid leaching treatment, Silicon, 13, 531–541, https://doi.org/10.1007/s12633-020-00457-7, 2021.
Liang, Q., Jing, H., and Gregoire, D. C.: Determination of trace elements in granites by inductively coupled plasma mass spectrometry, Talanta, 51, 507–513, 2000.
Lin, M., Pei, Z., Li, Y., Liu, Y., Wei, Z., and Lei, S.: Separation mechanism of lattice-bound trace elements from quartz by KCl-doping calcination and pressure leaching, Miner. Eng., 125, 42–49, https://doi.org/10.1016/j.mineng.2018.05.029, 2018.
Lin, M., Liu, Z., Wei, Y., Liu, B., Meng, Y., Qiu, H., Lei, S., Zhang, X., and Li, Y.: A critical review on the mineralogy and processing for high-grade quartz, Mining, Metallurgy & Exploration, 37, 1627–1639, https://doi.org/10.1007/s42461-020-00247-0, 2020.
Moore, P.: High-purity quartz, Industrial Minerals, 455, 53–57, 2005.
Müller, A., Ihlen, P. M., Wanvik, J. E., and Flem, B.: High-purity quartz mineralization in kyanite quartzites, Norway, Miner. Deposita, 42, 523–535, https://doi.org/10.1007/s00126-007-0124-8, 2007.
Müller, A., Wanvik, J. E., and Ihlen, P. M.: Petrological and chemical characterisation of high-purity quartz deposits with examples from Norway. Quartz: Deposits, Mineralogy and Analytics, Springer Berlin Heidelberg, Germany, 71–118, https://doi.org/10.1007/978-3-642-22161-3_4, 2012.
Pan, X., Li, S., Li, Y., Guo, P., Zhao, X., and Cai, Y.: Resource, characteristic, purification and application of quartz: a review, Miner. Eng., 183, 107600, https://doi.org/10.1016/j.mineng.2022.107600, 2022.
Passchier, C. W. and Trouw, R. A.: Microtectonics, Springer Science & Business Media, Verlag, Berlin, 366, https://doi.org/10.1007/3-540-29359-0, 2005.
Peçanha, E. R., de Albuquerque, M. D., Simão, R. A., de Salles, L. F. L., and de Mello, M. M. B.: Interaction forces between colloidal starch and quartz and hematite particles in mineral flotation, Colloid. Surface. A, 562, 79–85, https://doi.org/10.1016/j.colsurfa.2018.11.026, 2019.
Pogue, K. R., Wardlaw, B. R., Harris, A. G., and Hussain, A.: Paleozoic and Mesozoic stratigraphy of the Peshawar basin, Pakistan: Correlations and implications, Geol. Soc. Am. Bull., 104, 915–927, https://doi.org/10.1130/0016-7606(1992)104<0915:PAMSOT>2.3.CO;2, 1992.
Sajid, M., Arif, M., and Shah, M. T.: Petrogenesis of granites from the Utla area of Gadoon, north-west Pakistan: Implications from petrography and geochemistry, J. Earth Sci., 25, 445–459, https://doi.org/10.1007/s12583-014-0435-5, 2014.
Shah, S. A., Shao, Y., Zhang, Y., Zhao, H., and Zhao, L.: Texture and Trace Element Geochemistry of Quartz: A Review, Minerals, 12, 1042, https://doi.org/10.3390/min12081042, 2022.
Shams, F. A.: The geology of the Mansehra-Amb state area, northern West Pakistan, Geological Bulletin of Punjab University, Lahore Pakistan, 8, https://pu.edu.pk/images/journal/geology/pdf/1971-8.pdf (last access: 3 March 2025), 1969.
Shimoiizaka, J., Nakatsuka, K., and Katayanagi, T.: Separation of feldspar from quartz by a new flotation process, World Mining and Metals Technology, Port City Press Baltimore, New York, 1, 423–438,https://onetunnel.org/documents/separation-of-feldspar-from-quartz-by-a-new-flotation-process (last access: 25 December 2024), 1976.
Su, Y., Zhou, Y., Huang, W., and Gu, Z.: Study on reaction kinetics between silica glasses and hydrofluoric acid, Journal Chinese Ceramic Society, 32, 287–293, https://doi.org/10.3321/j.issn:0454-5648.2004.03.016, 2004.
Tuncuk, A. and Akcil, A.: Iron removal in production of purified quartz by hydrometallurgical process, Int. J. Miner. Process., 153, 44–50, https://doi.org/10.1016/j.minpro.2016.05.021, 2016.
Vatalis, K., Charalampides, G., Platias, S., and Benetis, N. P.: Market developments and industrial innovative applications of high-purity quartz refines, Proc. Econ. Financ., 14, 624–633, https://doi.org/10.1016/S2212-5671(15)00688-7, 2014.
Wang, J. Y.: Global high purity quartz deposits: Resources distribution and exploitation status, Acta Petrologica et Mineralogica, 40, 131–141, https://doi.org/10.3969/j.issn.1000-6524.2021.01.012, 2021.
Wang, L.: Concept of high purity quartz and classification of its raw materials, Conservation and Utilization of Mineral Resources, 42, 55–63, https://doi.org/10.13779/j.cnki.issn1001-0076.2022.05.009, 2022.
Webster, J. D.: Melt inclusions in plutonic rocks. Mineralogical Association of Canada, Short Course Series, 36, Montreal, Canada, 248 pp., https://doi.org/10.2113/gsecongeo.101.6.1313, 2006.
Xia, M., Sun, C., Yang, X., and Chen, J.: Assessment of Gold-Bearing Quartz Vein as a Potential High-Purity Quartz Resource: Evidence from Mineralogy, Geochemistry, and Technological Purification, Minerals, 13, 261, https://doi.org/10.3390/min13020261, 2023.
Xia, M., Yang, X., and Hou, Z.: Preparation of high-purity quartz sand by vein quartz purification and characteristics: A case study of Pakistan vein quartz, Minerals, 14, 727, https://doi.org/10.3390/min14070727, 2024.
Xie, Y., Xia, M., Yang, X., Khan, I., and Hou, Z.: Research on 4N8 High-Purity Quartz Purification Technology Prepared Using Vein Quartz from Pakistan, Minerals, 14, 1049, https://doi.org/10.3390/min14101049, 2024.
Yang, C., Li, S., Yang, R., Bai, J., and Guo, Z.: Recovery of silicon powder from kerf loss slurry waste using superconducting high gradient magnetic separation technology, J. Mater. Cycles Waste, 20, 937–945, https://doi.org/10.1007/s10163-017-0656-7, 2017.
Yang, L., Li, X., Li, W., Yan, X., and Zhang H.: Intensification of interfacial adsorption of dodecylamine onto quartz by ultrasonic method, Sep. Purif. Technol., 227, 115701, https://doi.org/10.1016/j.apsusc.2019.145012, 2019.
Yang, L., Li, W., Li, X., Yan, X., and Zhang, H.: Effect of the turbulent flow pattern on the interaction between dodecylamine and quartz, Appl. Surf. Sci., 507, 145012, https://doi.org/10.1016/j.apsusc.2019.145012, 2020.
Yin, W., Wang, D., Drelich, J., Yang, B., Li, D., Zhu, Z., and Yao, J.: Reverse flotation separation of hematite from quartz assisted with magnetic seeding aggregation, Miner. Eng., 139, 105873, https://doi.org/10.1016/j.mineng.2019.105873, 2019.
Zhang, R., Tang, C., Ni, W., Yuan, J., Zhou, Y., and Liu, X.: Research status and challenges of high-purity quartz processing technology from a mineralogical perspective in China, Minerals, 13, 1505, https://doi.org/10.3390/min13121505, 2023.
Zhang, W., Hu, Z., Liu, Y., Chen, L., Chen, H., Li, M., and Gao, S.: Reassessment of decomposition capability in the high-pressure digestion of felsic rocks for multi-element determination by ICP-MS, Geostandard. Geoanal. Res., 36, 271–289, 2012.
Zhong, L. L., Lei, S. M., Wang, E. W., Pei, Z. Y., Li, L., and Yang, Y. Y.: Research on removal impurities from vein quartz sand with complexing agents, Appl. Mech. Mater., 454, 194–199, https://doi.org/10.4028/www.scientific.net/AMM.454.194, 2014.
Zhong, T., Yu, W., Shen, C., and Wu, X.: Research on preparation and characterisation of high-purity silica sands by purification of quartz vein ore from Dabie mountain, Silicon, 14, 4723–4729, https://doi.org/10.1007/s12633-021-01217-x, 2021.
Zhu, Y. B., Peng, Y. J., and Gao, H. M.: Research on mineral processing of coastal quartz sand mine, Journal of Wuhan Polytechnic University, 21, 37–39, 1999.
Zuo, Q., Liu, J., and Chen, J.: Study on calcination and quenching-acid leaching of Fengyang quartz sand for deep purification and its kinetics, Conservation and Utilization of Mineral Resources, 42, 75–81, https://doi.org/10.13779/j.cnki.issn1001-0076.2022.07.013, 2022.