the Creative Commons Attribution 4.0 License.
the Creative Commons Attribution 4.0 License.
 | 25 Feb 2025
Incorporation of W6+ into hematite (α-Fe2O3) in the form of ferberite nanolamellae
Ralph Bolanz
Jörg Göttlicher
Martin Števko
Tomáš Mikuš
Mária Čaplovičová
Jan Filip
Jiří Tuček
Christiane Rößler
Christian Matthes
The industrial demand for tungsten (W) is steadily rising, leading to increase in mining and subsequent release into the environment. In this work, we investigated the uptake of W into the crystal structure of hematite (α-Fe2O3) as a potential immobilization mechanism. Natural zoned crystals from the low-sulfidation epithermal deposit Banská Hodruša, with up to 5.0 wt % WO3, were used. The 57Fe Mössbauer spectroscopy at room temperature showed that the hematite studied consists of two magnetic structures, one of them below and one of them above the Morin transition. The two magnetic structures are caused by the presence of W-rich and W-poor regions in hematite. The W-rich regions must be intimately intergrown with the hematite host to influence the magnetic ordering in substantial volumes of the hematite structure. X-ray absorption spectra in the W-rich regions of hematite were described very well by a structural model of ferberite (FeWO4). Transmission electron microscopy (TEM) identified nanolamellae of ferberite and magnetite that were epitaxially intergrown with the hematite host. Electron energy loss spectroscopy (EELS) confirmed that iron occurs mostly as Fe2+ in the W-rich lamellae. Mössbauer spectroscopy, X-ray absorption spectroscopy (XAS), and TEM converge, at different spatial scales, to a model where W6+ is not taken up by hematite itself but by ferberite nanodomains intergrown with hematite.
- Article
(3953 KB) - Full-text XML
-
Supplement
(2247 KB) - BibTeX
- EndNote


The use of tungsten is growing for military purposes and in high-tech applications (Koutsospyros et al., 2006; Barker et al., 2021). The environmental impact of mining, processing, disposal, and dissemination of W-bearing waste or products is not known, the knowledge thereof being described as “sketchy and fragmentary” (Koutsospyros et al., 2006). In nature, the main tungsten-bearing minerals are wolframite, (Fe,Mn)WO4, and scheelite, CaWO4. Even though tungsten used to be considered immobile, the natural tungstates (Hällström et al., 2020) and the human-made products (Strigul et al., 2005) undergo weathering, leading to the release of tungsten into the environment. Moreover, tungsten-based ammunition and penetrators increase the W concentrations significantly above the average lithospheric concentrations of 0.2–2.4 mg kg−1 (Senesi et al., 1988) at shooting and military training sites (Barker et al., 2021).
Currently, tungsten is used as an important element in many innovative technologies, a number of which are related to green technologies that should reduce CO2 emissions (Sun et al., 2020). This demand will certainly drive mining, processing, and disposal of ores and may enhance tungsten input into the environment. Even though solubility, precipitation, and adsorption of tungsten have been investigated in natural and laboratory aqueous systems (Osseo-Asare, 1982; Johannesson et al., 2013; Hobson et al., 2020), the long-term fate of this element, just as that of many other elements, is still not clear. The W concentrations only rarely reach the levels in aqueous solutions (e.g., mine drainage) where minerals whose main component is W (e.g., tungstite or hydrotungstite) are able to precipitate (Števko et al., 2017). In most recently or currently polluted systems, tungsten is still a minor to trace element, strongly influenced and affected by the major components in those systems.
In this work, we investigated the association of tungsten with a common iron oxide mineral, hematite (α-Fe2O3), in detail. Natural samples for this study originated in the Rozália mine in the Banská Hodruša mining area (central Slovakia). These samples were selected for this study because a previous study (Sejkora et al., 2015) documented high W concentration in hematite in these samples. A combination of complementary techniques such as electron microprobe analyses, bulk measurements by Mössbauer spectroscopy, micrometer-scale measurements by X-ray absorption spectroscopy, and (sub-)nanometer-scale observations by high-resolution transmission electron microscopy and electron energy loss spectroscopy defined the crystal chemical position of tungsten in hematite. The results of this work offer detailed insight into the middle- to long-term behavior of tungsten in the environment, where iron oxides are abundant. Minerals from the group of iron oxides could lock different elements into their crystal structures and exert significant control over their environment cycling.
Hand specimens of the natural samples (Rozália mine in Banská Hodruša) were carefully selected on the basis of visual examination and prepared in standard petrographic thin sections. The sections were inspected under transmitted and reflected polarized light to identify the minerals and their spatial relationships and to further narrow down the selection of hematite crystals for electron microscopy and X-ray spectroscopy. The hematite crystals selected for the detailed work were collected from the 12th level of the Rozália mine, the 5th ore shoot of the Rozália vein, block R-V-64. A detailed geological and mineralogical description of the deposit can be found in the Supplement to this article.
Electron microprobe (EMP) analyses of hematite in polished sections were done using a JEOL JXA-8230 electron microprobe, with an accelerating voltage of 15 kV, a 15 nA current, a 20 s counting time at the peak and a 20 s counting time in the background, and an overlap correction for Mg and As. The standards, emission lines measured, and estimated detection limits were Mg (Kα), MgO, 0.02; As (Lα), InAs, 0.03; Si (Kα), CaSiO3, 0.02; Al (Kα), Al2O3, 0.02; Ca (Kα), CaSiO3, 0.02; Ti (Kα), TiO2, 0.03; Mo (Lα), Mo-metal, 0.04; La (Kα), monazite, 0.07; Ce (Kα), monazite, 0.06; Fe (Kα), Fe2O3, 0.02; Mn (Kα), rhodonite, 0.02; W (Mα), W-metal, 0.05; and Cr (Kα), Cr2O3, 0.03. Sections were sputtered with a thin layer of carbon prior to analyses.
The 57Fe Mössbauer transmission spectra were collected using a conventional Mössbauer spectrometer (MS2006 type based on the virtual instrumentation technique; Pechoušek et al., 2012) in constant-acceleration mode with a 57Co (in a Rh matrix) radioactive source (1.85 GBq) and a fast-scintillation detector with a YAlO3 : Ce crystal. Carefully hand-picked hematite crystals were powdered in isopropyl alcohol to avoid possible iron oxidation and measured at room temperature and at 100 °C. The hyperfine parameters were calibrated against a rolled metallic iron (α-Fe) foil at room temperature. The spectra were folded and fitted to Lorentz functions using the computer program CONFIT2000 (Žák and Jirásková, 2006). The experimental error is ± 0.02 mm s−1 for the hyperfine parameters and ± 3 % for the relative spectral areas.
For the micro-X-ray fluorescence (μ-XRF) and micro-X-ray absorption spectroscopy (μ-XAS) measurements, the thin sections were manually ground and polished down so that the total thickness of the section was ≈ 100 µm. The data were collected in the beamline of the Synchrotron Radiation Laboratory for Environmental Studies (SUL-X) in the synchrotron radiation source of Karslruhe Institute of Technology (Germany). A silicon 111 crystal pair with a fixed-beam exit was used as a monochromator. The X-ray beam was aligned to an intermediate focus, collimated using slits located at the distance of the intermediate focus to about 100 × 100 µm2, and subsequently focused with a Kirkpatrick–Baez mirror pair to about 40 × 30 µm2 at the sample position.
The μ-XAS spectra were measured in transmission mode at the W L1 and L3 edges. The intensity of the primary beam was measured by an ionization chamber. The second ionization chamber was used to measure absorption of the beam by the sample and the third ionization chamber the absorption of the beam by the standards. Fluorescence intensities were collected with a seven-element Si(Li) solid-state detector with the energy window set to the respective emission line. Data were dead-time corrected, summed up for all seven channels, and divided by the input intensity, which was measured in an ionization chamber prior to the sample. The spectra were collected in energy steps of 5 eV in the region from −150 to −50 eV relative to the absorption edge, of 2 eV in the region from −50 to −20 eV, of 0.5 eV from −20 to +20 eV, and with a k step of 0.05 from +20 to +400 eV (about k=10). Energy was calibrated using a W foil in front of the third ionization chamber. The data collected were processed using the ATHENA and ARTEMIS software packages (Ravel and Newville, 2005).
Slicing and polishing of lamellae for the transmission electron microscopy (TEM) analysis were carried out using a scanning electron microscope (SEM) coupled with a gallium focused ion beam (FIB) source. The SEM-FIB (Helios G4 UX, ThermoFisher Scientific) is equipped with a high-performance FIB source (Phoenix) that allows polishing of the TEM lamella at a very low acceleration voltage or beam current. This feature is essential for obtaining an undisturbed thin lamella suitable for high-resolution TEM imaging. Thin sections of samples used for optical light microscopic investigation and other analyses were sputtered with an ≈ 8 nm gold layer to ensure electric conductivity of the full sample and to reduce sample abrasion during ion beam imaging. Sites for extraction of the lamellae were selected according to previous microscopic and spectroscopic characterization of the samples. Areas of interest were covered with an approx. 15 × 15 × 3 µm3 layer of platinum as further protection of the sample surface against ion beam damage.
The lamellae obtained by FIB were characterized by TEM in the high-resolution (HRTEM) or scanning (STEM) mode and were chemically analyzed at the atomic scale using energy-dispersive (EDS) methods; the oxidation state of Fe was probed by electron energy loss spectroscopy (EELS). The TEM observations were performed using a double aberration-corrected JEM ARM200cF with a cold field emission gun (FEG) microscope working at 200 kV. The STEM images were acquired using a high-angle annular dark field (HAADF) mode with a convergence semi-angle of 23.8 mrad, which is sensitive to the atomic number as well as the sample thickness. For the EDS spectroscopy, a large-angle detector (JEOL JED-2300 T CENTURIO SDD) with a solid angle up to 0.98 sr and a detection area of 100 mm2 was used. For the EELS measurements, a GIF Quantum ER spectrometer with DualEELS capability was employed. EELS measurements were conducted using a convergent semi-angle of 19.9 mrad and a collection semi-angle of 52.78 mrad. EELS spectra were acquired with a dispersion of 0.5 and 1 eV ch−1. EELS spectra were spliced and calibrated, had their backgrounds removed using a power law, and were Fourier-log deconvoluted. The Fe ratio was determined using a non-linear least squares (NLLSs) routine (Digital Micrograph package, Gatan).
3.1 Elemental composition and zoning of W-rich hematite
Hematite crystals up to 3 mm in size and with locally elevated concentrations of tungsten occur in quartz, often growing over crystals of Cu–Bi sulfosalts (Fig. 1a). Tungsten is present in thin (< 10 µm, as observed in the electron microprobe) lamellae that are oriented parallel to the growth faces of the hematite crystals. The lamellae may condense in bands of up to 100 µm in thickness (Fig. S1). These lamellae define the oscillatory zoning of the crystals investigated. Except iron, the only elements systematically above the detection limit of the electron microprobe were Al and W (all analyses are listed in Table S1). Hematite locally contains up to 5.0 wt % of WO3 and 2.1 wt % of Al2O3 (Fig. 1b). The highest W concentrations are restricted to the bands of the W-enriched lamellae. The bulk average concentration of WO3 (average of 1202 EMP analyses) is 2.0 wt %, corresponding to 0.7 at % of W. The two elements are antagonistic (Fig. 1b); zones of the crystals enriched in W contain only a little Al and vice versa.
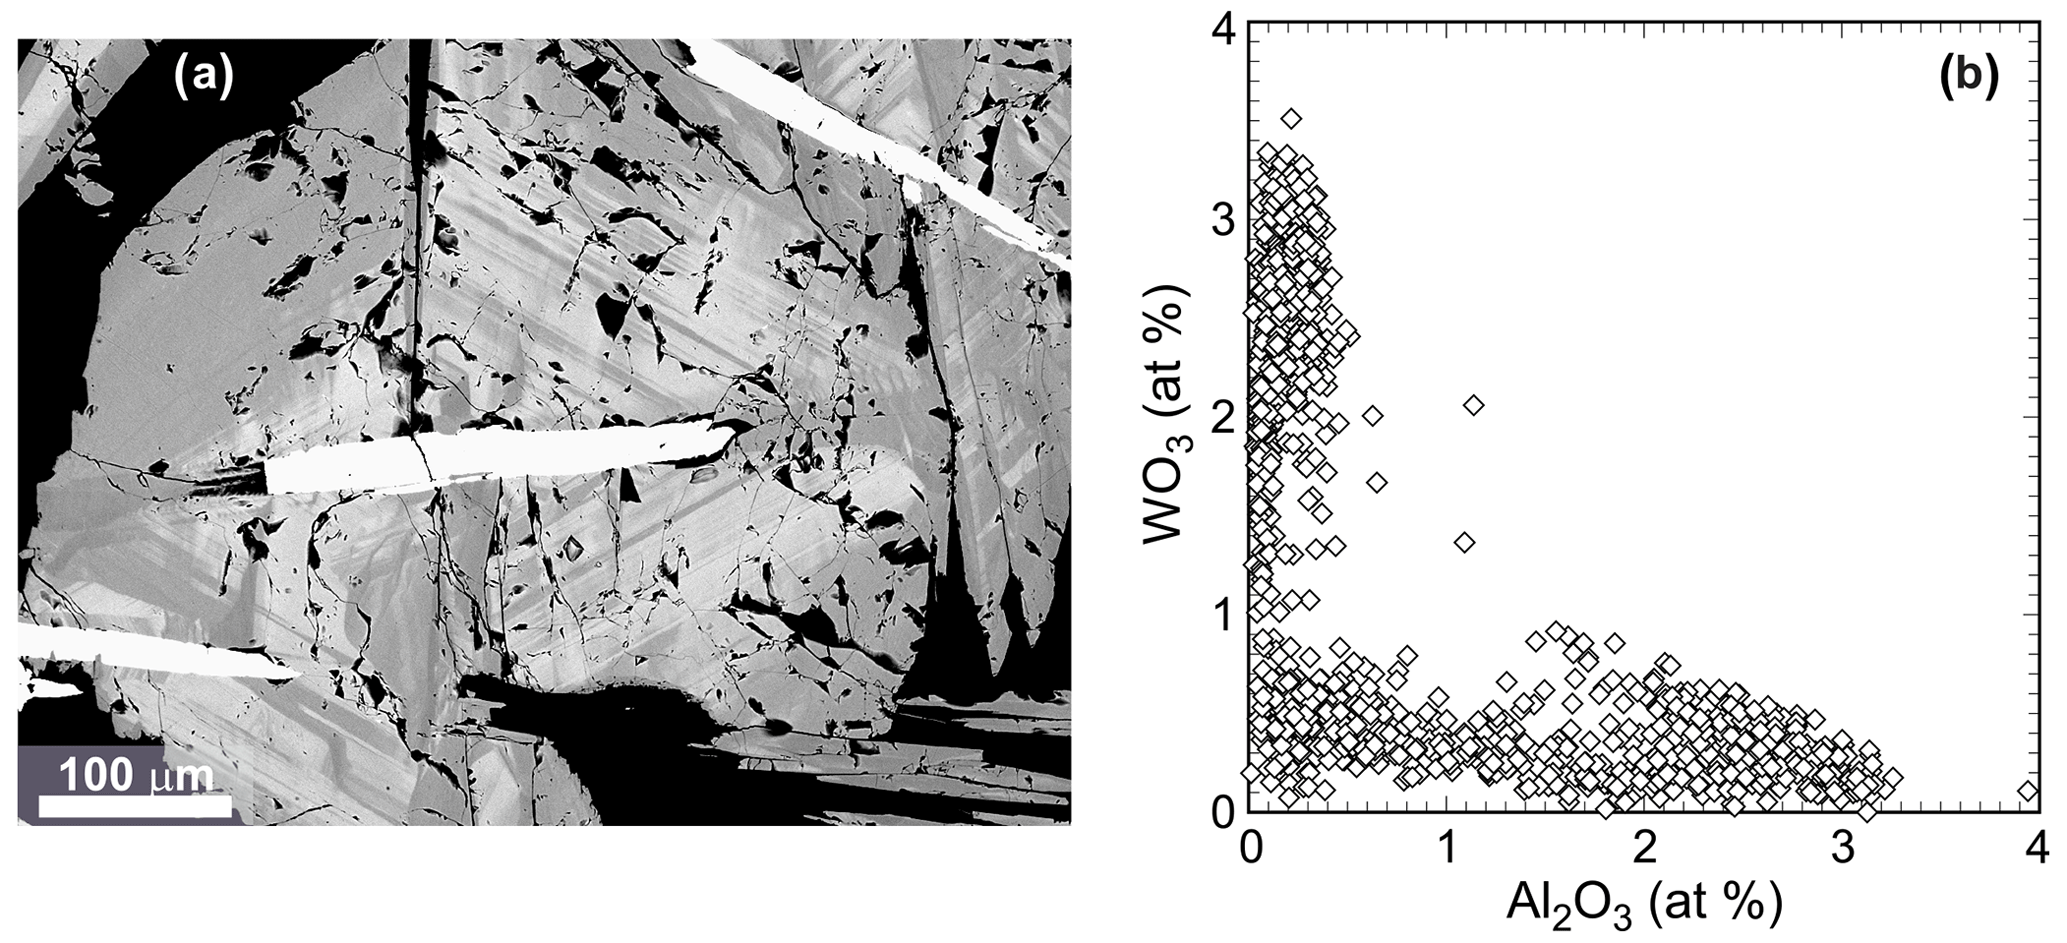
Figure 1(a) Back-scattered electron (BSE) image of a hematite crystal, showing many thin, parallel zones enriched with tungsten (light gray). The elongated crystals that appear white in the BSE image are Cu–Bi sulfosalts. The gangue mineral is quartz. An element-distribution map from a similar crystal is shown in Fig. S1. (b) Concentrations of Al2O3 and WO3 in hematite crystals from the Rozália vein in Banská Hodruša, measured by spot electron microprobe analyses. Note the antagonistic relationship between the two elements.
3.2 Spectroscopic observations
For the W-rich portions of the hematite crystals, X-ray absorption spectroscopy (XAS) spectra were measured at the Fe K and W L3 edges (Fig. 2a, b) in three selected crystals. The results are nearly identical and thus will be described together.
The position of the Fe K edge in the W-rich zones lies near the edge of magnetite, indicating that the iron could be partially reduced in the W-rich areas. Another conspicuous feature of the spectrum is the pronounced pre-edge feature at ≈ 7115 eV that indicates that a fraction of Fe could most probably also be in a tetrahedral coordination (Wilke et al., 2001).
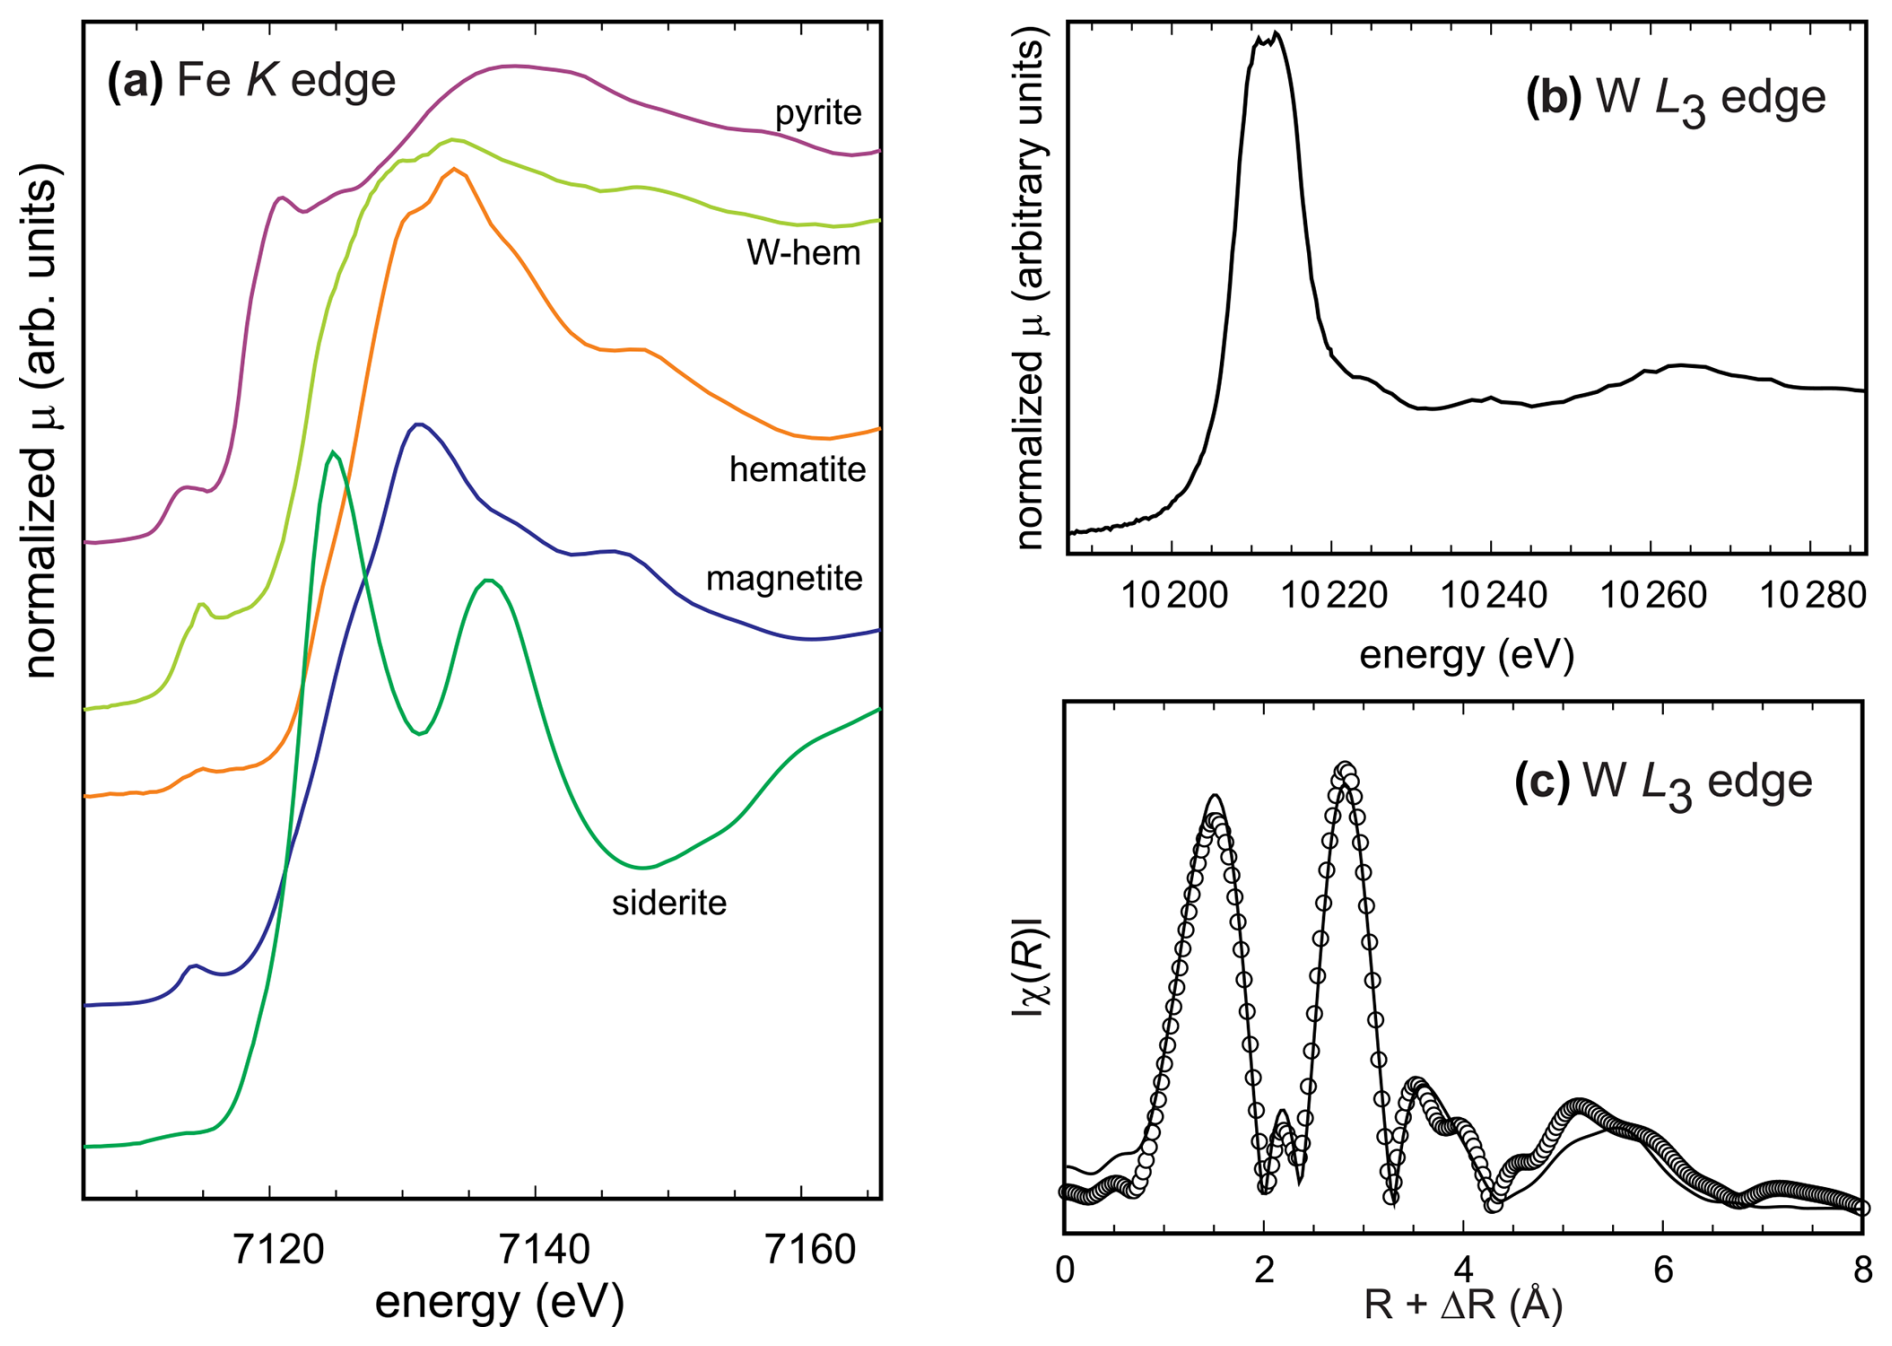
Figure 2(a) Comparison of XANES spectra of reference compounds and W-rich hematite at the Fe K edge. The spectra were offset for clarity. (b) XANES spectrum of the W-rich hematite at the W L3 edge. (c) The Fourier-transform EXAFS spectrum (at the W L3 edge) of the W-rich hematite. Circles represent the measured and processed data; the line represent the fit. Fits for all measured spectra, including the fits to the EXAFS data and the real component of the Fourier transform, can be found in Fig. S2.
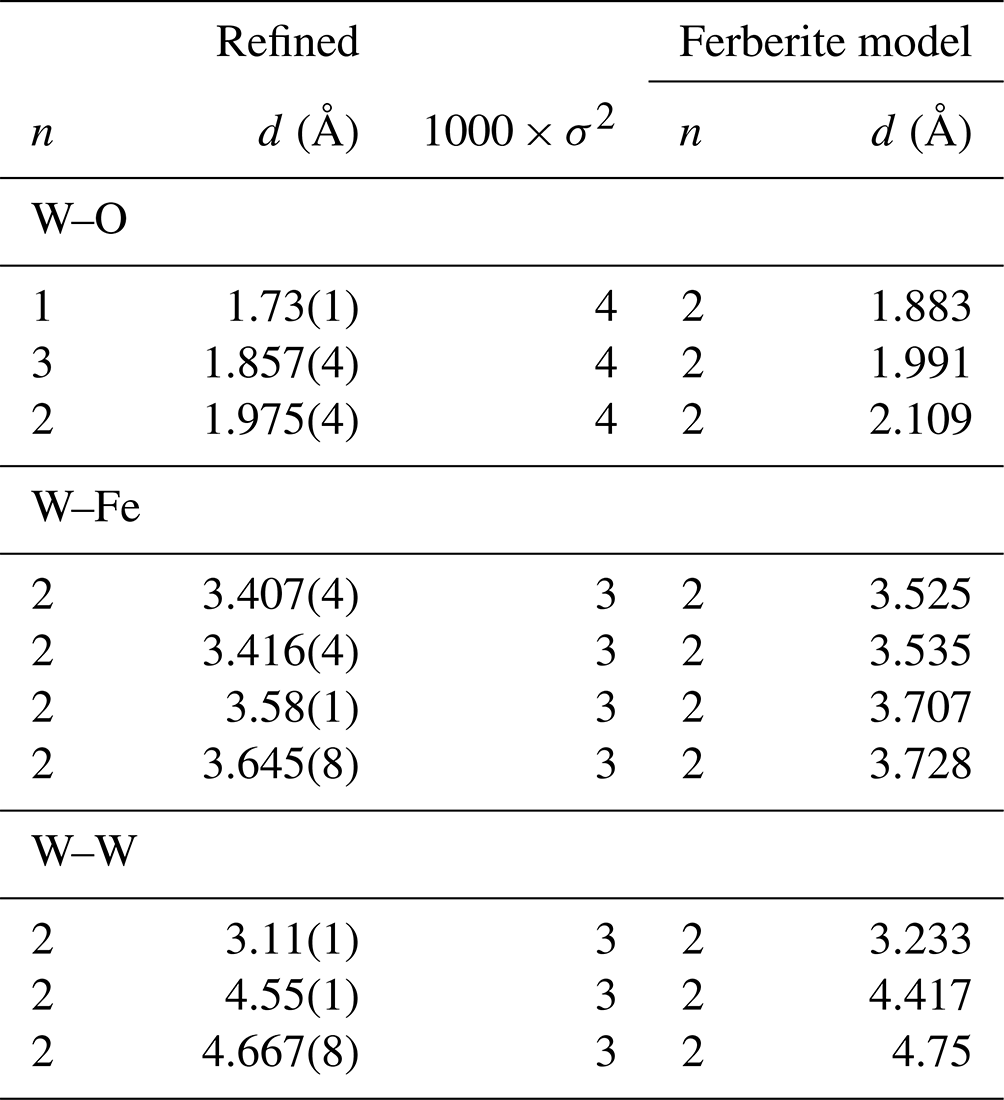
The X-ray absorption near-edge structure (XANES) spectrum at the W L3 edge shows splitting of the white line (Fig. 2b), suggesting that W6+ resides in an octahedral coordination. The extended X-ray absorption fine structure (EXAFS) data collected at the W L3 edge were processed in order to obtain information about the local environment of W in the samples studied. All models where a tungsten atom was inserted into the hematite structure and a vacancy was created failed to describe the data. The mismatch between these models and the data was so large that no amount of refinement could have brought the two into agreement. Afterwards, a number of tungstenic compounds with known structures were tried. Eventually, the model based on the structure of ferberite (FeWO4) fit the data well and needed only minor adjustments. The differences between the fit and the model can be ascertained from the data in Table 1 that show both of them. The ferberite model was refined and found to be able to reproduce the data. The number of refined variables was kept low (Nvar=10), much lower than the number of the available independent data points (Nind=20.4). Variables were assigned to a set of paths (e.g., to the first-shell W–O paths) instead of individually to every path. Initial fits defined the values of σ2 that were then constrained to be equal for the sets of paths. By doing so, an excellent fit was obtained without overfitting the data. The strong and well-defined features up to almost 7 Å confirm that the local environment of W is highly ordered, and the W atoms are not located in a number of environments, for example, as disordered filling of interstitial spaces between the hematite crystals. The results of the fitting procedure are summarized in Table 1 and shown graphically in Figs. 2c and S2.
Table 1The best results of fitting of the W L3 EXAFS data to the W-rich portions of the hematite crystals. The data and fits are also displayed in Figs. 2c and S2. ΔE0=2.3, Nvar=10, Nind=20.4, R = 0.019, k range = 3.0–9.5 Å−1, and R range = 1–6 Å. For simplicity, only the paths that contribute most strongly to the fitted model are listed. The full set of paths can be found in Table S2 in the Supplement. The distances and coordination numbers are compared to those for the structure of ferberite (Escobar et al., 1971).
In order to shed more light on the form and position of iron in W-rich hematite, the Mössbauer spectra were measured at room temperature (RT) and at 100 °C. The spectra from the two temperatures differ significantly (Fig. 3). At RT, the spectrum can be fitted by two sextets with different hyperfine parameters (Table 2) and with quite narrow spectral lines. Sextet I, representing 38 % of the spectral area, has hyperfine parameters typical of “ideal”, non-defect hematite in an antiferromagnetic state with spins aligned perpendicular to the c axis (also called the “weakly ferromagnetic” state), i.e., above the Morin transition. Sextet II, representing 62 % of the spectral area, could instead represent defect-like hematite in an antiferromagnetic state with spins aligned parallel to the c axis, i.e., below the Morin transition. At 100 °C, the spectrum can be satisfactorily fitted with just one sextet component with significantly broader spectral lines and with hyperfine parameters, indicating that the sample is entirely above the Morin transition. There is no clear indication of reduced Fe2+ in either of the two spectra.
Table 2Hyperfine parameters of the Mössbauer spectra presented in Fig. 3.
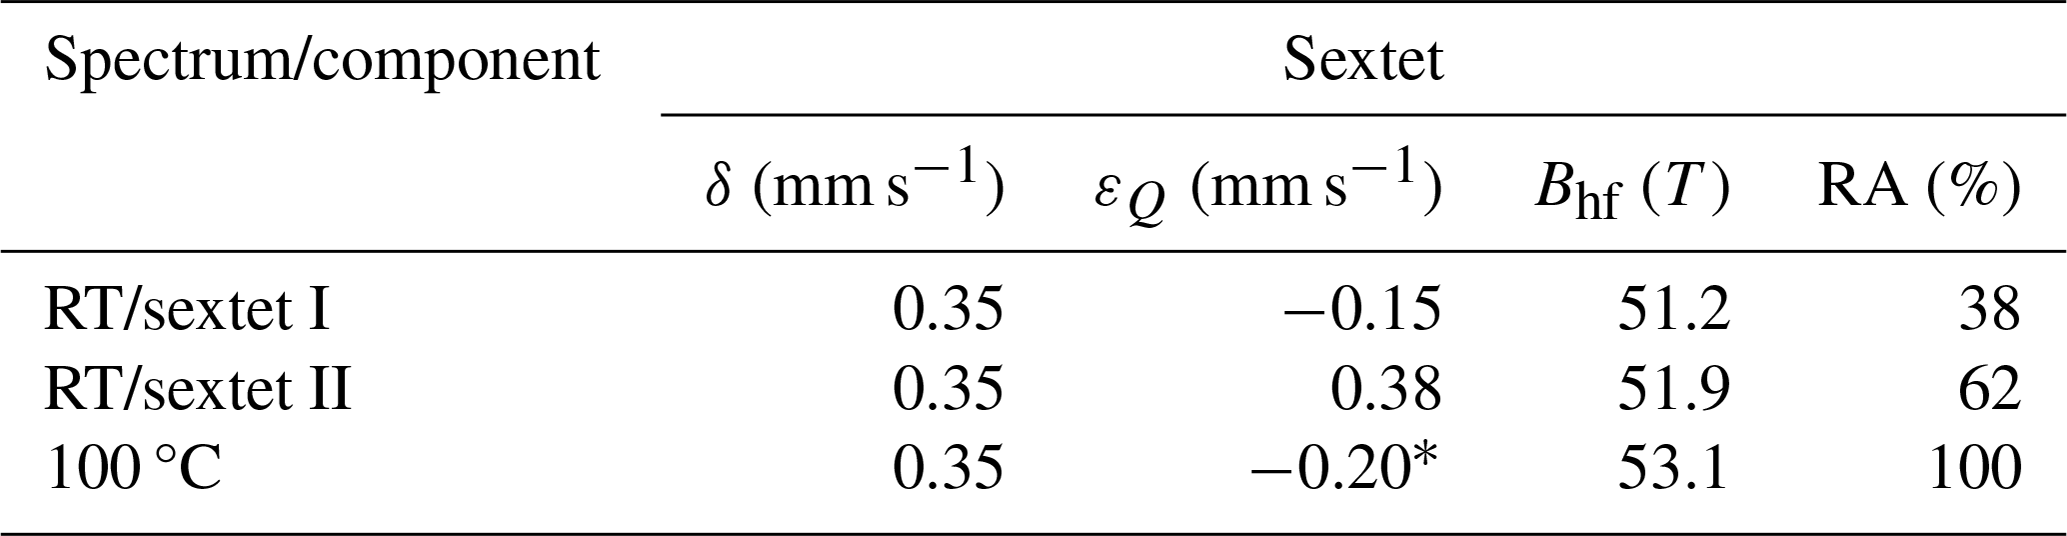
δ – isomer shift (± 0.01 mm s−1); εQ – quadrupole shift (± 0.01 mm s−1); Bhf – hyperfine magnetic field (± 0.1 T); and RA – relative area (± 1 %). * Parameter fixed in order to keep fitting consistency.

Figure 357Fe Mössbauer spectra of the hematite crystals measured at (a) room temperature and (b) 100 °C. Circles represent the measured data, black lines the overall fit. In panel (a), the two sextets fit to the data are highlighted by different colors.
3.3 Transmission electron microscopy of W-rich hematite
Detailed inspection of HRTEM images showed that the hematite crystals are highly crystalline, with a single lattice orientation through large regions of the crystals (Fig. S3). In the W-rich areas, the transmission electron microscopy provides a different picture.
The quantitative EDS analysis recorded from a larger area (∼ 1 µm2) showed that the FIB lamella consists mainly of Fe and O and a small amount of W (60.4 at % O, 39.3 at % Fe, 0.3 at % W). Further examination revealed the alternation of brighter and darker bands (Fig. S4). Oscillatory zoning, observed in the backscattered electron (BSE) images from the electron microprobe (Fig. 1a), is evident also in low-magnification bright-field scanning transmission electron microscopy (BF STEM) images and EDS maps (Fig. S5). The thickness of the W-enriched zones is quite variable but does not exceed 30 nm within the regions inspected.
The W-rich portions of the samples studied consist of epitaxial intergrowths of ferberite-like domains and magnetite-like domains in the hematite matrix (Figs. 4, S6–S8). Both ferberite and magnetite structures were determined from the electron diffraction patterns (Figs. S9, S10). Based on crystallography information obtained by the evaluation of HRTEM, HAADF STEM, BF STEM, and relevant fast-Fourier transform (FFT) patterns, we determined that the mutual orientation of hematite and magnetite is well-defined (Figs. S9–S12), with [100]hem | [10]mag. The crystallites are in contact with the planes {0001}hem | {111}mag, that is, by the nets of close-packed oxygen atoms.

Figure 4High-resolution TEM image (a) and the corresponding electron diffraction pattern (b) of the hematite–ferberite contact, with the relevant FFT image. The FFT image shows the crystal orientation of the hematite host (labeled h, in white) and ferberite (labeled f, in orange).
The oxidation state of Fe in hematite with little W and in regions of the W-enriched lamellae was probed by electron energy loss spectroscopy (EELS). In this work, we focused on the Fe L2,3 edges acquired from the region with little W and from a W-rich lamella (Fig. 5a). The Fe L2,3 lines measured were compared with those of the Fe2O3 standard (Fig. 5a). The spectral maxima acquired in the hematite matrix with little W and in the W-rich lamella are shifted relative to each other by a value of ∼ 1.5 eV towards lower energy. The shift of ∼ 2.5 eV to lower energy was observed between the spectral maxima of the hematite standard and the centroid of the spectrum of the W-rich lamella.
In a profile across a W-rich lamella, the shifts were integrated at each distance along the profile and are shown graphically in Fig. 5b. The Fe amplitude ratio remains constant in the hematite matrix with little W. Closer to the interface of hematite and the W-rich lamella, a decrease in the Fe amplitude ratio can be seen. A significant drop in the Fe amplitude ratio to ∼ 2.0 can be seen in the region of the W-rich lamella (Fig. 5b). The decrease in the amplitude ratio indicates the decrease of the Fe valence from 3+ in the hematite matrix towards 2+ in the W-rich area.
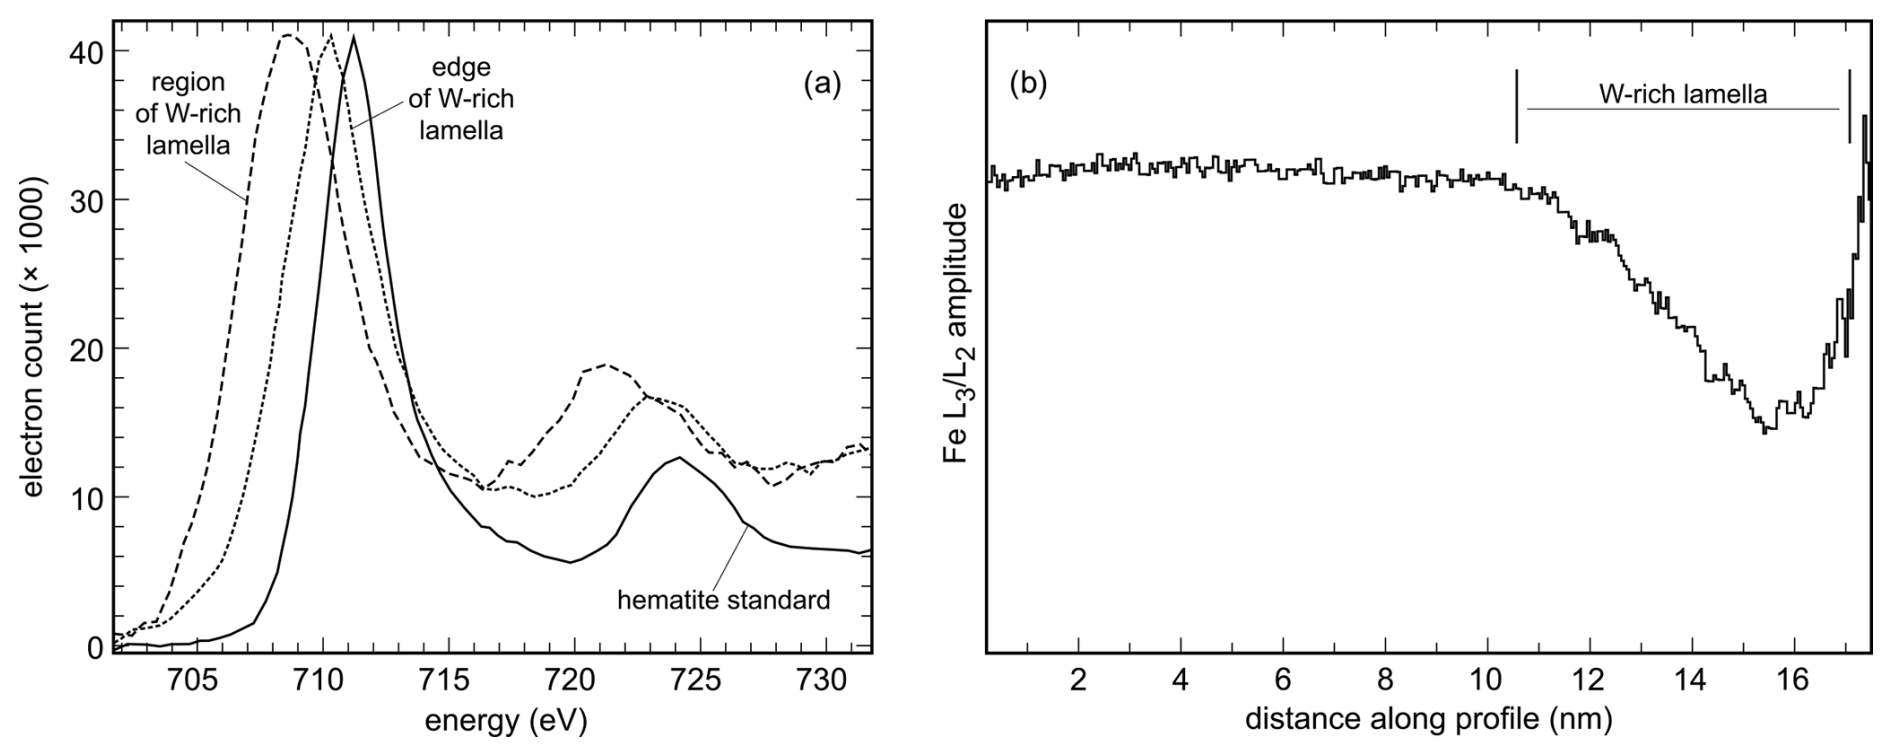
Figure 5(a) EELS spectra acquired from the hematite standard and from our samples, from areas with low and high W concentrations. (b) Profile across a W-rich lamella embedded in the hematite host, with the calculated amplitude ratio of the Fe L2,3 lines. The values plotted on the y axis correspond to the Fe3+ Fe2+ ratio in the sample, showing that the oxidation state of Fe decreases in the W-rich lamella.
Incorporation of tungsten into hematite
A number of possible mechanisms have been proposed for heterovalent substitutions of various cations into hematite, including the formation of Fe3+ or O2− vacancies, charge compensation via reduction of Fe3+ to Fe2+, or formation of clusters intergrown with hematite (Morin, 1951; Sieber et al., 1985; Bernstein and Waychunas, 1987; Balko and Clarkson, 2001; Duff et al., 2002; Tarassov et al., 2002; Pramanik et al., 2005; Skomurski et al., 2010; Kerisit et al., 2011; McBriarty et al., 2018; Aquino and Balela, 2020).
In this work, X-ray absorption spectroscopy (Figs. 2, S2), Mössbauer spectroscopy (Fig. 3) and transmission electron microscopy (Figs. 4, 5, S3–S12) converge, at different spatial scales, to a model where W6+ is not taken up by hematite itself but by ferberite nanodomains intergrown with hematite.
TEM investigation at the sub-nanometer scale identified ferberite and magnetite domains in the hematite matrix. It allowed us to deduce three orientation relationships of hematite and the ferberite-like domains: [0001]hem | [100]fer, [100]hem | [010]fer, and [110]hem | [001]fer. Inspection of the HRTEM images shows that the contact of the two minerals is predominantly {0001}hem | {100}fer. The intergrowth of hematite and the ferberite-like nanolamellae can easily be rationalized by the crystal structures of the phases. Both of them are based on hexagonal close packing of oxygen anions. The only difference is the different populations of octahedral and tetrahedral interstices. Hence, the oxygen sublattice is very similar for both phases, allowing for their epitaxial intergrowth. The only requirement for switching from the hematite structure to that of ferberite is the insertion of Fe(II) and W atoms in different types of interstitial sites.
The results of EELS spectroscopy (Fig. 5) confirmed that the oxidation state in the W-rich lamellae is lower than that in the hematite matrix. In hematite, iron is trivalent, but the presence of the magnetite nanoinclusions hints that the presence of Fe2+ in the studied material cannot be excluded. As already argued, W is stored in the ferberite (Fe2+WO4) nanolamellae, but another candidate with a similar structure is the phase FeWO6 (Senegas and Galy, 1974). The EELS results show, however, that the oxidation state in the W-rich lamella deviates to a large degree from that in the hematite matrix; namely, iron is reduced to Fe2+ in these lamellae. These results support the identification of ferberite and not FeWO6 as the W host in the samples studied.
X-ray absorption spectroscopy on the micrometer scale showed that a fraction of Fe seems to be reduced and that a fraction is tetrahedrally coordinated in the W-rich regions. The position of the absorption edge in the W-rich regions of hematite is near that of magnetite, but the shape in the XANES region does not match the magnetite spectrum. The TEM observations also showed that magnetite is present in the W-rich regions in hematite as a minor phase. Hematite and magnetite are intergrown epitaxially (Fig. S12) by matching the close-packed oxygen nets. Thus, the XAS results support the TEM observations very well.
Tungsten is octahedrally coordinated, but the EXAFS data refute its incorporation into the structure of hematite. Shell-by-shell fitting of the EXAFS data and nanoscale TEM observations identified ferberite-like nanolamellae with a defined crystallographic orientation to the hematite host. The ferberite-like nanodomains carry most if not all tungsten in the hematite crystals studied.
The splitting of the RT Mössbauer spectra (Fig. 3a) into two sextet components indicates two distinct types of ordering of hematite (i.e., one-third as ideal hematite with weakly ferromagnetic ordering and almost two-thirds as defect hematite with antiferromagnetic ordering). Such shifts in Mössbauer spectra have been observed in relation to particle size (Vandenberghe et al., 2001). In our case, however, the hematite crystals are coarse, and particle size plays no role. The temperature of the Morin transition in pure coarse-grained hematite is ∼ 260 K. Apart from particle size, this temperature can be influenced by substitutions in the crystal structure of hematite or by local disturbances of the structure by nanoinclusions (e.g., nanolamellae). Sextet II in the RT spectrum, together with the measurement at 100 °C (Table 2), clearly indicates that a significant part of the structure of hematite (62 %) is influenced by the presence of W. Some elements (e.g., Ti and Ir; Krehula and Musić, 2012) are known to increase the temperature of the Morin transition. On the other hand, elements like Al decrease the temperature of the Morin transition (da Costa et al., 2002). Tungsten in the hematite matrix is responsible for the shift in the temperature of the Morin transition. However, considering the TEM and XAS results, such a change in the ordering of the structure of hematite should instead reflect magnetocrystalline anisotropy due to the preferential crystallographic orientation of hematite lamellae intimately intergrowing (i.e., being parallel) with ferberite nanodomains. Mössbauer spectra, however, do not record any Fe2+. If we assume that W6+ is held completely in FeWO4-like domains, then only ∼ 0.7 at % of all Fe atoms would be in the reduced ferrous state. This amount is below the detection limit of this type of spectroscopy, usually set at ∼ 1 %.
The W-bearing hematite used in this work was previously also investigated from point of view of its mineral assemblage, and a simple substitution of 2 Fe W vacancy was assumed (Sejkora et al., 2015), however, without any spectroscopic evidence. Oxygen vacancies were assumed in W–Sn–U–Pb-zoned hematite from the Olympic Dam deposit in Australia (Verdugo-Ihl et al., 2020). The vacant oxygen sites are responsible for a superstructure in hematite. We note, however, that oxygen vacancies mean that a fraction of Fe3+ is fivefold coordinated, a rather unusual and unstable coordination environment for this ion. It is known, for example, in FeAsO4 (Reiff et al., 1993), but in this case, it is imposed on Fe3+ by the coordination requirements of As5+.
Tungsten is typically dispersed into the environment at military or recreational shooting sites, from mine waste of various types of ore deposits, at manufacture sites of tungsten carbide tools, or from road traffic (Backstrom et al., 2003; Clausen and Korte, 2009; Barker et al., 2021). Its release will create low-level anomalies that cannot be remediated or eliminated and will persist over long time. Upon release into soil, the mobility of tungsten was found to diminish with aging (Bednar et al., 2008). This trend was explained by this study, namely by the uptake of W6+ into the crystal structure of a common mineral in sediments and soil, hematite.
On short-term timescales, tungsten from the ammunition dissolves rapidly and forms W(VI) oxides, polytungstates, tungstates, and polyoxometallates (Clausen et al., 2011). The aqueous W(VI) tetrahedra have a strong tendency to adsorb onto iron oxides, especially ferrihydrite. This adsorption, however, is the subject of harsh competition, and phosphate is usually seen as the strongest adsorbent, stronger than arsenate or other anions (e.g., Zeng et al., 2008). Under specific, not precisely known conditions, W can be bound in the structures of hematite in weathering environments, as documented by this study and those of Tarassov et al. (2002) and Kreißl et al. (2016). For W in hematite and goethite, Kreißl et al. (2016) demonstrated the loss of about 3 Fe3+ atoms for each incorporated W6+, which leads to three missing charges. Goethite can easily balance the charge difference by protonation of O atoms, while in hematite, oxygen protonation is theoretically possible but has never been demonstrated for heterovalent substitution reactions. This non-stoichiometric balance reaction (Kreißl et al., 2016) implies a high degree of disorder and the formation of an additional Fe3+ vacancy close the incorporated W6+ ion. The corollary is that such an arrangement is metastable. It is likely that such W would be released and potentially lost upon recrystallization or dissolution of the Fe oxides.
Data used in this paper are available upon request.
The supplement related to this article is available online at https://doi.org/10.5194/ejm-37-101-2025-supplement.
JM – conceptualization, supervision, funding acquisition, and writing. RB and JG – acquisition and processing of XAS data. MŠ and TM – field work and electron microprobe analysis. MČ – TEM, EDS, and EELS work. JF – Mössbauer spectroscopy. CR and CM – FIB preparation.
The contact author has declared that none of the authors has any competing interests.
Publisher's note: Copernicus Publications remains neutral with regard to jurisdictional claims made in the text, published maps, institutional affiliations, or any other geographical representation in this paper. While Copernicus Publications makes every effort to include appropriate place names, the final responsibility lies with the authors.
We appreciate the constructive criticism of the two anonymous reviewers who improved the paper and initiated the EELS measurements presented in our work.
The work presented here was partially supported by the grants VEGA 2/0028/20 and APVV-15-0168 to Tomáš Mikuš and partially by the ERDF/ESF project TECHSCALE (grant no. CZ.02.01.01/00/22_008/0004587). The ANKA Angströmquelle Karlsruhe provided beamtime at the SUL-X beamline.
This paper was edited by Giuseppe Cruciani and reviewed by two anonymous referees.
Aquino, C. L. E. and Balela, M. D. L.: Thermally grown Zn-doped hematite (α-Fe2O3) nanostructures for efficient adsorption of Cr(VI) and Fenton-assisted degradation of methyl orange, SN Appl. Sci., 2, 2099, https://doi.org/10.1007/s42452-020-03950-1, 2020.
Backstrom, M., Nilsson, U., Hakansson, K., Allard, B., and Karlsson, S.: Speciation of heavy metals in road runoff and roadside total deposition, Water Air Soil Pollut., 147, 343–366, 2003.
Balko, B. A. and Clarkson, K. M.: The effect of doping with Ti(IV) and Sn(IV) on oxygen reduction at hematite electrodes, J. Electrochem. Soc., 148, E85–E91, 2001.
Barker, A. J., Clausen, J. L., Douglas, T. A., Bednar, A. J., Griggs, C. S., and Martin, W. A.: Environmental impact of metals resulting from military training activities: A review, Chemosphere, 265, 129110, https://doi.org/10.1016/j.chemosphere.2020.129110, 2021.
Bednar, A. J., Jones, W. T., Boyd, R. E., Ringelberg, D. B., and Larson, S. L.: Geochemical parameters influencing tungsten mobility in soils, J. Environ. Qual., 37, 229–233, 2008.
Bernstein, L. R. and Waychunas, G. A.: Germanium crystal chemistry in hematite and goethite from the Apex Mine, Utah, and some new data on germanium in aqueous solution and in stottite, Geochim. Cosmochim. Ac., 51, 623–630, 1987.
Clausen, J. L. and Korte, N.: Environmental fate of tungsten from military use, Sci. Total Environ., 407, 2887–2893, 2009.
Clausen, J., Bostick, B., Bednar, A., Sun, J., and Landis, J. D.: Tungsten speciation in firing range soils, Open-File Report ERDC TR–11-1, 2011.
da Costa, G. M., Van San, E., De Grave, E., Vandenberghe, R. E., Barrón, V., and Datas, L.: Al hematites prepared by homogeneous precipitation of oxinates: material characterization and determination of the Morin transition, Phys. Chem. Miner., 29, 122–131, 2002.
Duff, M. C., Coughlin, J. U., and Hunter, D. B.: Uranium co-precipitation with iron oxide minerals, Geochim. Cosmochim. Ac., 66, 3533–3547, 2002.
Hällström, L. P. B., Alakangas, L., and Martinsson, O.: Scheelite weathering and tungsten (W) mobility in historical oxidic-sulfidic skarn tailings at Yxsjöberg, Sweden, Environ. Sci. Poll. Res., 27, 6180–6192, 2020.
Hobson, C., Kulkarni, H. V., Johannesson, K. H., Bednar, A., Tappero, R., Mohajerin, T. J., Sheppard, P. R., Witten, M. L., Hettiarachchi, G. M., and Datta, S.: Origin of tungsten and geochemical controls on its occurrence and mobilization in shallow sediments from Fallon, Nevada, USA, Chemosphere, 260, 127577, https://doi.org/10.1016/j.chemosphere.2020.127577, 2020.
Johannesson, K. H., Dave, H. B., Mohajerin, T. J., and Datta, S.: Controls on tungsten concentrations in groundwater flow systems: The role of adsorption, aquifer sediment Fe (III) oxide/oxyhydroxide content, and thiotungstate formation, Chem. Geol., 351, 76–94, 2013.
Kerisit, S., Felmy, A. R., and Ilton, E. S.: Atomistic simulations of uranium incorporation into iron (hydr)oxides, Environ. Sci. Technol., 45, 2770–2776, 2011.
Koutsospyros, A., Braida, W. J., Christodoulatos, C., Dermatas, D., and Strigul, N. S.: A review of tungsten: From environmental obscurity to scrutiny, J. Hazard. Mater., 136, 1–19, 2006.
Krehula, S. and Musić, S.: The effect of iridium(III) ions on the formation of iron oxides in a highly alkaline medium, J. Alloys Comp., 516, 207–216, 2012.
Kreißl, S., Bolanz, R., Göttlicher, J., Steininger, R., Tarassov, M., and Markl, G.: Structural incorporation of W6+ into hematite and goethite: A combined study of natural and synthetic iron oxides developed from precursor ferrihydrite and the preservation of ancient fluid compositions in hematite, Am. Miner., 101, 2701–2715, 2016.
McBriarty, M. E., Kerisit, S., Bylaska, E. J., Shaw, S., Morris, K., and Ilton, E. S.: Iron vacancies accommodate uranyl incorporation into hematite, Environ. Sci. Technol., 52, 6282–6290, 2018.
Morin, F. J.: Electrical properties of α-Fe2O3 and α-Fe2O3 containing titanium, Phys. Rev., 83, 1005, https://doi.org/10.1103/PhysRev.83.1005, 1951.
Osseo-Asare, K.: Solution chemistry of tungsten leaching systems, Metall. Mater. Trans. B, 13, 555–563, 1982.
Pechoušek, J., Jančík, D., Frydrych, J., Navařík, J., and Novák, P.: Setup of Mössbauer Spectrometers at RCPTM, AIP Conf. Proc., 1489, 186–193, 2012.
Pramanik, N. C., Bhuiyan, T. I., Nakanishi, M., Fujii, T., Takada, J., and Seok, S. I.: Synthesis and characterization of cerium substituted hematite by sol–gel method, Mater. Lett., 59, 3783–3787, 2005.
Ravel, B. and Newville, M.: ATHENA, ARTEMIS, HEPHAESTUS: data analysis for X-ray absorption spectroscopy using IFEFFIT, J. Synchrotron. Radiat., 12, 537–541, 2005.
Reiff, W. M., Kwiecien, M. J., Jakeman, R. J. B., Cheetham, A. K., and Torardi, C. C.: Structure and magnetism of anhydrous FeAsO4: Inter- vs. intradimer magnetic exchange interactions, J. Solid State Chem., 107, 401–412, 1993.
Sejkora, J., Števko, M., Ozdín, D., Pršek, J., and Jeleň, S.: Unusual morphological forms of hodrušite from the Rozália vein, Hodruša-Hámre near Banská Štiavnica (Slovak Republic), J. Geosci., 60, 11–22, 2015.
Senegas, J. and Galy, J: L'oxyde double Fe2WO6, I. Structure crystalline et filiation structural, J. Solid State Chem., 10, 5–11, 1974.
Senesi, N., Padovano, G., and Brunetti, G.: Scandium, titanium, tungsten and zirconium content in commercial inorganic fertilizers and their contribution to soil, Environ. Technol. Lett., 9, 1011–1020, 1988.
Sieber, K. D., Sanchez, C., Turner, J. E., and Somorjai, G. A.: Preparation, electrical and photoelectrochemical properties of magnesium doped iron oxide sintered discs, Mater. Res. Bull., 20, 153–162, 1985.
Skomurski, F. N., Rosso, K. M., Krupka, K. M., and McGrail, B. P.: Technetium incorporation into hematite (α-Fe2O3), Environ. Sci. Technol., 44, 5855–5861, 2010.
Števko, M., Sejkora, J., Malíková, R., Ozdín, D., Gargulák, M., and Mikuš, T.: Supergene minerals from quartz vein with Mo-W mineralization near Ochtiná, Spišsko-gemerské rudohorie Mts. (Slovak Republic), Bull. Mineral. Petrol., 25, 43–54, 2017 (in Slovak).
Strigul, N., Koutsospyros, A., Arienti, P., Christodoulatos, C., Dermatas, D., and Braida, W.: Effects of tungsten on environmental systems, Chemosphere, 61, 248–258, 2005.
Sun, C. B., Zhong, Y. W., Fu, W. J., Zhao, Z. Q., Liu, J., Ding, J., Han, X. P., Deng, Y. D., Hu, W. B., and Zhong, C.: Tungsten disulfide-based nanomaterials for energy conversion and storage, Tungsten, 2, 109–133, 2020.
Tarassov, M., Mihailova, B., Tarassova, E., and Konstantinov, L.: Chemical composition and vibrational spectra of tungsten-bearing goethite and hematite from Western Rhodopes, Bulgaria, Eur. J. Miner., 14, 977–986, 2002.
Vandenberghe, R. E., Van San, E., De Grave, E., and da Costa, G. M.: About the Morin transition in hematite in relation with particle size and aluminium substitution, Czechoslov. J. Phys., 51, 663–675, 2001.
Verdugo-Ihl, M., Ciobanu, C., Cook, N., Ehrig, K., Slattery, A., and Courtney-Davies, L.: Trace-element remobilisation from W-Sn-U-Pb zoned hematite: Nanoscale insights into a mineral geochronometer behaviour during interaction with fluids, Min. Mag., 84, 502–516, 2020.
Wilke, M., Farges, F., Petit, P.-E., Brown Jr., G. E., and Martin, F.: Oxidation state and coordination of Fe in minerals: an Fe K-XANES spectroscopic study, Am. Mineral., 86, 714–730, 2001.
Žák, T. and Jirásková, Y.: CONFIT: Mössbauer spectra fitting program, Surf. Interface Anal., 38, 710–714, 2006.
Zeng, H., Fisher, B., and Giammar, D. E.: Individual and competitive adsorption of arsenate and phosphate to a high-surface-area iron oxide-based sorbent, Environ. Sci. Technol., 42, 147–152, 2008.