the Creative Commons Attribution 4.0 License.
the Creative Commons Attribution 4.0 License.
Li diffusion in plagioclase crystals and glasses – implications for timescales of geological processes
Florian Pohl
Harald Behrens
Martin Oeser
Felix Marxer
Ralf Dohmen
The growing interest in Li diffusion as a tool to determine timescales of short-time magmatic events, such as magma ascent during eruption, increases the necessity to better understand Li diffusion in common mineral phases. In this context, well-constrained diffusion coefficients and understanding of kinetic processes specific to mineral phases are of crucial importance. To gain further insight especially into the kinetic processes in plagioclase, we investigated the diffusion of Li between natural An61 plagioclase crystals and synthetic glasses of An80 plagioclase composition. Experiments were conducted at 200 MPa in rapid-heat/rapid-quench cold-seal pressure vessels (RH/RQ CSPVs) and internally heated pressure vessels (IHPVs) at temperatures between 606 and 1114 °C. Concentration and isotope profiles of Li were measured using femtosecond laser ablation multicollector inductively coupled plasma mass spectrometry (fs-LA-MC-ICP-MS). We adopted a multispecies diffusion model and specified boundary conditions for plagioclase of labradoritic composition. Using this model, we were able to distinguish between an interstitial () and a vacancy process (), with the interstitial process being 0.2–1 orders of magnitude faster than the vacancy process, depending on temperature.
Our data indicate charge compensation of Li by Na in both the crystal and the glass. Chemical Li diffusion coefficients in An80 glass are up to 3 orders of magnitude slower compared to Li tracer diffusion in silicate and aluminosilicate glasses and melts, which is attributed to slow Na diffusion at high An content. Our results for chemical diffusion of Li in plagioclase crystals are 1.5–2 orders of magnitude slower than Li tracer diffusion in An- and Ab-rich plagioclase determined in previous studies. This indicates that earlier studies on natural intermediate plagioclase compositions have underestimated timescales by up to 2 orders of magnitude. For accurate determination of timescales from Li diffusion in plagioclase we suggest further exploring the role of Na and a possible dependence on An content.
- Article
(5302 KB) - Full-text XML
-
Supplement
(5521 KB) - BibTeX
- EndNote
With the increasing interest in diffusion chronometry as a tool to determine timescales of magmatic events over the last 20 years (see review by Chakraborty and Dohmen, 2022), it has become increasingly important to determine diffusion coefficients with high precision. Minerals like plagioclase, which incorporate elements with a large variety of diffusion coefficients (e.g., Turner and Costa, 2007) and which are common in different magmatic environments, are of particular importance, since they can be used to access a large range of petrological timescales. One of the most interesting elements is Li due to its extremely fast diffusivity in comparison to other elements in plagioclase (see overview of Cherniak, 2010), which allows for the determination of short timescales even in the range of seconds to minutes. For example, Li zoning in plagioclase has been used in various studies to determine magma ascent rates (Charlier et al., 2012; Giuffrida et al., 2018; Neukampf et al., 2021).
In addition to well-constrained diffusion coefficients, it is also necessary to get a better understanding of the physical processes of diffusion mechanisms. With increasing precision of measurements and better understanding of isotope fractionation during diffusion, it has now become possible to distinguish between multiple, simultaneously occurring diffusion processes and develop models which are able to extract diffusion coefficients for these processes. A multispecies diffusion mechanism was first identified for Li in olivine, and an appropriate diffusion model was formulated by Dohmen et al. (2010). In the subsequent studies of Richter et al. (2014, 2017), a similar behavior was also found for pyroxene, and it was shown that the fractionation of the stable Li isotopes produces a unique fingerprint when two diffusion mechanisms operate simultaneously.
An initial study on Li diffusion in plagioclase has been conducted by Giletti and Shanahan (1997), who measured 6Li tracer diffusion in albite (An0.6) and anorthite (An95.6) in the temperature range of 200–800 °C. They modeled their profiles with a constant diffusion coefficient and found no dependence on An content or crystallographic orientation. Audétat et al. (2018) analyzed chemical diffusion of Li in An54 plagioclase in the temperature range of 900–1050 °C and confirmed no dependence on crystallographic orientation but suggested two different diffusion processes for Li. Due to the complexity of implementing a two-species model and the necessity of understanding the physical processes when applying a multispecies diffusion model, a detailed analysis was out of the scope of their work, and they opted for a simplified approach using two superimposed error functions, treating both processes as independent. Their determined diffusion coefficients for both processes are significantly slower than those of Giletti and Shanahan (1997). This shows that Li diffusion in plagioclase is still not well understood, and simply applying the tracer diffusion coefficient of Giletti and Shanahan (1997) to natural plagioclases of varying An contents might lead to an underestimation of timescales.
The large relative mass difference between Li isotopes yields a large mass effect, resulting in a relatively large difference in diffusivity of Li isotopes (e.g., Dohmen et al., 2010; Richter et al., 2014, 2017; Holycross et al., 2018; Singer et al., 2023). Modeling of isotope profiles allows us to measure the ratio of diffusion coefficients (D), which is described by the empirical constant β, calculated after Richter et al. (1999):
where m is the atomic mass in atomic mass units.
The objective of this study is to use Li concentration and isotope measurements on diffusion couple experiments and implement a multispecies approach to further look into the findings of Audétat et al. (2018) and characterize Li diffusion in natural plagioclase of intermediate composition (An61). We opted to stay close to naturally occurring Li concentrations in plagioclase to avoid problems which might occur due to artificially high Li concentrations. We used diffusion couples consisting of An80 glass and An61 plagioclase single crystals and performed diffusion anneals in nominally dry conditions, mostly at 200 MPa, but also at varying pressures from 0.1–400 MPa. The temperature range extends from the glass state to the stable melt far above the glass transition temperature. We analyzed Li concentration and Li isotope profiles along sample cross sections using laser ablation ICP-MS to obtain Li diffusion coefficients and identify the diffusion mechanism. In addition, we obtained new Li diffusion data for glasses/melts with high An contents, giving insight into the mobility of Li in silicate and aluminosilicate glasses.
To improve the readability of this paper, we use the term labradorite (based on the old nomenclature) to refer to plagioclase in the compositional range An50–An70.
2.1 Starting material
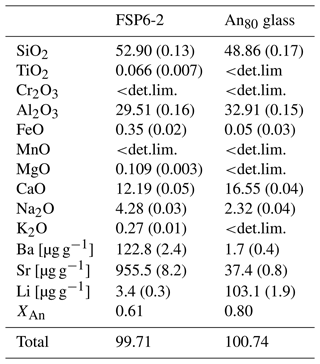
Diffusion couple experiments were performed using optically crack-free, chemically homogeneous, gem-quality natural labradorite single crystals of unknown volcanic origin (61 mol % anorthite, 39 mol % albite – An61) and synthetic glasses of An80 composition. An80 glasses were synthesized by fusing a mixture of oxides, carbonates and a spodumene glass (δ7Li ‰; Singer et al., 2023) at 1600 °C in air. The amount of spodumene glass was chosen to result in a Li concentration of 100 µg g−1. To increase homogeneity, glasses were melted for 3 h, then quenched and crushed before being melted again for another 3 h at the same temperature and quenched again. The An content of the glass was chosen to be higher than that of the crystal in case the diffusion of Li in glass was significantly faster than in the crystal, with the assumption that an increased An content could slow down diffusion. We did not choose an even higher An content because we had problems with exsolution during glass synthesis at high An contents (close to An100). The Li content of the glasses was chosen to be close to naturally occurring concentrations.
Compositions of starting material crystals and glasses were determined by an electron probe microanalyzer (EPMA) (major elements) and femtosecond laser ablation multicollector inductively coupled plasma mass spectrometry (fs-LA-MC-ICP-MS) (trace elements) and are given in Table 1. The large single crystal from which our samples were cut showed isotope profiles with isotope fractionation up to 50 ‰ over a distance >3 cm. However, the small individual pieces used for diffusion experiments can be regarded as isotopically homogeneous.
Table 1Composition of starting materials determined using EPMA (major and minor components) and fs-LA-MC-ICP-MS (Ba, Sr, Li). If not specified, results are given in weight percent. Numbers in parentheses correspond to the error of the measurement. When <det.lim. is used, it means the result was below the detection limit. XAn corresponds to the fraction of the anorthite component of the plagioclase. Values were averaged over 10 measurements.
2.2 Diffusion experiments
Crystals and glasses were cut into 2 × 2 × 2 mm cubes, with the surface of the crystal being perpendicular to [0 0 1]. Orientations of crystals were determined by electron backscatter diffraction. This side of the crystal and one side of the glass were polished, with the final polishing step being a colloidal silica suspension (50 nm). Crystal and glass were then placed in platinum capsules (2.8 inner diameter, 3.2 mm outer diameter, length 12–15 mm) with the polished sides facing each other. Capsules were welded shut on both sides using a Lampert PUK 3 Professional arc welding device (tungsten electrode). Before experiments, capsules were pressurized in a cold-seal pressure vessel (CSPV) at 40 MPa (Ar gas) to check the sealing of the capsules and ensure good contact between crystal and glass.
Diffusion experiments at temperatures between 606–850 °C were carried out in vertically oriented rapid-heat/rapid-quench cold-seal pressure vessels (RH/RQ CSPVs) at the Leibniz University Hannover, using Ar gas as the pressure medium. The functionality of such a device is described in Matthews et al. (2003). The samples were stored in the cold part of the autoclave during the heating of the furnace and rapidly pushed into the hot part of the furnace using an external magnet as soon as a stable temperature distribution was established. To terminate the experiment, the sample capsule was abruptly pulled back into the cold area (cooling rates of up to 20 °C s−1; Singer et al., 2023). The combined error of the experimental run time (heating and cooling) is about 20 s (Singer et al., 2023). Temperature was recorded by a K-type thermocouple inserted into a small notch on top of the autoclave. The error of the temperature measurement is <5 °C (Singer et al., 2023).
Diffusion experiments between 950–1114 °C were performed in an internally heated pressure vessel (IHPV) at the Leibniz University Hannover. Samples were hung in a rapid-quench (RQ) sample holder using a Pt wire that positioned the capsule in the hot spot of the furnace. Samples were heated at 50 °C min−1, up to 20 °C below experimental temperature, followed by 10 °C min−1 to reach the final temperature. For quenching, the Pt wire was fused with an externally connected power source, allowing the capsule to fall onto a copper block positioned outside of the furnace, resulting in quenching rates >100 °C s−1 (Berndt et al., 2002). Temperatures were recorded using S-type thermocouples. A detailed description of the sample holder and IHPV is given in Berndt et al. (2002). The combined error in experimental run time introduced by heating and quenching of the sample is about 240–300 s (Christian R. Singer, personal communication, 2024). Experiments were conducted using Ar gas as a pressure medium.
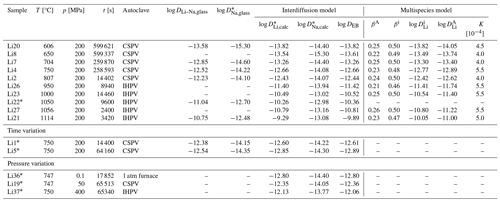
Experimental conditions are listed in Table 2.
2.3 EPMA
Concentrations of SiO2, TiO2, Cr2O3, Al2O3, FeO, MnO, MgO, CaO, Na2O and K2O in the starting crystals and SiO2, Al2O3, K2O and Na2O in the starting glasses were determined using a JEOL JXA-iHP200F field emission electron probe microanalyzer (FE-EPMA) at the Institute of Earth System Sciences, Leibniz University Hannover. Measurement conditions and calibration standards for each element are given in File S1 (Supplement). To prevent the underestimation of lighter elements due to the high beam current and resultant beam damage, Na and K were always measured first on the assigned spectrometers.
2.4 Measurement of diffusion profiles
To measure the diffusion profiles, samples (entire capsules) were embedded in epoxy resin and polished down to the center of the sample. A representative cross section of one sample is given in Fig. 1.
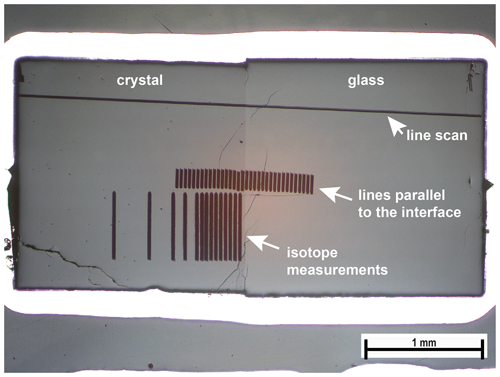
Figure 1Cross section of run Li8 after measurements. Distances for the line scan were corrected with respect to the small angle between the scan and interface. Scans parallel to the interface were done to improve counting statistics to better resolve the diffusion profile.
Concentration profiles were measured using a femtosecond laser ablation system (Spectra-Physics Solstice) in combination with a Thermo Scientific Element XR™ ICP-MS at the Institute of Earth System Sciences at the Leibniz University in Hanover. The laser beam (194 nm) was focused on the sample using an in-house-built stage (containing the ablation cell) combined with an optical microscope. A detailed description of the ablation cell and stage system is given in Horn et al. (2006) and Horn and Von Blanckenburg (2007). Measurements were conducted with a laser repetition rate of 36 Hz and a spot diameter of ∼ 23 µm. Line scans perpendicular to the crystal–glass interface were run with a scan speed of 4 µm s−1. To improve counting statistics, we also measured profiles using scans parallel to the interface with a line length of 150 µm and a scan speed of 15 µm s−1. Spacing between scans parallel to the interface varied between 30–100 µm, depending on the length of the profile. Each analysis started with a 35 s background acquisition, followed by an ablation interval of ∼ 60 s. The concentration measurements on samples were calibrated using the NIST SRM 610, and secondary standards measured alongside our samples were BIR-1G, BCR-2G and ARM-3.
2.5 Measurement of isotope profiles
Measurements of isotope ratios were conducted in situ using the aforementioned laser ablation and stage system in combination with a Thermo Scientific Neptune Plus MC-ICP-MS as described in Steinmann et al. (2019).
A repetition rate between 31–250 Hz (depending on Li concentration) was used. We ablated lines of length between 250–500 µm parallel to the diffusion interface with a scan speed of 15 µm s−1. Each analysis was run for 180 s in total with a 40 s background measurement before ablation. T1-G (as measured by Steinmann et al., 2019) was used as a bracketing standard. To facilitate the comparability of our data with the literature, we converted our values to δ7LiIRMM-16 using Eq. (2), since the δ7Li of T1-G relative to IRMM-16 is +2.1 ‰ (Jochum et al., 2012). The error bars shown represent the 2σ uncertainty, which was calculated by propagating the errors (SEs) of the bracketing standard (std) and of the analyzed sample as follows:
where R is .
3.1 General and microscopic observations
We conducted a total of 15 diffusion couple experiments. While all experiments performed in the IHPV show visible cracks in crystal and glass, experiments conducted between 606–750 °C in the RH/RQ CSPV show few to no cracks (Fig. 2). The number and size of cracks increase with increasing experimental temperature, with the glasses displaying more and larger cracks than the crystals. This points to a quenching effect, i.e., formation of the cracks due to stress caused by the decrease in volume of the melt/glass during cooling. Additionally, Fig. 2a shows that crystal and glass are well joined even at low temperatures.
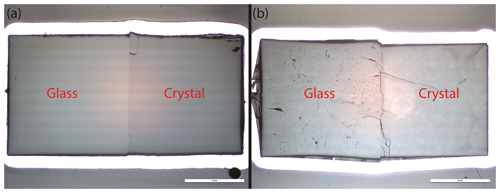
Figure 2Optical images of diffusion samples obtained by a reflected-light microscope. Crack formation in crystal and glass depended on the temperature of the experiment, as shown exemplary for low temperatures, (a) Li20 at 606 °C in the CSPV, and high temperatures, (b) Li22 at 1050 °C in the IHPV. In both cases, there are no visible gaps between crystal and glass.
3.2 Li concentration profiles
In all experiments, Li was the only element, which shows resolvable diffusion profiles (measured elements are reported in Table 1). A prominent observation is that over the entire temperature range, the diffusion profiles in crystals and glass have comparable lengths.
Figure 3 shows diffusion profiles between crystals and glasses for three different temperatures, which are representative of the entire temperature range. Diffusion profiles at temperatures of 606–950 °C show a discontinuity at the interface between crystal and glass (Fig. 3a, b). We attribute this discontinuity to equilibrium partitioning of Li between crystal and glass. Near the glass transition (700–800 °C), experiments show a decrease in Li concentration in the crystal close to the interface (Fig. 3b). A time series at 750 °C (4–72 h, Fig. 4) shows the surface concentration in the crystal to decrease with time, while the surface concentration in the glass increases with time. This observation can be explained by relaxation processes in the glass when approaching the glass transition temperature (expected to be ∼ 850 °C; Hummel and Arndt, 1985). The glass changes towards a low-temperature plagioclase melt structure over time, and, as a consequence of the increasing compatibility of Li in the glass, the partition coefficient between crystal and glass gets smaller. This effect is not observed at lower temperatures due to relaxation processes being too slow at these temperatures. In the temperature range of 1000–1114 °C, the discontinuity between crystal and glass is no longer observed (Fig. 3c). It has to be mentioned that, due to the limited resolution of the fs-LA-MC-ICP-MS system, no measurements could be performed directly at the interface, and, therefore, these conclusions are based on the extrapolation of the profiles in each diffusion medium, i.e., crystal and glass.
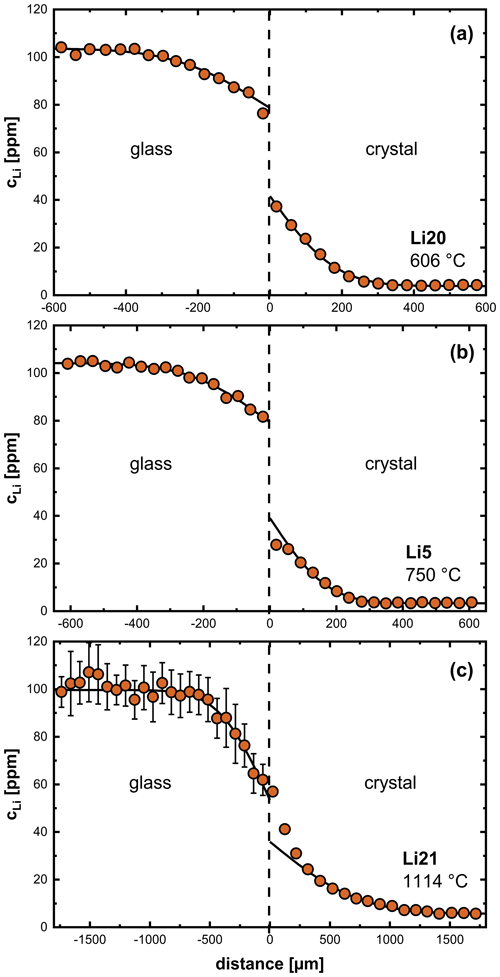
Figure 3Li diffusion profiles between labradorite crystals and synthetic glasses of An80 composition specifically at different temperatures: (a) 606 °C, (b) 750 °C and (c) 1114 °C. The black line corresponds to a fit using Eq. (4). See the text for details.
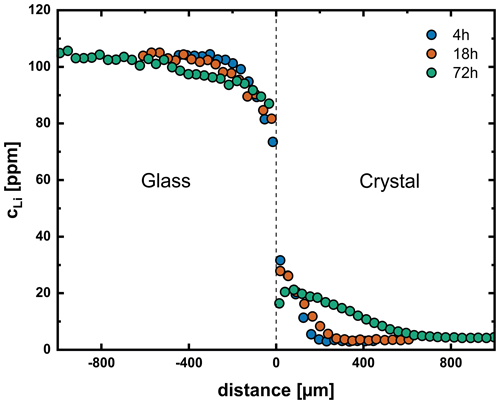
Figure 4Diffusion profiles for a time series of experiments at 750 °C and 200 MPa (Li1, Li4, Li5). At this temperature, we observe a decreasing partition coefficient between crystal and glass due to relaxation processes in the glass. At longer run times (72 h), this leads to the formation of a concentration maximum close to but not at the interface.
Li diffusion profiles in An80 glasses within the temperature range of 606–807 °C can be fit well by Eq. (4) assuming a constant diffusion coefficient in a semi-infinite medium (Crank, 1975). At higher temperatures, this is also possible in some cases (e.g., Fig. 3c), but most profiles are too poorly resolved for evaluation. Even if profiles can be measured, the variance of individual data points is very high, and profiles are difficult to interpret. For these reasons we refrained from evaluating the profiles of most glasses under these conditions (see Table 2).
Li diffusion profiles in plagioclase crystals within the temperature range of 606–650 °C (Fig. 3a) can be described by a simple error function shape (Eq. 4). At temperatures between 700–800 °C, when the glass transforms into a melt during an experiment, a noticeable deviation of Li profiles in the crystal from an error function shape is evident (Fig. 3b). Above 950 °C, we observe a deviation from an error function shape, i.e., a steep gradient within the crystal near the interface (Fig. 3c), which indicates a slower net Li diffusivity near the interface compared to the interior of the crystal. Different explanations are possible for such a behavior as is discussed next, but clearly a single concentration-independent diffusion coefficient is insufficient to describe the diffusion of Li under these conditions.
3.3 Li isotope profiles
Isotope profiles (6Li and 7Li) were measured in nine crystals (see Table 2). The glass side was also measured for three of these samples. While the isotope profiles of run Li21 reached the edge of the crystal, all other samples show a plateau in the region unaffected by diffusion. Example profiles are shown in Fig. 5. In the crystal a pronounced minimum of δ7LiIRMM-16 developed towards the end of the concentration profile of Li. The reduction in δ7LiIRMM-16 values is much more distinct at high temperatures than at low temperatures. The δ7LiIRMM-16 value in the glass first increases slightly relative to the region unaffected by diffusion, reaching a maximum, and then decreases towards the interface (Fig. 5a). Additional isotope profiles are given in the Supplement.
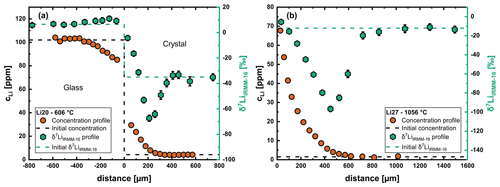
Figure 5Li concentration and isotope profile for the crystal side at two different temperatures. (a) Run Li20 at 606 °C. (b) Run Li27 at 1056 °C. The isotope fractionation in the crystal is less pronounced at lower temperatures but still very strong. The isotope profile in the glass shows the typical shape expected for out diffusion, i.e., development of a maximum near the diffusion interface.
In previous studies, the 6Li tracer diffusion coefficient of Giletti and Shanahan (1997) has been commonly used to model chemical diffusion profiles in natural samples (Charlier et al., 2012; Giuffrida et al., 2018; Neukampf et al., 2021). Our measured concentration profiles in plagioclase, however, are significantly shorter than profile lengths estimated with the diffusion coefficient of Giletti and Shanahan (1997). These findings show either the assumption that the tracer and chemical diffusion coefficient can be assumed to be identical at such low concentrations is wrong or the diffusion behavior of the endmembers albite and anorthite deviates from intermediate plagioclases, such as labradorite.
As observed by Audétat et al. (2018) for diffusion experiments between plagioclase crystals (An54) and Li-doped rock powder in the temperature range of 900–1050 °C and 1 atm pressure, our results show a strong gradient of the Li concentration in the crystal towards the interface with increasing temperature for experiments ≥ 950 °C (steeper than expected for a constant diffusion coefficient). This is an important finding because the observation of Audétat et al. (2018) might have also been a result of the extremely large (∼ 1500 vs. 2 wt ppm Li) concentration difference between crystal and powder used in their experiments. In the following we discuss the approach of Audétat et al. (2018) and other possible explanations for the deviation of Li concentration profiles from an error function shape.
4.1 Two independent diffusion processes
Audétat et al. (2018) interpreted their results as two independent diffusion processes, which they fitted with two superimposed error functions. This approach also works for fitting of our profiles. However, in our opinion, this solution is not very likely since two independent diffusion processes would mean that Li diffuses via a vacancy and an interstitial mechanism with no interaction between the two sites. Since it can be presumed that this exchange happens instantaneously compared to timescales of diffusion (see, for example, Li diffusion in olivine; Dohmen et al., 2010, or Na diffusion in An60–66 plagioclase; Behrens et al., 1990), we can assume that these two processes cannot be independent and that such an approach, although it allows fitting of our profiles, does not reproduce the diffusion process of Li in plagioclase.
4.2 Concentration-dependent Li diffusion
Another possibility is a concentration dependence of Li diffusivity with decreasing diffusivity as the concentration increases. For diffusion of ions, charge balance needs to be fulfilled by a compensating mechanism (e.g., Lasaga, 1979). Neukampf et al. (2021) suggested the diffusion of Li to be compensated by either (i) the exchange reaction Li+ + Al3+ → Si4+ or (ii) the oxidation of Fe2+ to Fe3+, where they preferred the oxidation of Fe. In this section we discuss these options, as well as the possibility of exchange with (iii) H+ and (iv) Na+.
(i) Assuming that the in diffusion of Li is compensated for by the exchange reaction Li+ + Al3+ → Si4+ would require the diffusion of major elements. Albite–anorthite interdiffusion under dry conditions is significantly slower than Li diffusion (>10 orders of magnitude; Giletti and Shanahan, 1997; Grove et al., 1984) due to the extremely slow diffusivity of Si in plagioclase (Cherniak, 2003). For this reason, we do not consider this exchange reaction to act as a charge balance for the in diffusion of Li.
(ii) Neukampf et al. (2021) preferred the oxidation of Fe2+ to Fe3+ as a charge balance for the out diffusion of Li. In our case, however, Li diffuses into the crystal, which would require the reduction of Fe3+ to Fe2+. Behrens et al. (1990) used absorption spectra of polarized light to see how oxidizing and reducing conditions during annealing affect the ratio in labradorite. While the linear extinction of the Fe2+ band changed drastically under oxidizing conditions, this band was still very similar in reducing conditions. This indicates little to no change in the ratio in plagioclase during reducing conditions. One reason for this could be that Fe3+ cannot be reduced to Fe2+ at the site it is located in the plagioclase structure. For this reason, we do not consider the reduction in Fe3+ to be responsible for charge balancing in diffusion of Li.
(iii) As shown by Behrens (2021a, 2023) for sanidine, hydrogen incorporated as a proton on interstitials can easily exchange with alkali ions. In plagioclase, however, the majority of hydrogen is bound as water molecules (Behrens, 2021a, b), which do not carry a charge during diffusion and therefore cannot act as a charge balance for the in diffusion of Li.
(iv) Another possibility is charge balance due to interdiffusion with a slower-diffusing element, as shown for Li–Na interdiffusion in pegmatitic melts (Singer et al., 2023). Since Li is the fastest-diffusing element (with the exception of hydrogen) in plagioclase (see overview of Cherniak, 2010), such a process would potentially lead to a decreased diffusivity with increasing Li concentration due to coupling. Other elements should have no resolvable influence on this process as the next fastest-diffusing element K is multiple orders of magnitude slower than Na (Behrens et al., 1990; Giletti and Shanahan, 1997). Assuming a ternary solid solution with the three components LiAlSi3O8, NaAlSi3O8 and CaAl2Si2O8, ignoring the K component due to its low concentration and slow diffusion coefficient while presuming Ca to be immobile (; Behrens et al., 1990; Giletti and Shanahan, 1997), the effective binary interdiffusion coefficient is given by Eq. (5) (derived after Lasaga, 1979; ignoring the thermodynamic factor because the anorthite content is effectively fixed):
Here and are the tracer diffusion coefficients of Li and Na, respectively. XLi and XNa are the molar fractions of the Li and Na endmembers in a ternary solid solution (). Due to the high concentration of Na relative to Li ( between 150 and 8000), we can assume XNa to be constant over the profile, and consequently no activity coefficient gradients need to be considered. For a detailed derivation of the equation, see File S2. For a detailed discussion about the influence of tracer diffusion coefficients and component fractions on the interdiffusion coefficient, see Costa et al. (2008) and Vogt et al. (2015).
Fitting our profiles using a numerical solution (explicit) to Fick's second law for one-dimensional diffusion (Eq. 6) reproduces the shape of the concentration profiles quite well. Since we have only measured chemical diffusion profiles, tracer diffusion coefficients for both Li and Na need to be used as fitting parameters, with the ratio influencing the shape of the profile. Here we use for the input of the Na tracer diffusion coefficient and for the input of the Li tracer diffusion coefficient. A comparison between the interdiffusion model and an error function approach is shown in Fig. 6. The error function approach misfits either the region close to the interface or the tail of the diffusion profile. The interdiffusion model yields a good fit for the entire profile, also reproducing the steep gradient near the interface.
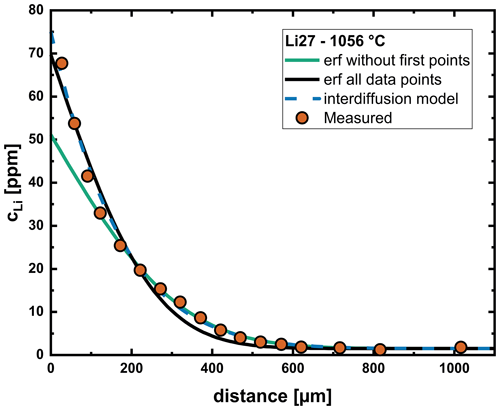
Figure 6Comparison of modeling with a constant diffusion coefficient (using an error function approach) and the interdiffusion model. Trying to fit the entire profile with an error function yields a systematic deviation from the measured profile in the region between 200–500 µm. If priority is placed on the tail of the profile, a large deviation from the measured data is obvious near the interface. The interdiffusion model yields a very good fit over the entire profile.
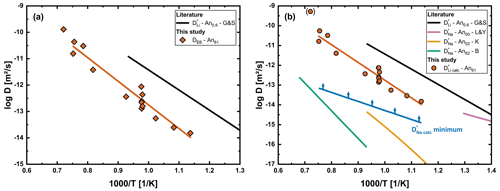
Figure 7(a) Effective binary interdiffusion coefficient (DEB) determined for the initial concentration of the corresponding sample. (b) Comparison of and with literature data. Literature data for tracer diffusion coefficients in plagioclase crystals are shown for Li An0.6 (G&S; Giletti and Shanahan, 1997) and Na An00 (L&Y; Lin and Yund, 1972), Na An02 (K; Kasper, 1975) and Na An62 (B; Behrens et al., 1990). Due to the large deviation from the general trend, Li21 is given in brackets and was not considered for the linear regression.
Results of the fitting of all Li diffusion profiles measured in plagioclase crystals are given in Fig. 7. Figure 7a shows DEB for the regions with low Li concentration. Tracer diffusion coefficients obtained by modeling are presented in Fig. 7b. For only minimum values are given, since further increasing these values has no influence on the profile. An important observation here is that derived values of are significantly faster than literature data for Na tracer diffusion (Kasper, 1975; Behrens et al., 1990), especially at lower temperatures. Is has been shown by Behrens et al. (1990) that labradorites of different volcanic origins have a similar extrinsically determined vacancy concentration on A1 sites. Therefore, the difference between their results and our calculated cannot simply be attributed to different origins of the crystals.
A possible explanation for the difference between and determined by Behrens et al. (1990) for various plagioclase crystals of composition An59 to An66 could be a more mobile interstitial Na species, as speculated by Schäffer et al. (2014) for K-feldspar. Schäffer et al. (2014) found that Na–K interdiffusion increases in the composition range and explained their observation with a more mobile interstitial Na species, which influences the bulk Na diffusivity more at lower Na concentration due to the fraction of this species at these concentrations. Due to the low concentration of Li in our samples it might be that Li mainly interdiffuses with this more mobile species. Additionally, the local charge imbalance by the in diffusion of Li onto an interstitial site would reduce the energy required for an Na atom to leave its position on an A1 site (the site which is typically occupied by Na in the plagioclase structure) nearby and, therefore, increase the mobility of this species. Consequently, we have to differentiate between Na located on interstitials and A1 sites.
We have shown an effective binary interdiffusion model to yield very good fits for the concentration profiles and consistent results for the diffusion coefficients (Fig. 7). However, this model fails at fitting concentration and isotope profiles (δ7LiIRMM-16) with the same set of parameters (Fig. 8). Either calculated δ7LiIRMM-16 profiles are longer than the measured profiles or β values (Eq. 1) are extremely high and inconsistent for experiments at different temperatures. Similar observations were made by Richter et al. (2014) (see Fig. 7 of Richter et al., 2014) for Li diffusion in clinopyroxene. One of their concentration profiles could still be fit very well using a single constant diffusion coefficient, but this approach clearly misfit the corresponding isotope profile. In this case, only a multispecies model was able to fit both the concentration profile and the isotope profile with the same set of parameters. Therefore, we infer that a simple interdiffusion model is not sufficient to describe Li diffusion in plagioclase.
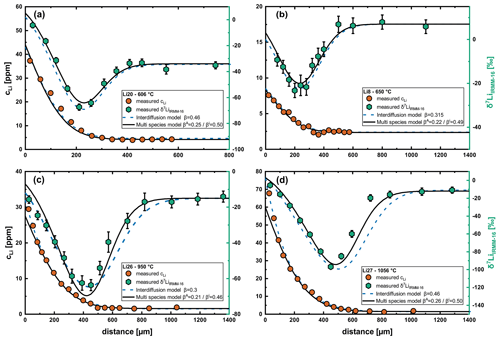
Figure 8Fits of diffusion profiles and isotope profiles for different temperatures comparing the interdiffusion with the multispecies model. (a) Run Li20, (b) run Li8, (c) run Li26 and (d) run Li27. While the interdiffusion model yields perfect fits for the concentration profiles, the isotope profiles cannot be reproduced at higher temperatures using this model, and β values are inconsistent over the range of analyzed temperatures. In contrast, the multispecies model perfectly fits the isotope profiles and yields very good fits for the concentration profiles. The β values are also very consistent for the multispecies model.
4.3 Multispecies diffusion model
As mentioned by Audétat et al. (2018), the steep rise near the interface of the concentration profile can be attributed to a fast and a slow diffusion process, as described in the model of Dohmen et al. (2010). Dohmen et al. (2010) proposed a model for Li diffusion in olivine based on the idea that Li occupies both octahedral and interstitial sites with the ability to jump between these two sites. Their model suggests that Li diffuses by means of an interstitial mechanism, and as soon as it encounters a vacant octahedral site, it gets trapped (Li in olivine strongly favors the octahedral site). In olivine, Li diffusing via a vacancy mechanism is slower than Li diffusing via an interstitial process by multiple orders of magnitude, leading to a propagating step function as the shape of the diffusion profile. However, the shape of the profile depends on the ratio of the diffusion coefficients and the boundary conditions. This has also been shown and discussed in more detail in other studies on Li diffusion in clinopyroxene (Richter et al., 2014) and olivine (Richter et al., 2017), which adopted the multispecies diffusion model of Dohmen et al. (2010).
We adopted the numerical model of Dohmen et al. (2010) considering the following kinetic processes:
- i.
diffusion of Li from one A1 site to another
- ii.
diffusion of Li from one interstitial site to another
- iii.
exchange between Li on interstitials and A1 sites.
All modeling was performed using MATLAB software.
In Sect. 4.4 we explain these processes while formulating a set of boundary conditions specific for plagioclase.
4.4 Boundary conditions for a multispecies diffusion in plagioclase
To apply the multispecies diffusion model to Li diffusion in plagioclase, we must first define the boundary conditions specific for plagioclase.
While it has already been suggested that Li in plagioclase diffuses via an interstitial mechanism (Giletti and Shanahan, 1997), the prominent location of Li in the feldspar structure remains unclear. For Na+ in feldspar, it has been suggested that a small proportion occupies interstitial sites, while the majority occupies A1 sites (Behrens et al., 1990; Schäffer et al., 2014). The significantly smaller H+ on the other hand has been shown to occupy only interstitial sites in sanidine, while the majority of hydrogen defects incorporated in plagioclase occupy A sites as H2O molecules (Behrens, 2021a, 2023). With the ionic radius of Li+ being smaller than that of Na+ (Shannon, 1976) and larger than that of H+, it can be assumed that a higher portion of the total Li concentration is located on the interstitials, while the remainder is located on the A1 sites, which are otherwise occupied by Na.
Using the Kröger–Vink notation, the interstitial Li species is represented by , the Li species occupying A1 is represented by and vacant A1 sites are represented by . The trapping of interstitial Li on vacant A1 sites is then described by a homogeneous point defect reaction, which is considered to be instantaneous compared to diffusion timescales:
with the corresponding mass action law
Here brackets indicate concentration per formula unit plagioclase. Assuming local concentrations of other elements to be constant on the timescale of Li diffusion and considering local mass and site balance yields the following equation for the total number of Li atoms per formula unit plagioclase (Litotal):
Here the subscript old denotes the concentrations obtained after the preceding diffusion time step, before site equilibration is achieved via Eq. (8).
To model the total flux of Li in our sample we need to consider the flux of both Li species and the interconversion reaction between the species (Eq. 7). We assume the diffusive flux of each species to be solely dependent on its own concentration gradient. In a more advanced version of this model the interdiffusion with other mobile species (Na) would need to be considered. This would, first, require knowledge of the tracer diffusion coefficient of Li in labradorite, of which there are no data available. Secondly, as discussed in Sect. 4.2 for interdiffusion with both Li species, we would probably need to consider two Na species with additional unknown parameters. To reduce the number of free parameters we therefore opted for a simplified approach where the diffusion coefficients of both Li species are considered to be constant. The change in concentration of both species is then given by the following equations:
where R is the time-dependent net rate of Li, which changes from interstitial to A1 sites.
Contrary to olivine, where diffusion of vacancies needs to be considered, the A1 vacancy concentration in labradorite is extrinsically controlled, probably by excess SiO2 (Behrens et al., 1990). It is of course possible for different ions to occupy this vacancy. However, due to the extremely slow diffusivity of Si in the plagioclase structure, this additional charge needs to be charge balanced within the vicinity of the excess Si4+ ion. For this, a divalent cation in the vicinity of the excess Si4+ needs to be replaced with two monovalent cations (one to occupy the site of the divalent cation and one to occupy the vacant site). Consequently, a net flux of vacancies can only occur with a net flux of divalent cations. This needs to happen on the timescale of Li diffusion. As shown in the overview of Cherniak (2010), divalent cations in plagioclase are significantly slower than Li and can be considered immobile on the timescale of Li diffusion. Since neither Si nor divalent cations are mobile enough to allow for a net flux of vacancies, we consider the initial vacancies to be immobile. As an input parameter for the initial vacancy concentration, we use the average vacancy concentration of three labradorite crystals determined by Behrens et al. (1990), which we consider to be representative of magmatic labradorite. As this value represents the fraction of vacant A1 sites (vacant A sites of the albite component), it needs to be multiplied by to get the A1 vacancy concentration per formula unit plagioclase. The A1 vacancy concentration relative to the whole crystal is then given by Eq. (12).
If we now assume that in diffusion of Li is only charge balanced by the diffusion of Na (as discussed in Sect. 4.2), one Na atom needs to leave its place in the local structure for each Li atom diffusing into the plagioclase structure. As discussed, this happens either by Na already present on interstitials or by Na bound to A1 sites, which can switch to an interstitial more easily due to the local charge imbalance caused by the diffusing Li ion. Due to rapid equilibration of Frenkel defects (Behrens et al., 1990), it follows that every Na leaving an interstitial site is directly replaced by an Na ion from an A1 site (assuming the total Na concentration does not change, which is justified due to the large ratio of 150 to 8000), leaving a vacancy. This means that every Li atom diffusing into the crystal, which does not occupy an A1 site, creates a vacancy on A1. However, for charge balance considerations, these vacancies can only diffuse with Li (in principle also with interstitial Na, but this is neglected due to its extremely low concentration). From these considerations it follows that there is no independent diffusion of vacancies (DV=0), and the vacancy concentration [] after each diffusion step is given by
Here [Li]total refers to the total amount of Li in our sample, while and refer to the sum of all Li isotopes occupying A1 and interstitial sites, respectively. The total number of A1 sites (A1sum) which are either vacant or occupied by Li is then given by
The concentration of Li occupying A1 sites after each time step is then given by the combination of Eqs. (8) and (13):
Li has the naturally occurring isotopes 6Li and 7Li. Therefore, the total number of lithium species increases to four: , , and . Using Eqs. (9), (13) and (15) with these four species yields the following set of equations, which need to be solved after each diffusion step:
Since we are considering two distinct diffusion processes, a corresponding β value must be assigned to each of them. The terms βi and βA refer to the interstitial and the vacancy mechanism, respectively. βA is unknown and therefore a fitting parameter when modeling the isotope profile. For a “pure” interstitial process, meaning the diffusing ion does not displace any A site atoms and being a simple uncorrelated interstitial process, βi is expected to be at 0.5 (Van Orman and Krawczynski, 2015). In our modeling βi is a fitting parameter, which provides information about the interaction of Li diffusion via interstitials with the plagioclase matrix.
4.5 Results from the multispecies model
Profiles were fitted using an “eye-fitting” method. This means that parameters were manually adjusted after each modeling run until a satisfactory result was achieved for both the concentration profile and the isotope profile. Here a deviation of 10 % in the diffusion coefficients already leads to a noticeable deviation from the measured isotope profile, although the effects on the concentration profile are less pronounced using this method. The width of the negative peak in the isotope profile is especially sensitive to the ratio of diffusion coefficients of Li species. Likewise, if βi, βA or K are varied by more than 10 % from the respective values given in Table 2, the modeled isotope profile strongly deviates from the measured isotope profile.
The problems with measuring concentration and isotope profiles for Li in the glasses meant we had to limit most evaluations to the crystal. To demonstrate that this approach is justified, we analyzed the entire profile (glass and crystal) of sample Li20 (606 °C), where we were able to get good measurements of concentration and isotope profiles in glass and crystal. We assumed a constant diffusion coefficient in the glass (when modeling the diffusion profile in the glass as Li–Na interdiffusion does not influence the parameters we obtain for the crystal) and applied the multispecies model to the crystal. The derivation of the mass balance boundary condition at the interface was done after Crank (1975) (Chap. 8.8) and is shown in the Supplement (File S3). Figure 9 shows the fit over the entire diffusion profile with input parameters for the multispecies model obtained by evaluation of only the crystal side of the diffusion couple experiment. This shows that it is justified to obtain diffusion coefficients by only evaluating the diffusion profile in the crystal.
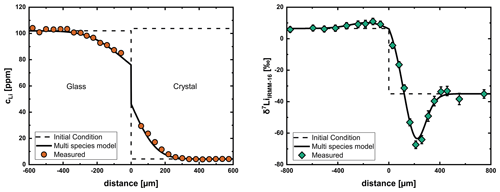
Figure 9Modeling of profiles of Li20 (606 °C) using a constant diffusion coefficient in the glass and the multispecies model in the crystal. Both concentration and isotope profiles can be fit well with input parameters obtained by evaluation of the crystal side without considering the glass. This shows that diffusion coefficients can be obtained only from the crystal side of the diffusion couple.
As described in Sect. 3, the temporal changes in the glass near the glass transition temperature affect the shape of the concentration profile. This leads to problems with the modeling of profiles at 700 and 750 °C, since the model does not take these processes into consideration. An example profile is shown for run Li7 in Fig. 10. As can be seen, the shape of the isotope profile can be reproduced well, while the concentration profile cannot be fitted properly. Samples at lower temperatures are probably not affected as much because these experiments were conducted well below the glass transition temperature. Run Li2 (807 °C) shows this effect to a much lower extent, which can be explained by the short duration of the experiment and the proximity to the glass transition temperature, where relaxation processes are already significantly faster. Since we do not have a good understanding of how the relaxation in the glass/melt affects the concentration profile, in a first approximation we have limited our fitting approach for these profiles to the isotope data. As shown in Fig. 11, diffusion coefficients from this evaluation are slightly slower than the general trend for the interstitial mechanism, while the results for the vacancy mechanism are very consistent with the general trend. For these reasons we consider this approach to be acceptable for the evaluation of diffusion coefficients.
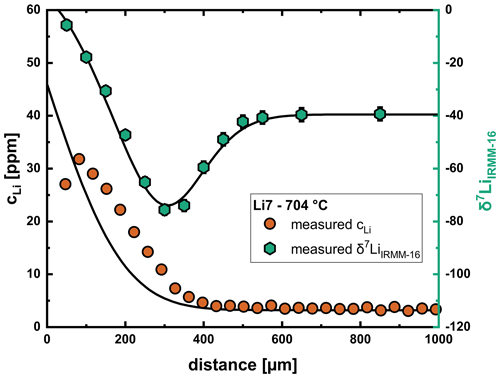
Figure 10Relaxation processes below the glass transition in the glass at 700–750 °C result in problems with fitting of the concentration profile, while the isotope profile can still be reproduced well with input parameters that are consistent with the overall trend for the diffusion coefficients.
Since the length of the diffusion profiles is determined by the diffusion coefficient of the faster process, in our case the interstitial process, the values of the interstitial diffusion coefficient are in good agreement with values estimated by the length of the lithium profile.
As shown in Fig. 8d, the multispecies model does not reproduce the steep gradient in the crystal near the interface observed in the temperature region of 1000–1114 °C. As discussed, this is the result of chemical diffusion of Li in labradorite being dependent on the interdiffusion with Na, which leads to decreased diffusivity at higher Li concentrations. This highlights the need for further investigation into this issue, i.e., at temperatures >1000 °C.
4.6 Temperature dependence of Li diffusion in the crystal
The diffusion coefficients of both mechanisms are reported in Table 2 and shown in an Arrhenius plot in Fig. 11. Equations (21) and (22) were determined by linear regression of the respective data.
The interstitial mechanism is faster by about 0.2–1 orders of magnitude, with the difference increasing with increasing temperature. The small difference in diffusion coefficients at lower temperatures explains why these profiles still fit well using an error function approach. There are multiple explanations why diffusivities of both processes are so close. First, the preference of Li for interstitial sites (small K; Eq. 8) means that the energy required to transition Li from an A1 site to an interstitial site is relatively low. Another explanation is that Li is charge balanced by Na, which of course applies to both mechanisms. If the difference between and is high enough, an increase in will not further increase DEB. This means that, even if the interstitial mechanism is significantly faster than the vacancy mechanism, interdiffusion with Na would slow down this mechanism to a level close to the vacancy mechanism.
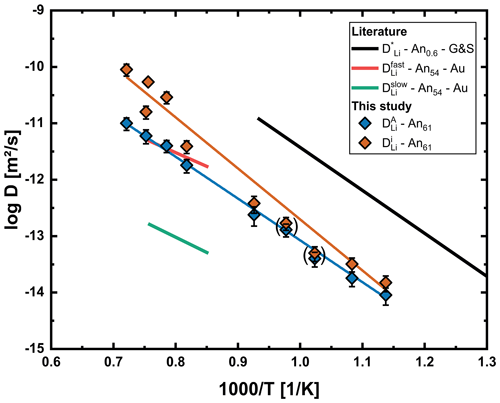
Figure 11Arrhenius plot with diffusion coefficients for the interstitial () and vacancy () process determined for our An61 crystals using the multispecies model. Diffusion coefficients for 700 and 750 °C are given in parentheses. Results for chemical diffusion of both processes are significantly slower than the tracer diffusion data of Giletti and Shanahan (1997) (G&S) for albite/anorthite and also differ significantly from both diffusion processes proposed by Audétat et al. (2018) (Au) for chemical diffusion in An54.
The different activation energy of the two processes can be attributed to the expansion of the plagioclase network with increasing temperature. We have two factors influencing the diffusivity of Li. One of the factors influencing diffusion is the bond distance on the corresponding sites. This is different for interstitial and A sites, and the change with temperature will also differ between A and interstitial sites. Consequently, the change in diffusivity with temperature, which is given by the activation energy, is also different for both processes.
4.7 Isotope fractionation
Evaluation of isotope profiles (n=9) with the multispecies model yields consistent values for and over the analyzed temperature range. This results in 6Li being faster by about 7.5 % on interstitials and 3.2 % on vacancies compared to 7Li in labradorite. Such a β value for the interstitial process is expected for a near-perfect interstitial mechanism, while the β value for the vacancy process is comparable for Li diffusing primarily via vacancies in olivine (3 %; Dohmen et al., 2010) and clinopyroxene (4 %; Richter et al., 2014). This value is also close to results in wet rhyolitic melt (2.7 %–3.5 %; Holycross et al., 2018; Spallanzani et al., 2022) and pegmatitic melt (3 %; Singer et al., 2023). It should be noted that Dohmen et al. (2010) and Richter et al. (2014) used a multispecies model but did not differentiate between βi and βA. Due to the extreme preference of Li for M sites in both olivine and clinopyroxene, their results for β should mainly reflect the vacancy process but might slightly overestimate the real value due to an influence of the interstitial process.
4.8 Li incorporation in the plagioclase structure
In addition to the knowledge already gained regarding the diffusion of Li, our modeling efforts also provide information about the position of Li in the labradorite structure. We established that Li in labradorite strongly prefers interstitial sites over A1 sites with a K of (see Eq. 8). This value is relatively constant over the analyzed temperature range and shows that the compatibility of Li on A1 sites hardly changes with increasing temperature. The final ratio over our analyzed diffusion profiles, however, is between 1 : 1 and 1 : 1.5 (Fig. 12). This is a result of the high vacancy concentration, as becomes apparent when rearranging Eqs. (8) to (23). It is noteworthy that the vacancy concentration is increased compared to the initial crystal by interaction with Li (see Eq. 13).
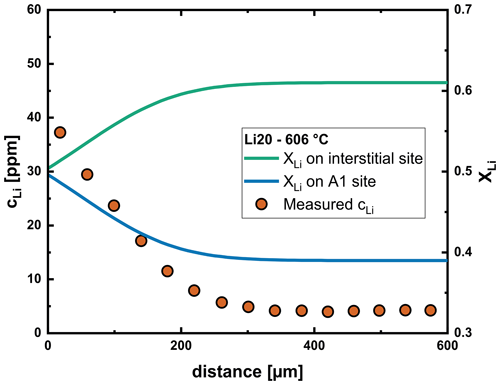
Figure 12Fraction of Li on interstitial and A1 sites along the profile determined from the multispecies model after the Li20 experiment, representative of our analyzed labradorite crystals. The vacancy concentration increases with increasing Li content, which increases the fraction of Li on A1 sites.
4.9 Li diffusion in the glass/melt
An unexpected observation of our experiments has been that the chemical diffusion profiles in crystals and glasses are of similar length. Giletti and Shanahan (1997) observed Li tracer diffusion in an albitic glass to be faster by ∼ 2 orders of magnitude compared to an albite crystal (they measured diffusion at only one temperature in Ab96 glass, which fits the more comprehensive data of Jambon and Semet, 1978, for pure albitic glass). As mentioned before, our model assumes Li to interdiffuse with Na. Consequently, diffusion in the glass would need to be treated as Li–Na interdiffusion, with the effective binary interdiffusion coefficient given by Eq. (5). If we now assume in the glass to be ∼ 1–2 orders of magnitude faster than in the crystal, DEB in the glass is controlled solely by changes in (for a detailed description of how DEB depends on the tracer diffusion coefficients of both elements, see Fig. 2 of Vogt et al., 2015). Chemical diffusion coefficients determined using an error function approach are given in Fig. 13a, and determined from the chemical diffusion profile using Eq. (5) is given in Fig. 13b.
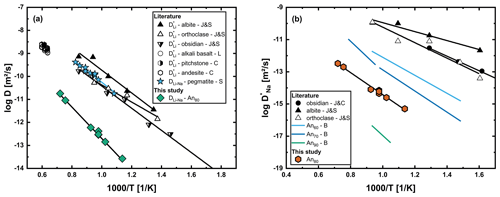
Figure 13(a) Li–Na interdiffusion coefficients (DLi–Na) determined from chemical diffusion profiles in An80 glass in comparison to the literature. Li tracer diffusion data are given for glasses of albite, orthoclase and obsidian composition (J&S; Jambon and Semet, 1978), as well as alkali basalt melt (L; Lowry et al., 1981), andesitic melt and pitchstone melt (C; Cunningham et al., 1983). In contrast to our data, Li–Na interdiffusion in pegmatitic glasses and melt (S; Singer et al., 2023) fits Li tracer diffusion data for multiple compositions. (b) Tracer diffusion coefficient for Na in the glass determined indirectly by modeling the Li profiles. Na tracer diffusion coefficients for albite, orthoclase (J&S; Jambon and Semet, 1978) and obsidian (J&C; Jambon and Carron, 1976), as well as for multiple plagioclase glasses with varying An contents (B; Behrens, 1992), are taken from the literature. Our results fall into the range between An70 and An90 glasses of Behrens (1992). The error bars of our data are smaller than the points in both graphs.
Our results for DLi–Na are slower than tracer diffusion data for Li in glasses and melts by about 2–3 orders of magnitude. One important observation here is that the data set of Singer et al. (2023) fits the tracer diffusion data from the literature, even though they also measured chemical diffusion (interdiffusion with Na). The difference here is that in rhyolitic glasses and melts, the tracer diffusivities of Li and Na are comparable, while tracer diffusivity of Na in plagioclase glasses and melts drastically decreases towards high An contents (Behrens, 1992). A comparison with Behrens (1992) shows our determined values of for a glass of An80 composition to be between their results for an An70 and an An90 glass. As discussed by Behrens (1992), a quantitative description of the compositional dependence of in Ab–An glass suffers from the unknown thermal history of the glasses. Nevertheless, the modeled values of based on our Li–Na interdiffusion experiments are in very good agreement with the compositional trend reported in Behrens (1992).
The Arrhenius relations for DLi–Na and are given in Eqs. (24) and (25), respectively. It should be noted that the equation for DLi–Na is for a glass/melt containing roughly 100 ppm Li. Due to its dependence on , DLi–Na would increase with decreasing Li concentration.
From these findings, we can conclude that migration of Li in plagioclase glasses and melts, in contrast to, for example, rhyolitic systems, is slowed down by interdiffusion with Na. Therefore, the tracer diffusion coefficient of Li in plagioclase cannot simply be used to determine timescales from Li diffusion profiles in natural melts and glasses, but the interdiffusion with Na must be taken into consideration. For example, applying the tracer diffusion coefficient of Jambon and Semet (1978) for Li diffusion in albitic glasses to our data would lead to an underestimation of timescales by 3 orders of magnitude.
These results further support our assumption that Li diffusion into the crystal is charge balanced by out diffusion of Na.
4.10 Dependence on pressure
We also performed experiments at 1 atm (horizontal tube furnace), 50 MPa (RH/RQ CSPV) and 400 MPa (IHPV) at 750 °C to constrain the effect of pressure on Li diffusivity. As mentioned above, at this temperature, relaxation processes in the glass influenced the diffusion profile in a way that we cannot use the multispecies model to fit the concentration profiles. However, as shown for example in Fig. 10, the length of the diffusion profile fits the length expected from the interstitial diffusion coefficient (the faster diffusion coefficient determines the length of the diffusion profile). Consequently, we used values determined from the length of the profiles, i.e., fitting the tail of the profile with an error function approach, and plotted these against pressure in Fig. 14. Even though a slightly positive trend may be inferred from the data, we do not consider this to be a resolvable pressure effect. The errors in individual measurements are quite high and are further increased due to the employment of different experimental facilities, which introduced additional uncertainties. A further complication may be possible formation of microcracks in the high-pressure experiments, which may enhance Li diffusion. Due to the small ionic radius of Li, only a very weak pressure effect is expected. Typically, the activation volume for cation diffusion is similar to the volume of the cation (e.g., Ryan and Smedley, 1984; Imre et al., 2007; Mehrer, 2007). Calculating the expected difference in diffusivities between 1 atm and 400 MPa for an activation volume of 1.1 cm3 mol−1 (calculated from an ionic radius of 0.76 Å in a VI coordination; Shannon, 1976) yields a decrease in diffusivity by only 0.03 log units, which is significantly lower than the error in measurements and significantly lower than the apparent increase we observe for our data.
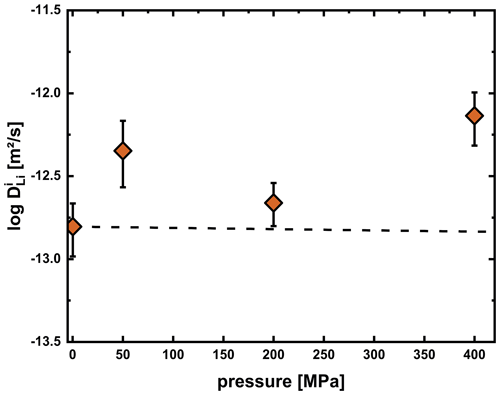
Figure 14Li diffusion coefficients for the interstitial process in the plagioclase crystal of experiments at 750 °C and varying pressure. The dashed line represents the expected pressure effect calculated assuming that the activation volume equals the ionic volume of Li. The apparent positive trend is probably due to the employment of different experimental facilities (1 atm furnace at 1 atm, RH/RQ CSPV at 50 and 200 MPa, and IHPV at 400 MPa) for the experiments and the formation of microcracks.
4.11 Comparison to previous studies
We were able to verify the two diffusion processes suggested by Audétat et al. (2018) and proposed a model that reproduces concentration and isotope profiles while providing an explanation of the physical process. The problem we faced when trying to fit their profiles using the model we described is that the core of their crystals is already enriched in Li compared to the initial concentration (ZL31 increased from 2 to >70 ppm; ZL32 and ZL36 increased from 2 to ∼ 35–40 ppm). The increased core concentration shows that diffusion has already reached the center of the crystal. Due to the rectangular shape of the samples and their experimental setups being crystals surrounded by a powder as the Li source, the diffusive flux of Li needs to be considered from three directions when the flux has reached the core region of the crystal. Evaluating their profiles would therefore require three-dimensional modeling of the diffusion process as modeling by a one-dimensional model underestimates the diffusive flux. We do not aim to simulate this effect since exact dimensions for the crystals are also not available. The modeling approach of Audétat et al. (2018) is based on diffusion in one-dimensional semi-infinite media, causing their obtained diffusion coefficients to be too small. Consequently, by ignoring the three-dimensional flux, as well as the increased core concentration, the results of Audétat et al. (2018) are slower for both processes than our determined diffusion coefficients, but we cannot evaluate if this effect fully explains these discrepancies between the data sets.
Comparison of our chemical diffusion results with the tracer diffusion data of Giletti and Shanahan (1997) shows their data to be clearly unsuitable for describing chemical diffusion of Li in An61 plagioclase. This is either due to Li diffusion in An61 plagioclase being generally slower than in albite/anorthite or because interdiffusion with Na slows down chemical diffusion of Li. Since no diffusion profiles for Li are shown in their study we cannot evaluate if profiles at or close to their highest temperature show any signs of a second diffusion mechanism, as observed by Audétat et al. (2018) and our study. Since they only conducted experiments up to 800 °C and our data show that diffusion coefficients of both processes are still very close at these conditions, a second process would not have been obvious from the concentration profile.
Studies with the aim to determine timescales of geological processes from Li diffusion profiles have been carried out on natural plagioclases of multiple compositions ranging from oligoclase (An17–31; Neukampf et al., 2021) to andesine (An30–42; Charlier et al., 2012) and bytownite (An72–90; Giuffrida et al., 2018). Based on our results, Li diffusion is already slowed down by Na for Li concentrations in the range of 20–30 ppm, even if we assume the tracer diffusion coefficient to be independent of plagioclase composition. It is therefore likely that timescales of volcanic processes have been underestimated when using the tracer diffusion coefficient of Giletti and Shanahan (1997). For example, if we fit our experimental profiles using their diffusion coefficient, we underestimate the time of our conducted experiments by a factor of 20. It should be mentioned that this is the case for in diffusion of Li, while Li typically diffuses out of the crystal during magma ascent. We cannot exclude that Fe plays a role in charge balancing out diffusion of Li, since oxidation of Fe2+ is far easier than reduction of Fe3+ (Behrens et al., 1990). If this process does play a role during out diffusion of Li, it might provide a faster charge balance mechanism than interdiffusion with Na, therefore increasing the chemical diffusion coefficient of Li under these conditions.
One way to avoid having to deal with modeling of two diffusion processes for natural samples is to use the interstitial diffusion coefficient of Li and determine the timescale from just the length of the diffusion profile. This approach works well since the length of the profile is only dependent on the fastest process.
We successfully adopted the multispecies diffusion model of Dohmen et al. (2010) and derived a set of boundary conditions for a diffusion couple consisting of plagioclase crystal/glass to model chemical diffusion profiles in labradorite. Our findings reveal multiple important points for Li diffusion modeling in plagioclase crystals and glasses:
- i.
We confirmed the observation of Audétat et al. (2018) regarding two diffusion mechanisms of Li and provided an explanation of the physical processes. We propose that Li diffuses via a fast (interstitial) and a slower (vacancy) mechanism. Over our analyzed temperature range, the diffusivity of both processes is within 1 order of magnitude. However, our results suggest that Li diffusion coefficients have been underestimated by Audétat et al. (2018) because of an inadequate modeling procedure used to obtain DLi.
- ii.
Chemical diffusion of Li in labradorite is slower by 1.5–2 orders of magnitude compared to that predicted using the tracer diffusion coefficient for albite/anorthite determined by Giletti and Shanahan (1997). Consequently, using their diffusion coefficient for natural labradorite crystals will lead to underestimation of timescales by a factor of 20.
- iii.
It is likely that a highly mobile interstitial Na species provides charge balance for the in diffusion of Li. Our results imply that the mobility of Na is enhanced by incorporation of Li. This needs to be investigated in detail in future studies, as it results in a concentration dependence for diffusion of Li.
- iv.
Li prefers interstitial sites, but due to the high vacancy concentration in labradorite, Li is nearly evenly distributed between interstitial and A1 sites.
- v.
In comparison to other aluminosilicates, Li–Na interdiffusion in high-An plagioclase glasses and melts is slowed down by the relatively low diffusivity of Na.
Our findings show that Li diffusion in plagioclase is still not completely understood. More work needs to be done to understand interdiffusion of Li with Na and a possible dependence of Li diffusivity on the An content. Li diffusion experiments over a range of An contents in particular would be important from this perspective. It is also necessary to check if there is a difference between the in diffusion and out diffusion of Li, as the oxidation state of Fe and thus oxygen fugacity might play a role. For such experiments, chemically homogeneous plagioclase single crystals of gem quality with high Li contents are necessary, which are extremely hard to find. Another possibility may be presaturation of plagioclase crystals with Li. Additionally, the dependence on the vacancy concentration shows that conditions of crystallization and their impact on the initial vacancy concentration are also an important parameter. At the moment, there are only data available for labradorite (Behrens et al., 1990), and extension of this data set to other plagioclase compositions is required. Additionally, our results are not transferable to plagioclase crystals formed under metamorphic conditions. Here a much lower extrinsic vacancy concentration is expected.
All data are either shown in the paper or given in the Supplement.
The supplement related to this article is available online at: https://doi.org/10.5194/ejm-36-985-2024-supplement.
FP: formal analysis, investigation, methodology, software, visualization, writing (original draft preparation), data curation. MO: investigation, writing (review and editing). FM: investigation, writing (review and editing). RD: funding acquisition, software, methodology, supervision, writing (review and editing). HB: resources, funding acquisition, methodology, supervision, writing (review and editing).
The contact author has declared that none of the authors has any competing interests.
Publisher's note: Copernicus Publications remains neutral with regard to jurisdictional claims made in the text, published maps, institutional affiliations, or any other geographical representation in this paper. While Copernicus Publications makes every effort to include appropriate place names, the final responsibility lies with the authors.
This article is part of the special issue “Probing the Earth: experiments on and for our planet”. It is a result of the EMPG 2023 conference, Milan, Italy, 12–15 June 2023.
The authors thank Julian Feige for preparation of experimental samples for measurements. Special thanks go to Stephan Klemme and Daniele Cherniak for their constructive and thoughtful reviews of our paper and to Simone Tumiati for editorial handling. The research was supported by the researcher unit FOR 2881 of the German Research Foundation (DFG).
This research has been supported by the Deutsche Forschungsgemeinschaft within the research unit FOR 2881 (grant nos. BE1720/44-1, DO 777/8-1, WE2850/19-1 and HO1337/47).
The publication of this article was funded by the open-access fund of Leibniz Universität Hannover.
This paper was edited by Simone Tumiati and reviewed by Stephan Klemme and Daniele Cherniak.
Audétat, A., Zhang, L., and Ni, H.: Copper and Li diffusion in plagioclase, pyroxenes, olivine and apatite, and consequences for the composition of melt inclusions, Geochim. Cosmochim. Ac., 243, 99–115, https://doi.org/10.1016/j.gca.2018.09.016, 2018.
Behrens, H.: Na and Ca tracer diffusion in plagioclase glasses and supercooled melts, Chem. Geol., 96, 267–275, 1992.
Behrens, H.: Hydrogen defects in feldspars: defect properties and implications for water solubility in feldspar, Phys. Chem. Miner., 48, 8, https://doi.org/10.1007/s00269-020-01128-0, 2021a.
Behrens, H.: Hydrogen defects in feldspars: kinetics of D/H isotope exchange and diffusion of hydrogen species in alkali feldspars, Phys. Chem. Miner., 48, 1–23, 2021b.
Behrens, H.: Hydrogen defects in feldspars: alkali-supported dehydrogenation of sanidine, Phys. Chem. Miner., 50, 18, https://doi.org/10.1007/s00269-023-01242-9, 2023.
Behrens, H., Johannes, W., and Schmalzried, H.: On the Mechanisms of Cation Diffusion Processes in Ternary Feldspars, Phys. Chem. Miner., 17, 62–78, https://doi.org/10.1007/BF00209227, 1990.
Berndt, J., Liebske, C., Holtz, F. o., Freise, M., Nowak, M., Ziegenbein, D., Hurkuck, W., and Koepke, J.: A combined rapid-quench and H2-membrane setup for internally heated pressure vessels: Description and application for water solubility in basaltic melts, Am. Mineral., 87, 1717–1726, 2002.
Chakraborty, S. and Dohmen, R.: Diffusion chronometry of volcanic rocks: looking backward and forward, B. Volcanol., 84, 1–9, 2022.
Charlier, B. L. A., Morgan, D. J., Wilson, C. J. N., Wooden, J. L., Allan, A. S. R., and Baker, J. A.: Lithium concentration gradients in feldspar and quartz record the final minutes of magma ascent in an explosive supereruption, Earth Planet. Sc. Lett., 319–320, 218–227, https://doi.org/10.1016/j.epsl.2011.12.016, 2012.
Cherniak, D. J.: Silicon self-diffusion in single-crystal natural quartz and feldspar, Earth Planet. Sc. Lett., 214, 655–668, https://doi.org/10.1016/S0012-821X(03)00394-7, 2003.
Cherniak, D. J.: Cation Diffusion in Feldspars, Rev. Mineral. Geochem., 72, 691–733, https://doi.org/10.2138/rmg.2010.72.15, 2010.
Costa, F., Dohmen, R., and Chakraborty, S.: Time scales of magmatic processes from modeling the zoning patterns of crystals, Rev. Mineral. Geochem., 69, 545–594, 2008.
Crank, J.: The mathematics of diffusion, 2nd edn., reprinted, Oxford science publications, Oxford University Press, Oxford, ISBN 0198533446, 1975.
Cunningham, G., Henderson, P., Lowry, R., Nolan, J., Reed, S., and Long, J.: Lithium diffusion in silicate melts, Earth Planet. Sc. Lett., 65, 203–205, 1983.
Dohmen, R., Kasemann, S. A., Coogan, L., and Chakraborty, S.: Diffusion of Li in olivine. Part I: Experimental observations and a multi species diffusion model, Geochim. Cosmochim. Ac., 74, 274–292, https://doi.org/10.1016/j.gca.2009.10.016, 2010.
Giletti, B. J. and Shanahan, T. M.: Alkali diffusion in plagioclase feldspar, Chem. Geol., 139, 3–20, https://doi.org/10.1016/S0009-2541(97)00026-0, 1997.
Giuffrida, M., Viccaro, M., and Ottolini, L.: Ultrafast syn-eruptive degassing and ascent trigger high-energy basic eruptions, Sci. Rep., 8, 147, https://doi.org/10.1038/s41598-017-18580-8, 2018.
Grove, T. L., Baker, M. B., and Kinzler, R. J.: Coupled CaAl-NaSi diffusion in plagioclase feldspar: Experiments and applications to cooling rate speedometry, Geochim. Cosmochim. Ac., 48, 2113–2121, https://doi.org/10.1016/0016-7037(84)90391-0, 1984.
Holycross, M., Watson, E., Richter, F., and Villeneuve, J.: Diffusive fractionation of Li isotopes in wet, highly silicic melts, Geochemical Perspectives Letters, 6, 39–42, 2018.
Horn, I. and von Blanckenburg, F.: Investigation on elemental and isotopic fractionation during 196 nm femtosecond laser ablation multiple collector inductively coupled plasma mass spectrometry, Spectrochim. Acta B, 62, 410–422, 2007.
Horn, I., von Blanckenburg, F., Schoenberg, R., Steinhoefel, G., and Markl, G.: In situ iron isotope ratio determination using UV-femtosecond laser ablation with application to hydrothermal ore formation processes, Geochim. Cosmochim. Ac., 70, 3677–3688, 2006.
Hummel, W. and Arndt, J.: Variation of viscosity with temperature and composition in the plagioclase system, Contrib. Mineral. Petr., 90, 83–92, 1985.
Imre, A., Staesche, H., Voss, S., Ingram, M. D., Funke, K., and Mehrer, H.: Pressure-dependent diffusion coefficients and haven ratios in cation-conducting glasses, J. Phys. Chem. B, 111, 5301–5307, 2007.
Jambon, A. and Carron, J.-P.: Diffusion of Na, K, Rb and Cs in glasses of albite and orthoclase composition, Geochim. Cosmochim. Ac., 40, 897–903, 1976.
Jambon, A. and Semet, M. P.: Lithium diffusion in silicate glasses of albite, orthoclase, and obsidian composition: an ion-microprobe determination, Earth Planet. Sc. Lett., 37, 445–450, 1978.
Jochum, K. P., Nohl, U., Rothbarth, N., Schwager, B., Stoll, B., and Weis, U.: Geostandards and Geoanalytical Research Bibliographic Review 2011, Geostand. Geoanal. Res., 36, 415–419, https://doi.org/10.1111/j.1751-908X.2012.00221.x, 2012.
Kasper, R. B.: Cation and oxygen diffusion in albite, PHD Dissertation, Brown University, ISBN 9798660873171, 1975.
Lasaga, A. C.: Multicomponent exchange and diffusion in silicates, Geochim. Cosmochim. Ac., 43, 455–469, 1979.
Lin, T.-H. and Yund, R.: Potassium and sodium self-diffusion in alkali feldspar, Contrib. Mineral. Petr., 34, 177–184, 1972.
Lowry, R., Reed, S., Nolan, J., Henderson, P., and Long, J.: Lithium tracer-diffusion in an alkali-basaltic melt – An ion-microprobe determination, Earth Planet. Sc. Lett., 53, 36–40, 1981.
Matthews, W., Linnen, R. L., and Guo, Q.: A filler-rod technique for controlling redox conditions in cold-seal pressure vessels, Am. Mineral., 88, 701–707, 2003.
Mehrer, H.: Diffusion in Solids, Springer Series in Solid-State Sciences, Springer Science & Business Media, ISBN 354071488X, 2007.
Neukampf, J., Ellis, B. S., Laurent, O., Steinmann, L., Ubide, T., Oeser, M., Magna, T., Weyer, S., and Bachmann, O.: Time scales of syneruptive volatile loss in silicic magmas quantified by Li isotopes, Geology, 49, 125–129, 2021.
Richter, F. M., Liang, Y., and Davis, A. M.: Isotope fractionation by diffusion in molten oxides, Geochim. Cosmochim. Ac., 63, 2853–2861, 1999.
Richter, F., Watson, B., Chaussidon, M., Mendybaev, R., and Ruscitto, D.: Lithium isotope fractionation by diffusion in minerals. Part 1: Pyroxenes, Geochim. Cosmochim. Ac., 126, 352–370, 2014.
Richter, F., Chaussidon, M., Bruce Watson, E., Mendybaev, R., and Homolova, V.: Lithium isotope fractionation by diffusion in minerals Part 2: Olivine, Geochim. Cosmochim. Ac., 219, 124–142, https://doi.org/10.1016/j.gca.2017.09.001, 2017.
Ryan, M. J. and Smedley, S. I.: The effect of pressure on fast ion conductivity in glasses, J. Non-Cryst. Solids, 65, 29–37, 1984.
Schäffer, A.-K., Petrishcheva, E., Habler, G., Abart, R., Rhede, D., and Giester, G.: Sodium-potassium interdiffusion in potassium-rich alkali feldspar II: Composition-and temperature-dependence obtained from cation exchange experiments, Am. J. Sci., 314, 1300–1318, 2014.
Shannon, R.: Revised effective ionic radii and systematic studies of interatomic distances in halides and chalcogenides, Acta Crystallogr. A, 32, 751–767, https://doi.org/10.1107/S0567739476001551, 1976.
Singer, C. R., Behrens, H., Horn, I., Oeser, M., Dohmen, R., and Weyer, S.: Li–Na interdiffusion and diffusion-driven lithium isotope fractionation in pegmatitic melts, Eur. J. Mineral., 35, 1009–1026, https://doi.org/10.5194/ejm-35-1009-2023, 2023.
Spallanzani, R., Koga, K. T., Cichy, S. B., Wiedenbeck, M., Schmidt, B. C., Oelze, M., and Wilke, M.: Lithium and boron diffusivity and isotopic fractionation in hydrated rhyolitic melts, Contrib. Mineral. Petr., 177, 74, https://doi.org/10.1007/s00410-022-01937-2, 2022.
Steinmann, L. K., Oeser, M., Horn, I., Seitz, H.-M., and Weyer, S.: In situ high-precision lithium isotope analyses at low concentration levels with femtosecond-LA-MC-ICP-MS, J. Anal. Atom. Spectrom., 34, 1447–1458, 2019.
Turner, S. and Costa, F.: Measuring timescales of magmatic evolution, Elements, 3, 267–272, 2007.
Van Orman, J. A. and Krawczynski, M. J.: Theoretical constraints on the isotope effect for diffusion in minerals, Geochim. Cosmochim. Ac., 164, 365–381, 2015.
Vogt, K., Dohmen, R., and Chakraborty, S.: Fe-Mg diffusion in spinel: New experimental data and a point defect model, Am. Mineral., 100, 2112–2122, 2015.


