the Creative Commons Attribution 4.0 License.
the Creative Commons Attribution 4.0 License.
 | 30 Aug 2024
The composition of metapelitic biotite, white mica, and chlorite: a review with implications for solid-solution models
Benoît Dubacq
Jacob B. Forshaw
Biotite, white mica, and chlorite record petrological processes and pressure–temperature conditions. Unfortunately, their crystal chemistry is complicated and thermodynamic modelling of their phase relations is hindered by this complexity. This article reviews the main atomic substitutions in metapelitic biotite, white mica, and chlorite and their relevance to mixing models. A database of chemical analyses, including major cation content, iron speciation, and H2O content of metapelitic biotite, white mica, and chlorite, is used together with a series of analyses of white mica and chlorite of metamorphic origin and a compilation of crystal structures of biotite. Emphasis is first placed on the calculation of formula units and the effect of anionic bases, which may vary considerably from their ideal values in biotite and chlorite. The analytical precision of volatile components remains of first-order importance for establishing formula units, with most phyllosilicates showing significant excess or depletion of structural water if measurements are taken at face value. When analysis is conducted by electron microprobe, as is frequent in mineralogy and metamorphic petrology, normalization to a hypothetical anionic base appears optimal in biotite if deprotonation after Ti incorporation is accounted for. For chlorite and white mica, ideal anionic bases may be used in the absence of alternatives. As for iron speciation, assuming a fixed anionic basis has consequences for calculated octahedral sums and, in turn, the extent of the di-trioctahedral substitution. Despite these uncertainties, the di-trioctahedral substitution is important in all three phyllosilicate types. Other significant exchange vectors include K–Na exchange in mica and Tschermak, Fe2+–Mg, and Al–Fe3+ exchanges in all three phyllosilicates. Low interlayer contents in mica are best modelled as solid solutions towards minerals with cation-free interlayer spaces, such as pyrophyllite for white mica and talc for biotite. Elemental ratios are useful for the graphical representation of electron microprobe measurements as they do not require normalization to anionic bases.
Cation site distribution schemes are important for thermodynamic modelling. This study reviews classical approaches, highlighting possible improvements and offering a simplified allocation scheme for tetrahedral Si–Al ordering applicable prior to thermodynamic modelling. A set of independent compositional end-members is proposed for all three phyllosilicates, and the need for systematic studies of the presence of tetrahedral Fe3+ in metamorphic phyllosilicates is highlighted. The database is provided in the Supplement with spreadsheets for formula unit calculation, cation site distribution schemes, and visualization of compositional data.
- Article
(9446 KB) - Full-text XML
-
Supplement
(3559 KB) - BibTeX
- EndNote


Phyllosilicates serve as valuable petrological tracers, with mica and chlorite having been used for decades in geothermobarometry. Dioctahedral and trioctahedral micas are choice targets for petrochronology through radiochronometric dating (typically and dating). Modelling the phase relations of phyllosilicates is also important for understanding rheology because the presence of phyllosilicates can significantly influence rock strength, strain localization, and shear zone development (e.g. Gueydan et al., 2003; Airaghi et al., 2020; Alaoui et al., 2023). The structure of phyllosilicates allows for many cation exchanges within tetrahedral and octahedral sheets (containing varying amounts of hydroxyl groups) and in the interlayer sites of micas. In metamorphosed pelitic sediment, it is commonly assumed that the distribution coefficient of Mg and Fe between garnet and biotite () increases with metamorphic grade (e.g. Thompson, 1957; Lyons and Morse, 1970) together with the Ti content of micas (Kwak, 1968; Guidotti et al., 1977), that the Si content of phengitic mica increases with pressure (e.g. Velde, 1965; Massonne and Schreyer, 1987), and that the Al content of low-temperature chlorite increases with temperature (e.g. Cathelineau and Nieva, 1985). Whilst thermodynamic modelling is capable of reproducing such compositional variations, the abundance of substitutions in phyllosilicates complicates rationalization. In very-low-grade rocks, the picture is further obscured by the small size of phyllosilicates and their frequent interlayering, requiring transmission electron microscopy (e.g. Nieto, 2002; Abad et al., 2006). With protracted debates stemming from analytical difficulties, the petrological relevance of some substitutions remains uncertain, especially those involving vacancies and variable iron speciation. Consequently, current thermodynamic models often predict unrealistic compositional variations with changing pressure and temperature (see, for example, Fig. 4C of Waters, 2019; Forshaw and Pattison, 2021, 2023a; Dubacq et al., 2023).
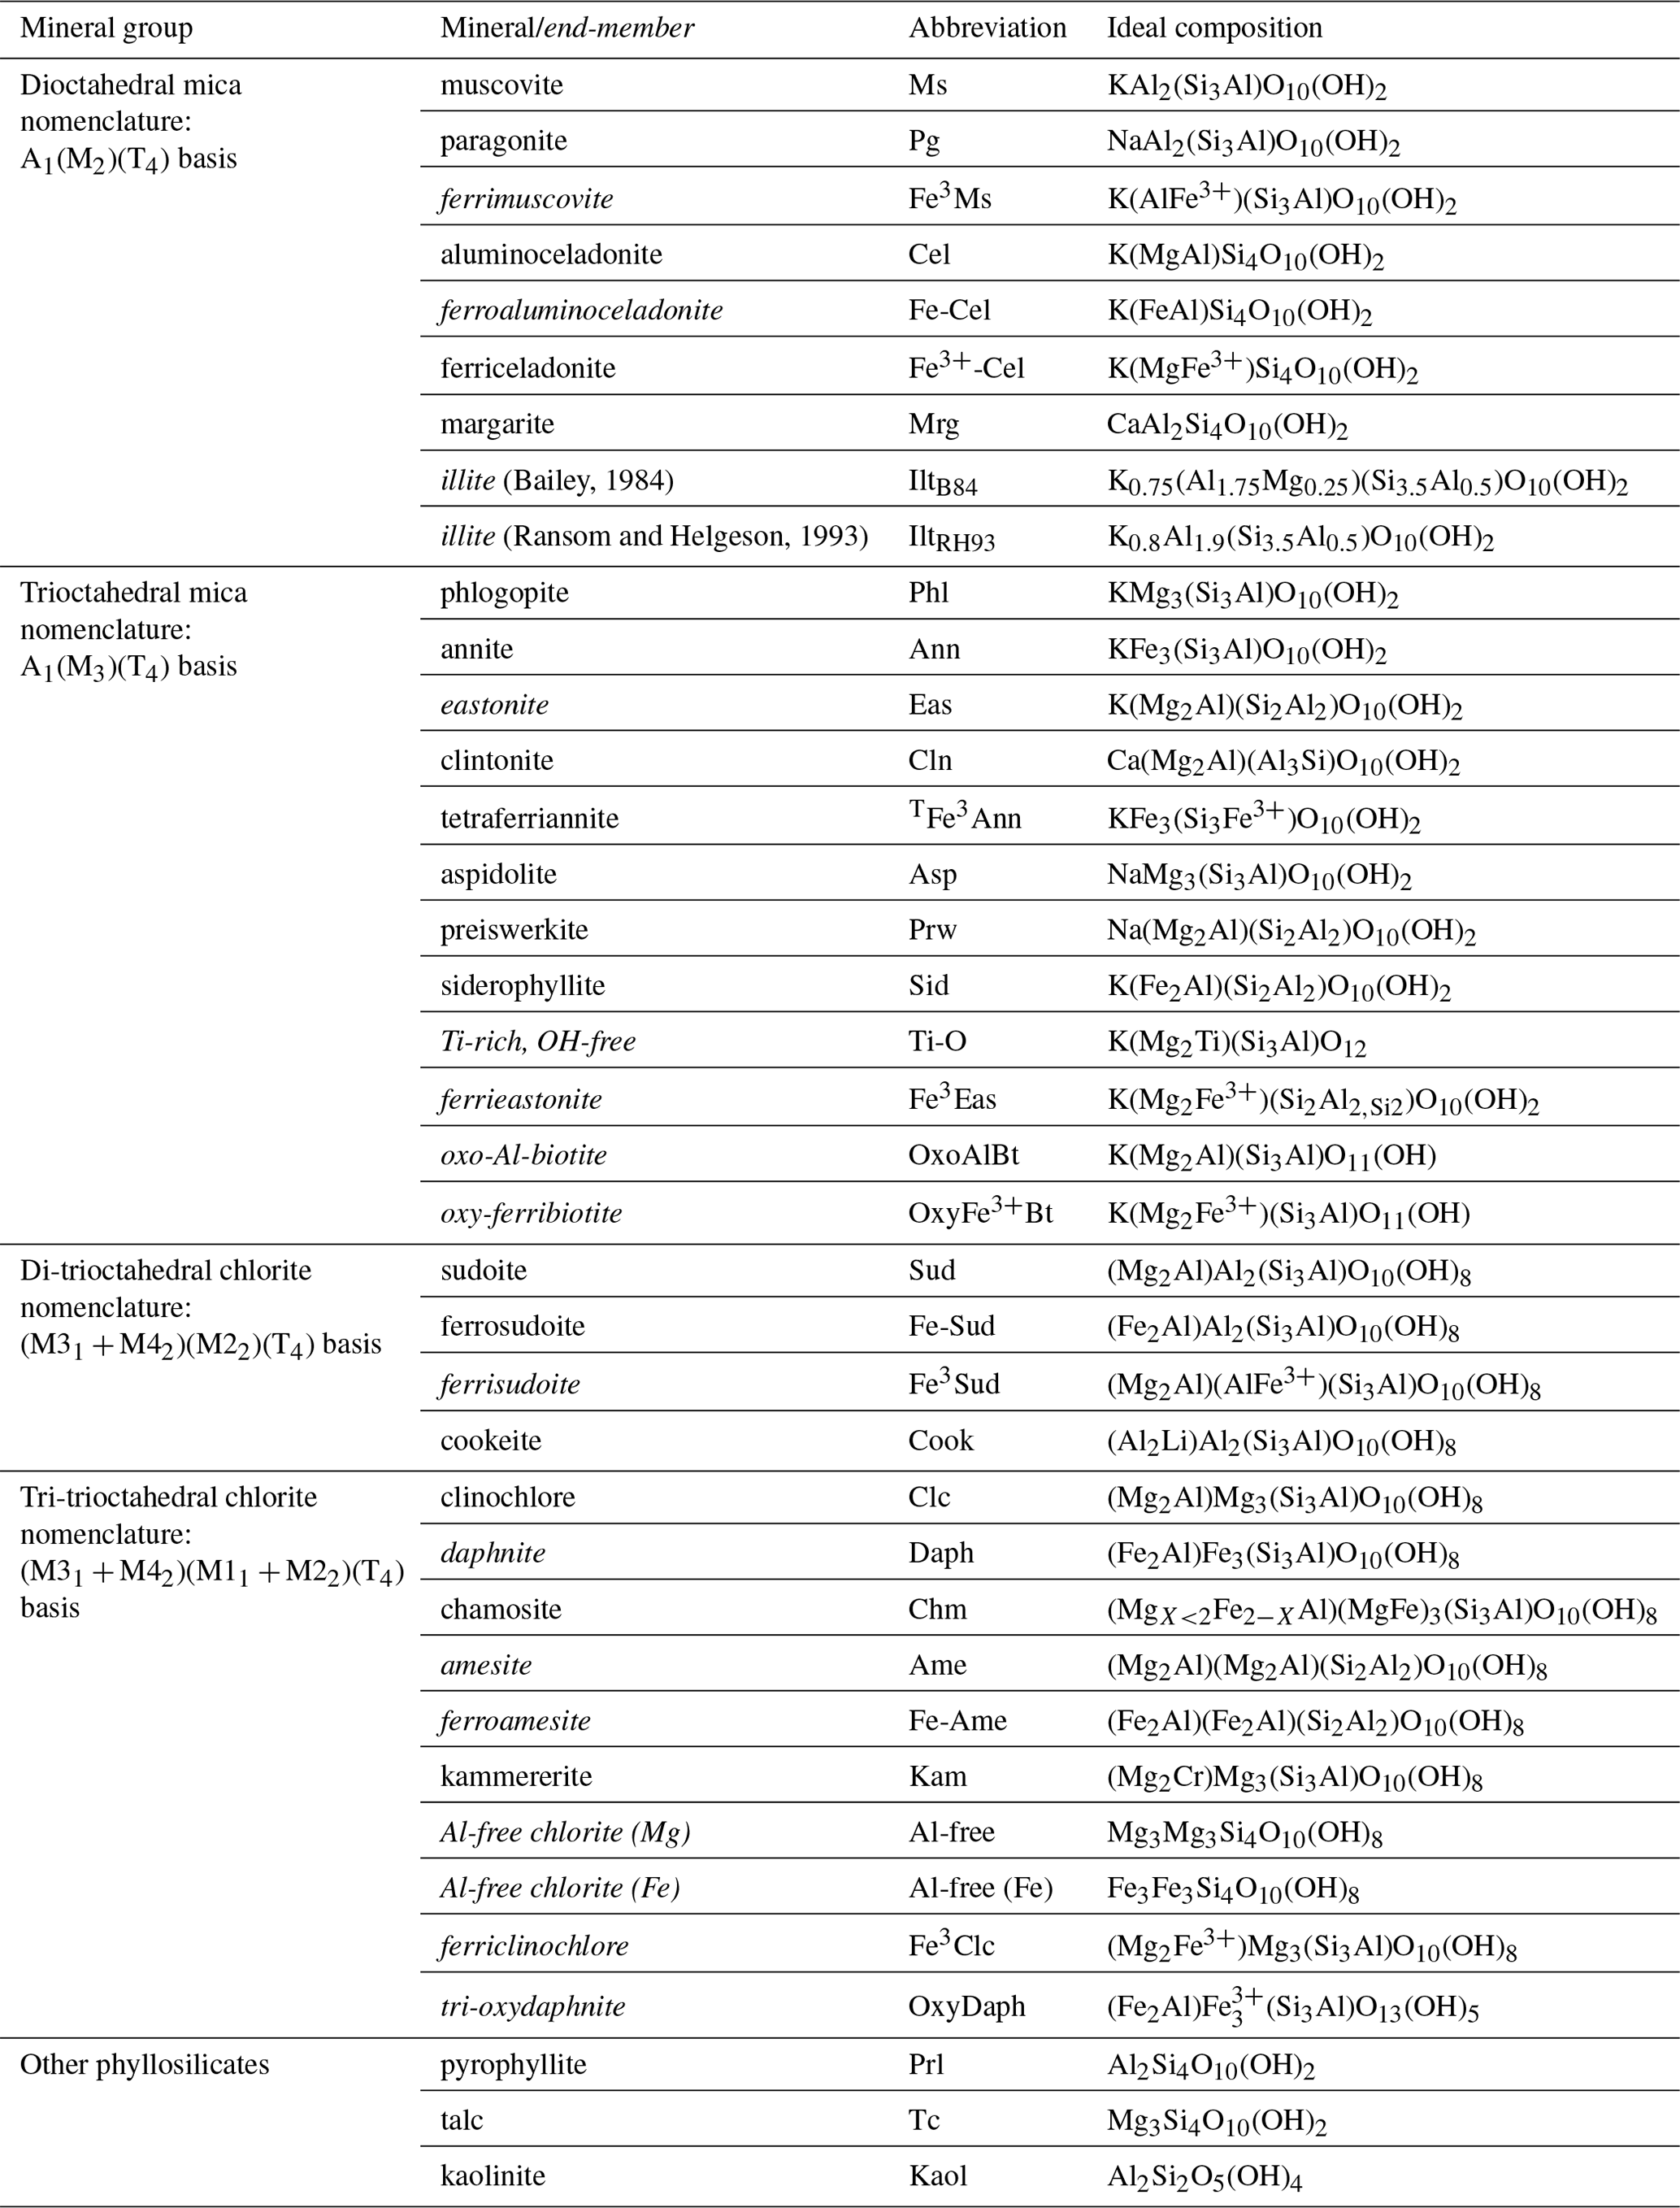
This study presents a compilation of analyses including iron speciation and the H2O content of biotite, white mica, and chlorite from metapelites. The compilation is used to recall the fundamental effects of selecting anionic bases and to review exchange vectors. These define general rules for estimating formula units and allocating cations to crystal sites. Corresponding sets of end-members are suggested as a basis for thermodynamic modelling. For convenience, Table 1 lists the names of the minerals and end-members used in the article, together with abbreviations and ideal compositions. Interlayer sites are noted “A” and octahedral and tetrahedral sites are noted “M” and “T”, respectively, followed by a number when necessary.
Table 1Compositions and abbreviations for phyllosilicates used in this study. Italicized names indicate theoretical end-members (not minerals currently approved by the International Mineralogical Association, IMA). These end-members may not be stable under any pressure–temperature–oxygen fugacity conditions or may remain undiscovered. Unless specified, iron is assumed divalent. See also Warr (2020).
The database used here is provided in the Supplement. It is based on the compilation of metapelitic biotite, white mica, and chlorite analyses presented by Forshaw and Pattison (2021). Modifications and updates to that database were as follows. New analyses were added from 23 studies, containing 125 analyses (86 biotites, 32 white micas, and 7 chlorites) from 108 broadly metapelitic samples (Yamada, 1953; Hietanen, 1956; Miyashiro, 1962; Guitard, 1963; Kizaki, 1964; Rimšaite, 1964; Pattison, 1965; Harte, 1966; Kretz, 1966; Brown, 1967; Lebedev et al., 1967; Onuki, 1968; Gable et al., 1970; Matejovská, 1970; Trzcienski, 1971; Das, 1973; Plamenevskaya, 1975; Atkin, 1978; Kanisawa et al., 1979; Neiva, 1980; Dyar and Burns, 1986; Baldelli et al., 1989; Rieder et al., 1995). Analyses of the volatile content (CO2, adsorbed and structural H2O) of biotite, white mica, and chlorite, not included in the database of Forshaw and Pattison (2021), were added for all samples in which they were measured in the original studies. Partial analyses of minerals (in which one or more of the major components were not measured) have been excluded. For comparison, additional analyses were incorporated from studies including other rock types (igneous and metamorphic), including 154 biotite analyses from the compilation of Li et al. (2020) and 178 chlorite analyses from Masci et al. (2019). Li et al. (2020) compiled X-ray diffraction (XRD) structural refinements where the atom site distribution is well established in addition to composition. Masci et al. (2019) collected in situ composition using XANES and electron microscopy and provided multiple analyses of different crystals in the same sample; in the compilation of Forshaw and Pattison (2021), each sample has only one analysis. Analyses of paragonite (dioctahedral mica analogous to muscovite where Na occupies more than half the interlayer site) have not been included in the database, even though paragonite may be found in metapelites.
The resulting database contains 697 biotite analyses in which all major cations have been measured (SiO2, TiO2, Al2O3, Fe2O3, FeO, MgO, and K2O). Structurally bound water (H2O+) was measured in 351 biotites (about half the database). MnO, CaO, and Na2O concentrations were determined in more than 80 % of the biotites, whilst ZnO, BaO, Rb2O, Li2O, P2O5, CO2, Cl, and F concentrations were determined in less than 35 %.
For white mica, the database includes 218 analyses in which major cations have been measured (as with biotite). H2O+ was measured in 161 white micas (76 %). MnO and CaO concentrations were determined in more than 89 % of the white micas, whilst ZnO, BaO, Rb2O, Li2O, P2O5, Cl, and F concentrations were determined in less than 35 %.
For chlorite, the database includes 244 analyses in which major cations have been measured (SiO2, Al2O3, Fe2O3, FeO, and MgO). H2O+ was measured in 62 chlorites (25 %). TiO2, MnO, CaO, Na2O, and K2O concentrations were determined in more than 86 % of the chlorites, whilst P2O5, Cl, and F concentrations were determined in less than 10 %.
Filtering of analyses has been kept to a minimum in order to avoid overlooking unexpected substitutions due to possibly unwise assumptions about quality. For chlorite, all analyses were kept. For white mica, three analyses which had formula units (estimated with the measured anionic basis) with a cation sum greater than 7.3 atoms per formula unit (apfu) and an alkali sum greater than 1.3 apfu were discarded. Similarly, two biotite analyses were discarded due to alkali sums above 1.2 apfu. Retaining mica analyses with formula units showing alkali content above 1 apfu does not imply that more than 1 cation per formula unit (pfu) may be present in the interlayer space of micas. Instead, it allows for the possibility of error propagation, such as potential inaccuracies in the measurement of Si content, which could impact the calculated formula units. It is noteworthy that the vast majority of analyses appear to be of good quality, with few outliers in subsequent figures. Spreadsheets provided in the Supplement allow figures linked to the metapelitic database to be redrawn and user-provided analyses to be treated for (i) calculation of elemental ratios; (ii) normalization to measured and fixed-charge anionic basis; and (iii) cation site decomposition for biotite, chlorite, and white mica. Estimations of end-member type proportions based on elemental ratios are also provided for chlorite and white mica.
The crystal chemistry of phyllosilicates has been subject to decades of studies. Their overall structure has been well constrained through a combination of XRD, vibrational spectroscopy, and chemical analysis techniques (wet-chemistry and electron microprobe techniques in particular), leading to anionic bases in the form of O10(OH)2 for micas and O10(OH)8 for chlorite. These correspond to 22 negative charges (noted 22 Q−, with Q− a negative charge unit pfu) for micas and 28 for chlorite, which must be compensated for by cations (summing to 22 Q+, with Q+ a positive charge unit pfu). Halogens may exchange with hydroxyl groups, decreasing the number of oxygen atoms but keeping the number of negative charges constant (see, for example, Figowy et al., 2021, and references therein). Incorporation of octahedral tetravalent and trivalent cations can also alter the anionic basis via exchange with protons in a coupled substitution, such as for Ti (especially in biotite; see, for example, Dyar et al., 1993; Waters and Charnley, 2002; and Cesare et al., 2008), where H leaves the structure:
This process known as deprotonation (or oxy-substitution or dehydrogenation) keeps the number of oxygen atoms constant but increases the number of negative charges that must be balanced by cations others than H+. There are various deprotonation mechanisms, some of which occur in oxo-amphibole (e.g. Hawthorne and Oberti, 2007).
Formula units are obtained via normalization. Three main approaches are classically followed.
- 1.
Measured anionic basis. This involves normalization to a fixed sum of anions and anionic groups and using the number of oxygen atoms per oxide component for cations and the content of halogens and structurally bound water when measured. This amounts to 12 (O,OH,F,Cl) for micas and 18 for chlorite. The sum of anions is negatively correlated to the sum of positive charges.
- 2.
Fixed-charge basis. This involves normalization to a fixed number of charges, using twice the number of oxygen atoms per oxide component for cations. In this case the halogen content is not used during normalization but is instead added to the anionic basis with the same normalization coefficient. This scheme is popular when investigating electron microprobe data where measuring light elements and oxygen is either neglected or impossible.
- 3.
Fixed-cation basis. This involves normalization to a fixed number of cations or a fixed site occupancy. Stoichiometry can be used to estimate formula units and the speciation of iron in oxides, garnet, pyroxene, and chloritoid in particular (e.g. Droop, 1987; Schumacher, 1991). It is less practical in phyllosilicates because they may contain vacancies and show variable iron speciation. This scheme will not be considered any further here.
Figure 1 compares the first two normalization schemes. For chemical analyses used here, octahedral and interlayer sums are estimated by allocating cations to M sites after filling T sites with Si and Al and interlayer sites of micas with alkali, Ba, and Ca. It is emphasized that this is only a preliminary approach used for comparing normalization schemes because it may yield interlayer sums greater than unity that are symptomatic of bad analyses or erroneous cation distribution. For biotite analyses originating from structural refinements compiled by Li et al. (2020), the result from the refinement is used without additional normalization, considering the anionic basis as measured. For T sites, the agreement between normalization schemes is fair, generally within 0.1 Si apfu for chlorite and micas (Fig. 1a). Interlayer sums (Fig. 1b) in micas are also very consistent, with differences below 0.1 apfu. Selecting an anionic basis has a greater effect over octahedral sums (Fig. 1c–d; see also Laird, 1988) and therefore on the number of octahedral vacancies: chlorite analyses are spread over 0.4 apfu (Fig. 1c), white mica analyses are spread over 0.2 apfu (Fig. 1d), and biotite analyses are spread over 0.3 apfu (Fig. 1d). The 22-charge basis also leads to a systematic underestimation of octahedral sums (by ∼ 0.1 apfu) when compared to XRD structural refinements (Fig. 1d).
The following sections investigate the quality of the database and quantify the effects of selecting an anionic basis and possible analytical errors.
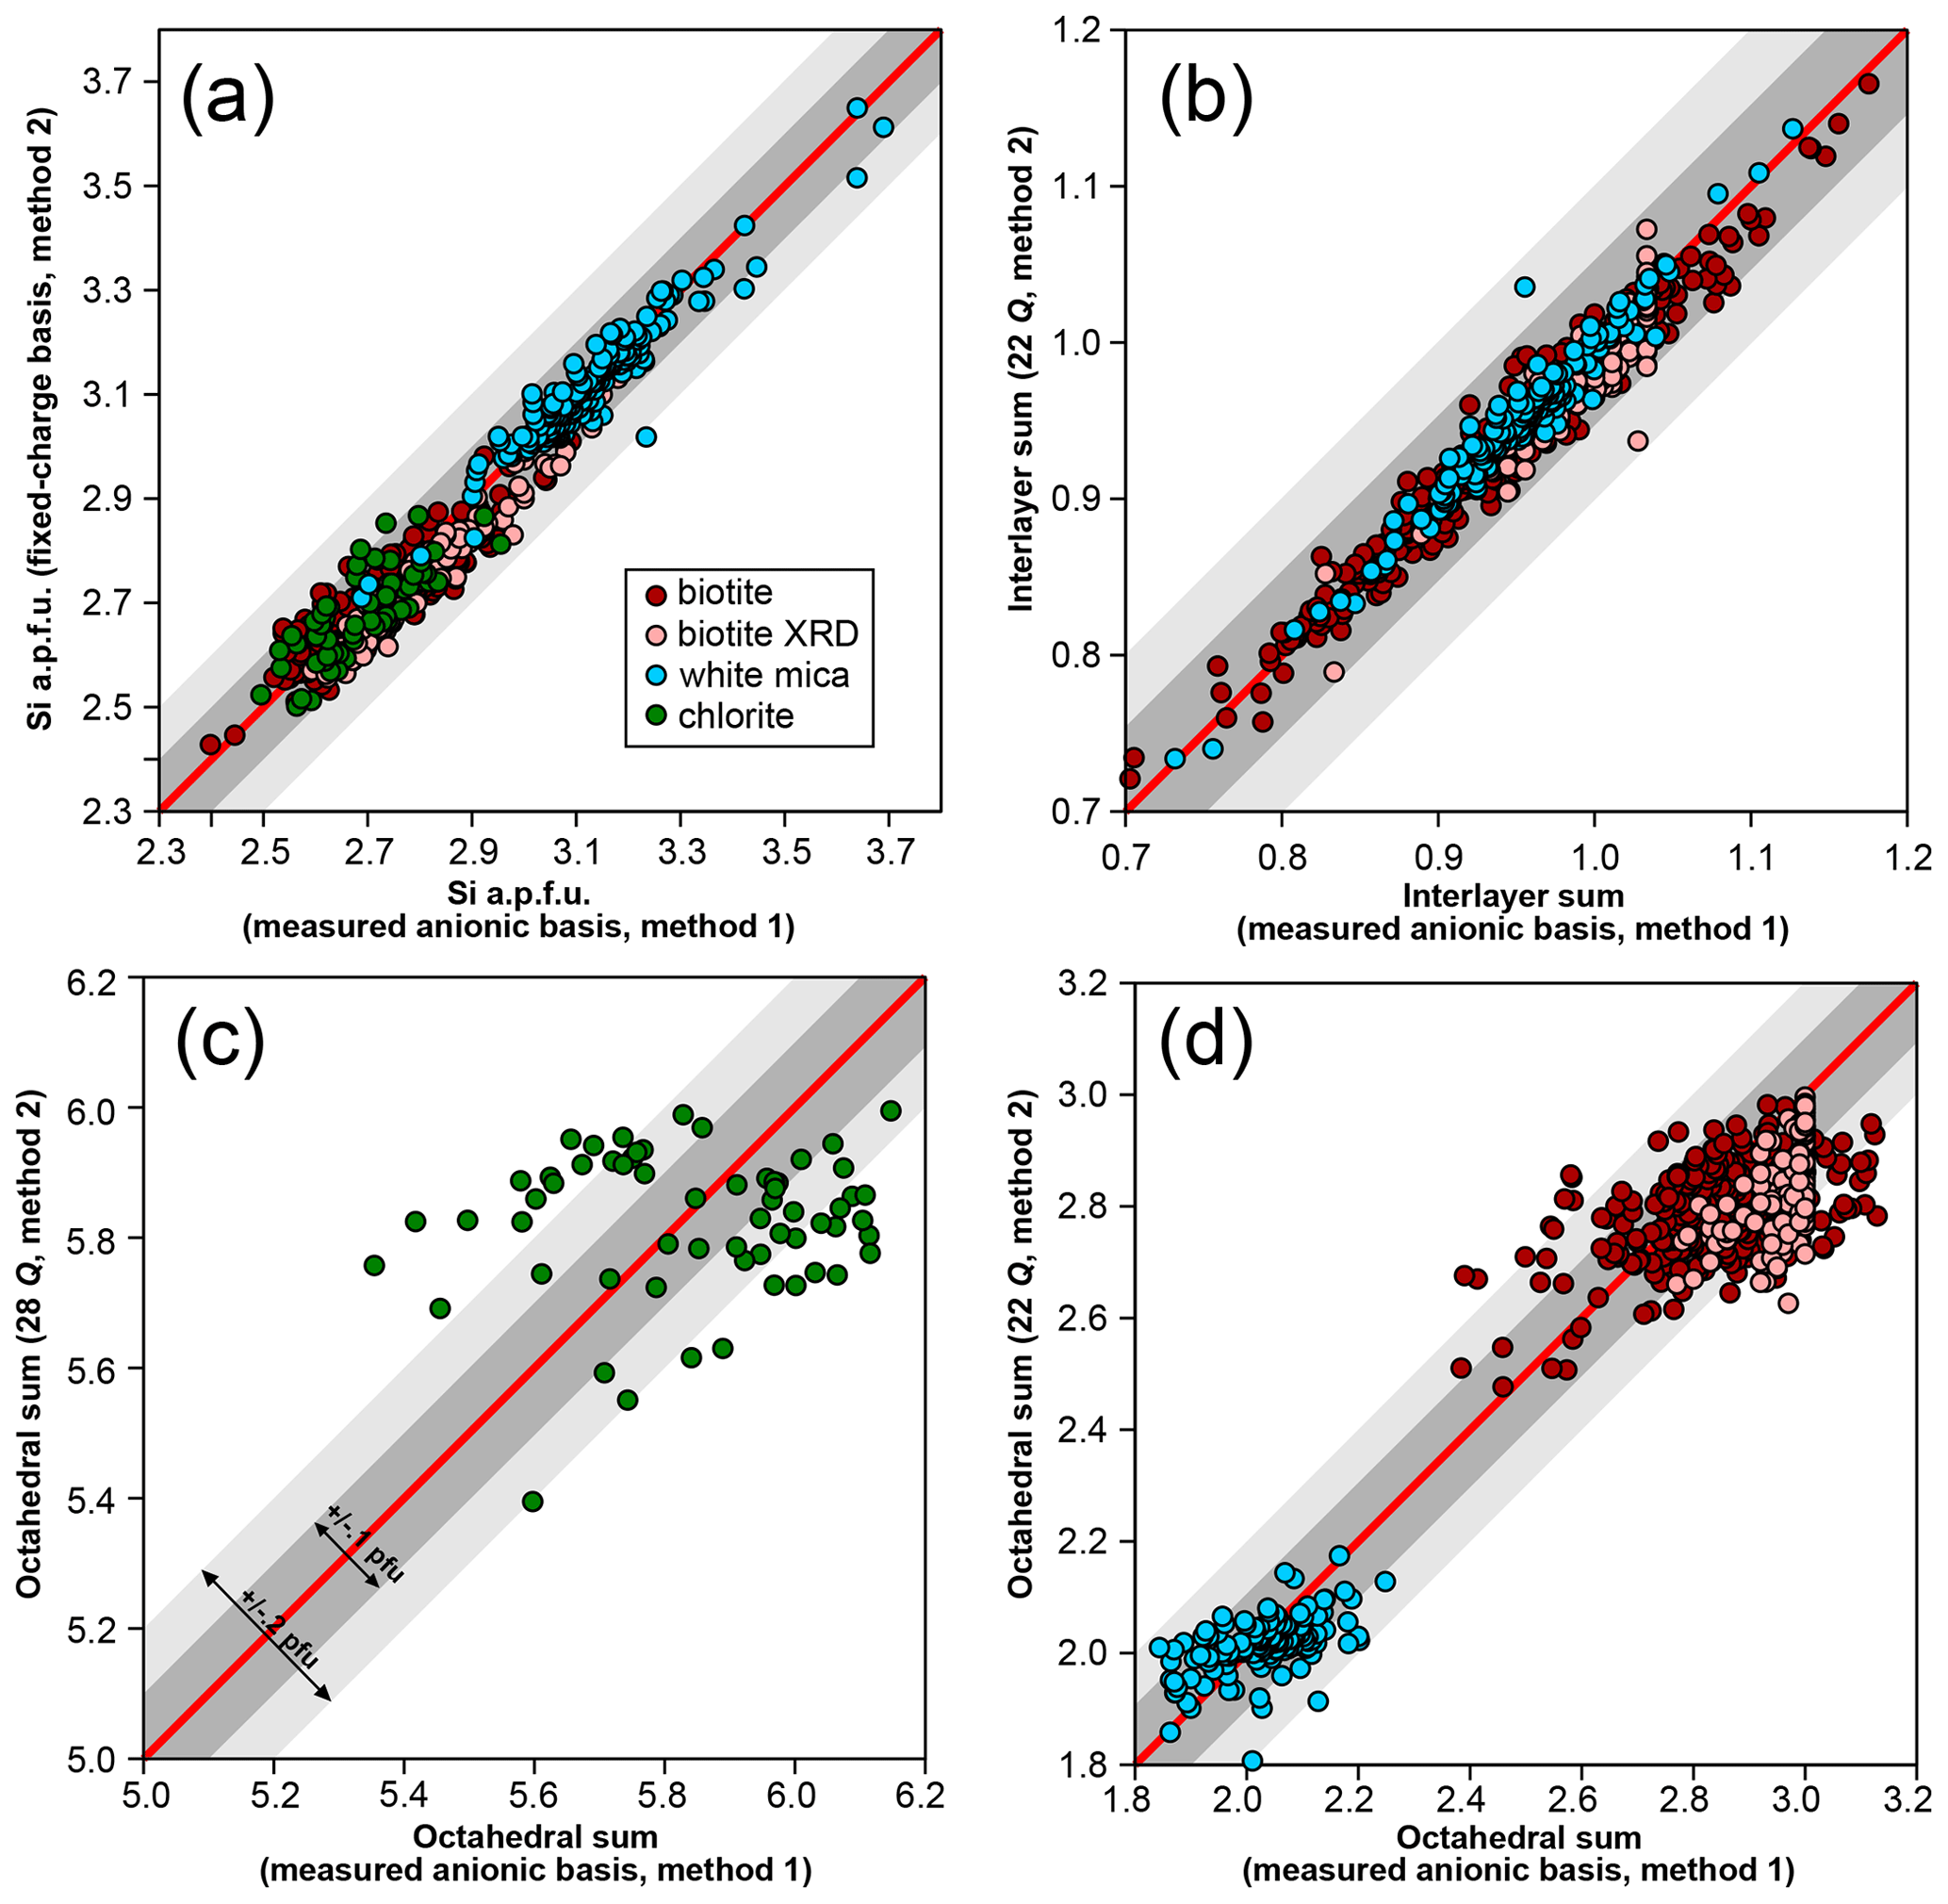
Figure 1Effect of a varying anionic basis over site occupancies in biotite, white mica, and chlorite, with all values per formula unit. Analyses from structural refinements compiled by Li et al. (2020) are labelled “biotite XRD”. Red lines indicate 1 : 1 correlation. Grey envelopes show deviation from the red line by 0.1 apfu (dark grey) and 0.2 apfu (light grey). (a) Si content obtained with fixed and measured anionic basis. (b) Interlayer sums obtained for micas with ideal and measured anionic basis. (c, d) Octahedral sums for chlorite (c) and micas (d) with ideal and measured anionic basis.
3.1 Chlorite
Figure 2a compares the sum of cations (other than H+) to the sum of positive charges in chlorite, both obtained using the measured anionic basis. The data show a positive correlation between the two, at first order reflecting the effect of summing analytical uncertainties: more cations imply a greater positive charge (and oppositely, fewer cations imply a lower charge). Arrows in Fig. 2a illustrate this effect based on ideal clinochlore composition. Octahedral sums are inversely correlated with the measured water content (Fig. 2b), which is not expected if octahedral sum variations are dominated by petrological processes. A Monte Carlo simulation has been carried out to illustrate the effect of uncertainties over water content, starting from ideal clinochlore composition and randomly adding noise in the limit of 1 % for cation concentration and within 0.3 weight % for [H2O+] contents (Fig. 2c). These uncertainties are deemed representative of a well-functioning electron microprobe for cations and reasonably careful measurement of structural water (see, for example, Dyar et al., 1991, although SIMS may yield uncertainties in the range of, or below, 0.1 wt % in phyllosilicates, e.g. Righter et al., 2002; Cesare et al., 2008; Siron et al., 2018). It is evident from Fig. 2c that the uncertainty in structural water measurement is crucial as it has a greater effect than the sum of uncertainties over cations.
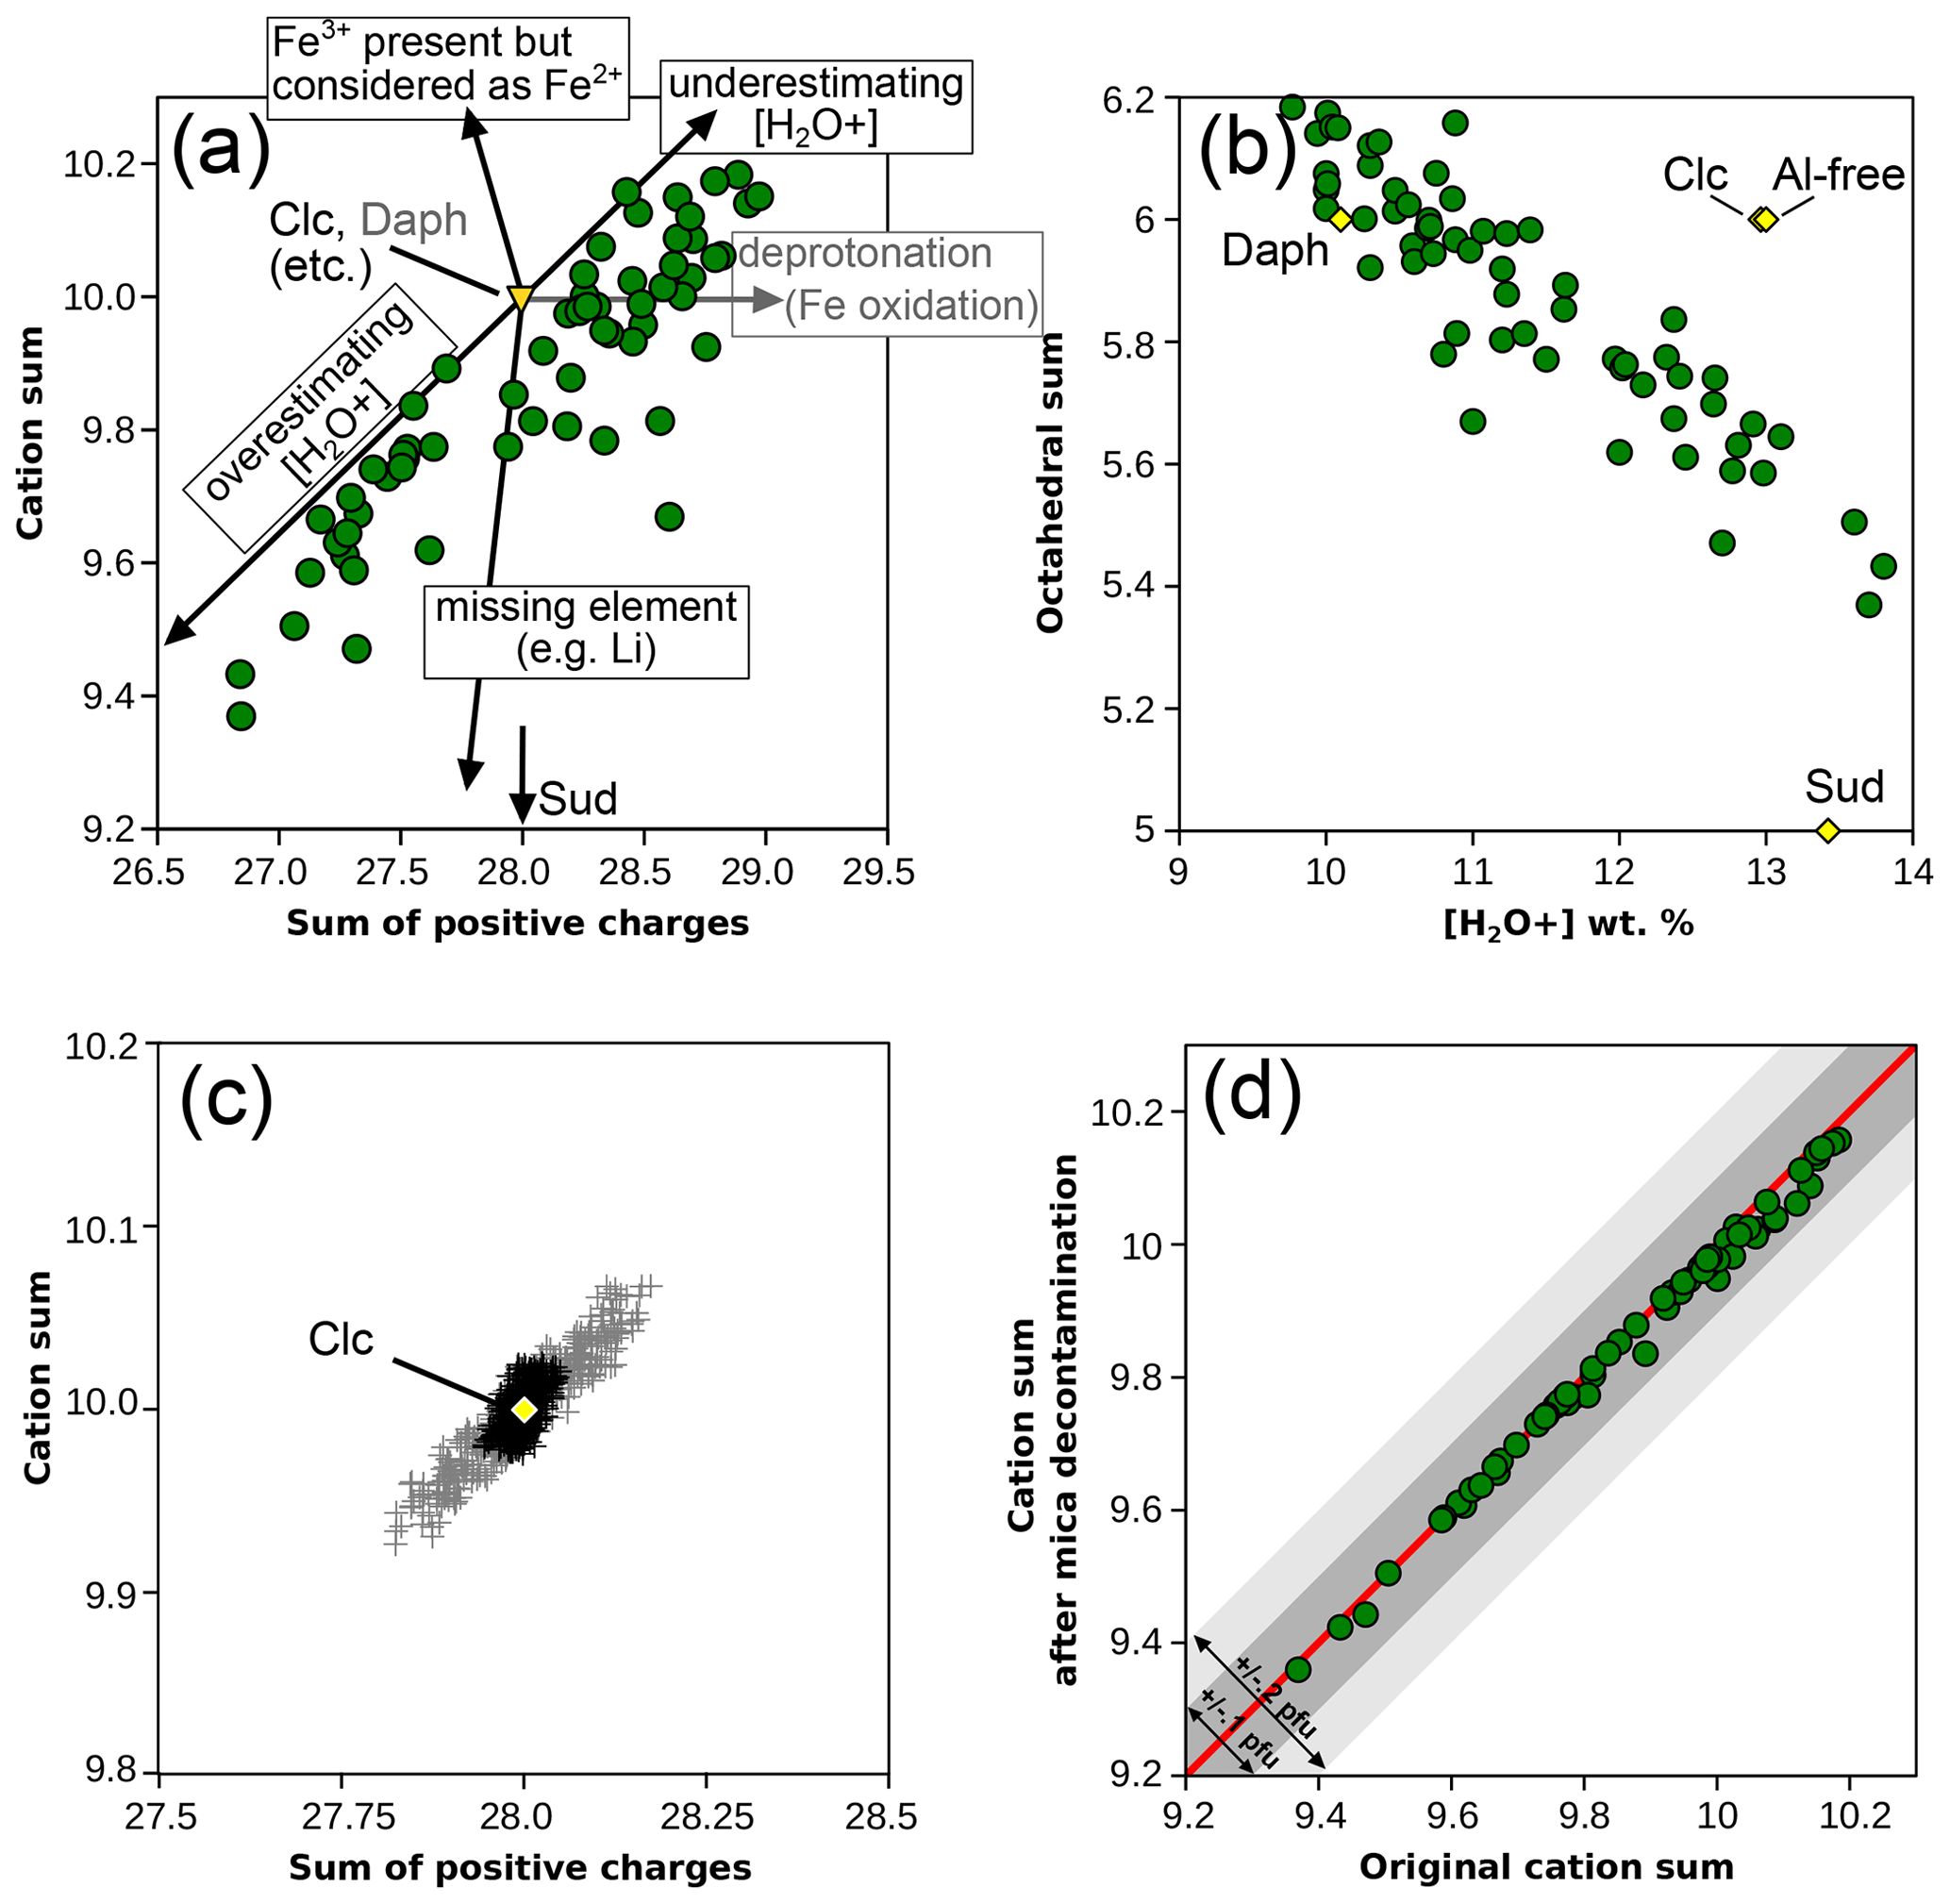
Figure 2Cation sum variations in chlorite. (a) Cation sum and sum of positive charges per formula unit of chlorite, estimated with measured anionic basis (method 1). Arrows show the effects of analytical errors starting from clinochlore with ideal composition. The effect of measuring deprotonated chlorite is shown in grey based on ideal daphnite. Solid solution with a di-trioctahedral end-member such as sudoite decreases the cation sum without altering the number of charges, as shown by the bottom arrow. (b) Correlation between [H2O+] content and the octahedral sum (from the measured anionic basis). Classical metapelitic end-members are shown as yellow diamonds for comparison with expected variability. (c) Simulated effect of analytical uncertainties around ideal clinochlore (yellow diamond). Note that scale varies between (a) and (c). Grey crosses: assuming 1 % relative uncertainty for cations and 0.3 wt % uncertainty for H2O content. Black crosses: assuming 1 % relative uncertainty for cations only. (d) Effect of removing possible mica contamination (using the measured anionic basis as in a). The red line shows a 1 : 1 correlation, and envelopes show 0.1 and 0.2 cations pfu variability.
The correlation between the sum of cations and positive charges is similar within 1σ uncertainty for the natural database (; Fig. 2a) and the Monte Carlo simulation (; Fig. 2c), the latter displaying a smaller spread. An important feature is that the natural data are not centred around the ideal tri-trioctahedral composition with 28 charges and 10 cations, and all analyses show either excess charges, cation deficiency, or both. The database is almost symmetrically dispersed around 28 charges but not around 10 cations (Fig. 2a). In contrast, results from the Monte Carlo simulation are centred around ideal clinochlore composition and are symmetrically dispersed (Fig. 2c).
In chlorite and mica, cation sums are limited to a maximum set by the number of sites and their multiplicity (H+ being a possible exception because several protons may be part of complexes, such as NH in interlayer space of micas, or occupy silicon vacancies, for example in garnet – see Reynes et al., 2018; note that this does not apply to all silicates, for example cage structures accommodating several cations). Cations present as interstitial defects should not amount to more than hundreds of parts per million, i.e. below 0.01 cations pfu. The effect of other impurities such as contamination by mica interlayered in chlorite has been estimated by removing possible mica contamination using the alkali content. It has been assumed that K originates from the presence of muscovite, Na from paragonite, and Ca from margarite, and formula units have been recalculated with cation sums shown in Fig. 2d. The difference from the original value is, on average, 0.014 cations lower and at a minimum of −0.059 cations pfu, which is deemed insignificant compared to cation sums shown in Fig. 2a.
Therefore, cation sums above 10 for chlorite reflect analytical uncertainties, errors, or impurities such as those shown in Fig. 2a. Laird (1988) states that chlorite may have excess or missing brucitic layers (see also Ferrow and Bagiński, 1998), providing a first explanation of [H2O+] varying beyond end-member values. The presence of Fe3+ wrongly considered Fe2+ leads to an increased cation sum but decreased total charges. Not measuring a major element, such as Li, that is possibly in significant molar concentrations (e.g. Dubacq et al., 2023) leads to decreasing cation sums and total charges. Deprotonation, such as during Fe oxidation, will alter the anionic basis and increase the total charge but not the cation sum if the [H2O+] content is measured (if not, cation sums will artificially decrease). These errors do not explain the systematic lowering of cation sums.
The di-trioctahedral substitution (, where Mq+ is an octahedral cation with charge q+ and M□ is an octahedral vacancy) decreases cation sums, e.g. towards a sudoite component in Fig. 2a, without altering the number of charges. Incompletely filled cation sites, presumably in octahedral sheets, are probably a real feature of the chlorite database, although the exact number of vacancies is uncertain at this point due to analytical uncertainties.
3.2 Biotite
Figure 3 presents several aspects of the effect of the anionic basis on biotite formula units. As with chlorite, there is a positive correlation between cation sums and the sum of positive charges for analyses without XRD structural refinements (Fig. 3a). The database is not centred around ideal trioctahedral biotite (such as phlogopite), and only XRD results reach theoretical values of 8 cations and 22 charges. Excess charges and cation deficiency are the norm.
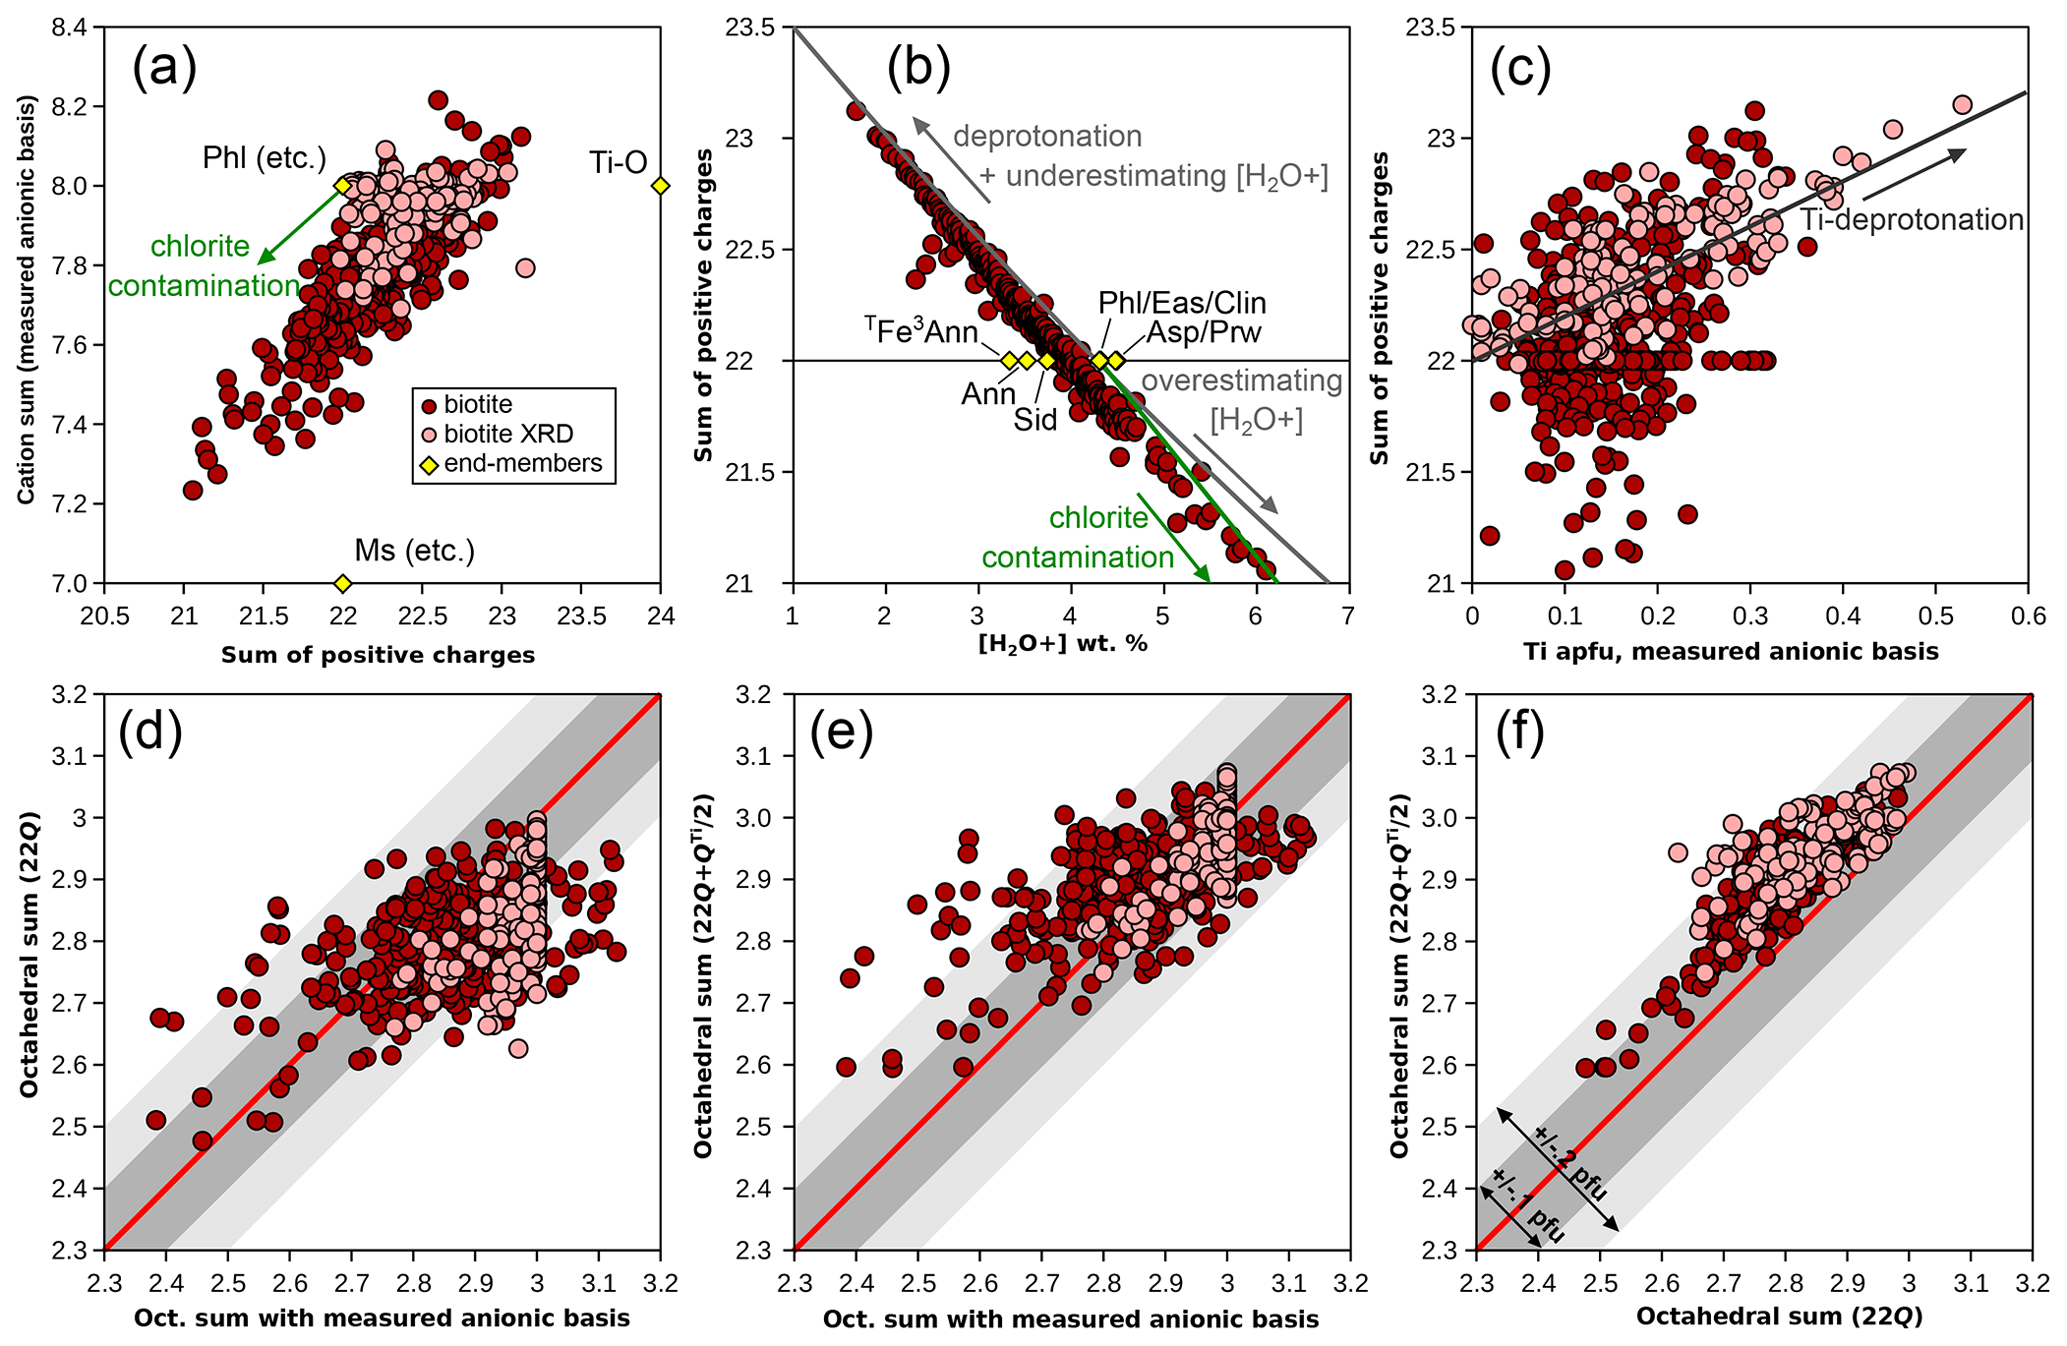
Figure 3Effect of the anionic basis on formula unit estimation in biotite. Symbols as in Fig. 1. End-members (yellow diamonds) are abbreviated as in Table 1. (a) Cation sum and sum of positive charges, estimated with the measured anionic basis normalized to O10(OH)2. (b) Sum of positive charges compared to bound-water content. Grey arrows show the effect of deprotonation and of under-/overestimating bound-water content and the green arrow that of chlorite contamination, calculated from phlogopite. (c) Sum of positive charges against Ti content. The correlation is consistent with deprotonation. (d) Comparison of octahedral sums obtained with the measured anionic basis and with the 22-charge basis. (e) The same comparison, with the method of Waters and Charnley (2002). (f) Comparison of octahedral sums obtained with the 22-charge basis and with the method of Waters and Charnley (2002). Envelopes in (d)–(f) show departure from the red 1 : 1 line within 0.1 and 0.2 cations pfu (dark and light grey, respectively).
Figure 3b shows the dependency of the sum of charges over measured water content compared to theoretical water contents of classical biotites with end-member compositions. As with chlorite, this illustrates the need for precise determinations of water content. In Fig. 3b, measured water contents in biotite extend far below and above the maximum spread of the ideal biotites, closely matching the effect of over- or underestimating water content (grey line in Fig. 3b, calculated from phlogopite). Deprotonation leads to a similar trend to underestimating water content, for example, along the exchange vector of Eq. (1) or via an exchange vector in the form of M. This exchange vector, where H+ leaves the structure, may be seen as the chemical expression of the polysomatic series of biopyriboles (Thompson, 1978; Veblen and Buscek, 1980). Resulting end-member compositions show 24 charges for zero water content (i.e. twice the usual formula unit of diopside), like the Ti-rich, OH-free end-member proposed by Waters and Charnley (2002; Table 1, Fig. 3a, denoted Ti-O). The presence of a chlorite component would increase water content and decrease the sum of charges (arrows in Fig. 3a, b) after normalization to the biotite anionic basis, similarly to the insertion of a “brucitic sheet” replacing K in the A site (balanced by Si–Al exchange). Interlayering with a minor dioctahedral mica component would not affect water content significantly because muscovite shows water contents comparable to phlogopite of around 4.5 wt %. However, the misidentification of molecular water (filling interlayer vacancies or residual [H2O−]) as structurally bound water is a possible cause of the overestimation of [H2O+] (e.g. Foster, 1964). Another possible mechanism for reducing the number of charges while increasing water content is leaching of K+ and replacement by H3O+, although classical measurement of H2O+ should not include H3O+. The presence of H3O+ in significant proportions in interlayer position is unclear in biotite (Bailey, 1984) and would imply equilibrium with fluids with unrealistically low pH (see, for example, for illite Jiang et al., 1994, in stark opposition to Loucks, 1991, who argued that the hydronium ion fills interlayer vacancies in greater proportions than molecular water on the basis of statistical analysis of a set of 72 white micas). In any case, attributing the negative correlation between number of charges and (OH, F, Cl) content on the basis of formula units to deprotonation (e.g. Forbes, 1972) over the entire database is unwise because formula unit estimation is sensitive to small variations in measured H2O+.
Figure 3c compares the sum of positive charges to Ti content. A clear positive trend is seen in XRD refinements, which include studies dedicated to measuring deprotonation during Ti incorporation (e.g. Schingaro et al., 2014), resulting in deliberate sampling bias towards high-Ti biotite. The trend closely matches the expected Ti-deprotonation exchange vector (arrow in Fig. 3c). In the metapelite database, some Ti-rich biotites show excess charges, whilst others show few to no excess charges, and conversely, some biotites with excess charges show little Ti.
Waters and Charnley (2002) suggest that the best scheme for calculating formula units from electron microprobe data may be to assume that deprotonation takes place as in Eq. (1) above and to normalize analyses to charges (11 O + Ti, i.e. 24 charges for 1 Ti pfu; Table 1). These authors mention iterative normalization; however, iterations are unnecessary if the normalization is carried out to 22 charges after the removal of half the fraction of charges attributed to Ti. The normalization factor r ( for the 22-charge basis) becomes , with mi being atomic content of cation i with charge Qi.
Figure 3d–f compare normalization schemes, using (i) 11 (O, OH) and the measured H2O+ content, (ii) 22 charges, and (iii) from Waters and Charnley (2002). For XRD structural refinements, the H2O+ content from the refinement is used for the normalization scheme with 11 (O, OH). Figure 3d and e show that octahedral sums calculated either with a 22-charge basis or with a ()-charge basis do not correlate strongly with those estimated from the measured H2O+ content (for the Rietveld refinements: r2=0.29 with a 22-charge basis and 0.44 with charges). Using a 22-charge basis yields lower octahedral sums than using the measured H2O+ content, on average 0.05 apfu lower for the metapelite database and 0.13 apfu lower for Rietveld refinements, with a large variability (σ=0.10 for the metapelites; σ=0.07 for the refinements). As expected, the 22-charge basis and ()-charge basis correlate more positively (Fig. 3f), the latter yielding octahedral sums that are on average 0.1 cations pfu higher. Notably, the ()-charge basis yields the best match with octahedral sums from Rietveld refinements, which highlights the advantage of using the Waters and Charnley (2002) approach for Ti-rich biotite.
In summary, departures from the ideal trioctahedral biotite formula unit are typical, with generally lower cation sums and uncertain octahedral sums but frequent octahedral vacancies, excess charges, and charge deficiencies.
3.3 White mica (exclusive of paragonite)
Figure 4 presents the sums of cations and positive charges in white mica analyses from the metapelite database using the measured H2O+ content. In contrast with chlorite and biotite, the white mica analyses are approximately centred around the ideal dioctahedral end-members such as muscovite and aluminoceladonite (see Table 1) at 7 cations and 22 positive charges, with two-thirds of the analyses within 0.1 cations and 0.25 charges of the ideal dioctahedral end-members. There is a positive correlation between cation sums and positive charge, which is similar to that observed in chlorite (Fig. 2a) and biotite (Fig. 3a). Uncertainty in measured water contents has the same effect as for chlorite and biotite.
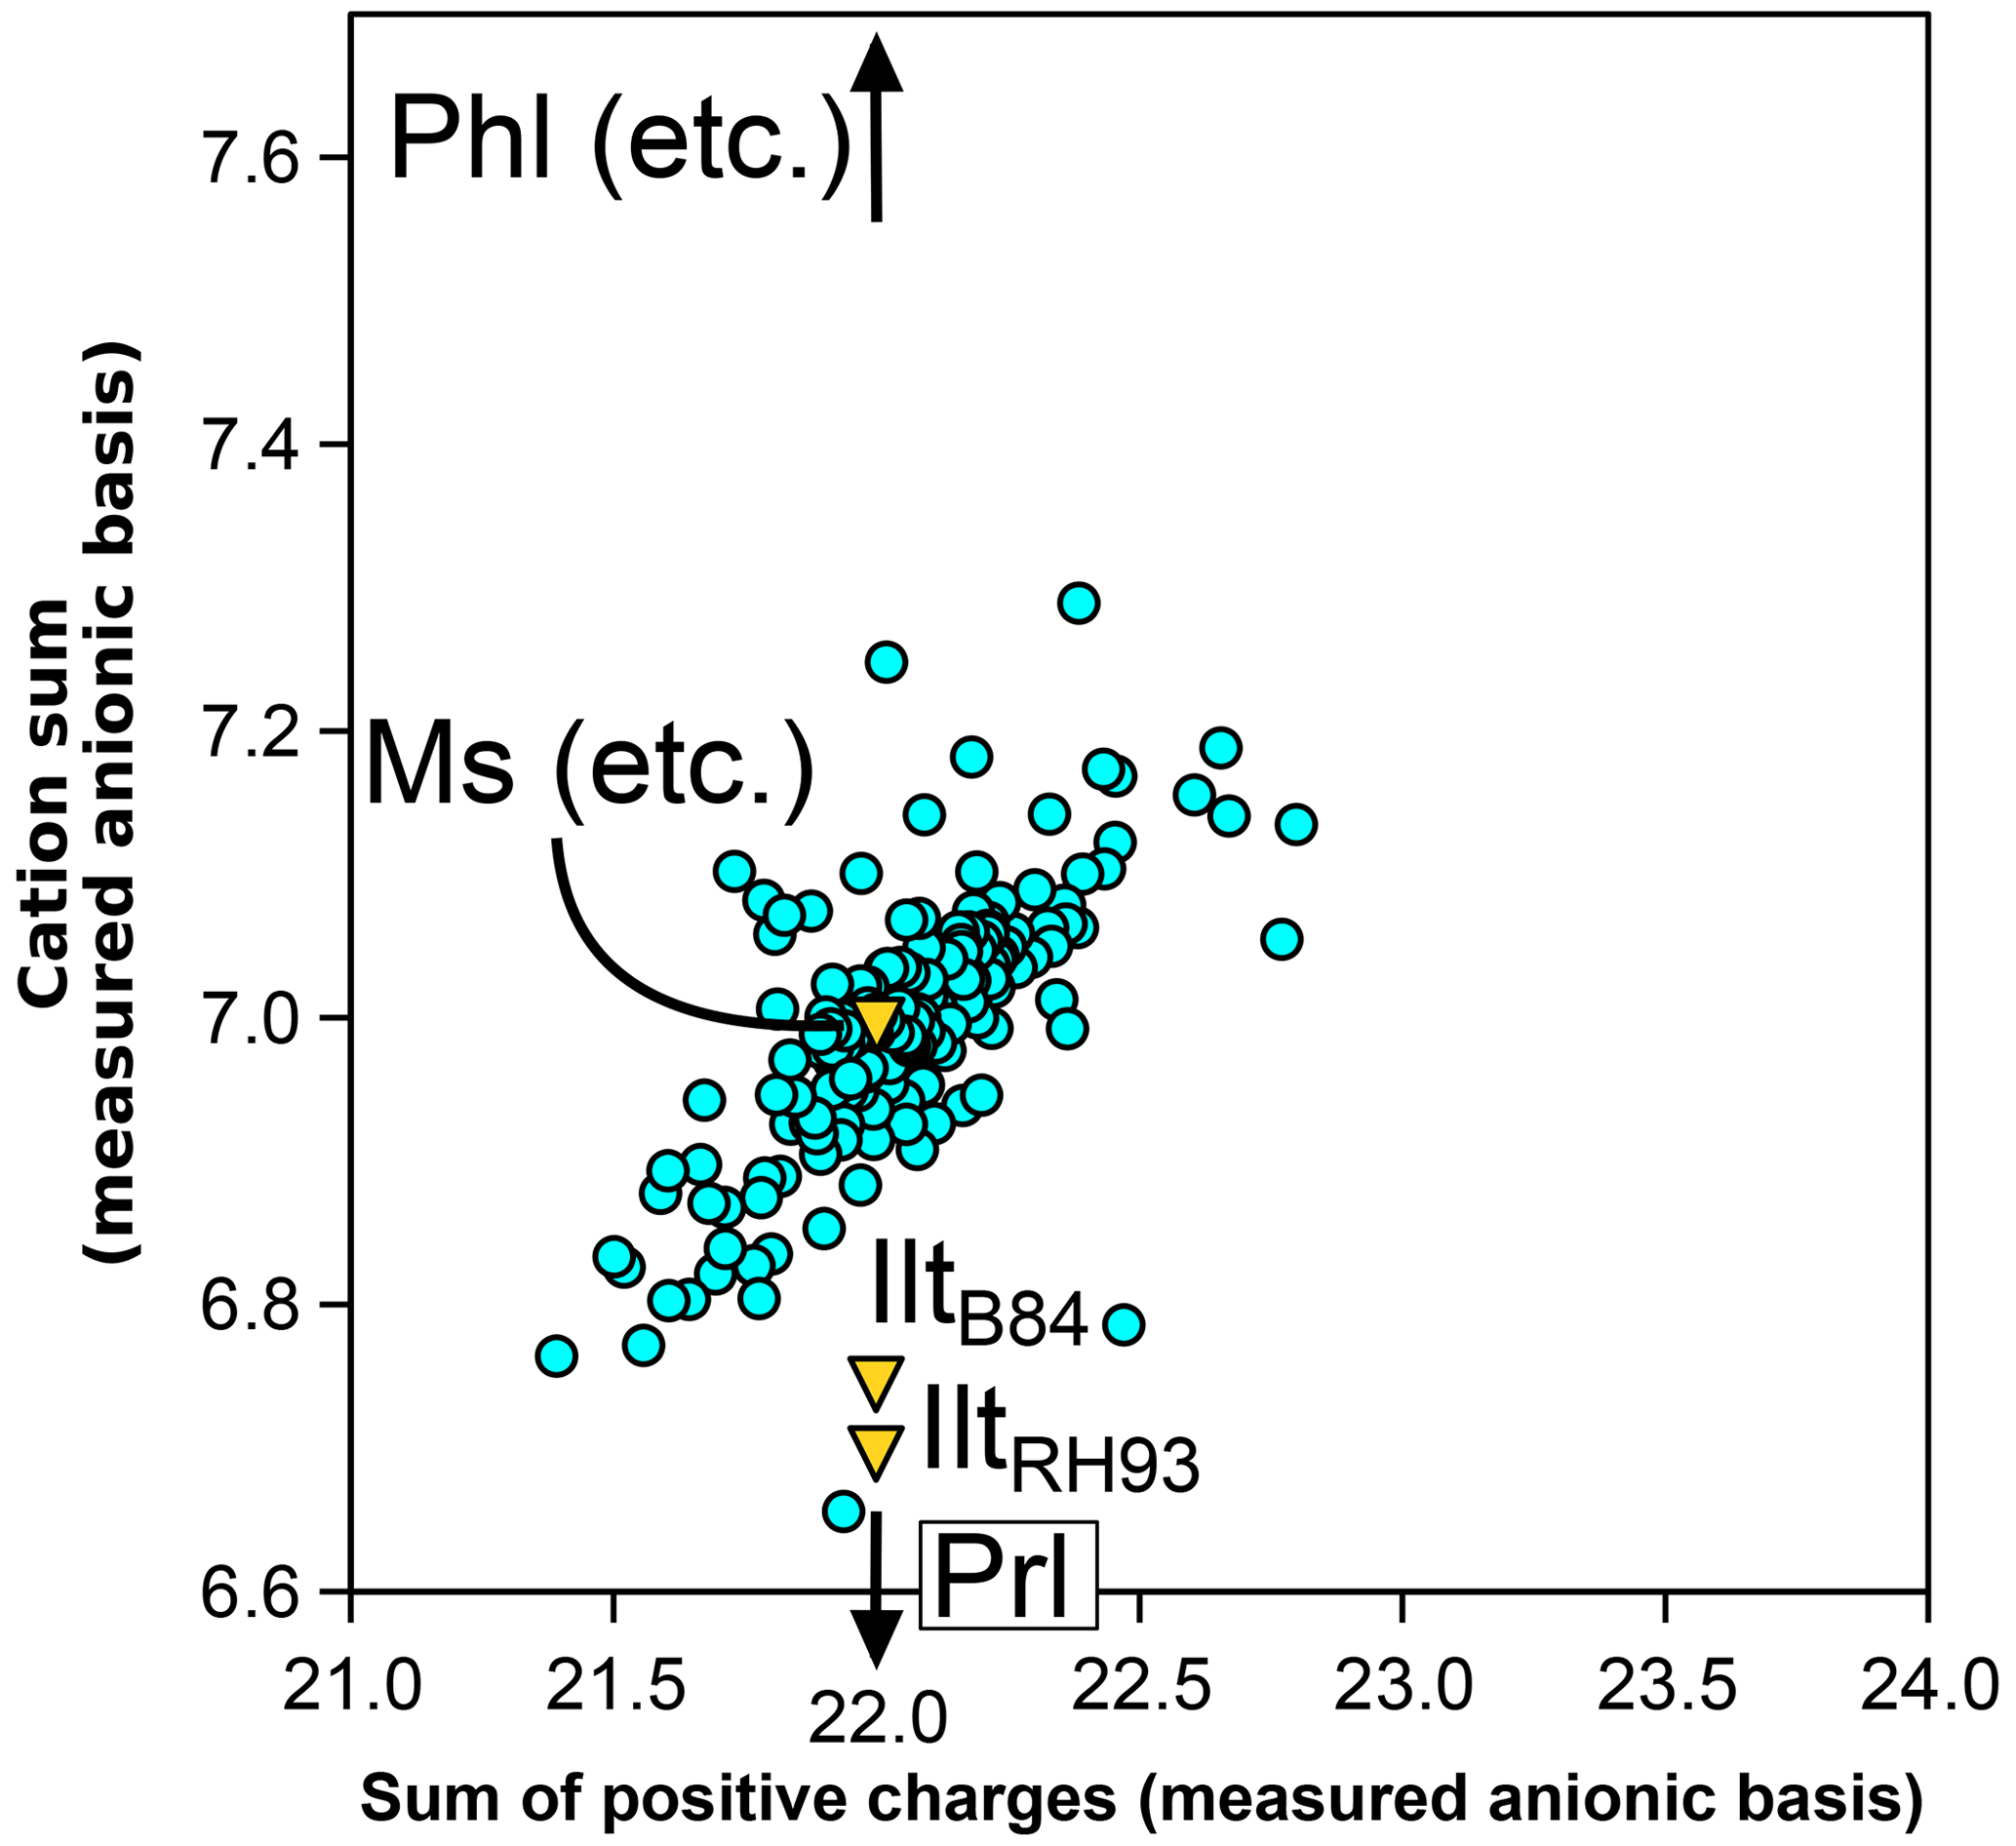
Figure 4Cation sum and sum of positive charges per formula unit of white mica, estimated with the measured anionic basis. End-members are abbreviated as in Table 1.
In dioctahedral micas such as muscovite, the di-trioctahedral substitution can increase cation sums (towards biotite, filling the M1 site) or decrease cation sums (via M2 vacancies). The pyrophyllitic substitution can decrease cation sums via the exchange K, leaving interlayer vacancies. In the database, analyses appear equally influenced by substitutions lowering and increasing cation sum, explaining the median value being around seven cations.
Cation ordering is an additional difficulty when deriving a general algorithm for cation site distribution and associated end-members. The tetrahedral sheets of chlorite, phengite, and biotite are very similar and generally described by two sites, each with a multiplicity of 2. Provided that tetrahedral Fe3+ appears to be rare in metamorphic chlorite (e.g. Masci et al., 2019, and references therein) and as it is often assumed to be secondary to octahedral Fe3+ in biotite, filling one of the T sites with Al after Si distribution seems consensual for all three phyllosilicates (e.g. Holland et al., 1998; Vidal et al., 2001; Holland and Powell, 2006; Tajčmanová et al., 2009; White et al., 2014; Lanari et al., 2014). However, tetrahedral Fe3+ has been reported in biotite such as tetraferriphlogopite (Brigatti, 1996). Guidotti and Dyar (1991) suggested there is little site preference for Fe3+ between T, M1, and M2 sites with an extensive biotite dataset, but Dyar (2002) reappraised this dataset to find that Fe3+ is mostly octahedral in metapelites, following criticism by Rancourt et al. (1992; see also Dyar, 1993; Rancourt, 1993). More recently, Cuadros et al. (2019) brought renewed evidence for significant tetrahedral Fe3+ in phyllosilicates, including dioctahedral and trioctahedral micas. Cuadros et al. (2019) link high tetrahedral Fe3+ contents to phyllosilicates with elevated total iron (Fetot) and Mg contents crystallized in oxidizing conditions, with differences between di- and trioctahedral phyllosilicates due to steric hindrance (of greater impact in dioctahedral phyllosilicates). A weak site preference could be the consequence of near-ideal Fe3+–Al substitution, as reported elsewhere (e.g. Andrieux and Petit, 2010); however Al remains the dominant trivalent tetrahedral cation. The following section focuses on Si–Al ordering, where Al avoidance is fundamental, and it might be that Si–Fe3+ ordering follows the same logic.
XRD refinements have invariably shown that tetrahedral cations are equally distributed over the two T sites in Mg-rich chlorite (e.g. Rule and Bailey, 1987; Nelson and Guggenheim, 1993; Smyth et al., 1997; Guggenheim and Zhan, 1999; Welch and Marshall, 2001; and Zanazzi et al., 2006, 2009, for clinochlore, and Brown and Bailey, 1963, and Phillips et al., 1980, for kammererite). However, Welch et al. (1995) showed that Al avoidance is respected in clinochlore (i.e. there is minimal Al–O–Al linkage in tetrahedral sheets), which led Holland et al. (1998) to suggest distributing Al into the T2 site. This modelling strategy reproduced the experimental results of Baker and Holland (1996) and respected Al avoidance because T2 sites are only linked to T1 sites (Fig. 5), despite contradicting structural refinements, with consequences for thermodynamic modelling of solid solutions as described below.
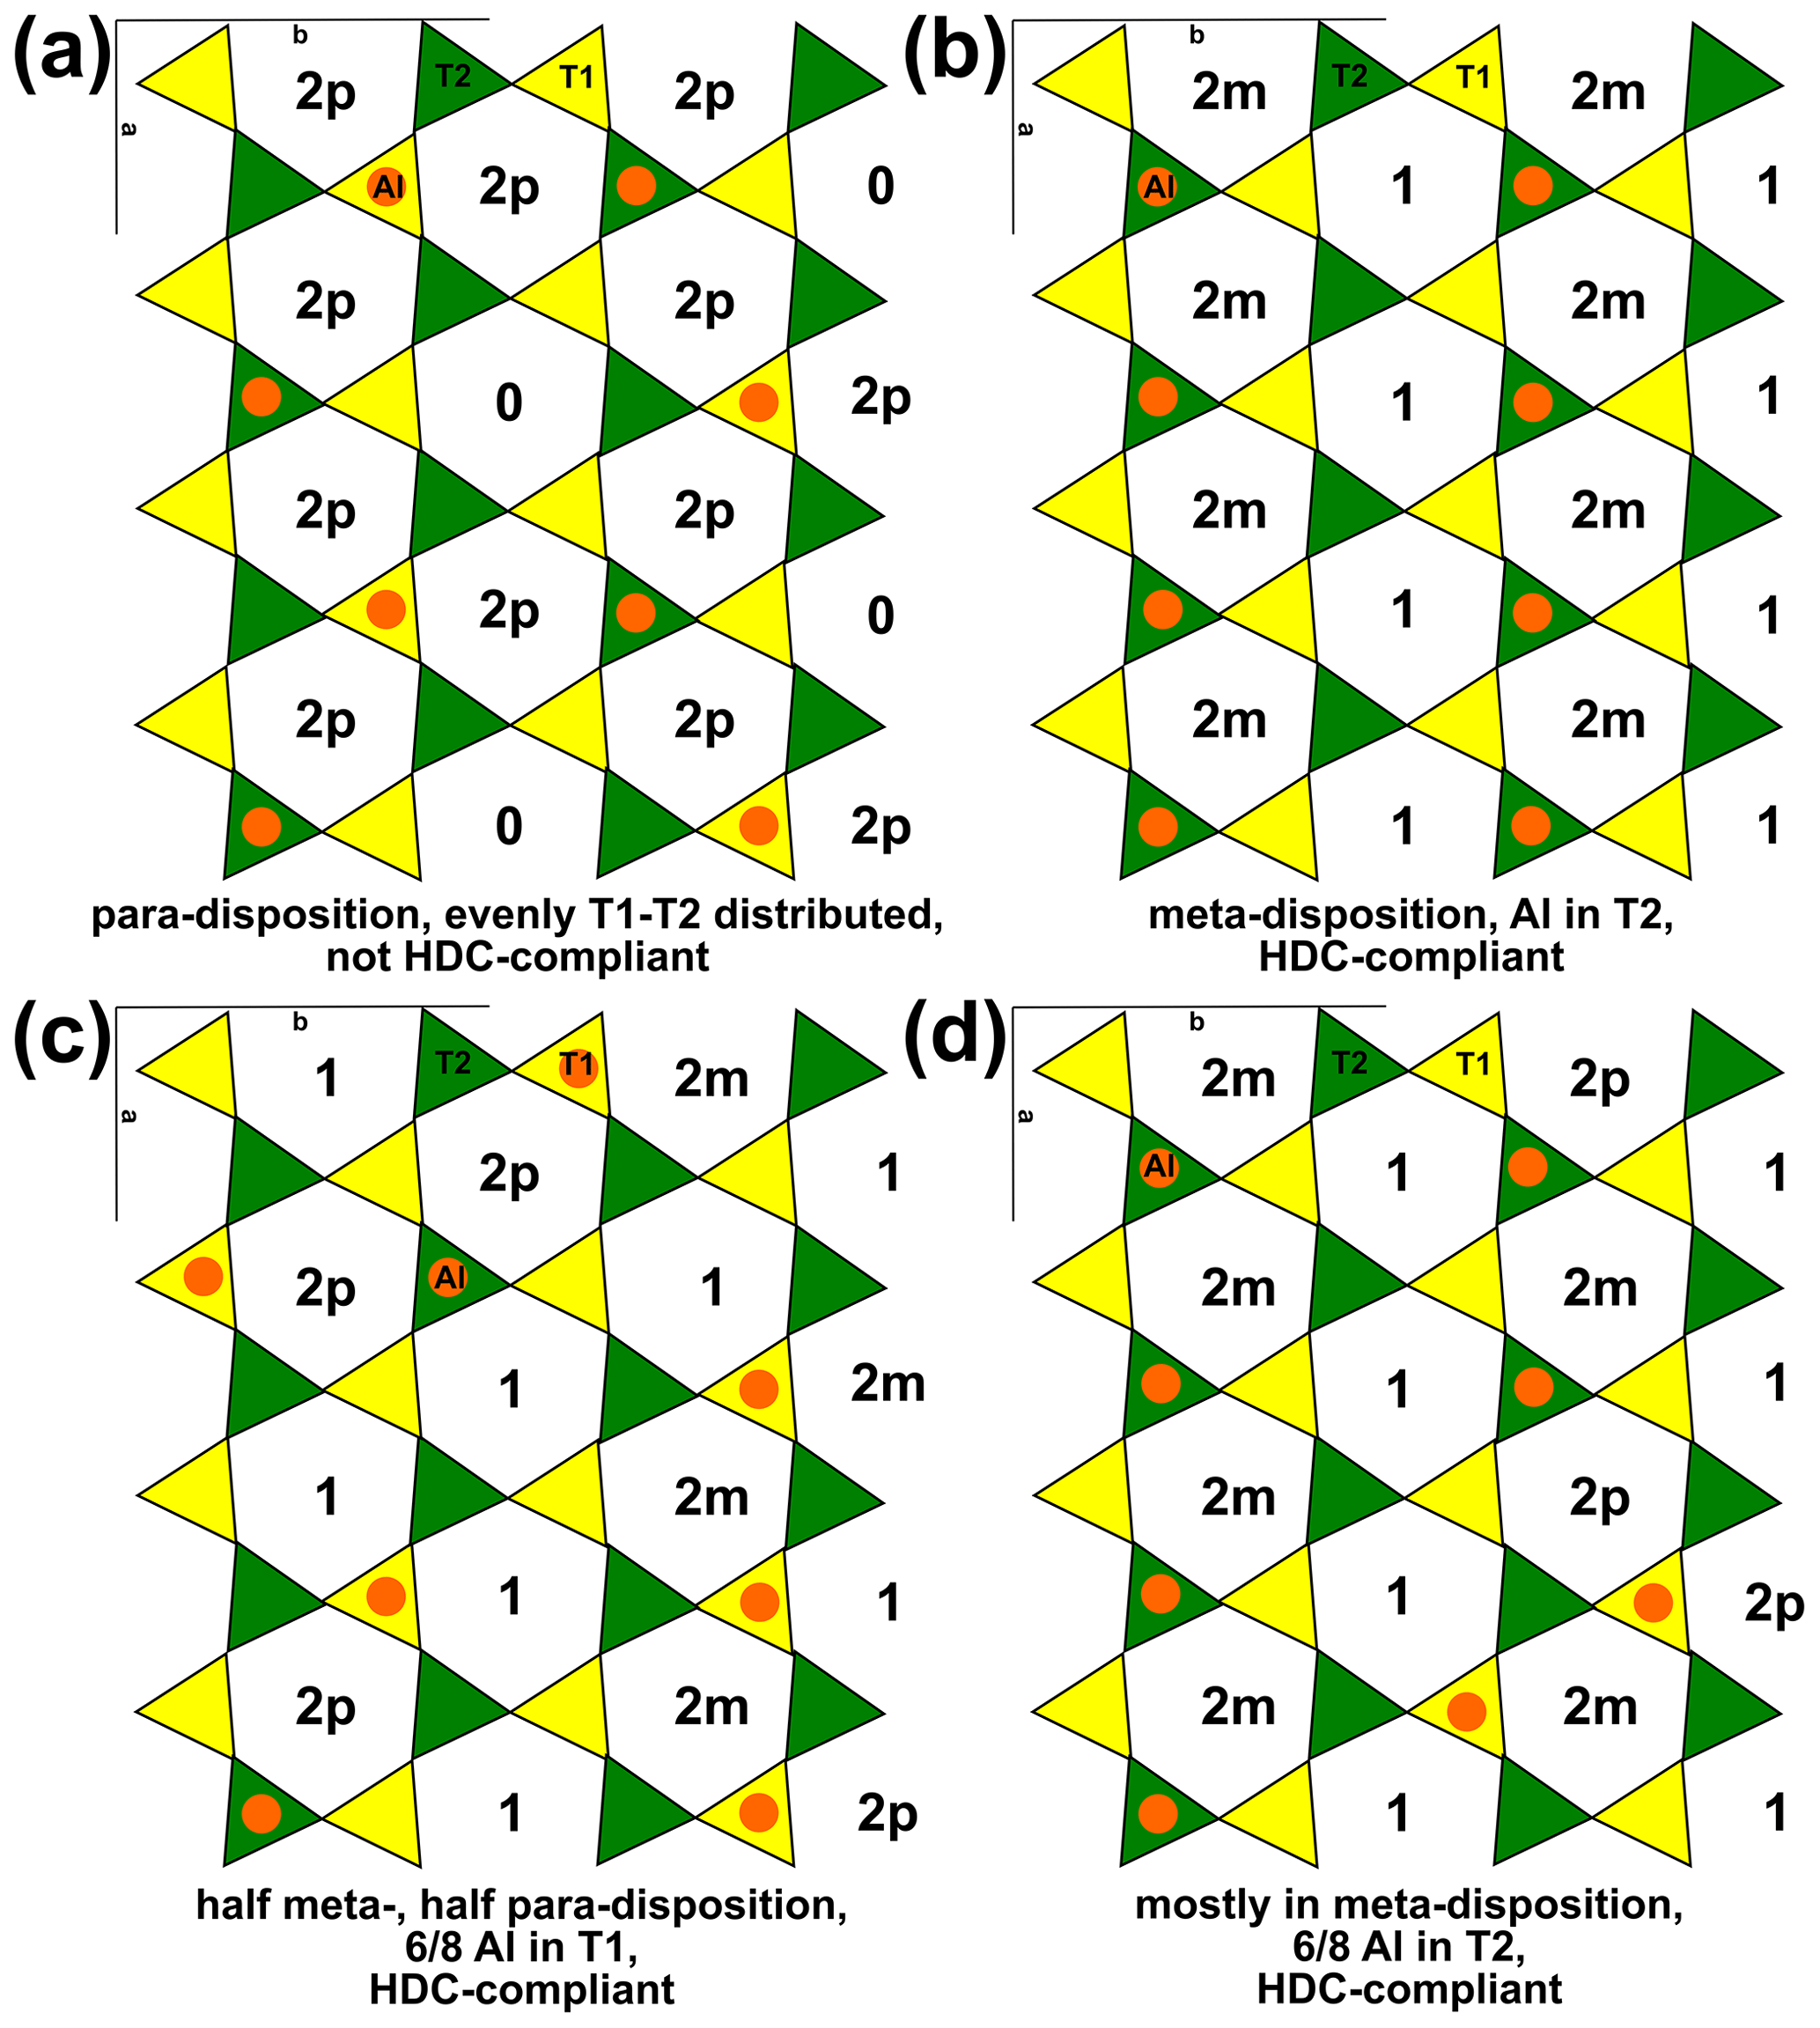
Figure 5Example tetrahedral sheets of a phyllosilicate in planar view, with one Al atom every four T sites, as in muscovite, phlogopite, and clinochlore. T1 sites are in yellow, and T2 sites are in green. Al is shown as orange circles. The number of Al atoms in each ring is indicated with the disposition when rings contain two Al atoms, with 2m denoting meta-disposition and 2p denoting para-disposition. Al avoidance is respected in each panel. (a) All Al atoms in para-disposition, resulting in rings containing either two or no Al atoms. (b) Al in T2, implying meta-disposition (inconsistent with XRD studies). (c) Al in meta- and para-disposition, mostly located in T1. (d) Al mostly in meta-disposition in T2 (six rings in meta-disposition, three in para-disposition, seven with only one Al atom). Drawn after the structure of Nelson and Guggenheim (1993).
There is little doubt that short-range ordering with avoidance of Al–O–Al linkages is important along the entire compositional range T(Si4Al0) (e.g. Al-free chlorite, talc, pyrophyllite)–T(Si3Al) (clinochlore, phlogopite, muscovite)–T(Si2Al2) (amesite, eastonite, margarite). Ordering over longer ranges, with site preferences for Al, is clear for high Al contents but less explicit for compositions around T(Si3Al). For example, Clemens et al. (1987) documented Si–Al ordering exclusively in low-temperature biotite. Muscovite typically exhibits disorder in its common 2M1 polytype, but conflicting reports and challenges to such ordering have surfaced in muscovite-3T (Güven and Burnham, 1967; Bailey, 1975; Amisano-Canesi et al., 1994). In true amesite (the TO phyllosilicate and not the virtual Al-rich chlorite end-member of Table 1), tetrahedral ordering is generally high (consistent with the Al-in-T2 hypothesis) and associated with octahedral ordering (Anderson and Bailey, 1981; Hall, 1979; Serna et al., 1977). Margarite also shows strong ordering with strict Al avoidance (Joswig et al., 1983; Guggenheim and Bailey, 1975, 1978). Eastonite and its Fe-equivalent siderophyllite are purely virtual end-members and thus provide no insights into Si–Al ordering: Livi and Veblen (1987) have shown that crystals of eastonite composition are, in reality, mixtures of serpentine and phlogopite featuring tetrahedral sheets of varying composition (consequently, the enthalpy of formation of the eastonite end-member relies on activity models in estimates by Holland and Powell, 1998, and by Dachs and Benisek, 2019, 2021).
Experiments using 29Si NMR (nuclear magnetic resonance) emphasize the importance of Al avoidance and the homogeneous dispersion of charges (HDC; see, for example, Herrero and Sanz, 1991). HDC proposes that tetrahedral rings should contain an Al atom count that is as close as possible to the average tetrahedral Al proportion, aiming for minimal charge imbalance. For tetrahedral sheets with compositions around T(Si3Al), Herrero et al. (1987) deduced from 29Si NMR measurements that there are about twice as many rings with Al in meta-disposition (i.e. separated by one Si tetrahedron) than in para-disposition (i.e. separated by two Si tetrahedra; Fig. 5). Therefore, Herrero et al. (1987) dismissed the Al-in-T2 hypothesis because para-disposition implies T1 and T2 occupancy.
Computer simulations also show that Al avoidance is maintained without a pronounced site preference for Al, potentially throughout the entire temperature range of phyllosilicate stability (e.g. Palin et al., 2001). However, such simulations generally indicate that Al in para-disposition is the most stable configuration at T(Si3Al) (Fig. 5a; e.g. Sainz-Diaz et al., 2001; Palin et al., 2001; Palin and Dove, 2004; Dubacq et al., 2011; Figowy et al., 2021), which contradicts HDC. A possible explanation for this discrepancy is that distributing Al exclusively in para-disposition (as in Fig. 5a) requires kinetically prohibitive equilibration for small energetic gains. In contrast, meta-disposition (Fig. 5b) and combinations of meta- and para-dispositions (Fig. 5c–d) can maintain Al avoidance. The formation of second-neighbour Al pairs in meta-disposition is considerably less energetically demanding than first-neighbour Al–Al linkages (e.g. Bosenick et al., 2001). Consequently, the disposition of Al atoms may be as much influenced by octahedral ordering as by second-neighbour tetrahedral Al–Al linkages. In addition, structures with Al exclusively in para-disposition require a maximum of one Al every four T sites. This restriction makes adding a single Al atom impossible without creating Al–Al linkages in structures solely featuring para-disposition (Fig. 5a). Comparatively, several sites are available to Al in the differently distributed structures schematized in Fig. 5c–d. Therefore, exact compliance with para-disposition over large distances is impossible at Al content above T(Si3Al), and increasing Al content should decrease the proportion of Al in para-disposition until it disappears near T(Si2Al2). For intermediate compositions, it is possible that various ordering schemes (as illustrated in Fig. 5) are respected in domains smaller than the coherent length scale of XRD (as suggested by Welch et al., 1995).
The emerging picture is that the ordering pattern of phyllosilicates with one Al every four T sites (clinochlore, muscovite, phlogopite) is incompatible with that of phyllosilicates with one Al every other T site (amesite, margarite), analogous to the arrangement found in albite (one Al every four T sites) and anorthite (one Al every other T site) in plagioclase feldspars (see Dubacq, 2022). This is consistent with the concept of non-ideal mixing necessary to respect a high degree of Si–Al short-range order. For this reason, not all sites are available to Al, and configurational entropy should be small until ∼ 600 °C in albite and ∼ 1000 °C in anorthite (Dubacq, 2022). Extrapolation to phyllosilicates suggests that for first-order approximation, tetrahedral Al should be evenly distributed between T1 and T2 at low Al content levels, but octahedral ordering will likely play a role too in phyllosilicates. With TAl content increasing above , Al should gradually favour T2, such as T1Al (TAl−1) and T2Al = 0.5+1.5 (TAl−1). This scheme reproduces the observed rapid increase in long-range order with increasing Al content (Vinograd, 1995; for the impact of ratios on ordering, see also Dove et al., 1996), as shown in Fig. 6. A drawback is that there is a discontinuity in the Al site partitioning in the solid solution, showing that this approximation is simplistic. The actual cation distribution is expected to depend on temperature and octahedral ordering, with a limited contribution of tetrahedral sheets to configurational entropy following crystal–chemical constraints set by Al avoidance and HDC (making some sites unavailable to Al and translating into non-ideal mixing entropy). Consequently, there should be no configurations where T1Al contents significantly exceed 0.5, which should be at a maximum around T(Si3Al) (as in clinochlore, muscovite, and phlogopite). Therefore, end-members with T1Al > 0.5 are probably undesirable, and the usual end-members with T(Si3Al) are appropriate for modelling with T1Al = T2Al = 0.5. Cation distributions may be improved by forward thermodynamic modelling, which will set end-member proportions.
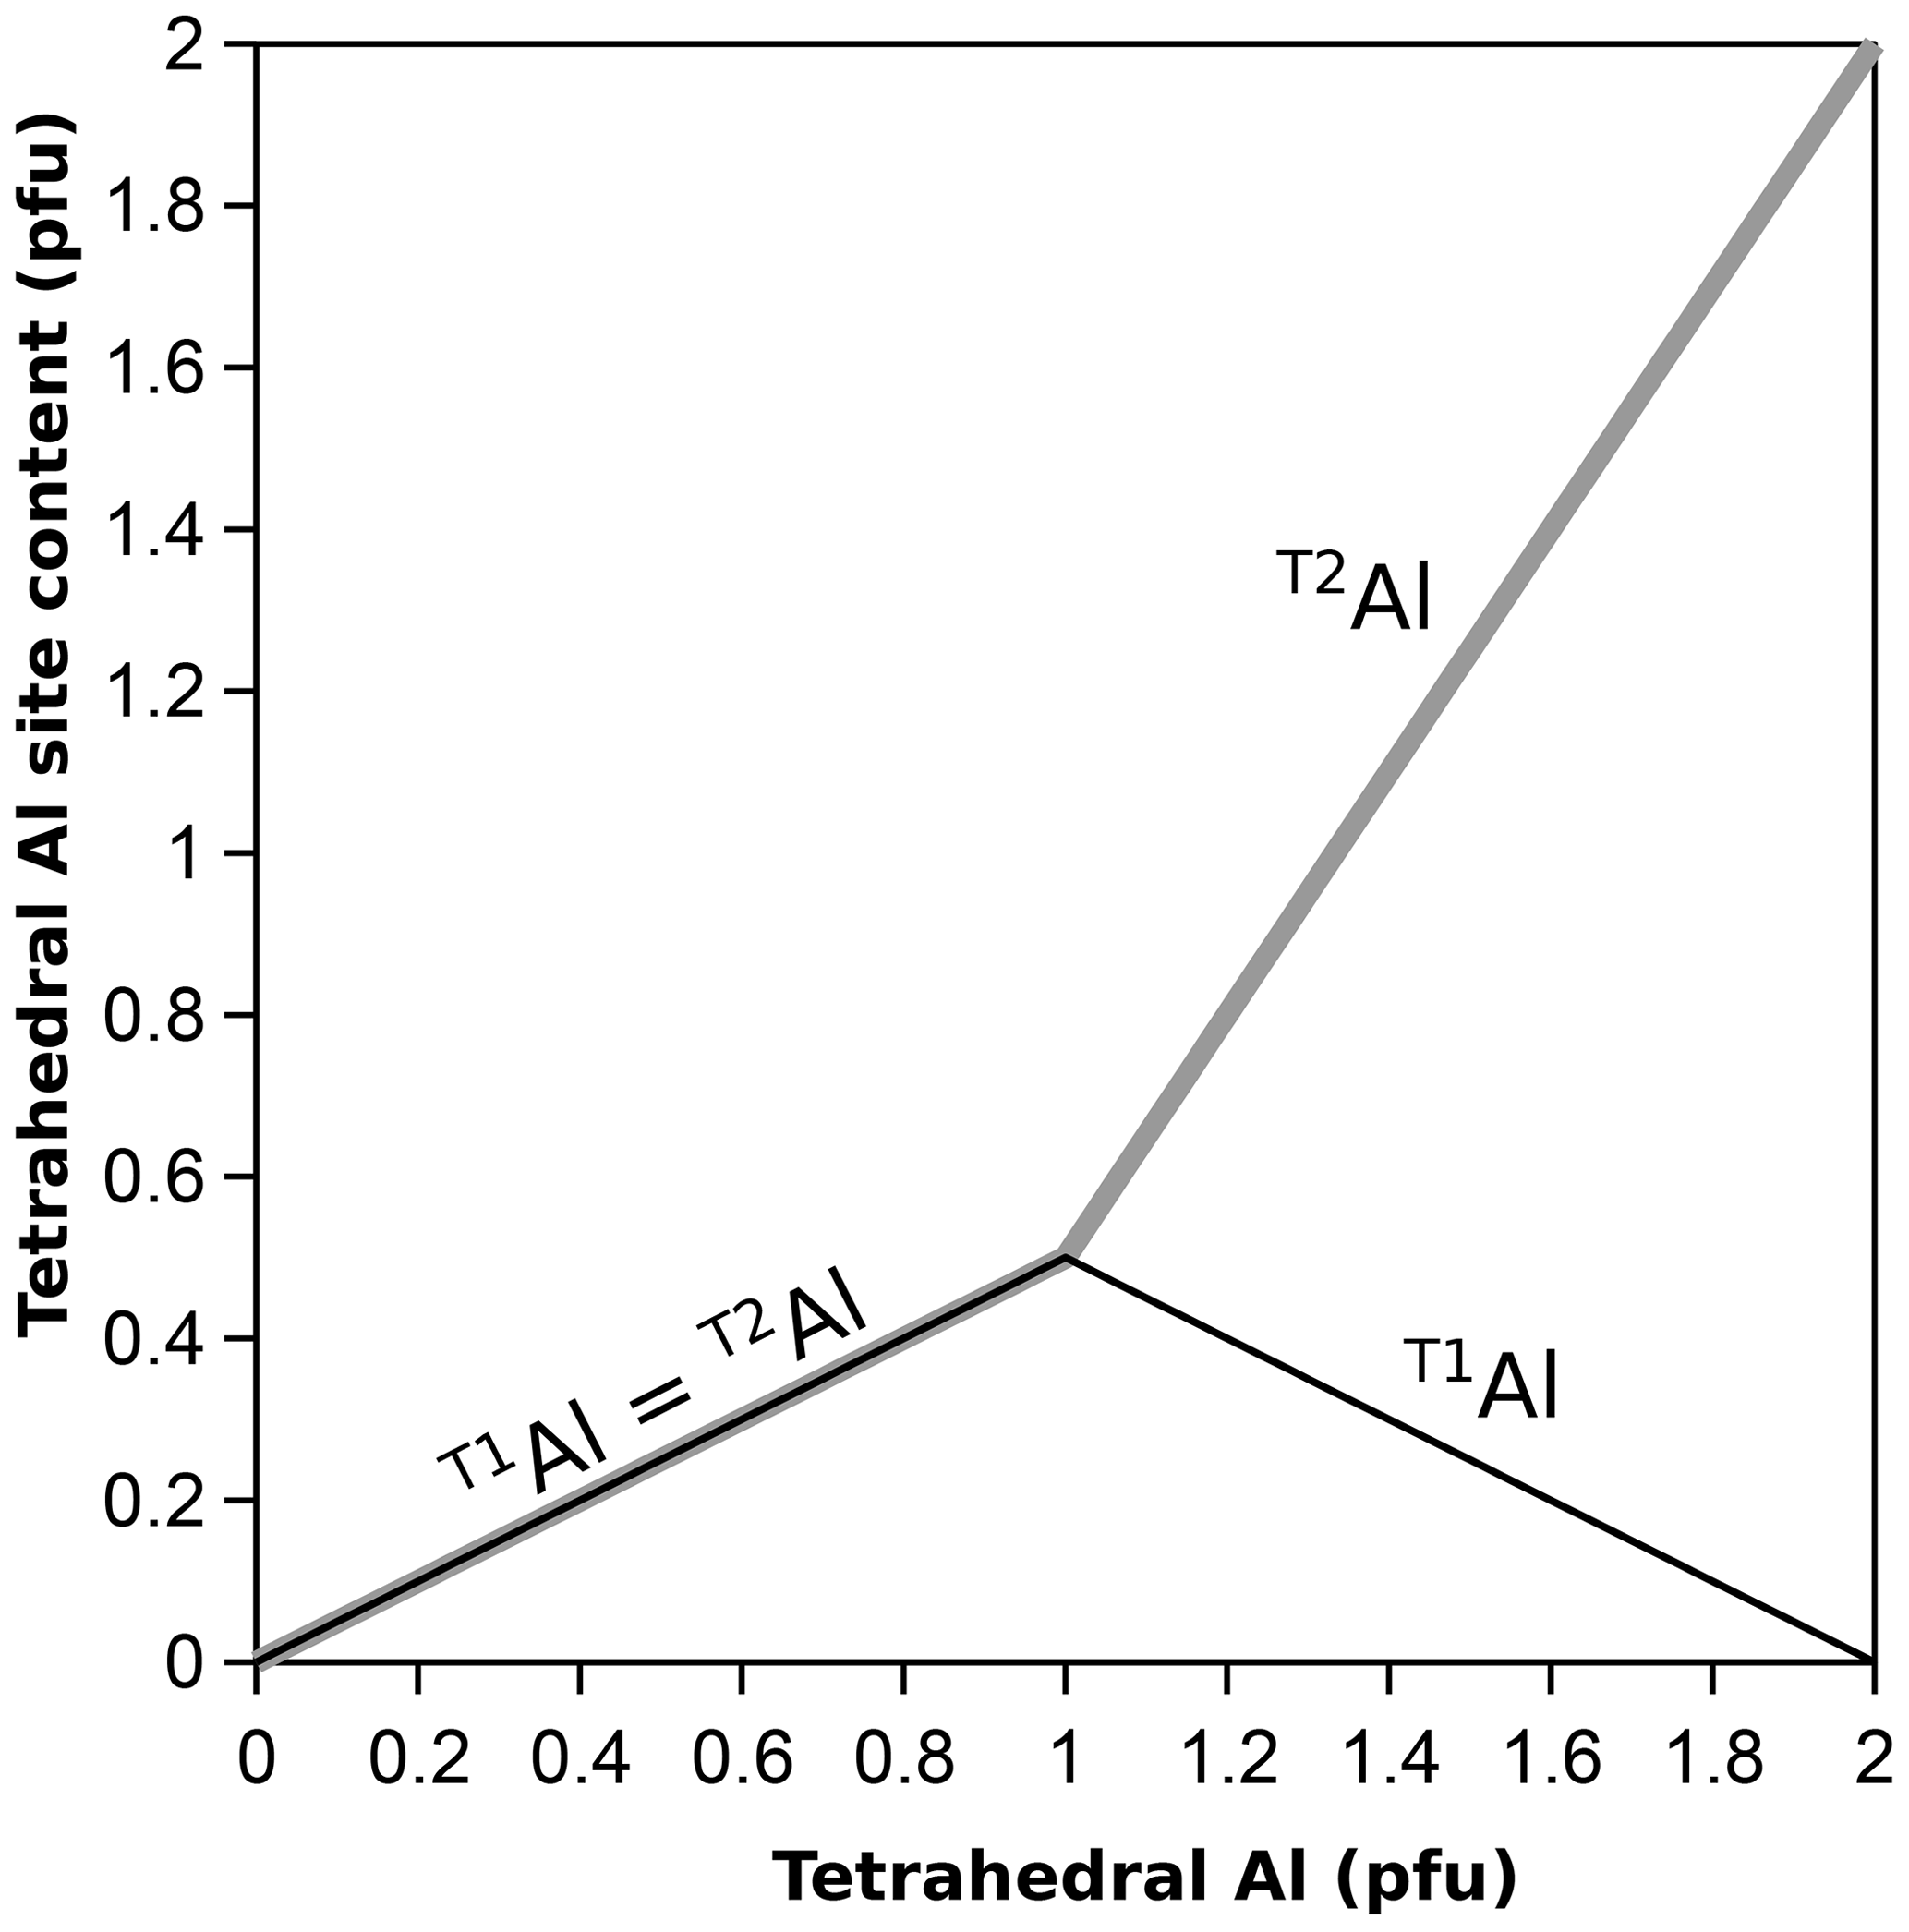
Figure 6Indicative site distribution of tetrahedral Al in T1 and T2 from zero (Al-free chlorite, aluminoceladonite, talc) to two (amesite, margarite, siderophyllite) Al atoms per four tetrahedral cations.
Figure 7 presents mineral compositions in the form of elemental ratios, with divalent and trivalent cations summed by charge and normalized to Si; normalization does not use an anionic basis. This approach illustrates compositional substitutions and allows assessment of the relevance of different end-members.
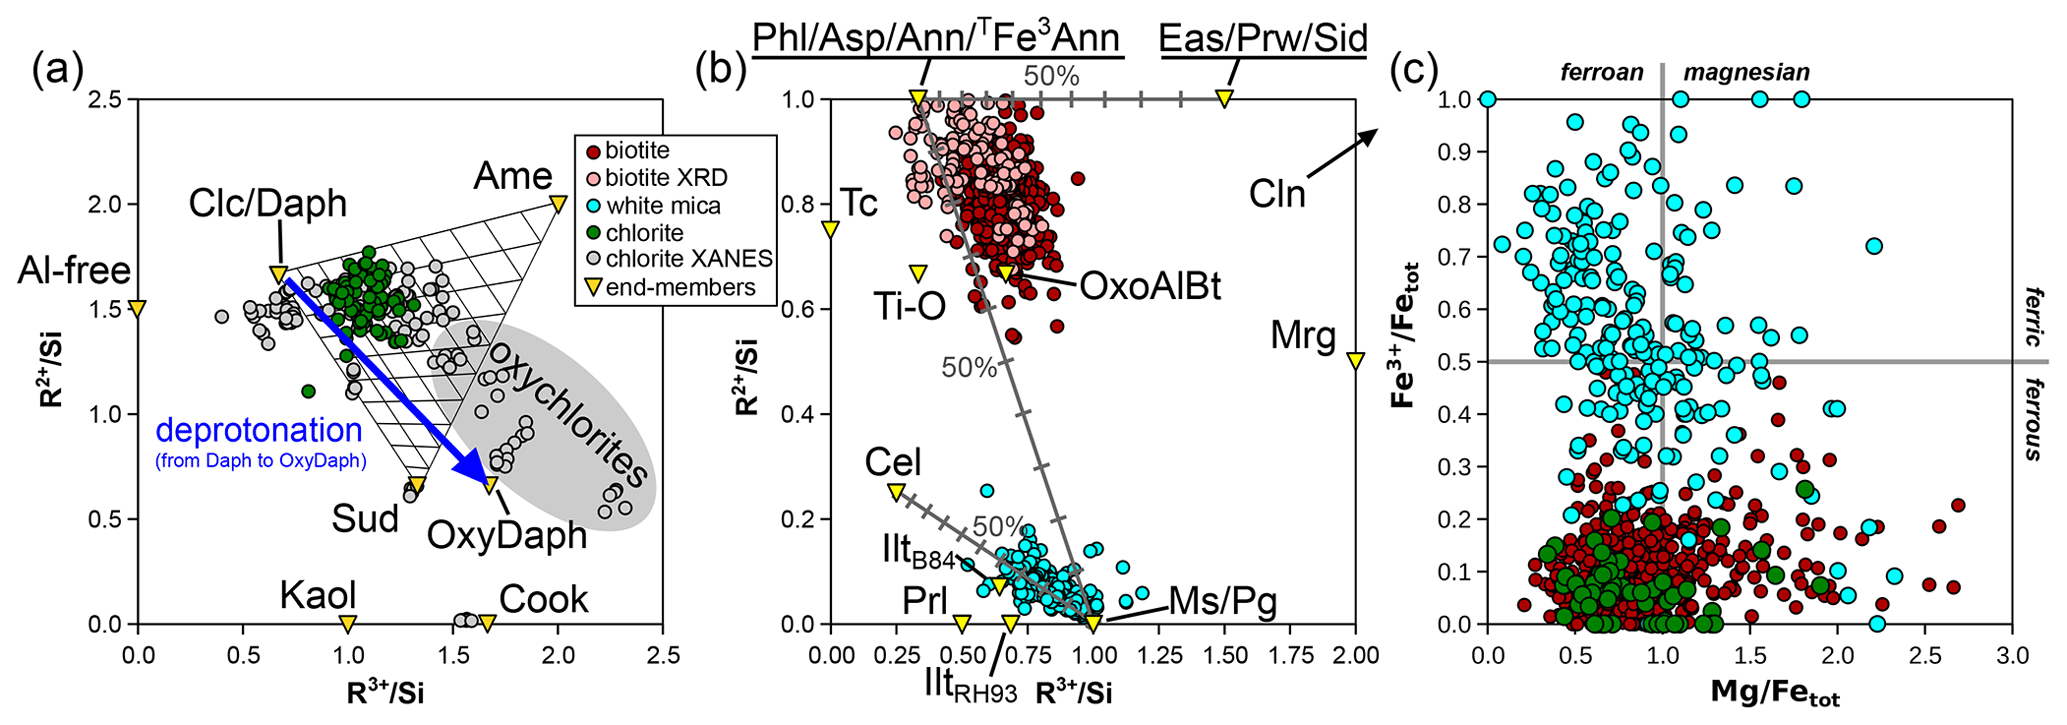
Figure 7Elemental ratios (in moles per mole of Si) for chlorite (a), micas (b), and both (c). Minerals and end-members are shown in yellow triangles and abbreviated as in Table 1. Labelling is as in Fig. 1, with “chlorite XANES” data from Masci et al. (2019). In (a), a mixing model is shown for compositions from intermediate to clinochlore, amesite, and sudoite. The grey field corresponds to deprotonated analyses identified as “oxychlorite” by Masci et al. (2019). The blue arrow shows the effect of deprotonation during oxidation of daphnite to tri-oxydaphnite (see Table 1). In (b), binary mixing models are presented between phlogopite and eastonite, between phlogopite and muscovite, and between muscovite and aluminoceladonite.
5.1 Chlorite
Figure 7a presents divalent and trivalent cation proportions normalized to Si. This figure is assumed to capture the entire cation variability in chlorites, even though small amounts of K, Ti, Na, and Ca are frequently reported, with large variability and skewed distribution. The median K content is 0.20±0.22 ox. wt % (i.e. ∼ 0.013±0.0030 apfu); Ti is in the same range, and Na and Ca are well below 0.01 apfu. Contamination by mica is a possible origin for these cations; at these levels, consequences for formula units are negligible, as shown above (Fig. 2d).
The majority of analyses fall within the triangle formed by clinochlore–amesite–sudoite in the MASH system or their homologous substitution equivalents (e.g. daphnite–ferroamesite–ferrosudoite in FASH).
In this triangle, end-member proportions are calculated using atomic proportions and the following formulae:
where n is un-normalized content; X is a fraction; and the subscripts Ame*, Clc*, and Sud* indicate amesite-,clinochlore-, and sudoite-type end-members (e.g. kammererite, the Al ↔ Cr-homologous substituted equivalent of clinochlore, is identified as being of clinochlore type, as with daphnite, Table 1). These proportions reflect fractions of compositional end-members and not ideal activities in the thermodynamic sense (see Powell et al., 2014). This set of equations may be used to estimate end-member proportions directly from in situ chemical analysis, such as those obtained by electron microprobe, assuming that all cations are measured (including light elements such as Li) and that deprotonation is negligible.
When compared to the mixing model in Fig. 7a (non-linear in this graph), it is evident that the analyses are centred around 25 % of the amesite-type end-member (Si = 2 pfu) and 15 % of the sudoite-type end-member ( pfu). Most of the analyses lie between 10 % and 30 % of the sudoite-type end-member.
Figure 8 compares the sudoite-type fraction obtained with Eq. (2) and the octahedral sum calculated using the 14-(O,OH) basis (Fig. 8a) and 28-charge basis (Fig. 8b). The correlation is weak in the first case and excellent in the second. Similarly, there is a strong correlation between the estimated amesite-type fraction and the Si content (Fig. 8c). The weak correlation observed between octahedral sums calculated using the 14-(O,OH) basis (Fig. 8a) is due to inconsistencies and/or uncertainties in H2O+ contents, as highlighted in Fig. 2b. Variations above the ideal red line for di-trioctahedral substitution in Fig. 8b, and below in Fig. 8c, are due to Ti and alkali content, which are not present in the end-members but counted as octahedral cations (see discussion of Ryan and Reynolds, 1997).
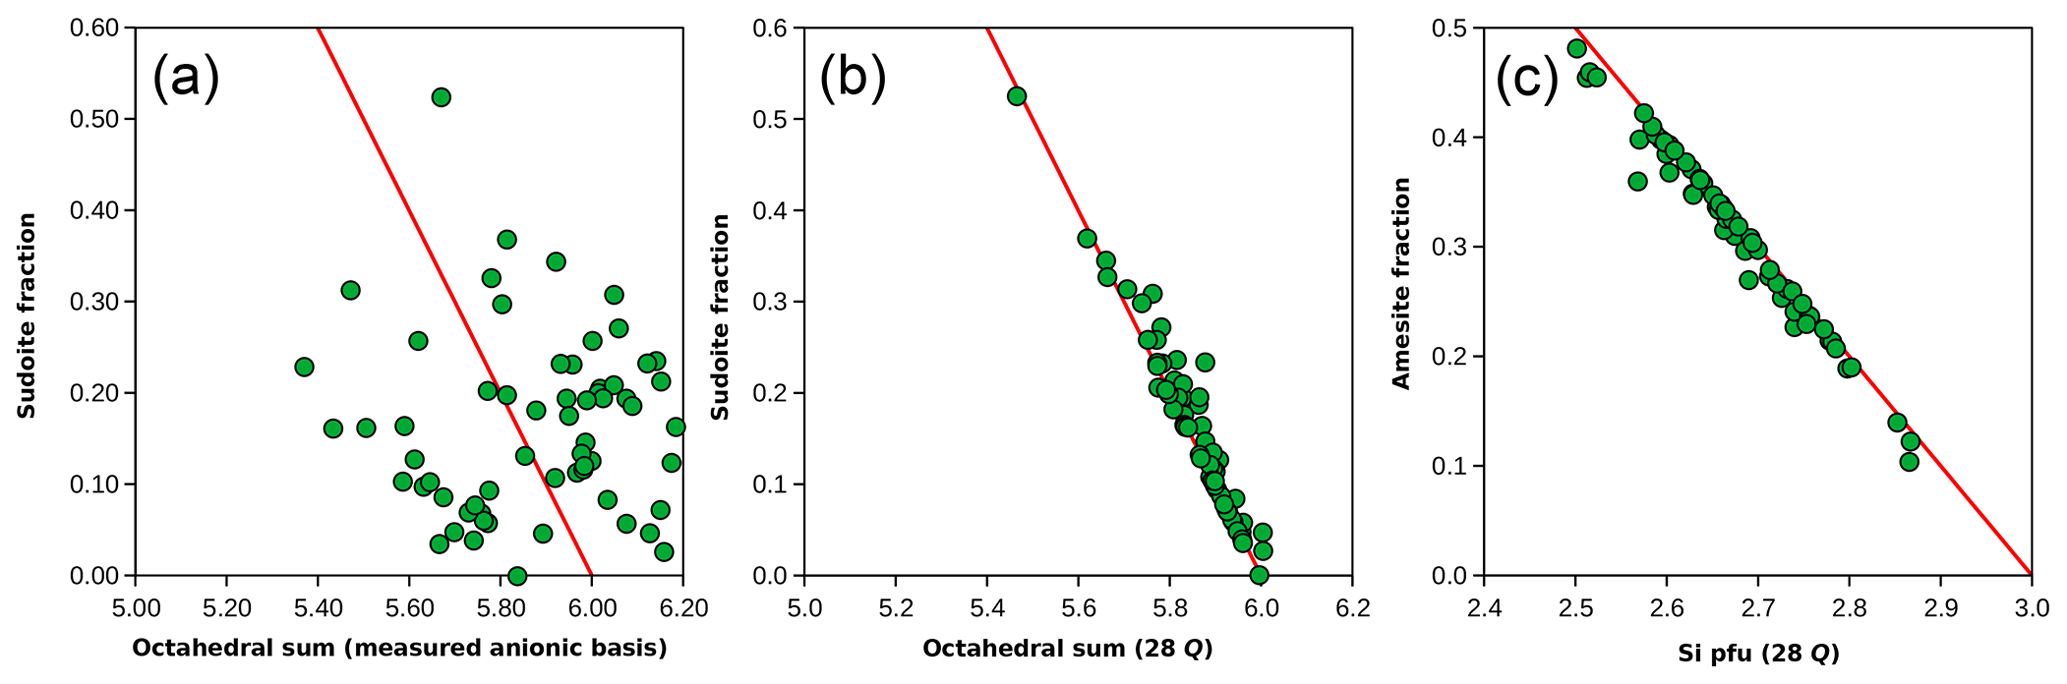
Figure 8End-member proportions compared to formula unit features. (a, b) The sudoite fraction calculated from the Eq. (2) set is compared to the octahedral sum estimated with the measured anionic basis (a) and with the 28-charge basis (b). The red line shows the effect of di-trioctahedral substitution. (c) The amesite fraction compared to Si content, estimated with the 28-charge basis.
For analyses falling in the clinochlore–sudoite–Al-free chlorite triangle, the following set of equations may be used:
with the same formalism as the Eq. (2) set and proportions obtained from normalized end-member contents.
The sets of Eqs. (2) and (3) can be readily modified to include specific end-member proportions (e.g. Cr to take kammererite proportions into account for ultramafic rocks; see Herviou and Bonnet, 2023).
The natural metapelite database shows that regardless of the method of estimating end-member proportions, two substitutions are of central importance. The Tschermak substitution (Si4+ + M2+ ↔ TAl + MAl, e.g. from clinochlore to amesite) is as frequent as the di-trioctahedral substitution (3 M2+ ↔ 2 M3+ + M□, e.g. from clinochlore to sudoite), with a sudoite-type component explaining up to 30 % of chlorite compositions (Figs. 7a and 8a, b).
Whilst chlorite in the natural database is mostly Fe-rich and ferrous (Fig. 7c), its Fe3+ content is greater than 0.1 pfu for ∼ 63 % of the analyses. Substitutions involving Fe3+ are of three major types in chlorite: (i) a homologous substitution with trivalent cations (MAlFe3+, e.g. from clinochlore to ferriclinochlore); (ii) a coupled substitution with divalent cations, thus creating vacancies (3 M2+ ↔ 2 Fe3+ + M□, e.g. from clinochlore to ferrisudoite as proposed by Trincal and Lanari, 2016); and (iii) a deprotonation substitution in the form Fe2+ + OH− ↔ Fe3+ + O2− + H2↑ (where H2 leaves the structure – see Lempart et al., 2018, 2020 – e.g. from daphnite to tri-oxydaphnite in Fig. 7a). Unfortunately, assessing the individual extent of these substitutions from the database is difficult because this requires more precise measurement of anionic bases than reported here. Figure 9a–b compare the dependency of Fe3+ content to the di-trioctahedral substitution, using the measured 18-(O, OH, Cl) anionic basis and the sudoite fraction calculated with the Eq. (2) set. In both cases, analyses with high Fe3+ content show a large extent of di-trioctahedral substitution, which could be interpreted as being in favour of a ferrisudoite end-member. However, without a proper definition of the anionic basis, the di-trioctahedral substitution cannot be separated from the effect of deprotonation during Fe oxidation, for reasons detailed by Masci et al. (2019). Figure 9c shows that Fe is mostly in a divalent state ( < 30 %) in the natural pelitic chlorite database, in contrast with the possible variability in chlorite illustrated by the data from Masci et al. (2019) being biased towards Fe3+-rich chlorite. Yet the dependency of formula unit estimation on iron speciation is high, especially when using a fixed-charge basis, because Fe is generally abundant and Fe3+ is among the highly charged cations (impacting normalization constants more than low-charge cations would). A ±10 % variation in iron speciation () leads to ∼ 0.1 pfu uncertainty in cation sums for a chlorite with 25 wt % FeOtot (i.e. close to the median value of the database). Figure 9d illustrates chemical trends with varying Fe3+ content using elemental ratios, without the anionic basis. Most Fe3+-rich analyses show an ratio below that of clinochlore, with the consequence that most plot out of the area defined by clinochlore–amesite–ferriclinochlore. The apparent increase in sudoite-type end-member content for Fe3+-rich chlorite persists, but whether ferriclinochlore or ferrisudoite is best-suited for modelling remains unclear. Ferriclinochlore appears suitable as a compositional end-member for chlorite in the domain sudoite–amesite–ferriclinochlore (Fig. 9d), yet it is possible that substitutions take place towards both end-members.
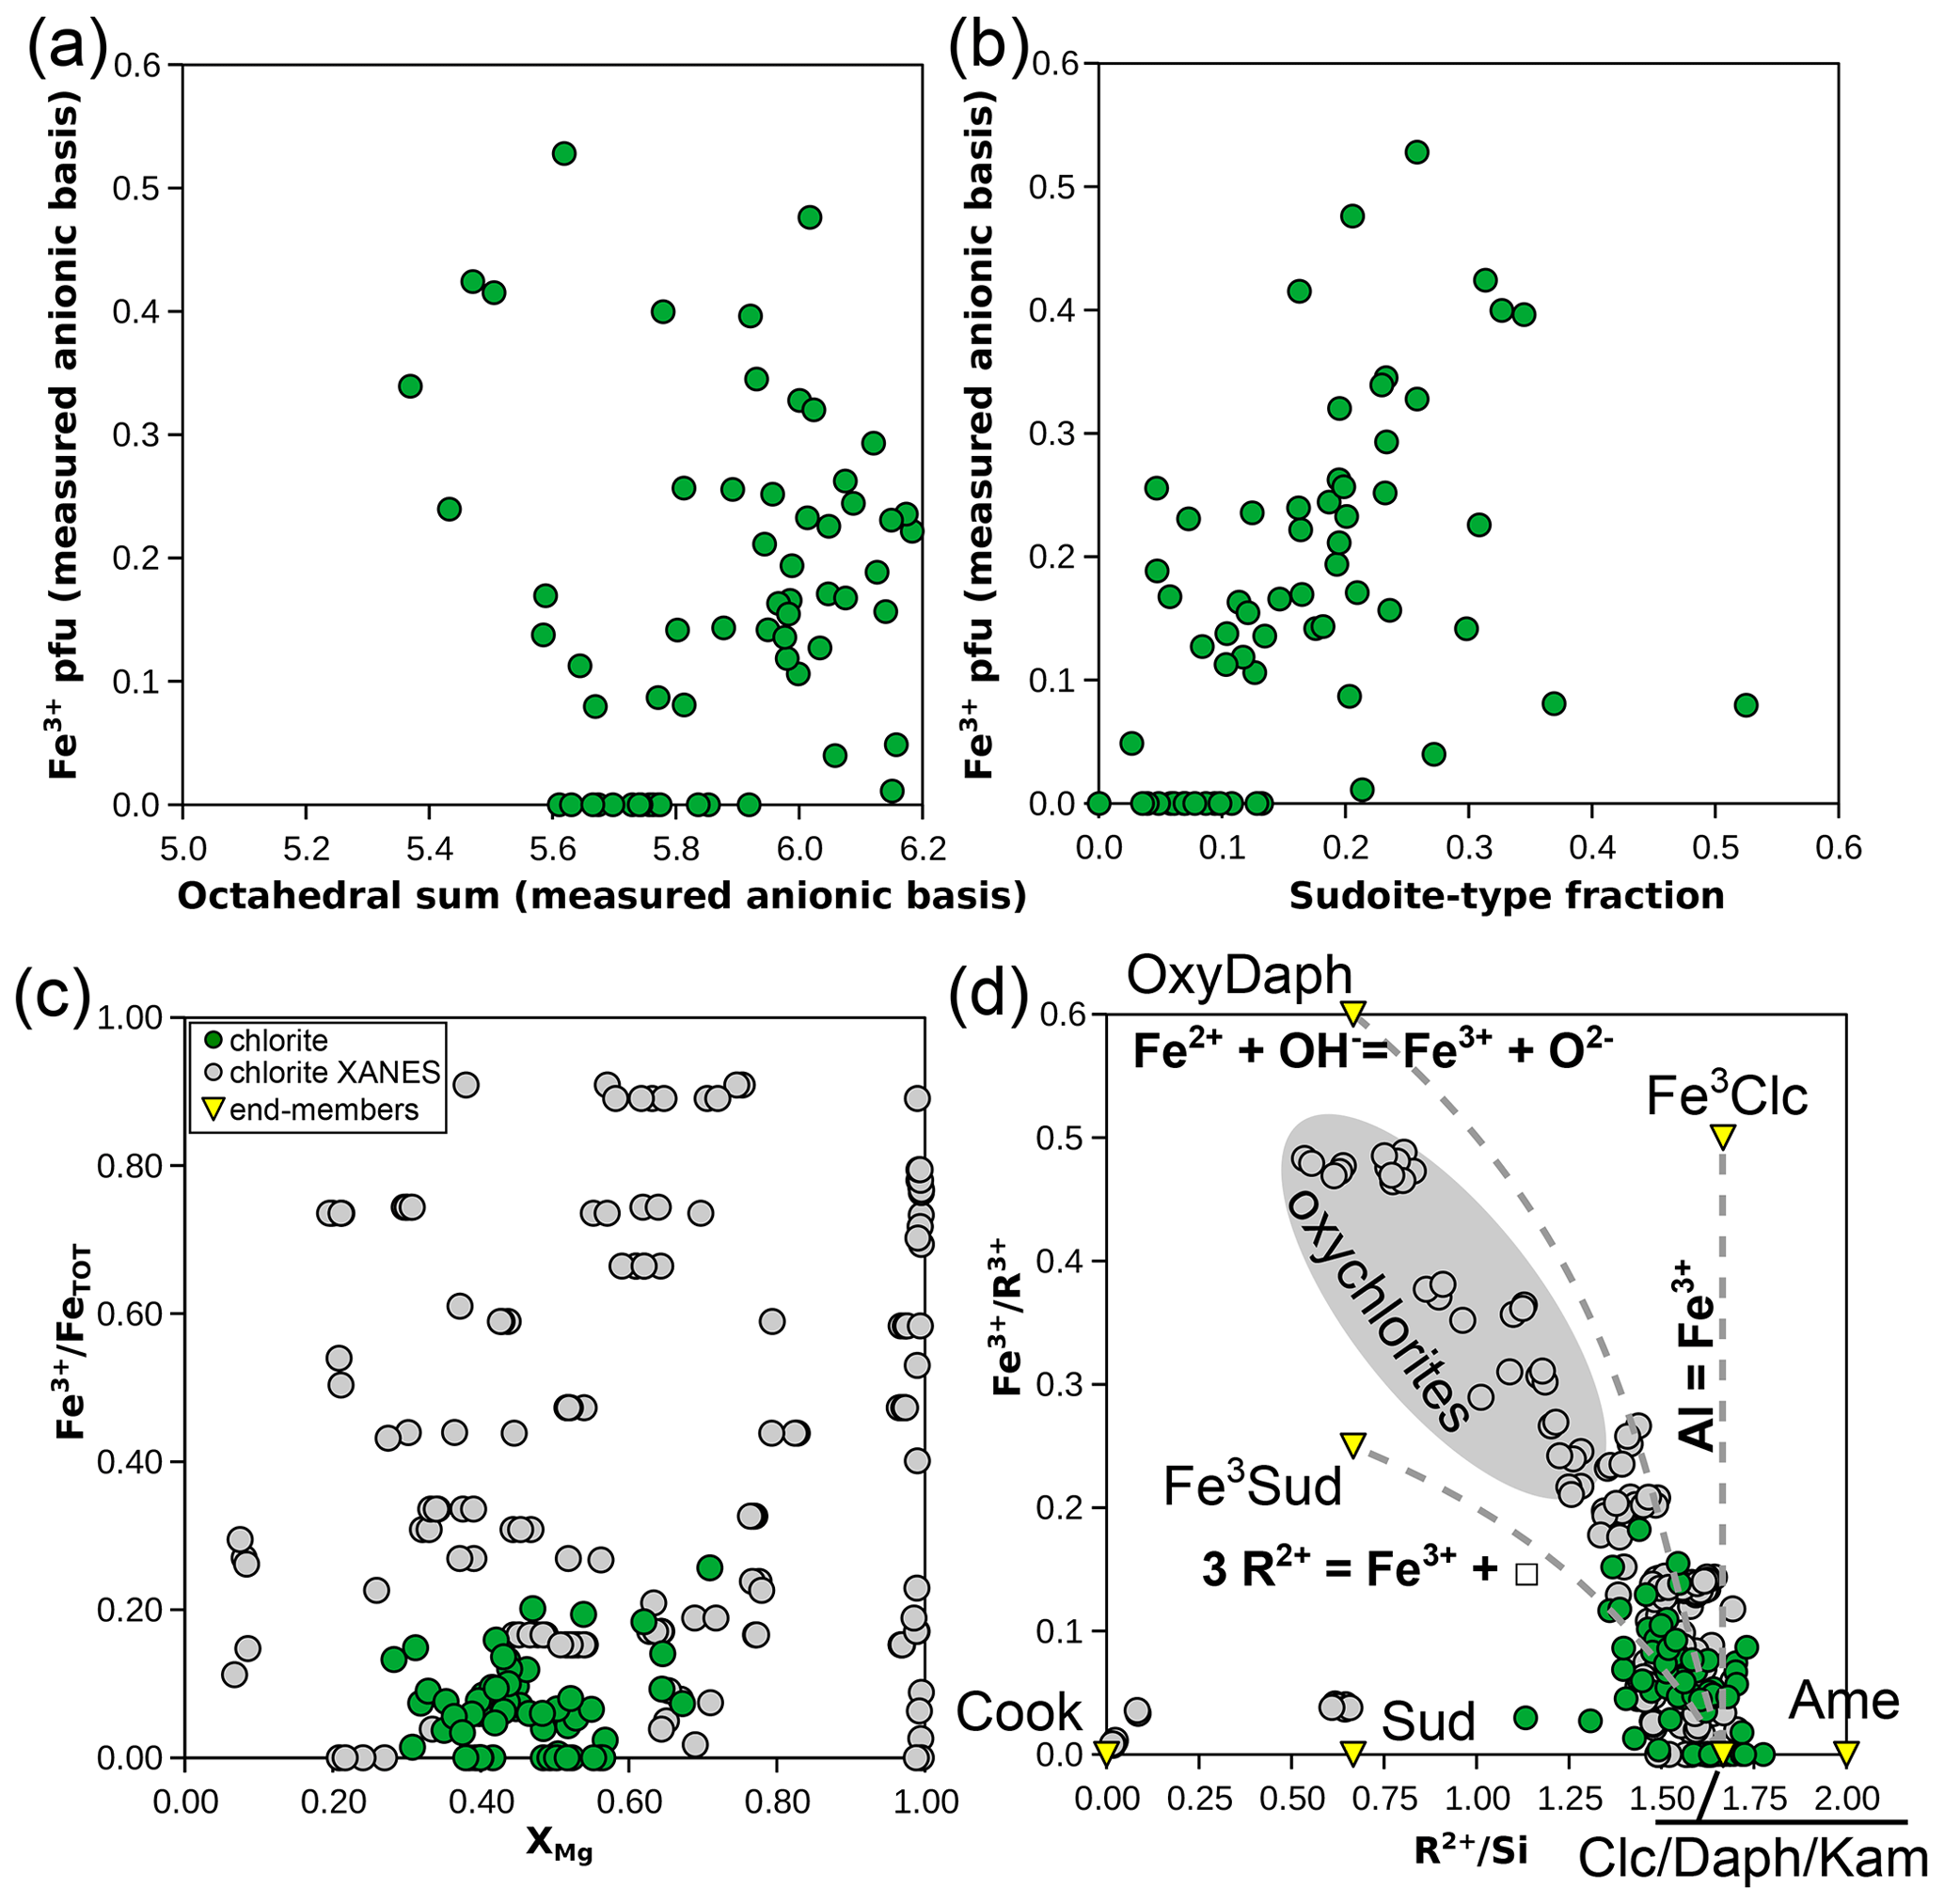
Figure 9Investigation of substitutions involving Fe3+ in chlorite. (a) Fe3+ pfu versus the octahedral sum, both estimated with an 18-(O, OH, Cl) anionic basis. (b) Fe3+ pfu (the same anionic basis as a) versus the fraction of sudoite-type end-member, calculated as in the Eq. (2) set. Panels (c) and (d) present element proportion ratios, without the anionic basis: (c) for versus XMg and (d) for Fe3+ over the sum of trivalent elements, shown against (labelling as in Fig. 5a).
Octahedral vacancies may be assumed to be limited to the octahedral sheet of the TOT layer and to the M1 site for symmetry reasons, consistent with the models of Vidal et al. (2001) and Lanari et al. (2014). However, cation distribution into the M2 and M3 sites must be differentiated for the correct charge distribution around octahedral vacancies because the di-trioctahedral substitution mostly occurs in the TOT sheet (including M2) and not in the brucitic sheet (including M3) – consequently, there are no di-trioctahedral chlorites with a dioctahedral brucitic sheet (e.g. Bailey and Lister, 1989). Therefore, assuming that trivalent cations occupy M2 at least up to twice the number of vacancies ensures correct Mg–Al distribution of sudoite (e.g. Eggleton and Bailey, 1967) and minimal trivalent cation content in M3, an otherwise destabilizing feature (Nelson and Guggenheim, 1993). Welch et al. (1995) have shown that octahedral Al is surrounded by six Mg cations in clinochlore, a consequence of short-range ordering, either in M1 or in M4, the latter being preferred for Al incorporation by Welch and Marshall (2001), in line with previous studies (e.g. Bailey, 1986; Smyth et al., 1997). The M4 site is therefore recognized as the preferred site for Fe3+ incorporation (Vidal et al., 2006; White et al., 2014). In turn, the M2 site is filled with divalent cations.
The distribution of Mg and Fe2+ relative to one another has been suggested as random (i.e. equipartitioned) between the divalent sites in many thermodynamic models (e.g. Vidal et al., 2001, 2016; Lanari et al., 2014; Holland et al., 1998). Measurements of the Fe2+–Mg distribution are scarce and conflicting. Zanazzi et al. (2006, 2007, 2009) suggest equipartition between M1 and M2 in Mg-rich chlorite (Mg ∼ 4.5, Fe2+ ∼ 0.5 pfu), as well as between M3 and M4. They also propose a preference of Fe2+ for the TOT octahedra rather than for the interlayer octahedra ((M1/M2) ∼ 1 and (M2/M3) ∼ 0.65, with KD being an exchange coefficient as in Morse, 2015). Smyth et al. (1997) obtained (M1/M2) = 1.1 and (M2/M3) = 0.1, without assigning Fe2+ to M4, from a triclinic clinochlore with Mg = 4.88 and very little Fe2+ at 0.12 pfu. In more Fe-rich chlorite crystals, Rule and Bailey (1987) obtained contrasting results (Mg = 1.55, Fe2+ = 2.96 pfu): (M1/M2) = 0.56 and (M2/M3) = 1.1. Additionally, Walker and Bish (1992) obtained (M1/M2) = 1.18 and (M2/M3) = 1 for a chlorite at Mg = 1.77 and Fe2+ = 2.72 pfu. The limited number of studies on Fe-rich chamosite, generally affected by Tschermak substitution (involving an amesite-type component), alongside polytypism and the absence of systematics, makes generalizations difficult. Equipartition is attractive for its simplicity, but Holland and Powell (2006) showed that Fe2+–Mg equipartition introduces inconsistencies into thermodynamic models in terms of derivation of end-members and mixing properties, as well as activity calculations. More precisely, Holland and Powell (2006) demonstrated that Fe2+–Mg equipartition does not imply that ordered end-members should not be used in modelling solid solutions such as those of chlorite. They suggest using energy minimization to distribute Fe2+ and Mg with ordered end-members, an approach followed by Powell et al. (2014) and White et al. (2014). This approach facilitates the establishment of a consistent and comprehensive set of end-members suitable for energy minimization. In contrast, the set proposed by Vidal et al. (2006) does not allow this, in part because it lacks a ferric end-member. An inevitable drawback of this approach is the necessity for substantial “regularization”, i.e. estimating thermodynamic properties and mixing models for many virtual end-members. The set of six end-members shown by Powell et al. (2014) includes clinochlore and five fictive end-members (Al-free chlorite, amesite, daphnite, and two ordered chamosite end-members) for which crystal–chemical constraints are lacking. A pragmatic approach is to apply Fe2+–Mg equipartition as a first-order approximation for describing chlorite formula units, as there is no evidence that equipartition is generally wrong in chlorite, but following the rules described by Holland and Powell (2006) and Powell et al. (2014) for thermodynamic modelling. A total of 11 independent end-members (calculated with the method described by Myhill and Connolly, 2021) are theoretically necessary to account for Mg–Fe2+, M4Fe3+–M4Al3+, di-trioctahedral, and Tschermak substitutions within a six-site model (T1, T2, M1, M2, M3, M4) where M3 never contains trivalent cations (as in the database). This set of end-members includes Al-free chlorite, which is not necessarily relevant to Al-rich metapelites but is probably important in relatively Al-poor mafic rocks. A total of 256 dependent end-members arise, of which 228 violate the crystal–chemical rules set above (such as T1Al < 0.5 or M2Al = 2 M1□) or exceed 2 TAl apfu. These end-members can be discarded because, otherwise, they would allow substitutions towards unreasonable domains. Nine independent end-members consistent with these rules remain; they may include clinochlore, sudoite, amesite, Fe-amesite, daphnite, ferriclinochlore, Fe-sudoite, Al-free chlorite (Mg), and Al-free chlorite (Fe). This set is proposed because it includes compositional end-members and virtual end-members close to existing compositions, yet there are many other possibilities, and in this set only clinochlore and sudoite are true minerals for which phase equilibria and calorimetry experiments are possible.
To summarize, typical metapelitic chlorite analyses fall in the clinochlore–amesite–sudoite triangle (Fig. 7a). For these, a first conclusion is that compositional end-member proportions are best estimated from cation ratios rather than from formula units, especially if using the 18-(O, OH, F, Cl) basis when H2O+ content cannot be precisely measured (at least below 0.3 wt % uncertainty for cation sum precision below 0.05 cations pfu).
Second, the di-trioctahedral substitution is important, and models omitting a sudoite-type component cannot reproduce typical chlorite compositions successfully. However, chlorite analyses from the natural pelite database show a limited range in composition, having amesite and sudoite components subordinate to clinochlore. This suggests non-ideal mixing, consistent with the presence of a solvus between di-trioctahedral and tri-trioctahedral chlorites (as in the model of Lanari et al., 2014, and the analysis of Bourdelle and Cathelineau, 2015, although these models predict the opposite temperature dependency).
Third, how Fe3+ should be incorporated into formula units remains unclear. The amount of Fe3+ in pelitic chlorite appears systematically low, yet neglecting iron speciation is not recommended because pelitic chlorite is generally iron-rich, meaning small amounts of Fe3+ can impact estimated cation sums. For chlorite, where deprotonation can be ruled out, compositional end-member proportions may be estimated from the sets of Eqs. (2) and (3). However, stating whether deprotonation is a general feature or limited to specific cases and acquired during crystallization, surficial alteration, or both needs further research.
Fourth, ordering problems are difficult to “regularize” because structural refinements are scarce, especially for usual iron-rich metamorphic chlorite due to random stacking (making Rietveld analysis difficult or impossible; see Walker and Bish, 1992). In the absence of additional structural refinements, following the approach of Powell et al. (2014) appears safest for modelling, with an enlarged set of end-members to reproduce compositional variations in usual chlorite.
5.2 Micas
Figure 7b presents divalent and trivalent cation proportions normalized to Si for phengite and biotite. Univalent cations and Ti are not accounted for in this figure but make up significant proportions of the mica analyses in the database. Therefore, this figure alone is insufficient for estimating the proportions of a complete set of independent compositional end-members. A striking feature of Fig. 7b is that mica analyses deviate from mixing between ideal trioctahedral mica end-members for biotite and identically between ideal dioctahedral mica end-members for white mica. Octahedral and interlayer vacancies may be hard to estimate, even with measured anionic bases, but they cannot be ignored. Figure 10 compares the octahedral sum obtained from fixed-charge anionic bases to the ratio, which should be sensitive to the di-trioctahedral substitution (Fig. 7b). A positive correlation between the two supports the idea of limited solid solution between white and dark micas through di-trioctahedral substitution. This correlation also suggests that using fixed-charge anionic bases is not without merit. It is worth noting that substitutions limited to the interlayer site do not significantly impact the ratios in Fig. 7b. The potential leaching of interlayer cations and their replacement by NH or H3O+ have been shown to be limited (Hewitt and Wones, 1984; Guidotti, 1984). Further, the presence of tobelite or of a tobelite component (such as NH4Al2(Si3Al)O10(OH)2 in end-member form) appears generally restricted to very-low-grade dioctahedral micas because of a compositional gap with tobelite and because of the instability of NH micas at high temperature (see Bauluz and Nieto, 2018, and Nieto, 2002, and references therein). The sections below examine mica chemistry, substitutions, and potential end-members.
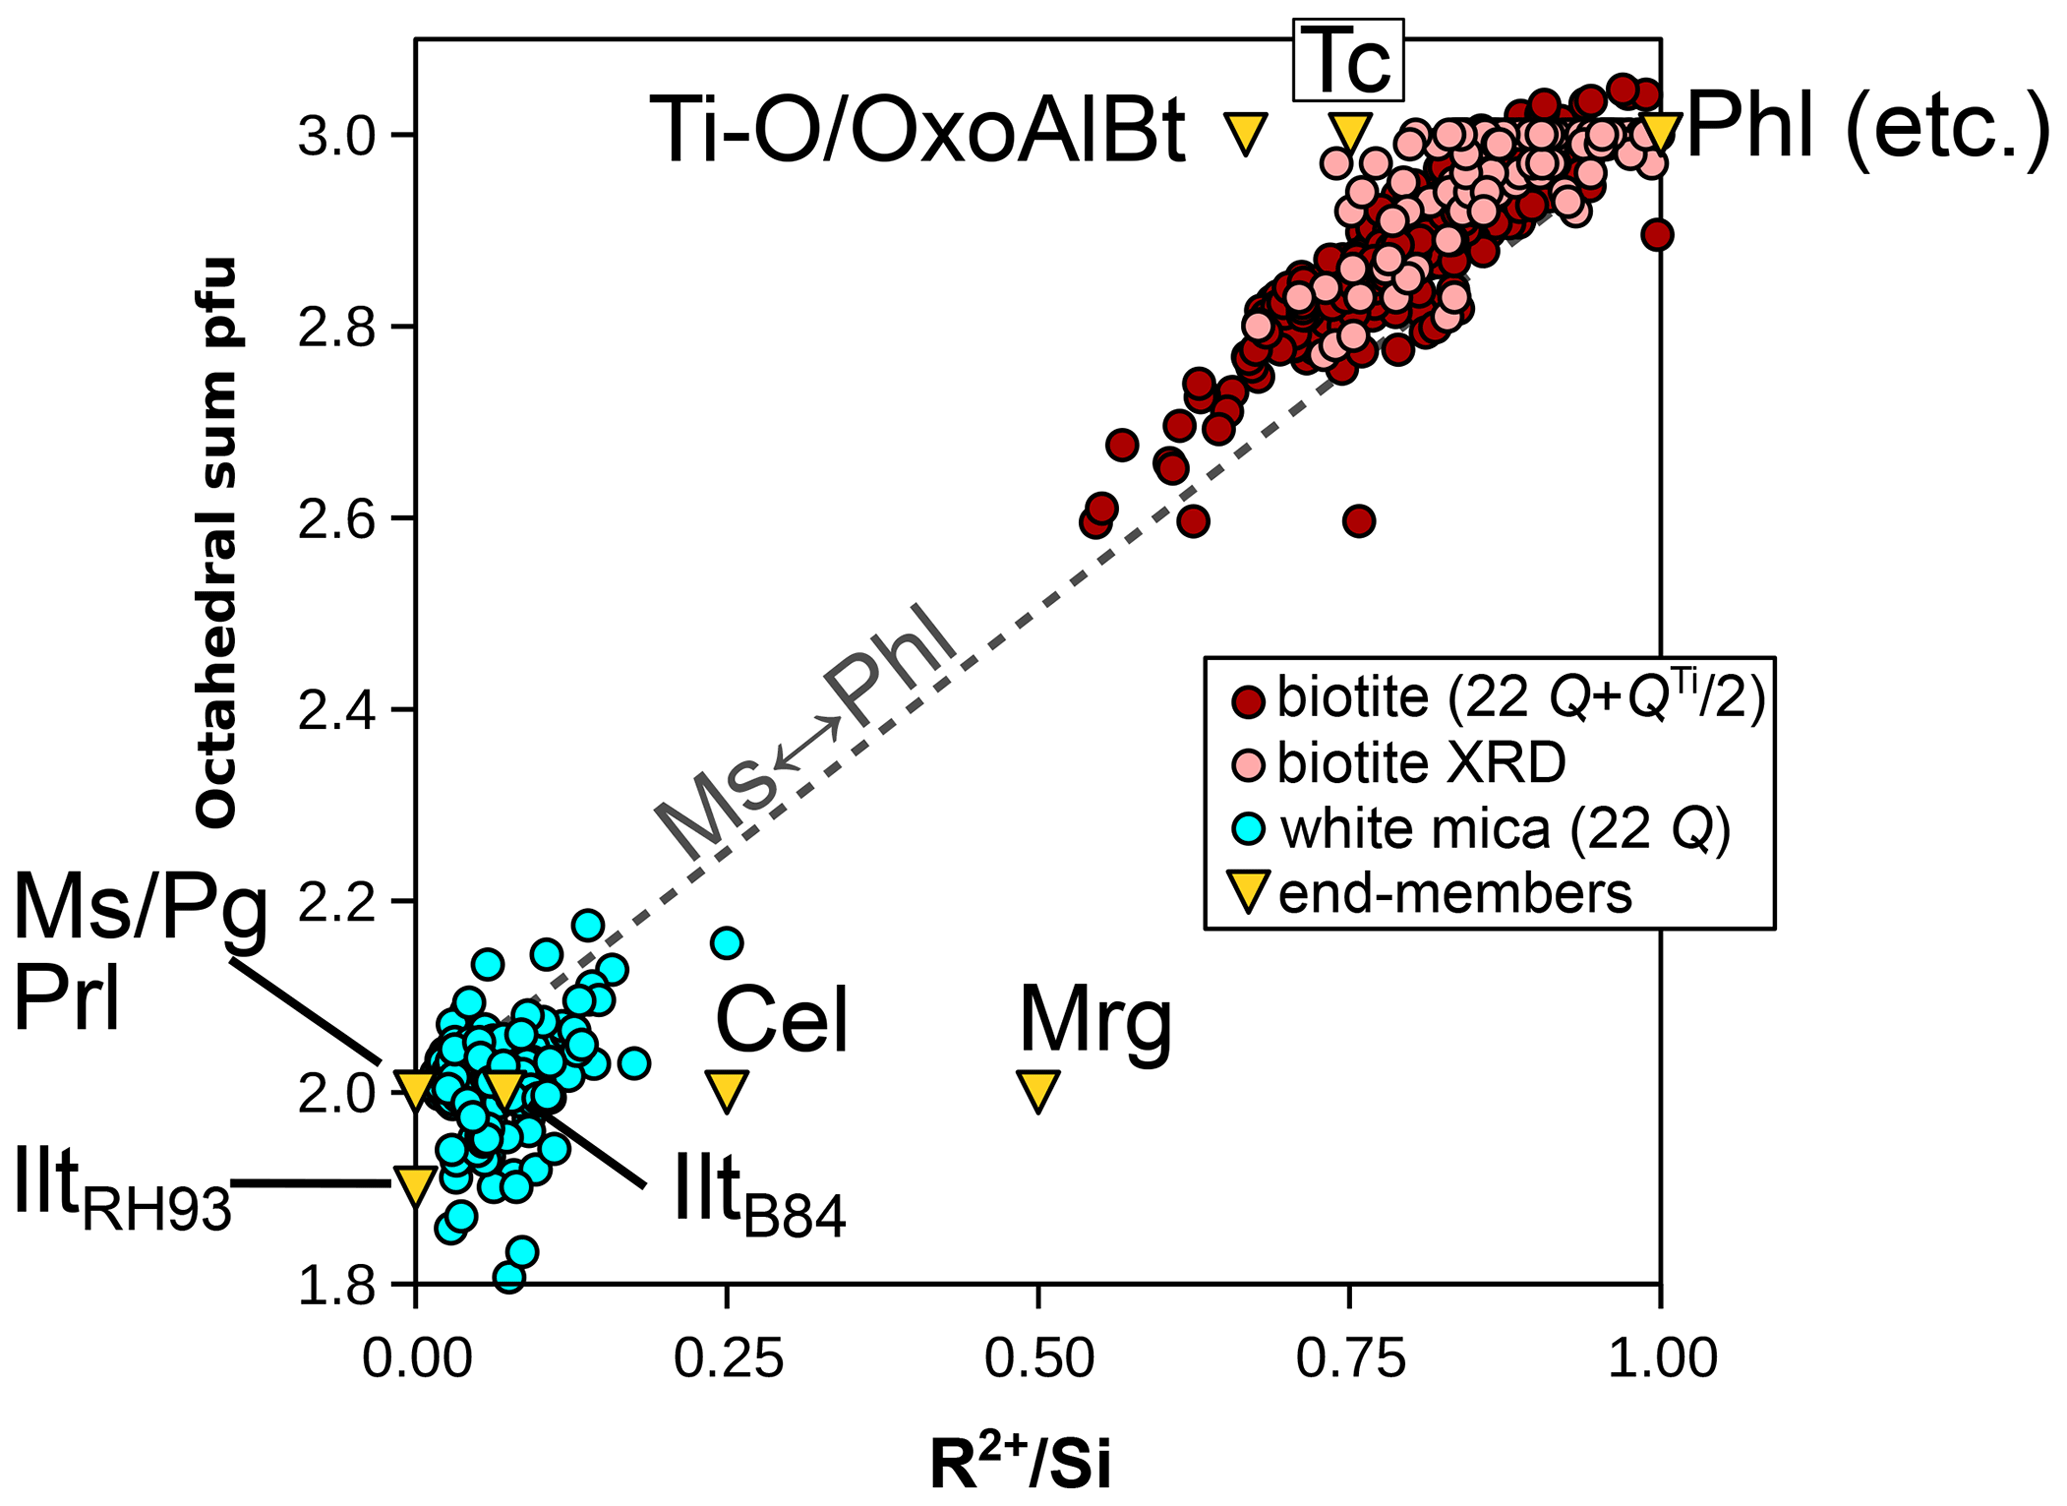
Figure 10Correlation between the octahedral sum and the ratio of divalent elements to Si (in moles per mole of Si) for micas. Biotite formula units are estimated as in Waters and Charnley (2002), apart from structural refinements (“biotite XRD”; Li et al., 2020), for which the measured octahedral content is used. White mica formula units are obtained with a 22-charge anion basis. Note that the end-member clintonite plots far off-axis at = 3.
5.2.1 Biotite
The biotite analyses from the metapelite database show lower divalent cation contents than those estimated from mixing between phlogopite-like and eastonite-like compositional end-members (both at = 1) and none above = 1. They are spread between and , without correlation between the two parameters (Fig. 7b). Biotite crystals for which structural refinements are available show similar variability, with and , and no correlation between the two ratios. This indicates that additional substitutions beyond Tschermak exchange take place. Consequently, compositional end-members are required in addition to phlogopite-like and eastonite-like end-members. Potential trioctahedral end-members include talc, the Ti-rich deprotonated end-member of Waters and Charnley (2002), and oxo-Al-biotite, such as those presented in Table 1. Other deprotonated end-members are possible, such as KMg3Si4O11(OH) synthesized by Forbes (1972; see references therein), but do not necessarily have petrologic relevance (Waters and Charnley, 2002). Usual dioctahedral mica end-members show lower ratios than phlogopite and eastonite (from the brittle mica margarite at = 0.5 to muscovite and pyrophyllite at zero).
A Ti-rich compositional end-member is necessary. Ti is octahedral in biotite and occupies M2 preferentially (linked to deprotonation of the adjacent hydroxyl group; Cesare et al., 2003, and Scordari et al., 2006, among others) but is assigned to M1 in the models of White et al. (2007, 2014). Abrecht and Hewitt (1988) presented experimental evidence for Tschermak-like coupled substitution (Ti + 2 TAl ↔ (Mg, Fe2+) + 2 Si) being possible, leading to an end-member in the form of KTiMg2(Al3Si)O10(OH)2. Ti deprotonation (as presented in Eq. 1) is another possible substitution, backed by analysis of metapelitic biotite (e.g. Waters and Charnley, 2002) and XRD structural refinements (e.g. Scordari et al., 2006) and already accounted for in some models (e.g. Tajčmanová et al., 2009; White et al., 2014). Figure 12 compares the effect of these two substitutions. Ti–Tschermak should increase the and ratios, particularly for the latter. Instead, the natural pelitic biotite analyses show no correlation with either ratio. On the contrary, analyses with elevated ratios show the lowest ratios, consistent with Ti deprotonation (Fig. 12). This analysis does not rule out Ti–Tschermak entirely, but the Ti-O end-member appears relevant and sufficient for encompassing the variability in the database. Assuming that the Ti content reflects solely the Ti-O end-member, Fig. 12c and d show the evolution of cation ratios for metapelitic biotite after removal of the contribution of Ti-O: the need for additional end-members to phlogopite and eastonite remains, with and below those ratios of phlogopite and eastonite.
For modelling the di-trioctahedral substitution in biotite, muscovite is a natural choice as an end-member, as observed by Patino Douce et al. (1993); this choice effectively explains the low octahedral sums in biotite (Figs. 9 and 10a). To account for low interlayer charges, talc appears better suited than pyrophyllite because it is closer to biotite in terms of structure, and some analyses, including structural refinements, show low interlayer charge without a dioctahedral component (Fig. 11a). From phlogopite, the exchange vector towards talc is akin to the pyrophyllitic substitution in white mica. In the KMASHTO system, this results in seven independent end-members, which may include Ti-O, phlogopite, muscovite, eastonite, talc, and two end-members ordered for Al–Mg and Si–Al. A total of 52 dependent end-members arise, of which 39 can be discarded because they do not follow the crystal–chemical rules outlined above or because they show Ti contents above 1 apfu. As recalled by Dachs and Benisek (2019, 2021), structural refinements are controversial, but Mg–Al ordering is considered significant up to at least 1000 °C, with Al preferentially occupying M1 and Mg preferentially occupying M2. In line with this, Al occupies only the M1 site in many models (e.g. Tajčmanová et al., 2009; White et al., 2014); however, the inclusion of dioctahedral end-members such as muscovite in the end-member set requires admission of Al in M2 (because M1 is vacant there). In models, omitting either the di-trioctahedral substitution or low interlayer sums in biotite results in unrealistic ratios, with consequences for the whole assemblage (see Waters, 2019).
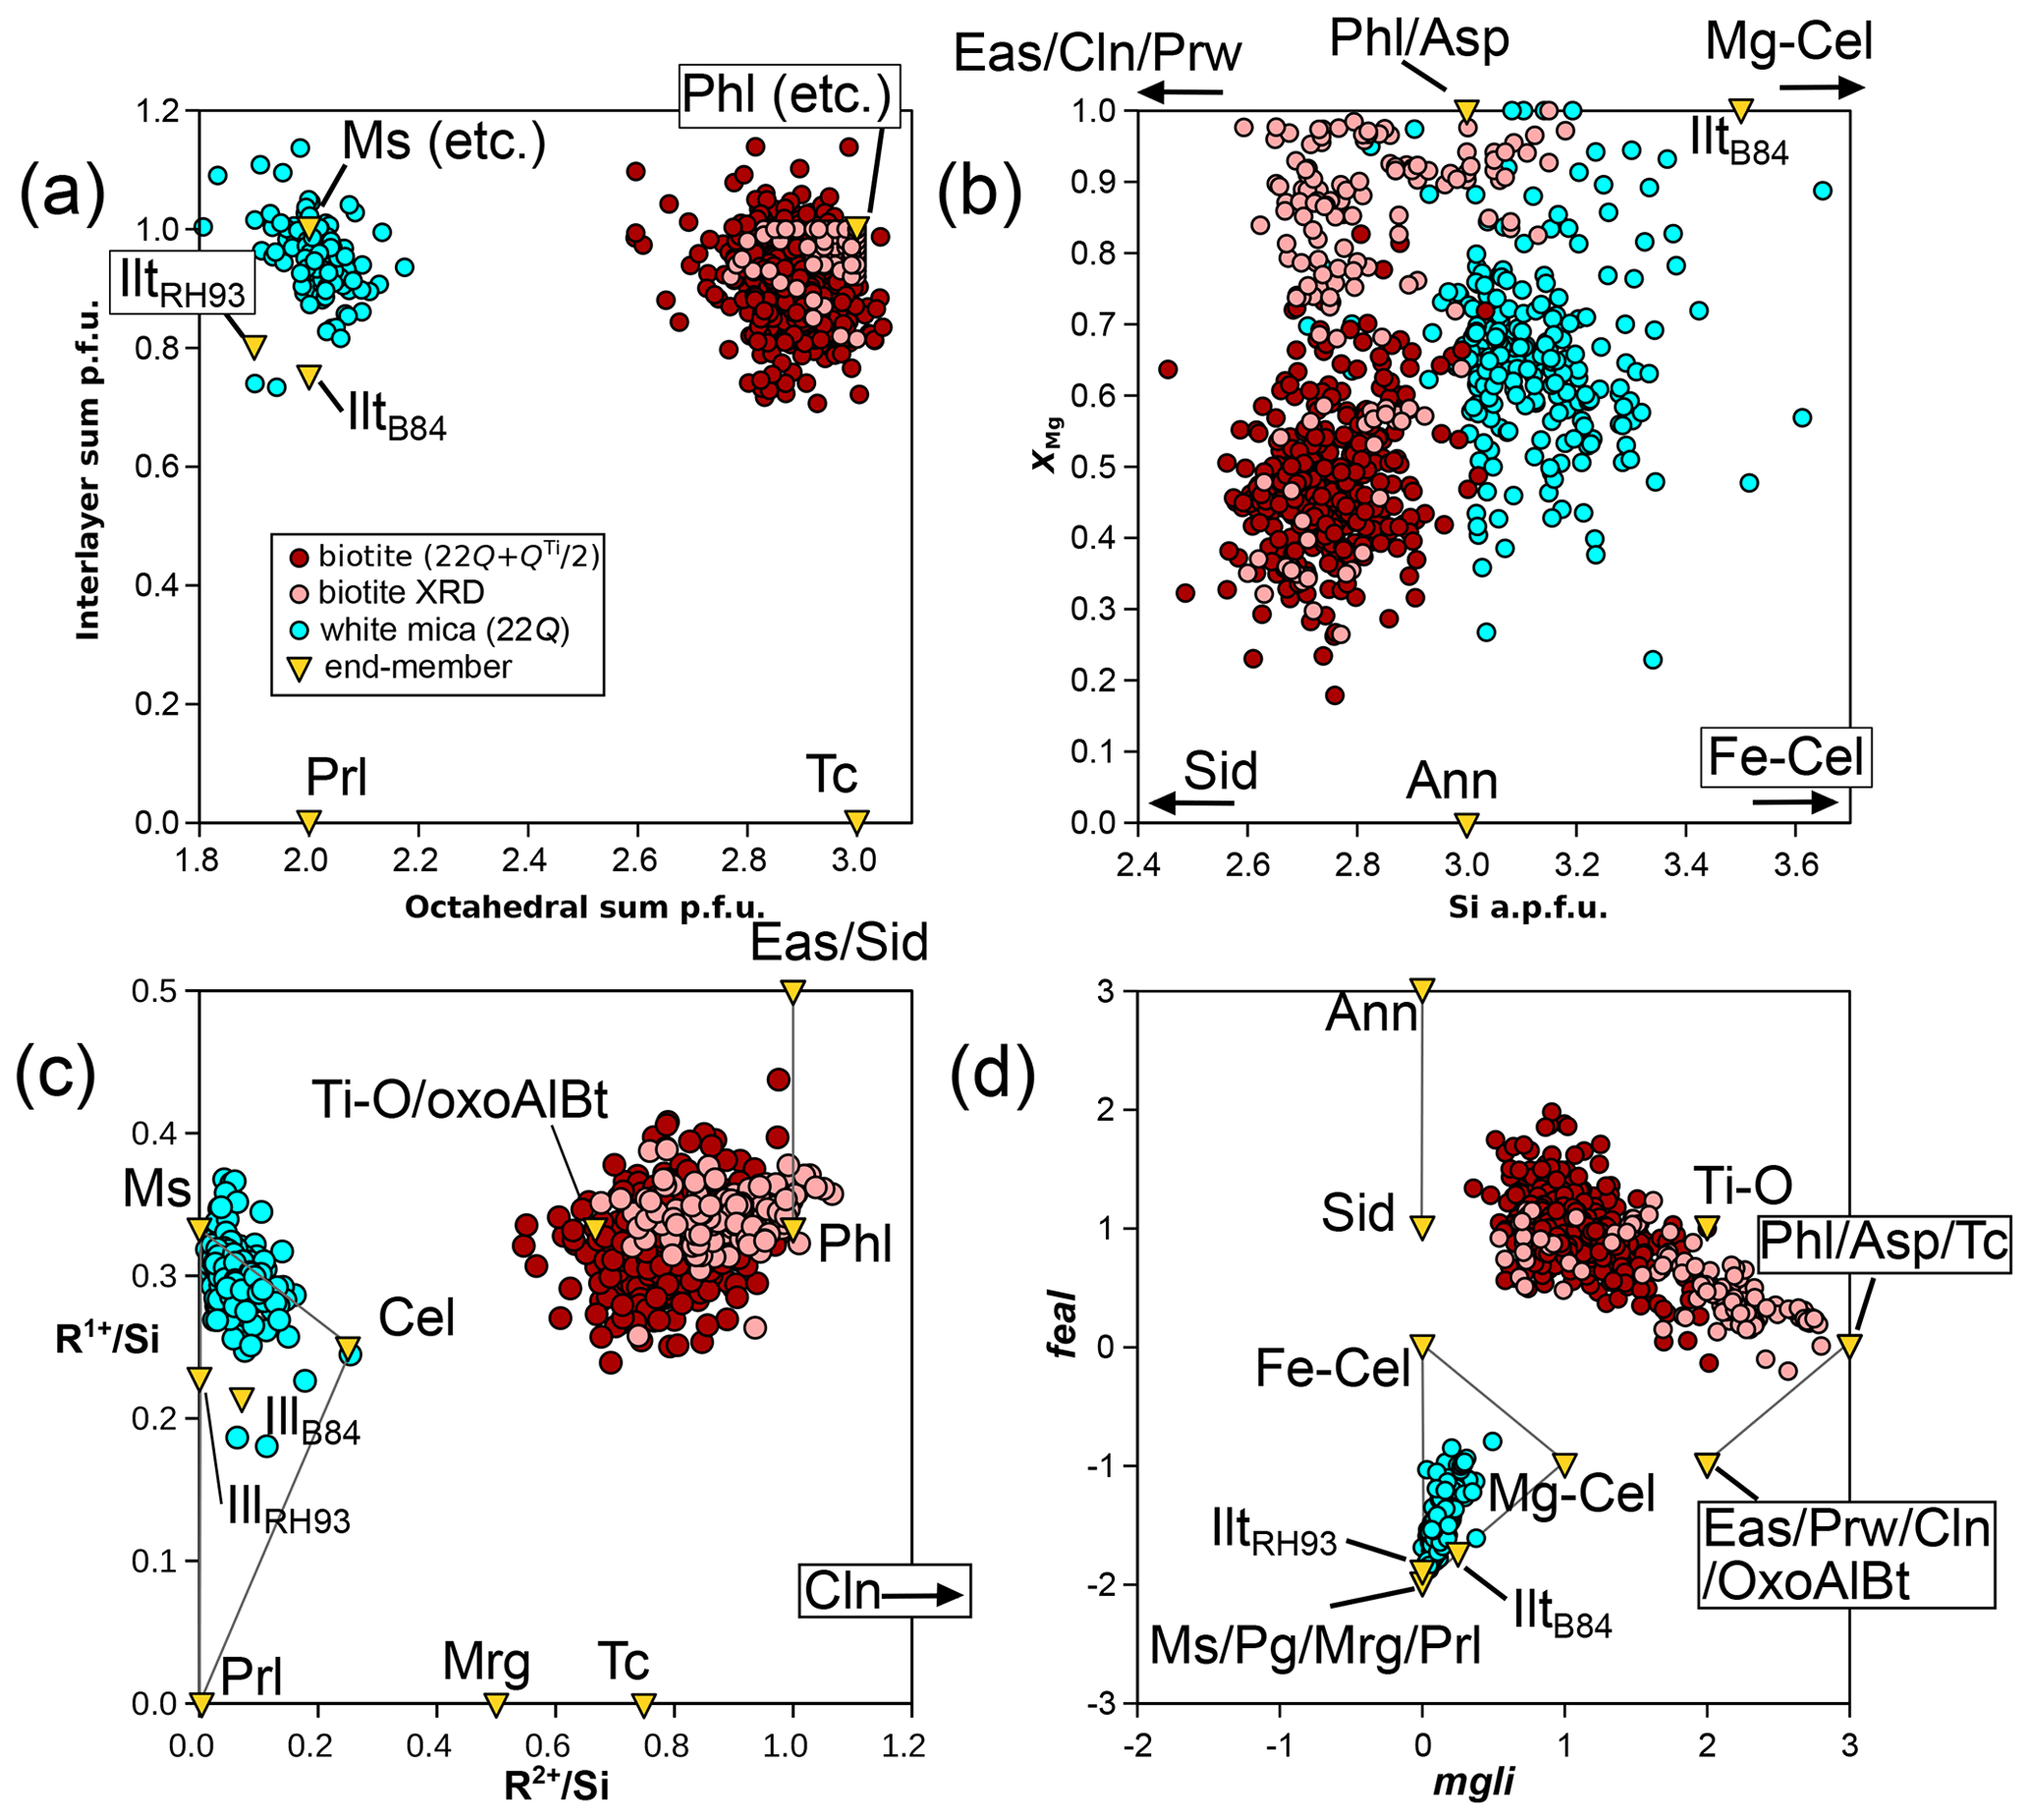
Figure 11Highlighting possible substitutions for micas. Biotite formula units are estimated as in Waters and Charnley (2002), apart from structural refinements (“biotite XRD”; Li et al., 2020), for which the measured octahedral content is used. White mica formula units are obtained with the 22-charge anion basis. (a) The interlayer sum compared to the octahedral sum. (b) XMg compared to Si content, highlighting sampling biases. (c) Sums of univalent (R1+) and divalent (R2+) cations normalized to Si content. (d) Graphical representation of Tischendorf et al. (2004), with mgli and feal defined in the text. Grey lines in (c) and (d) show the Ms–Cel–Prl triangle for white mica and the Tschermak exchange in biotite from phlogopite and annite.
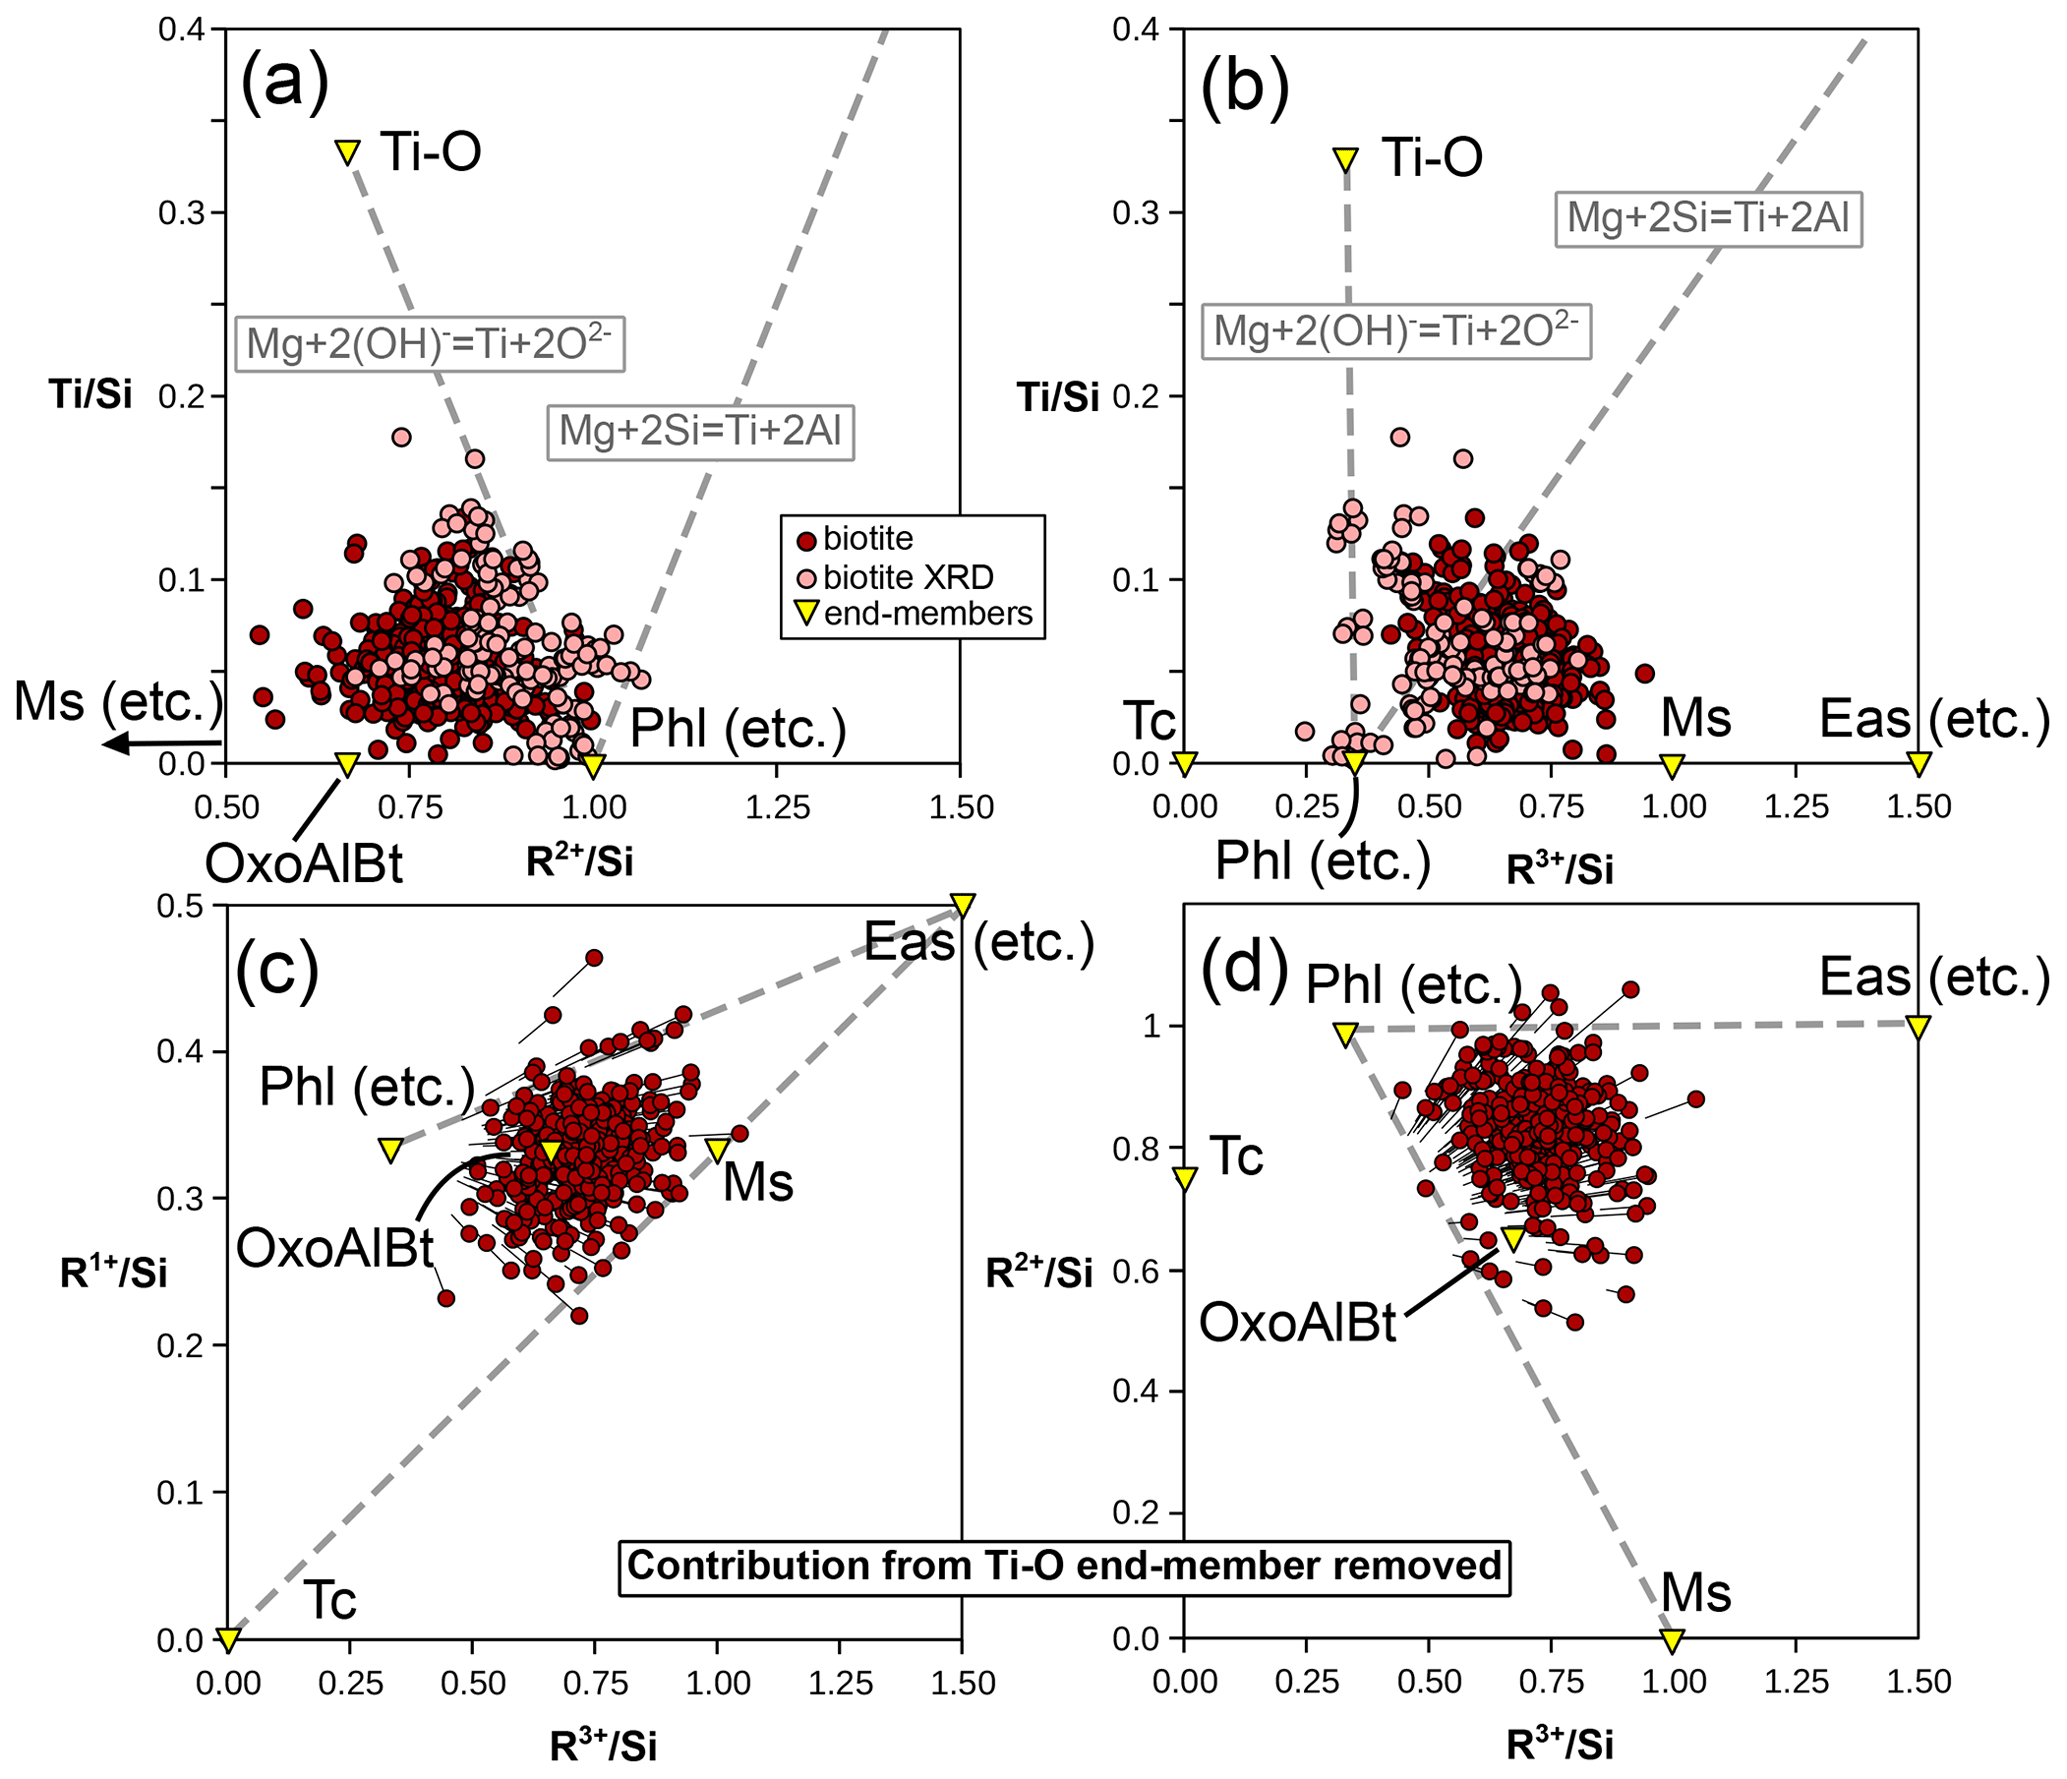
Figure 12Ti substitution in biotite and its effects. (a) Ti content compared to the divalent cation sum, normalized to Si. (b) Ti compared to the trivalent cation sum, normalized to Si. Dashed grey lines show the effect of Ti deprotonation (Eq. 1) and Ti–Tschermak substitutions from phlogopite. The end-member corresponding to Ti–Tschermak exchange (KTiMg2(Al3Si)O10(OH)2) plots off the graphs at = 1, = 2, and = 3. Panels (c) and (d) present the evolution of cation ratios after removal of the contribution of the Ti-O end-member. Circles show the result of the calculation; lines show the difference with initial values.
The addition of iron to the system is important as most analyses in the database contain more Fe than Mg (Fig. 7c). A graphical representation has been derived by Tischendorf et al. (2004, 2007; Fig. 11d) for micas in the KFMASHTO system. It uses the components mgli (i.e. Mg − Li apfu) and feal (i.e. Fetot + Ti + Mn − VIAl apfu) to differentiate between mica types. Unfortunately, this representation alone remains equivocal because it is impossible to decipher the individual extent of possible substitutions in the database, starting with separating di-trioctahedral substitution from Tschermak exchange.
Instead, iron speciation is to be considered: incorporation of Fe3+ appears limited but systematic in the database, where all biotite analyses are in the ferrous range (Fig. 7c; the median value is 8.7 ± 0.07 % of Fe in trivalent form). Neglecting the median Fe3+ amount of the database (Fe3+ = 0.11±0.095 apfu using the anionic basis of Waters and Charnley, 2002) results in a systematic increase of 0.04 apfu in the octahedral sum and a decrease in the median XMg value of 0.025 (from XMg = 0.46±0.10). These changes may be much larger; e.g. a biotite analysis with ∼ 0.4 and XMg ∼ 0.73 will vary to XMg ∼ 0.62 with a 0.11 octahedral sum increase if Fe3+ is neglected.
Mechanisms of Fe3+ incorporation in biotite have been well studied and are represented by five main possible substitutions (S1–S5):
Substitutions (S1) and (S4) may lead to the incorporation of tetrahedral Fe3+. Substitutions (S2) to (S5) may be linked to oxidation of Fe2+ (see Rebbert et al., 1995, and references therein). The results of Rebbert et al. (1995) are in favour of S2 as a dominant mechanism during iron oxidation, excluding S3 due to the absence of proton loss, and Foster (1964) found a low degree of correlation between Fe3+ and excess O in micas and chlorite. However, Lempart et al. (2018, 2020) and Lempart-Drozd et al. (2022) provide compelling evidence for substitution (S3) in phyllosilicates, in line with Rancourt et al. (2001), who suggest that substitution (S3) is dominant in annite when in its single-phase stability field at high hydrogen fugacity, with substitution (S2) being relevant at lower hydrogen fugacity.
Figure 13 uses cation ratios to test these substitutions on the metapelite database without a hypothesis over the anionic basis. The data are generally scattered in Fig. 13a–c, without correlation arising (r2 close to zero). The top 10 % of analyses with the highest ratio show lower (0.76 on average; Fig. 12a) and higher (0.71 on average; Fig. 13b) than the overall database. These variations are not linked to substitutions S1 to S5, as shown in Fig. 13. A petrologically meaningful correlation would be expected between and XMg (based on whole-rock variations in metapelites; Forshaw and Pattison, 2023b, their Fig. 2b) due to a decreasing proportion of Fe2+, but the two variables are only weakly correlated (Fig. 13d; r2=0.2). In conclusion, echoing Guidotti and Dyar (1991), several mechanisms for Fe3+ incorporation may be simultaneously in operation, with crystal–chemical constraints and oxygen fugacity probably exerting greater influence than pressure–temperature conditions. In turn, interpreting Fe3+ variations in natural biotite is hindered by its variability in other components (as argued by Hewitt and Abrecht, 1986), especially if substitution S1 is preponderant and near-ideal.
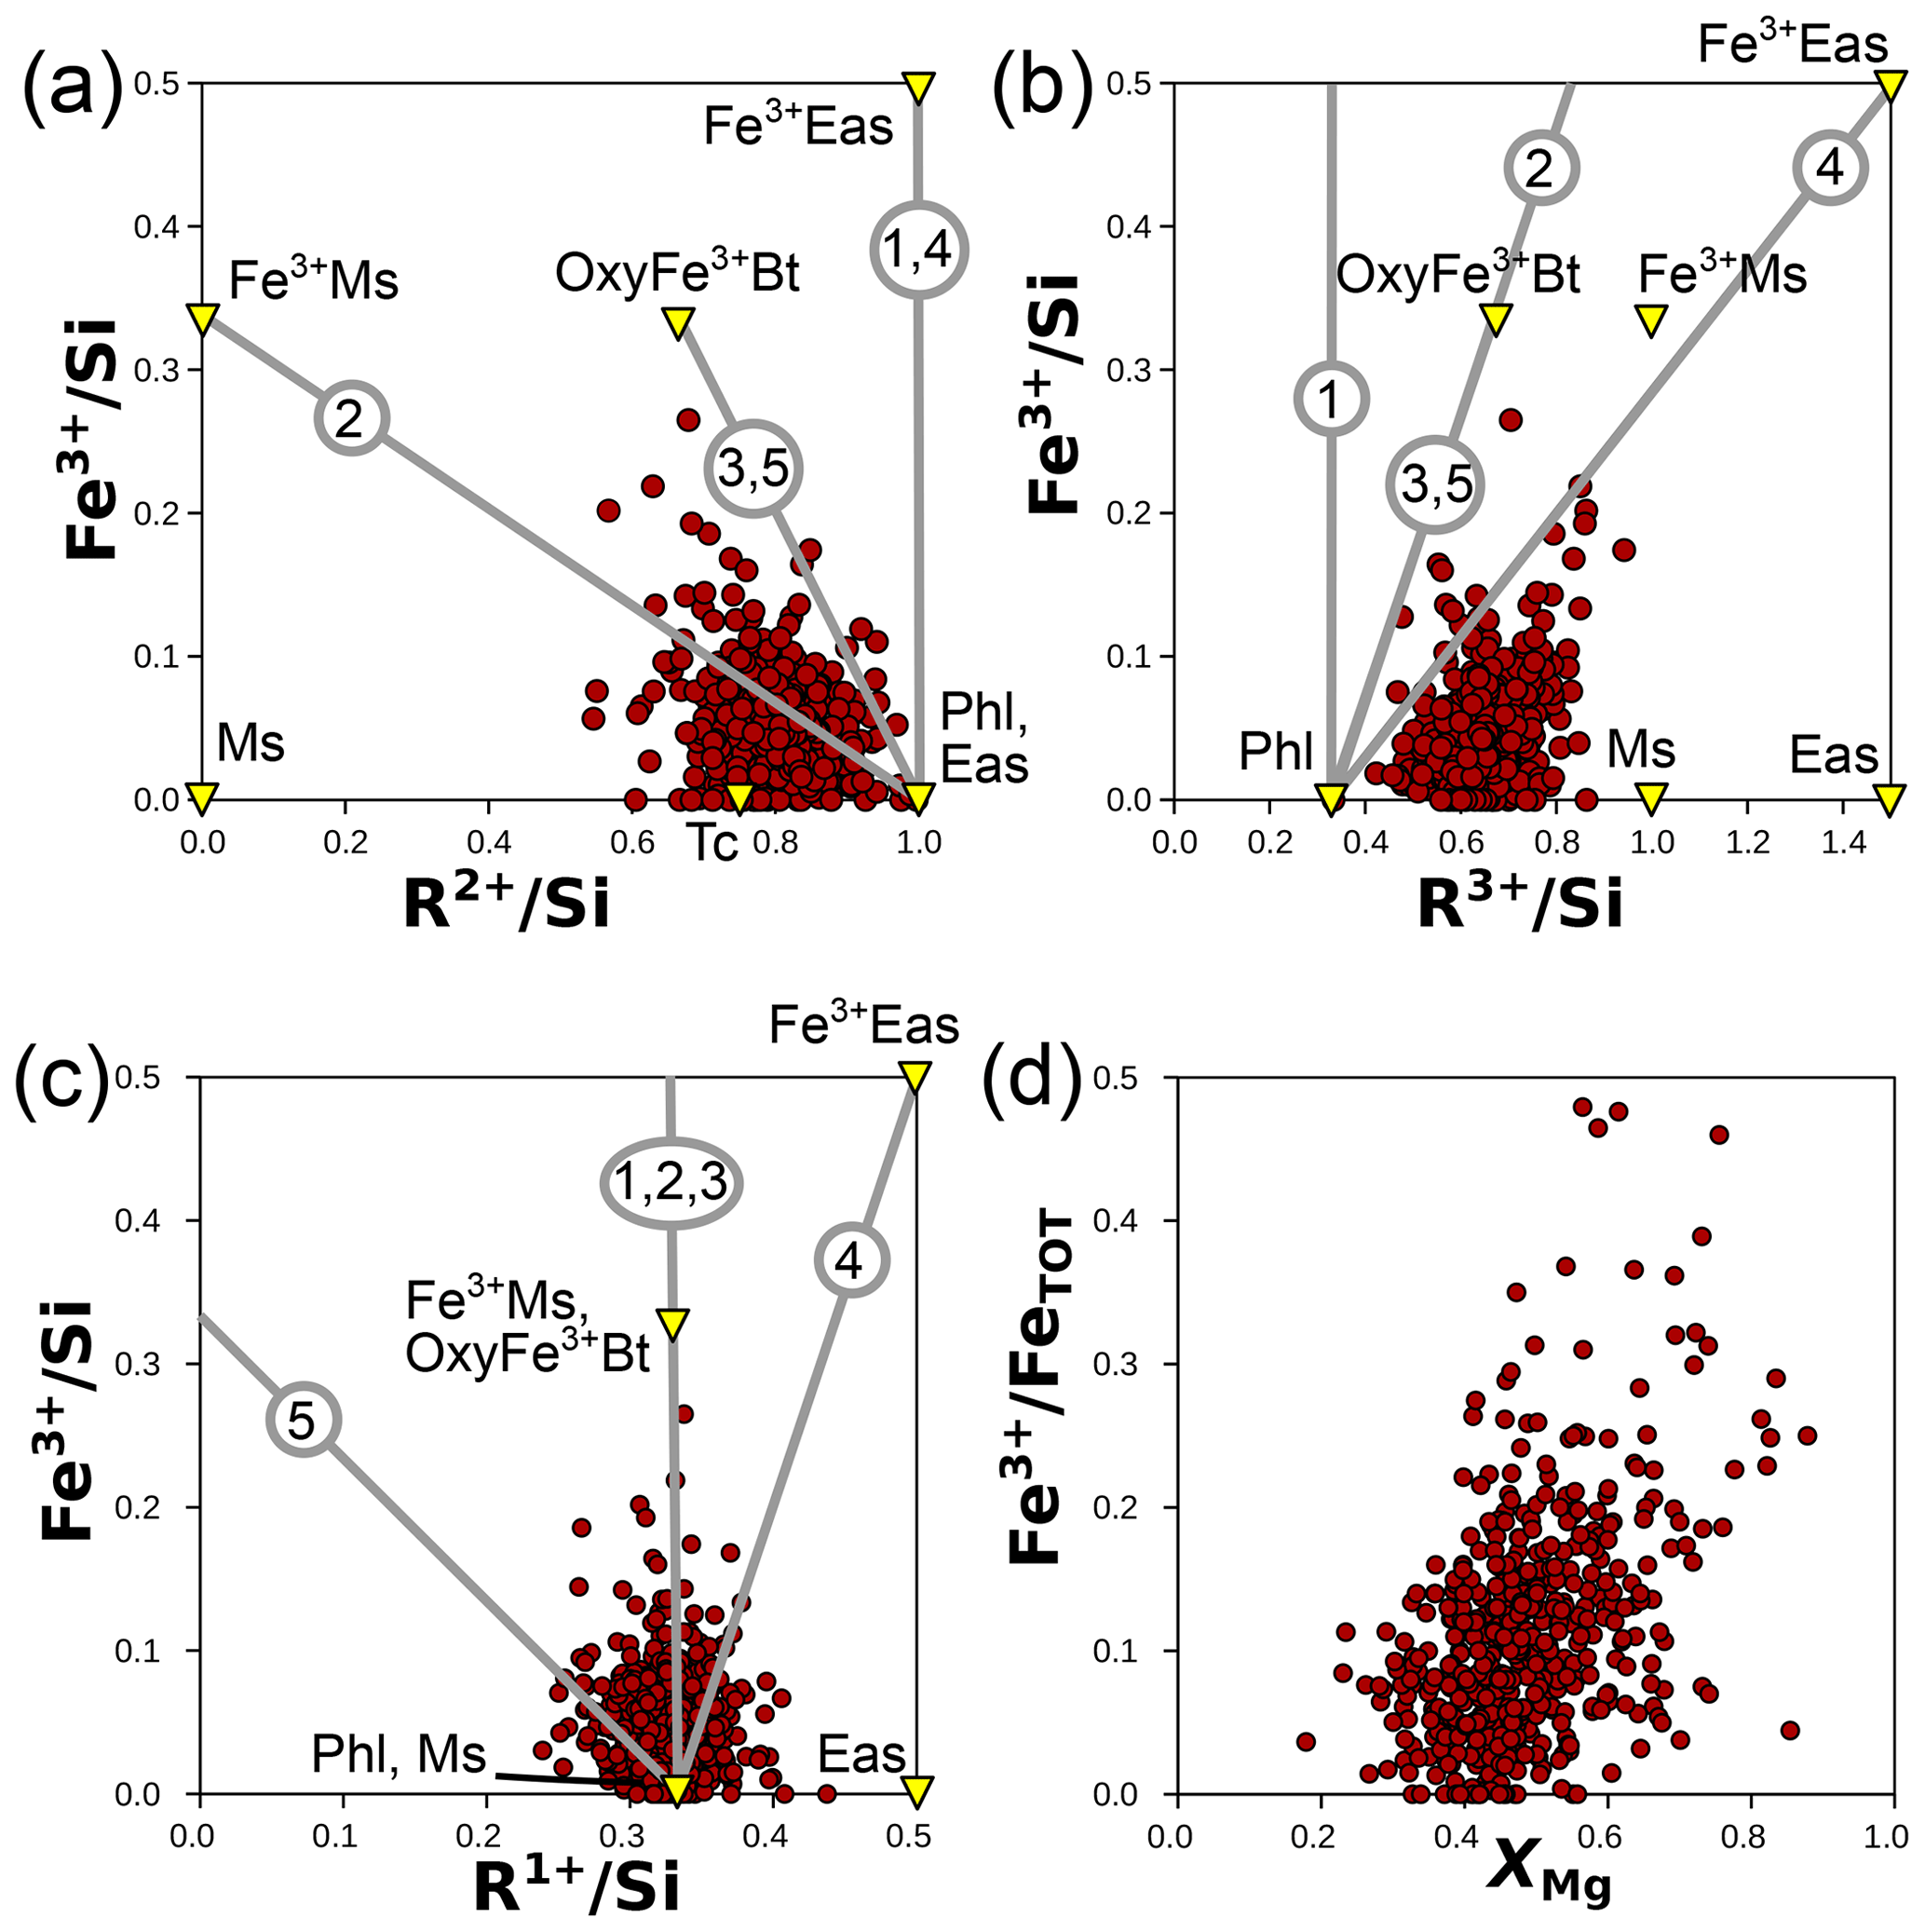
Figure 13Possible substitutions involving Fe3+ in biotite from cation ratios (without anionic basis). Panels (a), (b), and (c) compare Fe3+ content to R2+, R3+, and R1+ (respectively), all normalized to Si. Grey numbered lines show substitution mechanisms S1 to S5 (see text). End-members discussed in the text (and Table 1) are shown as yellow triangles. (d) The iron oxidation state () versus XMg, which shows a weak correlation. Notably, biotite analyses where Fe is most oxidized are in the high range of XMg values.
In terms of compositional end-members, Fe3+-eastonite and deprotonated “oxy-ferribiotite” of Table 1 appear suitable because each captures the majority of the compositional variability in the database (together with Tc, Ms, and other KMASHTO end-members; Fig. 13). However, tetrahedral iron remains neglected in this analysis. As stated earlier, tetrahedral Fe3+ is probably underestimated, at least according to Guidotti and Dyar (1991) and Cuadros et al. (2019), who report biotite analyses with TFe3+ > 0.8 apfu. These authors suggest that “the only control on tetrahedral Fe3+ in trioctahedral 2 : 1 phyllosilicates is Fe3+ availability”, with a roughly linear relationship between TFe3+ and Fe3+ resulting in much more tetrahedral than octahedral Fe3+ (TFeFe on average). Therefore, an end-member such as tetraferriannite or Fe3+-rich phlogopite where TAl is substituted with TFe3+ may be as relevant to petrological modelling as end-members with octahedral Fe3+.
For Fe2+-rich end-members, uncertainties are concentrated on the site distribution of Fe2+ and its ordering with Mg. Guidotti and Dyar (1991) have shown that M2 contains, on average, almost 3 times more Fe2+ than the Al-rich M1, consistent with weak Fe–Mg ordering as discussed by Dachs and Benisek (2021). The current thermodynamic models cited above can reproduce this with Fe–Mg-ordered end-members.
In the database, the interlayer site of biotite contains 94±5 % K, 4±4 % Na, and 1±2 % Ca (median values of skewed distributions). The ratio is uncorrelated to or . The Na content shows a weak inverse correlation to the K content (r2=0.16) and not to other chemical variables accessible here. Therefore, the easiest option for inverse modelling is using a typical end-member such as aspidolite, largely covering the observed compositional variability. For phase diagram calculations, assuming that the variability in biotite is explained in the KFMASHTO system (as in the models of Tajčmanová et al., 2009, and White et al., 2014) appears to be a logical simplification.
Consequently, a consistent set of end-members in the KFMASHTO system includes the KMASHTO end-members and their Fe2+ equivalents, plus tetraferriannite and ferrieastonite or “oxy-ferribiotite” for Fe3+ incorporation. Tetrahedral distribution is assumed to follow the same mechanisms as described above, with an additional assumption that Fe3+ behaves similarly to Al (i.e. with ordering). This results in 12 independent end-members (for example the 9 end-members cited above: phlogopite; eastonite; annite; siderophyllite; Ti-rich, OH-free biotite; muscovite; talc; tetraferriannite; and ferrieastonite, plus Fe-talc and ordered end-members such as “tetraferrieastonite” K(Mg2,Fe3+)(Fe,Si2)O10(OH)2 and the scary partially dehydroxylated □(TiFe2+,Fe3+)(Fe,Si2)O11(OH)), for a total of 33 valid dependent end-members. Without more precise knowledge of tetrahedral Fe3+ content, the proportion of compositional end-members cannot be estimated, but following the analysis of Cuadros et al. (2019), about three-quarters of trivalent iron should be expected in the tetrahedral position (TFe3+ = 0.74 Fe3+ − 0.08). More data are required before broad application to metapelites.
5.2.2 White mica (exclusive of paragonite)
Guidotti and Sassi (1998) provide an extensive review of compositional variations in white mica, and the white mica analyses in the database generally align with these authors' conclusions. White mica analyses are spread around the Tschermak exchange vector between muscovite and aluminoceladonite (Fig. 7b), with most analyses falling below the 40 % aluminoceladonite-type end-member. K–Na exchange is also prevalent (Fig. 14a), with Na making up to 30 % of interlayer cations. However, deviations from these two exchange vectors are sufficiently important to justify using additional compositional end-members.
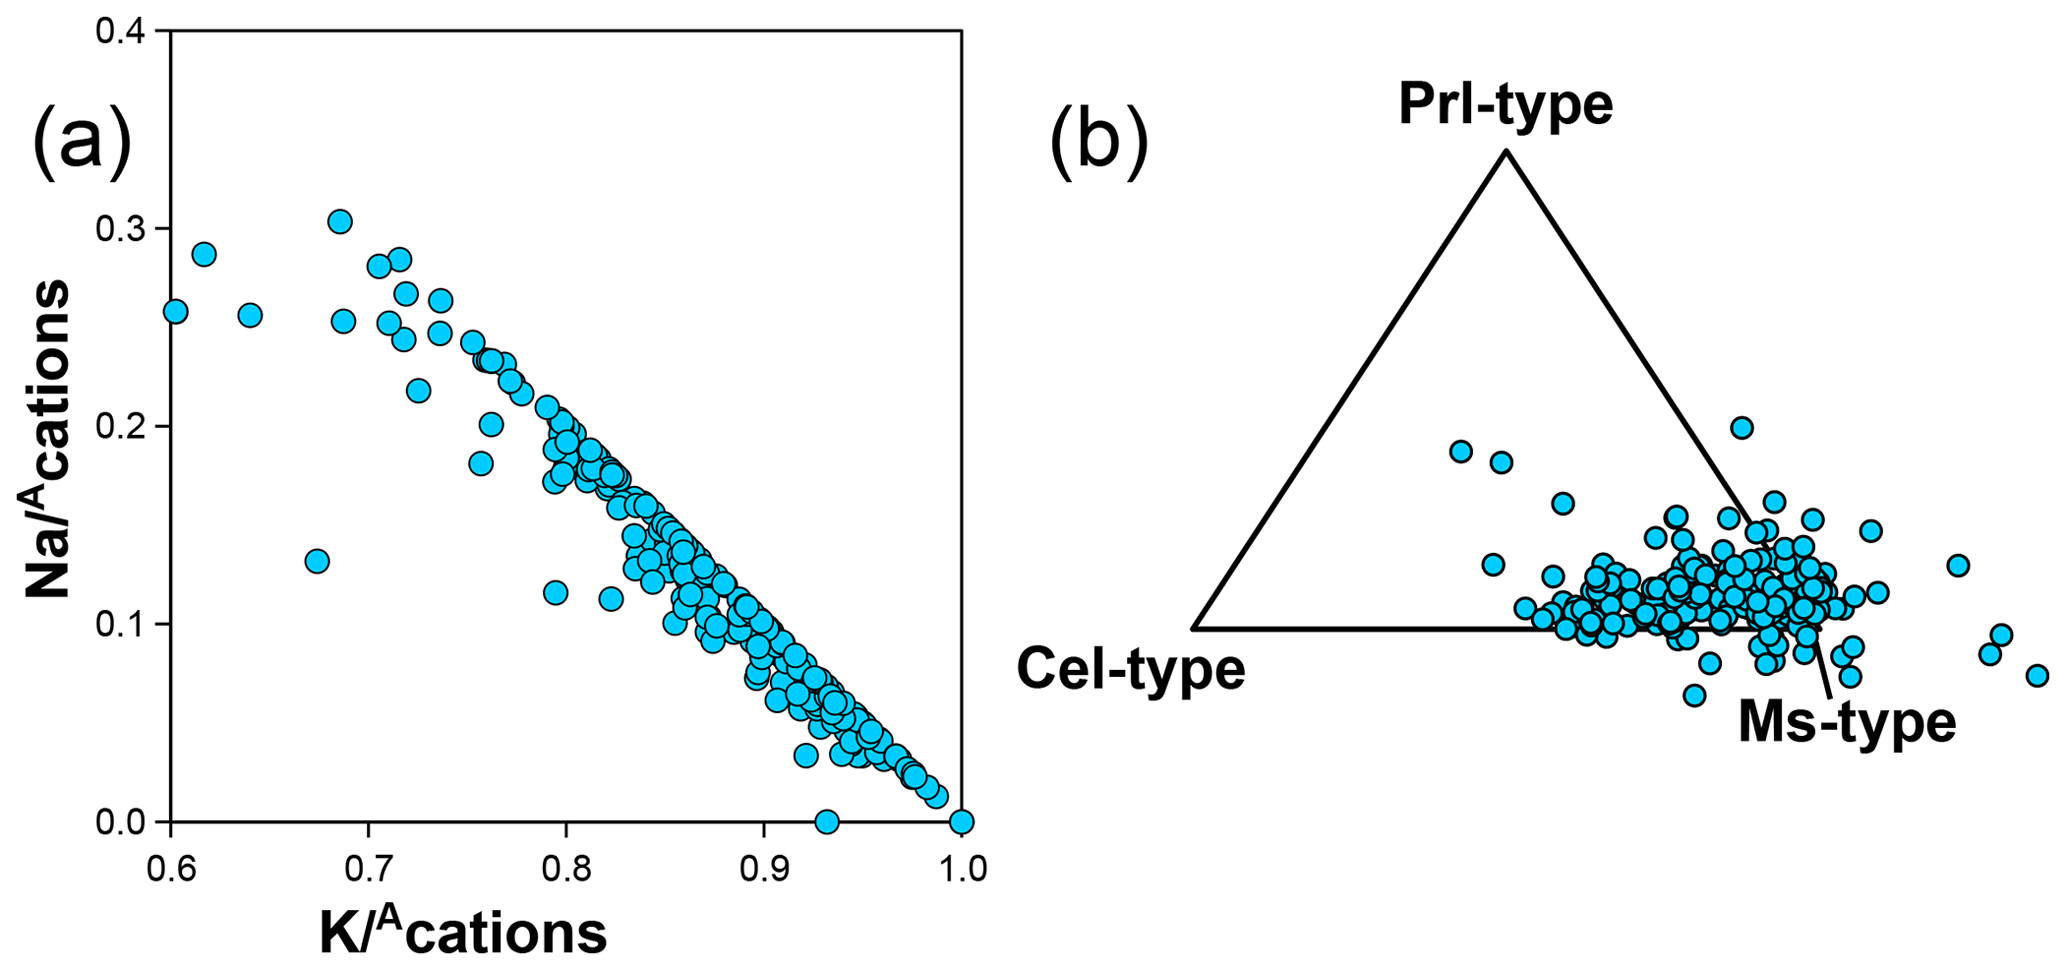
Figure 14(a) K–Na substitution highlighted by inverse correlation of Na and K, normalized to the interlayer cation sum () without anionic basis normalization. (b) Proportion of compositional end-members of muscovite, aluminoceladonite, and pyrophyllite types, projected from phlogopite-type end-members (i.e. including aspidolite). See text for discussion of analyses that plot outside the triangle.
Calcium content is generally low (median 0.002 pfu), but 16 % of the analyses show Ca content above 0.02 pfu. Among the high-Ca analyses, those above 0.04 Ca apfu show octahedral sums below 2.0, and all analyses with octahedral sums below 1.92 have Ca content above 0.05 pfu and interlayer sums above 1.05. This is inconsistent with substitution towards (dioctahedral) margarite or a Ca-rich trioctahedral end-member such as clintonite or stevensite. Because interlayer occupancy cannot exceed the unit value, it is possible that such analyses are contaminated (e.g. by calcite, apatite, or plagioclase) or that Ca is in the octahedral position (not observed in dioctahedral mica to the authors' knowledge). Either way, explaining joined Ca and M□ increase is not possible from muscovite or aluminoceladonite due to charge imbalance. A possible substitution scheme is AKMgAlCa, which cannot be completed from muscovite or aluminoceladonite but may be followed from their mixture, for example from K(Al1.5Mg0.5)(Si3.5Al0.5)O10(OH)2 to (K0.5Ca0.5)(□1.5Al1.5)Si4O10(OH)2. It is also possible that white micas with high Ca content contain Li and/or Be, which are known to play a role during K–Ca substitution (e.g. Tischendorf et al., 2007) and may have been ignored during analysis.
Titanium is ubiquitous as a minor component in the natural pelitic database (≤ 2.5 ox. wt %, i.e. ∼ 0.06 apfu; see also Guidotti and Sassi, 1998). In white mica, Ti is octahedral and exchanged via the coupled substitution Ti + TAl ↔ Al + Si. Auzanneau et al. (2010) proposed that this substitution may be pressure-sensitive, but Chambers and Kohn (2012) suggest that TAl content via Tschermak exchange exerts a greater control over Ti incorporation than pressure.
In the natural pelitic database, interlayer occupancies are frequently below 1 and octahedral occupancies above 2 (Fig. 11a), with most analyses showing a small (∼ 0.1 pfu) component of interlayer vacancy or a trioctahedral end-member or both. This may not necessarily be talc but instead a combination of pyrophyllite and biotite (see Fig. 10). The pyrophyllitic substitution decreases interlayer sums, and it is frequently observed in low-grade dioctahedral micas (e.g. Abad et al., 2003, 2006; Dubacq et al., 2010). Battaglia (2004) proposed an empirical thermometer principally based on the decrease in the pyrophyllite component with increasing temperature in the range 180–340 °C. The “trans-muscovite” component defined by Tischendorf et al. (2004) is not seen (K(□0.83Al2.17)(Si3Al)O10(OH)2, which would plot below muscovite in Fig. 11d). Rather, the interlayer-deficient analyses are in the line of the end-members derived for illite by Ransom and Helgeson (1993) and by Bailey (1984). A combination of end-members of the types of muscovite, aluminoceladonite, an interlayer-deficient dioctahedral end-member (pyrophyllite or the aforementioned illite end-members), and a trioctahedral end-member such as phlogopite captures almost the entire compositional variability in the database in Figs. 7, 10, and 11. In the compositional space set by the ratios , , and , these end-members define a pyramid. A simpler representation is shown in Fig. 14b with the proportion of dioctahedral end-member types derived from these ratios, using muscovite, aluminoceladonite, and pyrophyllite after projection from phlogopite-type end-members, whose proportion is always small (Fig. 10). Analyses plotting at negative aluminoceladonite content require end-members with greater TAl content than muscovite and phlogopite (i.e. Si < 3 pfu; Fig. 11b), such as margarite or eastonite. Negative pyrophyllite contents mostly reflect very high alkali contents (interlayer sums above 1 when normalized to 22 Q) and may therefore be of poor quality. The main remaining questions involve octahedral occupancies below 2.0 and iron speciation. Ransom and Helgeson (1993) argue for the relevance of end-members with octahedral occupancy of 1.9 for illites on the basis of a compilation of analyses with stringent quality criteria, in contrast to Kelley (1945), who argues for octahedral sums below 2 due to SiO2 contamination. Settling this debate remains complicated because of the scarcity of new data.
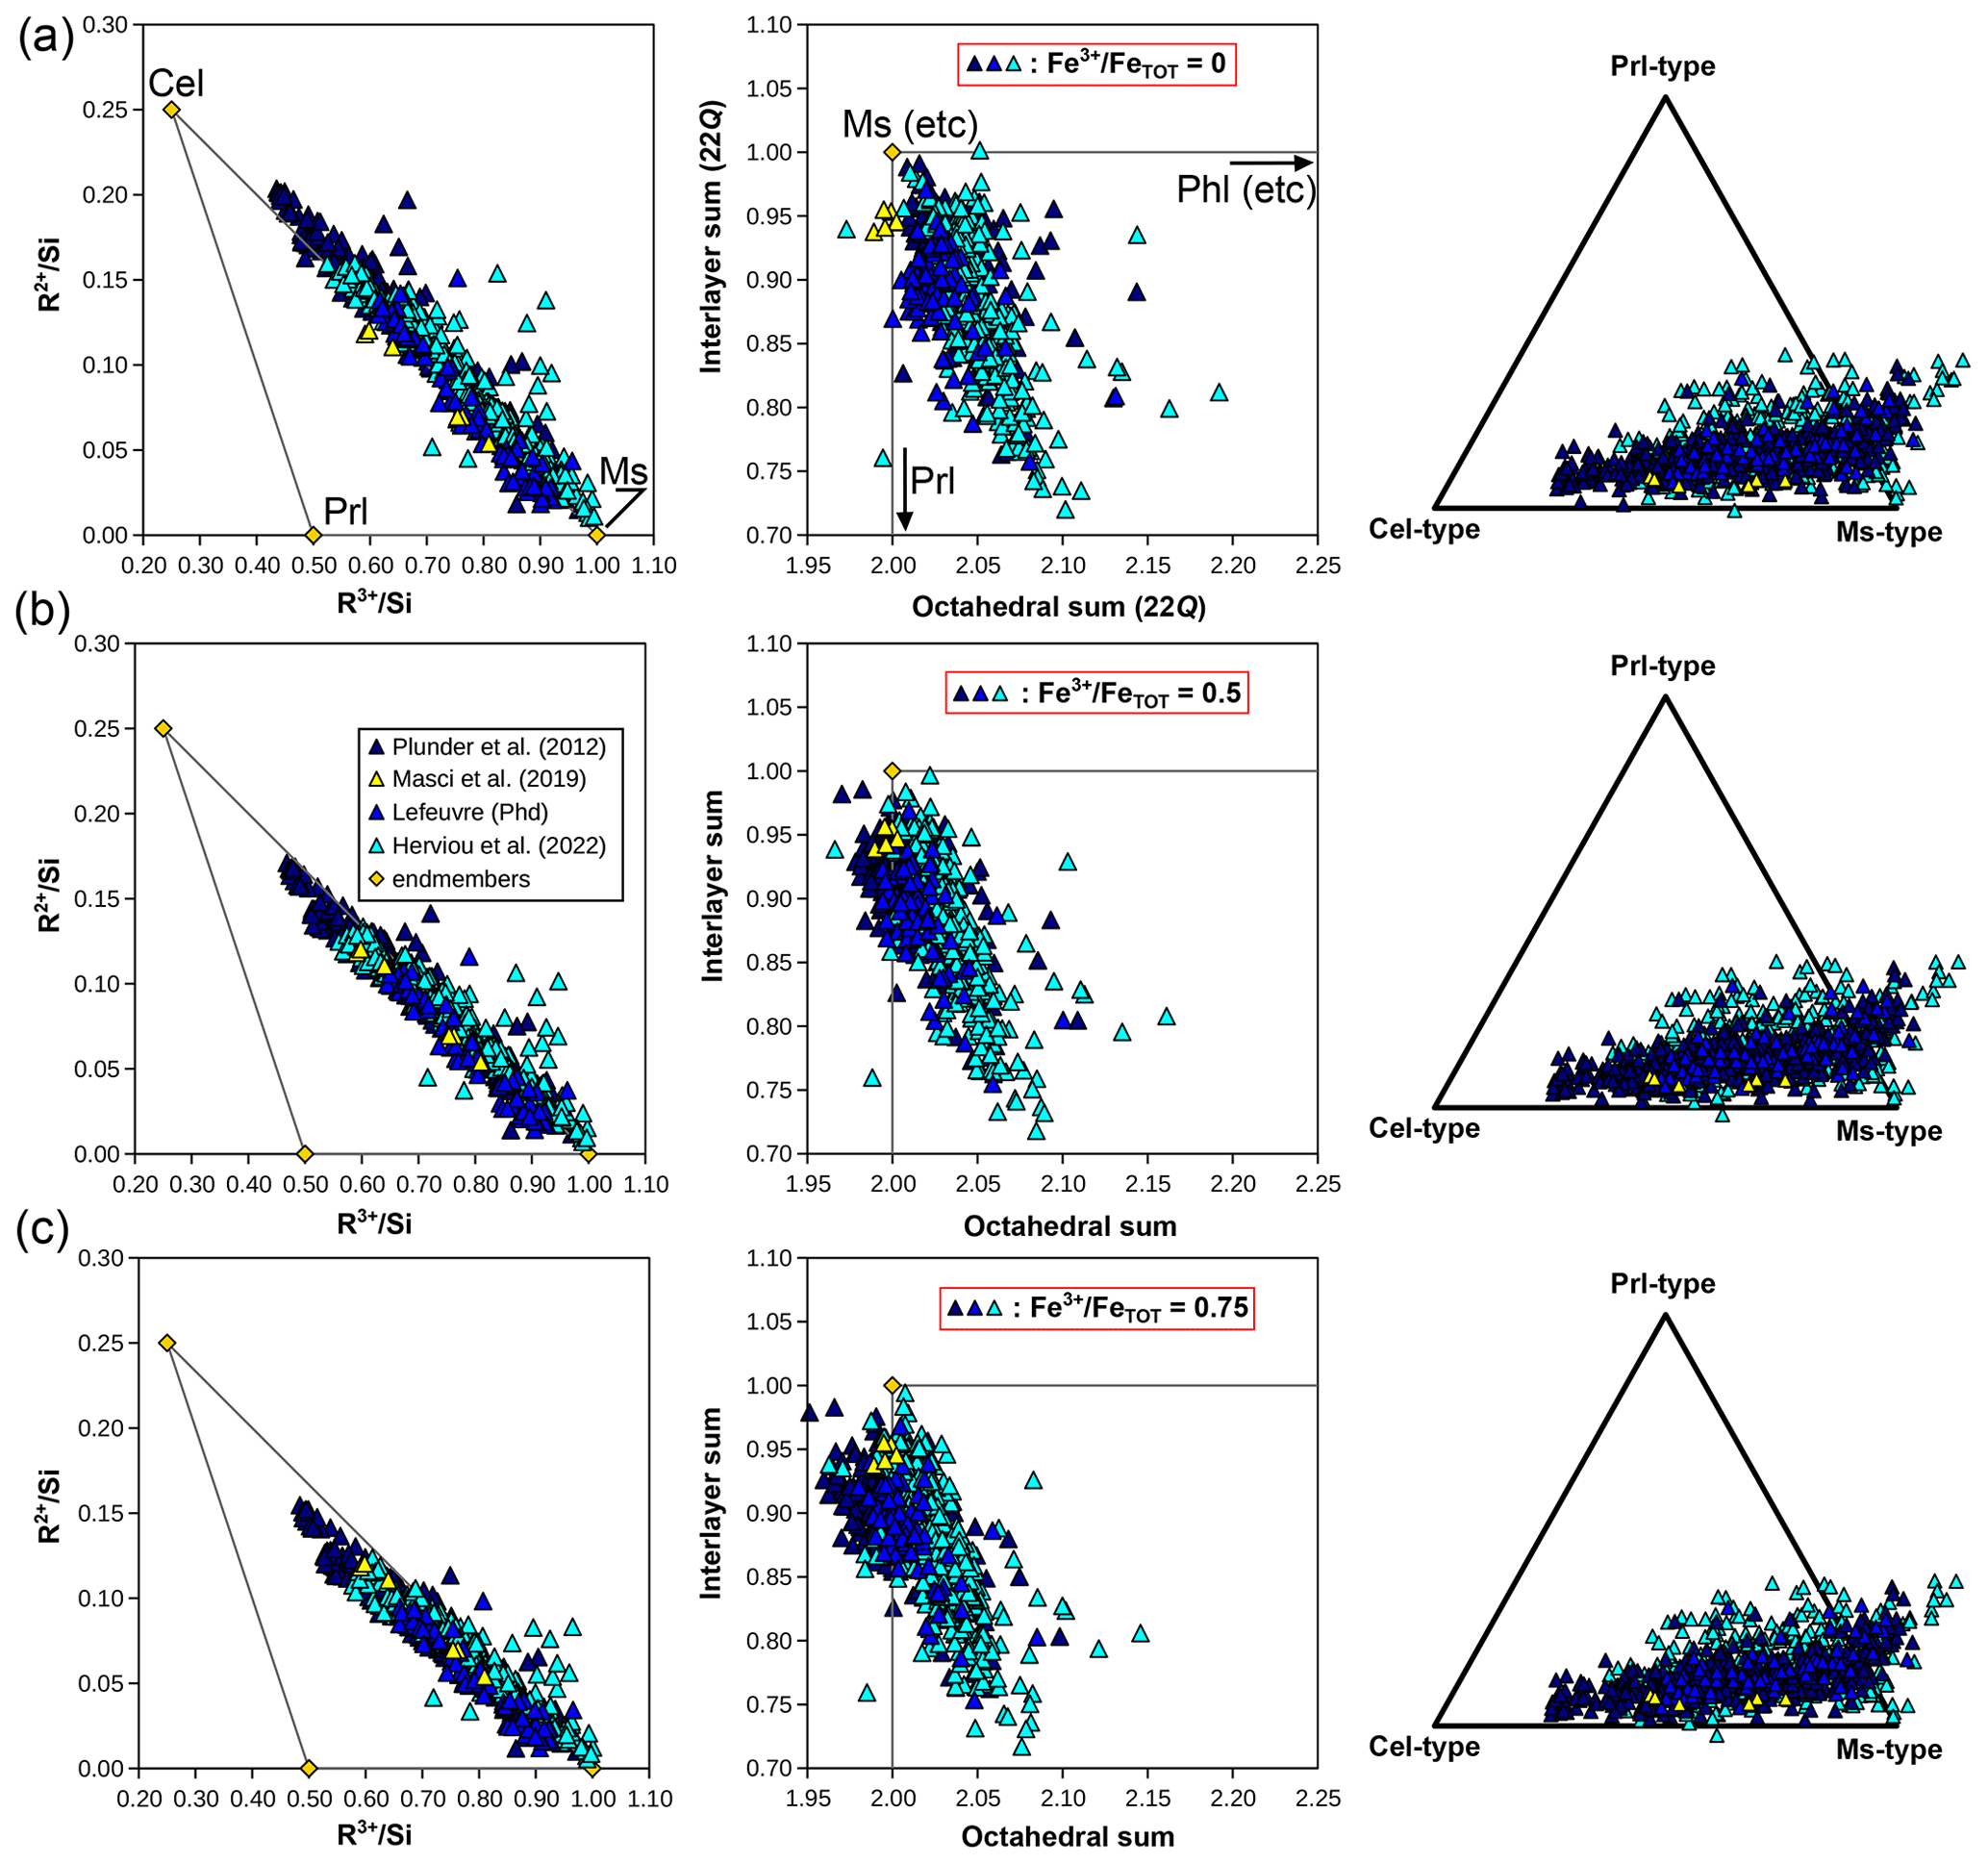
Figure 15Compilation of white mica compositions obtained by electron microprobe from a series of studies in the Schistes Lustrés complex of the Western Alps. Elemental ratios are shown on the left-hand side, and octahedral and interlayer sums in the middle column. The proportions of compositional end-members of muscovite, celadonite, and pyrophyllite types, projected from phlogopite-type end-members, are shown on the right-hand side. Compositions are provided for three possible ratios: 0 (a), 0.5 (b), and 0.75 (c). Analyses by Masci et al. (2019) on samples from Plunder et al. (2012) are plotted at the measured ratios in (a), (b), and (c) for comparison with other analyses.
Figure 15 shows a compilation of analyses from the Schistes Lustrés of the Western Alps, from a series of units showing Franciscan metamorphism from low-grade blueschist facies up to eclogite facies, after Plunder et al. (2012), Lefeuvre (2020, PhD thesis), Lefeuvre et al. (2020, 2024), and Herviou et al. (2022) over 43 samples. This series is relevant here because it shows interlayer-depleted white mica in apparent continuity with clay minerals and particularly illitic compositions (see Agard et al., 2001). All analyses were acquired on CAMECA SX100 and SXFive electron microprobes at CAMPARIS (Sorbonne Université, Paris). Figure 15 presents elemental ratios (as in Fig. 7) and interlayer and octahedral sums, together with dioctahedral end-member proportions after projection from phlogopite-type end-members, calculated for ratios of 0, 0.5, and 0.75. Masci et al. (2019) analysed five of the micas of Plunder et al. (2012) and reported high (in the range 0.62–0.74), resulting in octahedral sums between 1.99 and 2.00. Figure 15 shows that Tschermak exchange is preponderant. Octahedral sums above 2.0 are obtained for all ratios, showing the effect of the di-trioctahedral substitution. Octahedral sums below 2.0 are only significant for analyses with the highest aluminoceladonite proportion and high elevated ratios, and the spread towards high octahedral sums remains generally larger than towards low octahedral sums. If white mica analyses were all in the range of the measurements of Masci et al. (2019), then an end-member with an octahedral sum below 2.0 would be necessary, but presently the data are inconclusive about such necessity. In contrast, small proportions of trioctahedral end-members are well established. In the triangle representation of Fig. 15, the proportion of aluminoceladonite-type end-member increases with increasing . Yet the changes are modest for most analyses because the projection from phlogopite-type end-members is roughly aligned with the apparent increase in octahedral vacancies with increasing , making this representation useful. As in Fig. 14b, analyses plotting at negative aluminoceladonite-type content show the lowest Si but highest Na contents, hinting again at additional end-members.
Iron speciation varies from entirely divalent to entirely trivalent in the metapelite database (Fig. 7c), with a median value at = 0.55±0.20, without correlation to total Fe content or to elemental ratios, implying that Fe3+ is generally as prevalent as Fe2+ in metapelitic white mica (see also Forshaw and Pattison, 2021). Mechanisms of Fe3+ incorporation are relatively well understood in white mica, and Fe3+ is considered mostly octahedral (Guidotti and Sassi, 1998; Masci et al., 2019), although the possibility of tetrahedral Fe3+ raised for biotite and chlorite also applies. The MFe3+ ↔ MAl3+ substitution is considered dominant, leading to end-members such as ferrimuscovite (e.g. K(Fe3+Al)(Si3Al)O10(OH)2 as defined by White et al., 2014, Table 1, or K(Fe)(Si3Al)O10(OH)2 by Guidotti and Sassi, 1998) and ferriceladonite (K(MgFe3+)Si4O10(OH)2, e.g. Li et al., 1997). Figure 16 presents these end-members as with biotite (Fig. 13). There is weak correlation between and (Fig. 16a), as with Fe+3 and Si contents when normalized to 22 charges. This hints at substitution towards ferriceladonite with increasing pressure; however ferrimuscovite with 1 Fe3+ cation pfu appears sufficient as an independent compositional end-member to express the entire variability in white mica compositions in the database (Fig. 16).
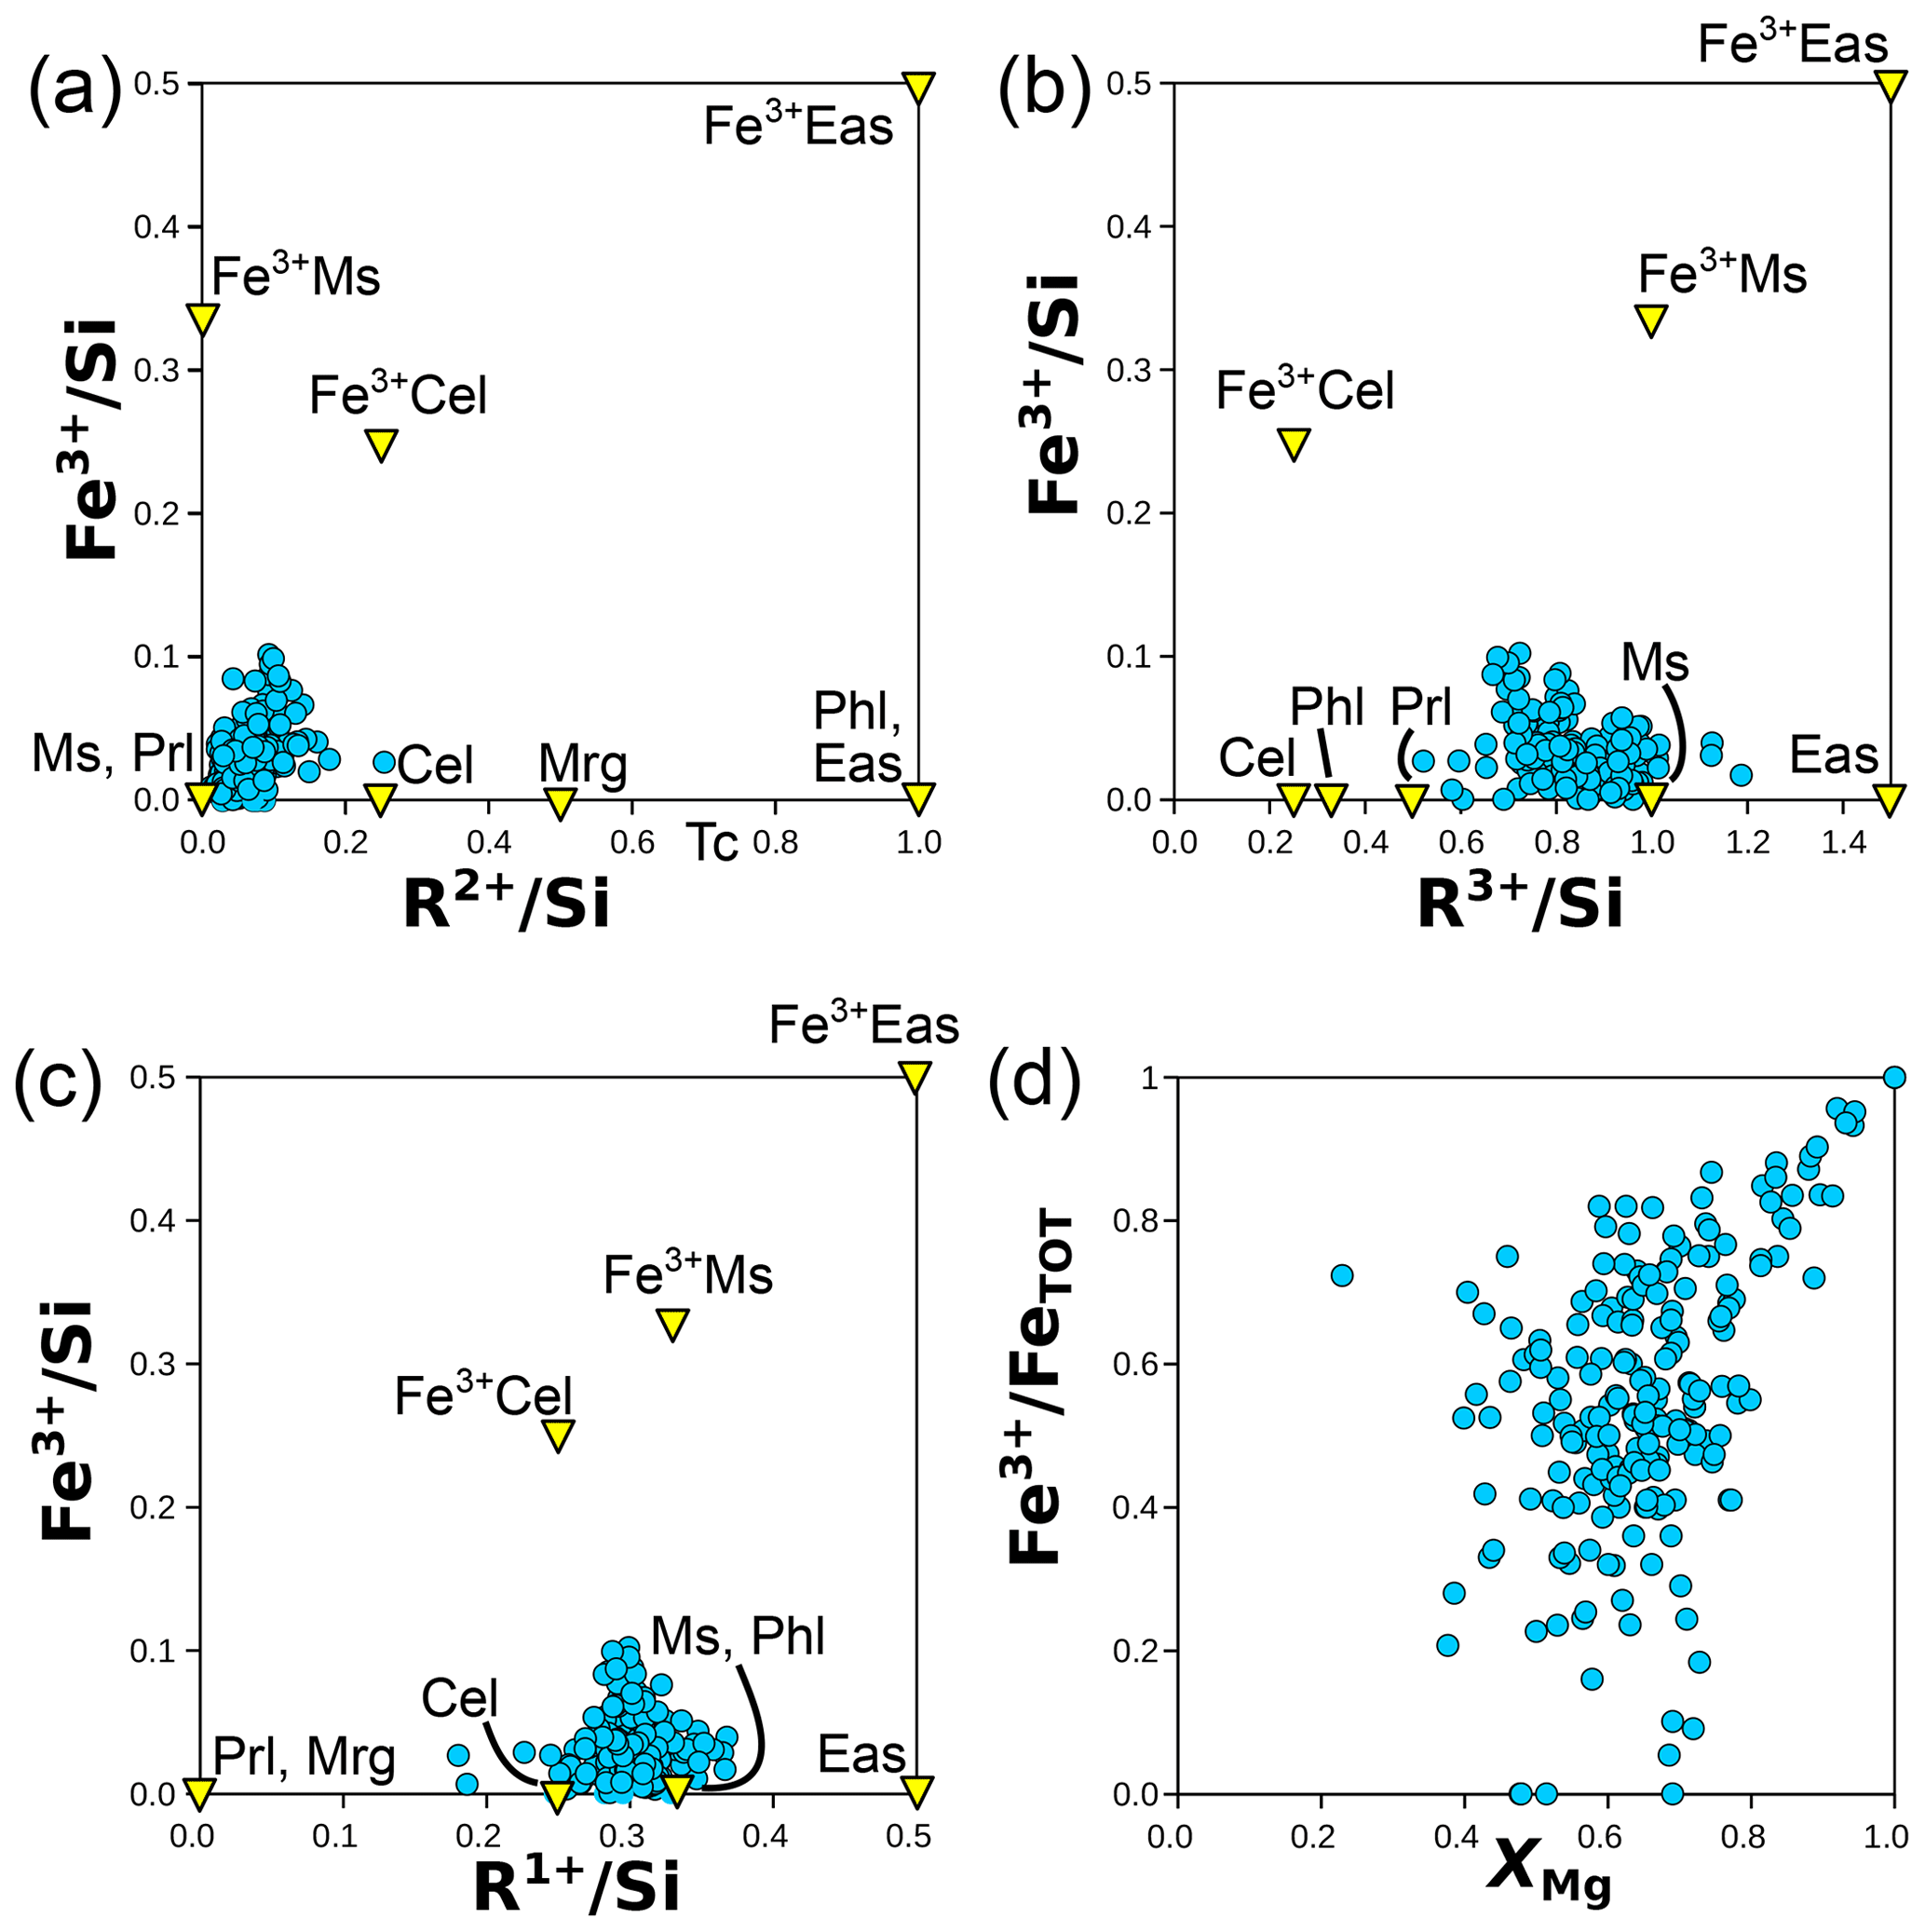
Figure 16Chemical variations involving Fe3+ in white mica, from cation ratios (without the anionic basis). Panels (a), (b), and (c) compare Fe3+ content to R2+, R3+, and R1+ (respectively), all being normalized to Si. End-members discussed in the text (and in Table 1) are shown as yellow triangles. (d) The iron oxidation state () versus XMg, showing correlation in the high-XMg range (i.e. iron in magnesian white mica is mostly trivalent).
A minimal set of compositional end-members includes muscovite, paragonite, pyrophyllite, aluminoceladonite and ferroaluminoceladonite, phlogopite, and ferrimuscovite. Cation distribution into sites follows the same basic rules as for biotite, with simplifications for negligible Ca and possibly Ti contents, octahedral sums close to 2, and the M1 site being almost entirely vacant (and otherwise hosting divalent cations as in Vidal and Parra, 2000).
Despite advances in analytical techniques, phyllosilicate compositions are difficult to analyse integrally and accurately in metapelites. Consequently, uncertainties remain when estimating formula units and distributing cations into crystal sites. In particular, their measured structural water content varies significantly from ideal end-member values, which has considerable effects on estimated octahedral contents. Iron speciation is also a persistent difficulty, as measurement means are much less accessible than electron microprobes, which remain the petrologist's tool of choice but classically do not allow the measurement of . Nevertheless, L emission lines offer this possibility using a microprobe (see, for example, Fialin et al., 2001, 2004, and Li et al., 2019), and transmission microscopy over ion-beam-milled sections is generalizing (e.g. Bourdelle et al., 2013). For electron microprobe analyses including only cations, fixed anionic bases appear legitimate in the absence of better alternatives for chlorite and white mica. For biotite, deprotonation due to Ti incorporation must be accounted for via reduction in the total number of charges compensated for by cations other than Ti. In the metapelite database, iron speciation exhibits more variability in white mica, ranging from = 0 % to = 100 %, compared to the Fe-richer biotite and chlorite. In the latter, iron is mostly in the reduced form. However, Fe3+ content is rarely negligible and even small variations in iron speciation have a significant impact on the calculated formula units in biotite and chlorite.
With these uncertainties, some cation exchange vectors remain questionable. Others are well established, with petrological significance: K–Na exchange in mica, Tschermak, and Fe2+–Mg and Al–Fe3+ exchanges in all three phyllosilicates, in addition to di-trioctahedral exchange, which is important (beyond uncertainties) in chlorite and biotite and to a lesser extent in white mica. Low interlayer contents in mica are best modelled as limited solid solutions towards minerals with cation-free interlayer spaces, such as pyrophyllite for white mica and talc for biotite. Deprotonation is an established feature of biotite (mainly through octahedral Ti incorporation) and chlorite (apparently mostly following iron oxidation). Exchange of Fe3+ with Al in the tetrahedral position is beyond doubt but requires additional systematic studies. Considering the ionic radius variations between Si (0.4 Å), TAl (0.53 Å), and TFe3+ (0.63 Å; radii after Shannon, 1976), significant distortion of the tetrahedral network is expected for TFe3+-rich minerals, with consequences for their thermodynamic properties.
These exchange vectors define the compositional end-members required for thermodynamic modelling, together with cation site distribution schemes. The latter are important because they are the base of mixing models and their configurational entropies of mixing. In tetrahedral sheets, short-range Si–Al order is probably respected over the entire stability range of phyllosilicates, with Al avoidance. However, XRD and NMR measurements have shown that Si and Al are disordered over longer distances, implying that Al should not be allocated solely to the T2 site near T(Si3Al) compositions (e.g. muscovite, phlogopite, clinochlore). Instead, homogeneous dispersion of charges is expected, possibly involving mixtures of Al in para- and meta-disposition in tetrahedral rings near these compositions. With more tetrahedral Al, such as in the amesite and eastonite end-members, it is safe to assume that Al occupies T2 solely, but these conditions are not met in the metapelitic database. The local charge balance in line with exchange vectors also defines rules for cation allocation. In octahedral sheets, these rules include favouring the M2 site for Al to balance vacancy creation in the adjacent M1 site and minimizing the amount of Al in the M3 site of chlorite. Such schemes allow for a significant reduction in the number of end-members required for modelling compared to what could be generated without these rules.
Spreadsheets provided in the Supplement may be used as guidelines to estimate formula units and cation site distribution. It is emphasized that these are mere guidelines with inherent simplifications: precise measurement of the volatile content remains of primary importance for realistic formula units. Iron speciation and distribution of Fe3+ also matter, and cation ordering depends on temperature under equilibrium conditions but may also be acted upon by kinetic processes.
The database of natural metapelitic mica and chlorite analyses is provided in the Supplement.
The supplement related to this article is available online at: https://doi.org/10.5194/ejm-36-657-2024-supplement.
The natural metapelitic phyllosilicate database was compiled by JBF. Other analyses used here were compiled by BD. Anionic bases, exchange vectors, atom site distributions, and the corresponding bibliographical analysis were investigated, tested, and discussed by both authors. BD prepared the text and the figures with contributions from JBF.
The contact author has declared that neither of the authors has any competing interests.
Publisher’s note: Copernicus Publications remains neutral with regard to jurisdictional claims made in the text, published maps, institutional affiliations, or any other geographical representation in this paper. While Copernicus Publications makes every effort to include appropriate place names, the final responsibility lies with the authors.
The authors thank Darby Dyar for kindly providing unpublished data for the west-central Maine region and Clément Herviou, Benjamin Lefeuvre, and Alexis Plunder for their Schistes Lustrés white mica analyses. We acknowledge the painstaking work of petrologists in obtaining wet-chemistry analyses of minerals before the widespread use of the electron microprobe. The paper benefited from detailed and constructive reviews by Dave Waters and the anonymous reviewer, who are gratefully acknowledged.
This paper was edited by Chiara Groppo and reviewed by David Waters and one anonymous referee.
Abad, I., Nieto, F., Peacor, D. R., and Velilla, N.: Prograde and retrograde diagenetic and metamorphic evolution in metapelitic rocks of Sierra Espuña (Spain), Clay Miner., 38, 1–23, https://doi.org/10.1180/0009855033810074, 2003.
Abad, I., Nieto, F., Gutierrez-Alonso, G., do Campo, M., Lopez-Munguira, A., and Velilla, N.: Illitic substitution in micas of very low-grade metamorphic clastic rocks. Eur. J. Miner., 18, 59–69, https://doi.org/10.1127/0935-1221/2006/0018-0059, 2006.
Abrecht, J. and Hewitt, D. A.: Experimental evidence on the substitution of Ti in biotite, Am. Mineral., 73, 1275–1284, 1988.
Agard, P., Vidal, O., and Goffé, B.: Interlayer and Si content of phengite in HP–LT carpholite-bearing metapelites, J. Metamorph. Geol., 19, 479–495, https://doi.org/10.1046/j.0263-4929.2001.00322.x, 2001.
Airaghi, L., Bellahsen, N., Dubacq, B., Chew, D., Rosenberg, C., Janots, E., Waldner, M., and Magnin, V.: Pre-orogenic upper crustal softening by lower greenschist facies metamorphic reactions in granites of the central Pyrenees, J. Metamorph. Geol., 38, 183–204, https://doi.org/10.1111/jmg.12520, 2020.
Alaoui, K., Airaghi, L., Dubacq, B., Rosenberg, C. L., Bellahsen, N., and Précigout, J.: Role of pre-kinematic fluid-rock interactions on phase mixing, quartz recrystallization and strain localization in low-temperature granitic shear zones, Tectonophysics, 850, 229735, https://doi.org/10.1016/j.tecto.2023.229735, 2023.
Amisano-Canesi, A., Chiari, G., Ferraris, G., Ivaldi, G., and Soboleva, S. V.: Muscovite- and phengite-3T, crystal structure and conditions of formation, Eur. J. Mineral., 6, 489–496, https://doi.org/10.1127/ejm/6/4/0489, 1994.
Anderson, C. S. and Bailey, S. W.: A new cation ordering pattern in amesite-2H2, Am. Mineral., 66, 185–195, 1981.
Andrieux, P. and Petit, S.: Hydrothermal synthesis of dioctahedral smectites: The Al-Fe3+ chemical series: Part I: Influence of experimental conditions, Appl. Clay Sci., 48, 5–17, https://doi.org/10.1016/j.clay.2009.11.019, 2010.
Atkin, B. P.: Hercynite as a breakdown product of staurolite from within the aureole of the Ardara Pluton, Co. Donegal, Eire, Mineral. Mag., 42, 237–239, https://doi.org/10.1180/minmag.1978.042.322.10, 1978.
Auzanneau, E., Schmidt, M. W., Vielzeuf, D., and Connolly, J. A. D.: Titanium in phengite: a geobarometer for high temperature eclogites, Contrib. Mineral. Petr., 159, 1–24, https://doi.org/10.1007/s00410-009-0412-7, 2010.
Bailey, S. and Lister, J.: Structures, compositions, and X-ray-diffraction identification of dioctahedral chlorites, Clay. Clay Miner., 37, 193–202, https://doi.org/10.1346/CCMN.1989.0370301, 1989.
Bailey, S. W.: Cation ordering and pseudosymmetry in layer silicates, Am. Mineral., 60, 175–187, 1975.
Bailey, S. W.: Crystal chemistry of the true micas, Micas, 13, 13–60, https://doi.org/10.1515/9781501508820-006, 1984.
Bailey, S. W.: Re-evaluation of ordering and local charge-balance in Ia chlorite, Can. Mineral., 24, 649–654, 1986.
Baker, J. and Holland, T. J. B.: Experimental reversals of chlorite compositions in divariant MgO + Al2O3 + SiO2 + H2O assemblages, Am. Mineral., 81, 676–684, https://doi.org/10.2138/am-1996-5-615, 1996.
Baldelli, C., Franceschelli, M., Leoni, L., and Memmi, I.: Ferrimuscovite and celadonite substitutions in muscovite from Fe3+-rich low-grade psammitic rocks (Northern Apennines, Italy), Lithos, 23, 201–208, https://doi.org/10.1016/0024-4937(89)90005-4, 1989.
Bauluz, B. and Nieto, F.: Ammonium-bearing micas in very low-grade metapelites: micro- and nano-texture and composition, Clay Miner., 53, 105–116, https://doi.org/10.1180/clm.2018.8, 2018.
Battaglia, S.: Variations in the chemical composition of illite from five geothermal fields: a possible geothermometer, Clay Miner., 39, 501–510, https://doi.org/10.1180/0009855043940150, 2004.
Bosenick, A., Dove, M. T., Myers, E. R., Palin, E. J., Sainz-Diaz, C. I., Guiton, B. S., Warren, M. C., Craig, M. S., and Redfern, S. A. T.: Computational methods for the study of energies of cation distributions: applications to cation-ordering phase transitions and solid solutions, Mineral. Mag., 65, 193–219, https://doi.org/10.1180/002646101550226, 2001.
Bourdelle, F., Benzerara, K., Beyssac, O., Cosmidis, J., Neuville, D., Brown, G. E. J., and Paineau, E.: Quantification of the ferric/ferrous iron ratio in silicates by scanning transmission X-ray microscopy at the Fe L2,3 edges, Contrib. Mineral. Petr., 166, 423–434, https://doi.org/10.1007/s00410-013-0883-4, 2013.
Bourdelle, F. and Cathelineau, M.: Low-temperature chlorite geothermometry: a graphical representation based on a T–R2+–Si diagram, Eur. J. Mineral., 27, 617–626, https://doi.org/10.1127/ejm/2015/0027-2467, 2015.
Brigatti, M. F.: Refinement of the Structure of Natural Ferriphlogopite, Clay. Clay Miner., 44, 540–545, https://doi.org/10.1346/CCMN.1996.0440413, 1996.
Brown, B. E. and Bailey, S. W.: Chlorite polytypism: II. crystal structure of a one-layer Cr-chlorite, Am. Mineral., 48, 42–61, 1963.
Brown, E. H.: The greenschist facies in part of eastern Otago, New Zealand: Contrib. Mineral. Petr., 14, 259–292, https://doi.org/10.1007/bf00373808, 1967.
Cathelineau, M. and Nieva, D.: A chlorite solid solution geothermometer – the Los Azufres (Mexico) geothermal system, Contrib. Mineral. Petr., 91, 235–244, https://doi.org/10.1007/BF00413350, 1985.
Cesare, B., Cruciani, G., and Russo, U.: Hydrogen deficiency in Ti-rich biotite from anatectic metapelites (El Joyazo, SE Spain): Crystal-chemical aspects and implications for high-temperature petrogenesis, Am. Mineral., 88, 583–595, https://doi.org/10.2138/am-2003-0412, 2003.
Cesare, B., Satish-Kumar, M., Cruciani, G., Pocker, S., and Nodari, L.: Mineral chemistry of Ti-rich biotite from pegmatite and metapelitic granulites of the Kerala Khondalite Belt (southeast India): Petrology and further insight into titanium substitutions, Am. Mineral., 93, 327–338, https://doi.org/10.2138/am.2008.2579, 2008.
Chambers, J. A. and Kohn, M. J.: Titanium in muscovite, biotite, and hornblende: Modeling, thermometry, and rutile activities of metapelites and amphibolites, Am. Mineral., 97, 543–555, https://doi.org/10.2138/am.2012.3890, 2012.
Clemens, J., Circone, S., Navrotsky, A., McMillan, P., Smith, B., and Wall, V.: Phlogopite: High temperature solution calorimetry, thermodynamic properties, Al-Si and stacking disorder, and phase equilibria, Geochim. Cosmochim. Ac., 51, 2569–2578, https://doi.org/10.1016/0016-7037(87)90307-3, 1987.
Cuadros, J., Michalski, J. R., Dyar, M. D., and Dekov, V.: Controls on tetrahedral Fe(III) abundance in 2 : 1 phyllosilicates, Am. Mineral., 104, 1608–1619, https://doi.org/10.2138/am-2019-7036, 2019.
Dachs, E. and Benisek, A.: A new activity model for Mg-Al biotites determined through an integrated approach, Contrib. Mineral. Petr., 174, 76, https://doi.org/10.1007/s00410-019-1606-2, 2019.
Dachs, E. and Benisek, A.: A new activity model for Fe-Mg-Al biotites: Derivation and calibration of mixing parameters, Contrib. Mineral. Petr., 176, 22, https://doi.org/10.1007/s00410-020-01770-5, 2021.
Das, B. K.: The greenschist facies assemblages of the lower Kumaon Himalaya, Geol. Mag., 110, 59–66, https://doi.org/10.1017/s0016756800047300, 1973.
Dove, M., Thayaparam, S., Heine, V., and Hammonds, K.: The phenomenon of low Al-Si ordering temperatures in aluminosilicate framework structures, Am. Mineral., 81, 349–362, https://doi.org/10.2138/am-1996-3-409, 1996.
Droop, G. T. R.: A general equation for estimating Fe3+ concentrations in ferromagnesian silicates and oxides from microprobe analyses, using stoichiometric criteria, Mineral. Mag., 51, 431–435, https://doi.org/10.1180/minmag.1987.051.361.10, 1987.
Dubacq, B.: Thermodynamics of ordering and mixing in plagioclase feldspars: atomistic modelling in favour of Landau theory, Contrib. Mineral. Petr., 177, 102, https://doi.org/10.1007/s00410-022-01965-y, 2022.
Dubacq, B., Bonnet, G., Warembourg, M., and Baptiste, B.: Very-low-grade phyllosilicates in the Aravis massif (Haute-Savoie, France) and the di-trioctahedral substitution in chlorite, Eur. J. Mineral., 35, 831–844, https://doi.org/10.5194/ejm-35-831-2023, 2023.
Dubacq, B., Vidal, O., and De Andrade, V.: Dehydration of dioctahedral aluminous phyllosilicates: thermodynamic modelling and implications for thermobarometric estimates, Contrib. Mineral. Petr., 159, 159–174, https://doi.org/10.1007/s00410-009-0421-6, 2010.
Dubacq, B., Vidal, O., and Lewin, É.: Atomistic investigation of the pyrophyllitic substitution and implications on clay stability, Am. Mineral., 96, 241–249, https://doi.org/10.2138/am.2011.3564, 2011.
Dyar, M.: Mössbauer spectroscopy of tetrahedral Fe3+ in trioctahedral micas – Discussion, Am. Mineral., 78, 665–668, 1993.
Dyar, M. D.: Optical and Mössbauer Spectroscopy of Iron in Micas, Rev. Miner. Geochem., 46, 313–349, https://doi.org/10.2138/rmg.2002.46.06, 2002.
Dyar, M. D. and Burns, R. G.: Mössbauer spectral study of ferruginous one-layer trioctahedral micas, Am. Mineral., 71, 955–965, 1986.
Dyar, M. D., Colucci, M. T., and Guidotti, C. V.: Forgotten major elements: Hydrogen and oxygen variation in biotite from metapelites, Geology, 19, 1029–1032, https://doi.org/10.1130/0091-7613(1991)019<1029:FMEHAO>2.3.CO;2, 1991.
Dyar, M. D., Guidotti, C. V., Holdaway, M. J., and Colucci, M.: Nonstoichiometric hydrogen contents in common rock-forming hydroxyl silicates, Geochim. Cosmochim. Ac., 57, 2913–2918, https://doi.org/10.1016/0016-7037(93)90399-H, 1993.
Eggleton, R. A. and Bailey, S. W.: Structural aspects of dioctahedral chlorite, Am. Mineral., 52, 673–689, 1967.
Ferrow, E. A. and Bagiński, B.: Chloritisation of hornblende and biotite: a HRTEM study, Acta Geol. Pol., 1, 107–113, 1998.
Fialin, M., Wagner, C., Métrich, N., Humler, E., Galoisy, L., and Bézos, A.: Fe3+/ΣFe vs. FeLα peak energy for minerals and glasses: Recent advances with the electron microprobe, Am. Mineral., 86, 456–465, https://doi.org/10.2138/am-2001-0409, 2001.
Fialin, M., Bézos, A., Wagner, C., and Humler, E.: Quantitative electron microprobe analysis of : Basic concepts and experimental protocol for glasses, Am. Mineral., 89, 654–662, https://doi.org/10.2138/am-2004-0421, 2004.
Figowy, S., Dubacq, B., and D'Arco, P.: Crystal chemistry and partitioning of halogens in hydrous silicates, Contrib. Mineral. Petr., 176, 100, https://doi.org/10.1007/s00410-021-01860-y, 2021.
Forbes, W. C.: An interpretation of the hydroxyl contents of biotites and muscovites, Mineral. Mag., 38, 712–720, https://doi.org/10.1180/minmag.1972.038.298.07, 1972.
Forshaw, J. B. and Pattison, D. R. M.: Ferrous/ferric (Fe2+/Fe3+) partitioning among silicates in metapelites, Contrib. Mineral. Petr., 176, 63, https://doi.org/10.1007/s00410-021-01814-4, 2021.
Forshaw, J. B. and Pattison, D. R.: Bulk Compositional Influence on Diverse Metapelitic Mineral Assemblages in the Whetstone Lake Area, Ontario, J. Petr., 64, egad071, https://doi.org/10.1093/petrology/egad071, 2023a.
Forshaw, J. B. and Pattison, D. R.: Major-element geochemistry of pelites, Geology, 51, 39–43, https://doi.org/10.1130/G50542.1, 2023b.
Foster, M.: Water content of micas and chlorites, US Geological Survey Report, Professional Paper 474-F, https://doi.org/10.3133/pp474F, 1964.
Gable, D. J., Sims, P. K., and Weiblen, P. W.: Thermal metamorphism of cordierite-garnet-biotite gneiss, Front Range, Colorado, J. Geol., 78, 661–685, 1970.
Gueydan, F., Leroy, Y. M., Jolivet, L., and Agard, P.: Analysis of continental midcrustal strain localization induced by microfracturing and reaction-softening, J. Geophys. Res.-Sol. Ea., 108, 2064, https://doi.org/10.1029/2001JB000611, 2003.
Guggenheim, S. and Bailey, S. W.: Refinement of the margarite structure in subgroup symmetry, Am. Mineral., 60, 1023–1039, 1975.
Guggenheim, S. and Bailey, S. W.: Refinement of the margarite structure in subgroup symmetry, correction, further refinement, and comments, Am. Mineral., 63, 186–187, 1978.
Guggenheim, S. and Zhan, W.: Crystal structures of two partially dehydrated chlorites: the “modified” chlorite structure, Am. Mineral., 84, 1415–1421, https://doi.org/10.2138/am-1999-0920, 1999.
Guidotti, C.: Micas in Metamorphic Rocks, Micas, 13, 357–468, https://doi.org/10.1515/9781501508820-014, 1984.
Guidotti, C. and Dyar, M. D.: Ferric iron in metamorphic biotite and its petrologic and crystallochemical implications, Am. Mineral., 76, 161–175, 1991.
Guidotti, C. and Sassi, F.: Petrogenetic significance of Na-K white mica mineralogy: Recent advances for metamorphic rocks, Eur. J. Mineral., 10, 815–854, https://doi.org/10.1127/ejm/10/5/0815, 1998.
Guidotti, C. V., Cheney, J. T., and Guggenheim, S.: Distribution of titanium between coexisting muscovite and biotite in pelitic schists from northwestern Maine, Am. Mineral., 62, 438–448, 1977.
Guitard, G.: La composition des biotites des gneiss œillés du Canigou (Pyrénées-Orientales) et l'origine de ces gneiss, B. Soc. Fr. Mineral. Cr., 86, 139–142, https://doi.org/10.3406/bulmi.1963.8306, 1963.
Güven, N. and Burnham, C. W.: The crystal structure of 3 T muscovite, Z. Kristallogr., 125, 163–183, https://doi.org/10.1524/zkri.1967.125.16.163, 1967.
Hall, S. H.: Cation Ordering Pattern in Amesite, Clay. Clay Miner., 27, 241–247, https://doi.org/10.1346/CCMN.1979.0270401, 1979.
Hawthorne, F. C. and Oberti, R.: Classification of the Amphiboles, Rev. Miner. Geochem., 67, 55–88, https://doi.org/10.2138/rmg.2007.67.2, 2007.
Harte, B.: Stratigraphy, structure and metamorphism in the south-eastern Grampian Highlands of Scotland, Doctoral thesis, University of Cambridge, 1966.
Herrero, C. and Sanz, J.: Short-range order of the Si, Al distribution in layer silicates, J. Phys. Chem. Solids, 52, 1129–1135, https://doi.org/10.1016/0022-3697(91)90045-2, 1991.
Herrero, C. P., Gregorkiewitz, M., Sanz, J., and Serratosa, J. M.: 29Si MAS-NMR spectroscopy of mica-type silicates: Observed and predicted distribution of tetrahedral Al-Si, Phys. Chem. Miner., 15, 84–90, https://doi.org/10.1007/BF00307613, 1987.
Herviou, C. and Bonnet, G.: Paleocene-Eocene High-Pressure Carbonation of Western Alps Serpentinites: Positive Feedback Between Deformation and CO2-CH4 Fluid Ingression Responsible for Slab Slicing?, Geochem. Geophy. Geosy., 24, e2022GC010557, https://doi.org/10.1029/2022GC010557, 2023.
Herviou, C., Agard, P., Plunder, A., Mendes, K., Verlaguet, A., Deldicque, D., and Cubas, N.: Subducted fragments of the Liguro-Piemont ocean, Western Alps: Spatial correlations and offscraping mechanisms during subduction, Tectonophysics, 827, 229267, https://doi.org/10.1016/j.tecto.2022.229267, 2022.
Hewitt, D. A. and Abrecht, J.: Limitations on the interpretation of biotite substitutions from chemical analyses of natural samples, Am. Mineral., 71, 1126–1128, 1986.
Hewitt, D. A. and Wones, D. R.: Experimental Phase Relations of the Micas, Micas, 13, 201–256, https://doi.org/10.1515/9781501508820-011, 1984.
Hietanen, A.: Kyanite, andalusite, and sillimanite in the schist in Boehls Butte Quadrangle, Idaho, Am. Mineral., 41, 1–27, 1956.
Holland, T. J. B. and Powell, R.: An internally consistent thermodynamic data set for phases of petrological interest, J. Metamorph. Geol., 16, 309–343, https://doi.org/10.1111/j.1525-1314.1998.00140.x, 1998.
Holland, T. J. B. and Powell, R.: Mineral activity–composition relations and petrological calculations involving cation equipartition in multisite minerals: a logical inconsistency, J. Metamorph. Geol., 24, 851–861, https://doi.org/10.1111/j.1525-1314.2006.00672.x, 2006.
Holland, T., Baker, J., and Powell, R.: Mixing properties and activity-composition and relationships of chlorites in the system MgO-FeO-Al2O3-SiO2-H2O, Eur. J. Mineral., 10, 395–406, 1998.
Jiang, W.-T., Peacor, D. R., and Essene, E. J.: Clay Miner. in the MacAdams Sandstone, California: Implications for Substitution of H3O+ and H2O and Metastability of Illite, Clay. Clay Miner., 42, 35–45, https://doi.org/10.1346/CCMN.1994.0420105, 1994.
Joswig, W., Takéuchi, Y., and Fuess, H.: Neutron-diffraction study on the orientation of hydroxyl groups in margarite, Z. Kristallogr., 165, 295–304, 1983.
Kanisawa, S., Onuki, H., and Yanai, K.: Chemical Characteristics of Biotites and Hornblendes from Metamorphic Rocks around Lutzow-Holmbukta, East Antarctica, Memoirs of National Institute of Polar Research, Special issue, 14, 153–163, 1979.
Kelley, W.: Calculating formulas for fine grained minerals on the basis of chemical analysis, Am. Mineral., 30, 1–26, 1945.
Kizaki, K.: On Migmatites of the Hidaka Metamorphic Belt: Journal of the Faculty of Science, Hokkaido University, Series 4, Geol. Mineral., 12, 111–169, 1964.
Kretz, R.: Metamorphic differentiation at Einasleigh, northern Queensland, J. Geol. Soc. Australia, 13, 561–582, https://doi.org/10.1080/00167616608728632, 1966.
Kwak, T. A.: Ti in biotite and muscovite as an indication of metamorphic grade in almandine amphibolite facies rocks from Sudbury, Ontario, Geochim. Cosmochim. Ac., 32, 1222–1229, https://doi.org/10.1016/0016-7037(68)90124-5, 1968.
Laird, J.: Chlorites: metamorphic petrology, in: Hydrous phyllosilicates (Exclusive of micas), edited by: Bailey, S. W., Chap. 11, De Gruyter, 405–454, https://doi.org/10.1515/9781501508998-016, 1988.
Lanari, P., Wagner, T., and Vidal, O.: A thermodynamic model for di-trioctahedral chlorite from experimental and natural data in the system MgO-FeO-Al2O3-SiO2-H2O: applications to P–T sections and geothermometry, Contrib. Mineral. Petr., 167, 968, https://doi.org/10.1007/s00410-014-0968-8, 2014.
Lebedev, M. M., Tararin, I. A., and Lagovskaya, E. A.: Metamorphic zones of Kamchatka as an example of the metamorphic assemblages of the inner part of the pacific belt, Tectonophysics, 4, 445–461, https://doi.org/10.1016/0040-1951(67)90010-8, 1967.
Lefeuvre, B.: La lawsonite dans les métasédiments en base de zone sismogénique: géochimie, échelles de migration des fluides et rôle de la déformation dans les Schistes Lustrés, Sorbonne Université, Ecole Doctorale GRNE, 232 pp., 2020.
Lefeuvre, B., Agard, P., Verlaguet, A., Dubacq, B., and Plunder, A.: Massive formation of lawsonite in subducted sediments from the Schistes Lustrés (W. Alps): Implications for mass transfer and decarbonation in cold subduction zones, Lithos, 370–371, 105629, https://doi.org/10.1016/j.lithos.2020.105629, 2020.
Lefeuvre, B., Dubacq, B., Verlaguet, A., Herviou, C., Walker, S., Caron, B., Baxter, E., and Agard, P.: Disentangling the compositional variations of lawsonite in blueschist-facies metasediments (Schistes Lustrés, W. Alps), Contrib. Mineral. Petr., 179, 25, https://doi.org/10.1007/s00410-024-02104-5, 2024.
Lempart-Drozd, M., Błachowski, A., Gumsley, A., and Ciesielska, Z.: Thermal decomposition of minnesotaite and dehydrogenation during Fe2+ oxidation, with implications for redox reactions in Banded Iron Formations, Chem. Geol., 601, 120867, https://doi.org/10.1016/j.chemgeo.2022.120867, 2022.
Lempart, M., Derkowski, A., Luberda-Durnaś, K., Skiba, M., and Błachowski, A.: Dehydrogenation and dehydroxylation as drivers of the thermal decomposition of Fe-chlorites, Am. Mineral., 103, 1837–1850, https://doi.org/10.2138/am-2018-6541, 2018.
Lempart, M., Derkowski, A., Strączek, T., and Kapusta, C.: Systematics of H2 and H2O evolved from chlorites during oxidative dehydrogenation, Am. Mineral., 105, 932–944, https://doi.org/10.2138/am-2020-7326, 2020.
Li, G., Peacor, D. R., Coombs, D. S. and Kawachi, Y.: Solid solution in the celadonite family; the new minerals ferroceladonite, K2FeFeSi8O20(OH)4, and ferroaluminoceladonite, K2FeAl2Si8O20(OH)4, Am. Mineral., 82, 503–511, https://doi.org/10.2138/am-1997-5-609, 1997.
Li, X., Zhang, C., Almeev, R. R., Zhang, X.-C., Zhao, X.-F., Wang, L.-X., Koepke, J., and Holtz, F.: Electron probe microanalysis of ratios in calcic and sodic-calcic amphibole and biotite using the flank method, Chem. Geol., 509, 152–162, https://doi.org/10.1016/j.chemgeo.2019.01.009, 2019.
Li, X., Zhang, C., Behrens, H., and Holtz, F.: Calculating biotite formula from electron microprobe analysis data using a machine learning method based on principal components regression, Lithos, 356–357, 105371, https://doi.org/10.1016/j.lithos.2020.105371, 2020.
Livi, K. J. T. and Veblen, D. R.: “Eastonite” from Easton, Pennsylvania, a mixture of phlogopite and a new form of serpentine, Am. Mineral., 72, 113–125, 1987.
Loucks, R. R.: The bound interlayer H2O content of potassic white micas: Muscovite-hydromuscovite-hydropyrophyllite solutions, Am. Mineral., 76, 1563–1579, 1991.
Lyons, J. B. and Morse, S. A.: Mg/Fe partitioning in garnet and biotite from some granitic, pelitic, and calcic rocks, Am. Mineral., 55, 231–245, 1970.
Masci, L., Dubacq, B., Verlaguet, A., Chopin, C., De Andrade, V., and Herviou, C.: A XANES and EPMA study of Fe3+ in chlorite: Importance of oxychlorite and implications for cation site distribution and thermobarometry, Am. Mineral., 104, 403–417, https://doi.org/10.2138/am-2019-6766, 2019.
Massonne, H.-J. and Schreyer, W.: Phengite geobarometry based on the limiting assemblage with K-feldspar, phlogopite, and quartz, Contrib. Mineral. Petr., 96, 212–224, https://doi.org/10.1007/BF00375235, 1987.
Matejovská, O.: Composition of coexisting garnet and biotite from some granulites of Moldanubiucum, Czechoslovakia, Neues Jb. Miner. Monat., 6, 249–263, 1970.
Miyashiro, A.: Notes on Rock-forming Minerals. (23) Metamorphic Biotite from the Yon-chhyon System in Central Korea, The Journal of the Geological Society of Japan, 68, 351–352, https://doi.org/10.5575/geosoc.68.351, 1962.
Morse, S.: Linear partitioning in binary solutions: A review with a novel partitioning array, Am. Mineral., 100, 1021–1032, https://doi.org/10.2138/am-2015-5056, 2015.
Myhill, R. and Connolly, J. A. D.: Notes on the creation and manipulation of solid solution models, Contrib. Mineral. Petr., 176, 86, https://doi.org/10.1007/s00410-021-01825-1, 2021.
Neiva, A. M. R.: Chlorite and biotite from contact metamorphism of phyllite and metagraywacke by granite, aplite-pegmatite and quartz veins, Chem. Geol., 29, 49–71, https://doi.org/10.1016/0009-2541(80)90005-4, 1980.
Nelson, D. O. and Guggenheim, S.: Inferred limitations to the oxidation of Fe in chlorite: A high-temperature single-crystal X-ray study, Am. Mineral., 78, 1197–1207, 1993.
Nieto, F.: Characterization of coexisting NH4- and K-micas in very low-grade metapelites, Am. Mineral., 87, 205–216, https://doi.org/10.2138/am-2002-2-302, 2002.
Onuki, H.: Almandine hornfelses from Tono contact aureole, Kitakami mountainland, Journal of the Japanese Association of Mineralogists, Petrologists and Economic Geologists, 59, 9–20, https://doi.org/10.2465/ganko1941.59.9, 1968.
Palin, E. and Dove, M.: Investigation of Al/Si ordering in tetrahedral phyllosilicate sheets by Monte Carlo simulation, Am. Mineral., 89, 176–184, https://doi.org/10.2138/am-2004-0120, 2004.
Palin, E., Dove, M., Redfern, S., Bosenick, A., Sainz-Diaz, C., and Warren, M.: Computational study of tetrahedral Al-Si ordering in muscovite, Phys. Chem. Miner., 28, 534–544, https://doi.org/10.1007/s002690100184, 2001.
Patino Douce, A. E., Johnston, A. D., and Rice, J. M.: Octahedral excess mixing properties in biotite: A working model with applications to geobarometry and geothermometry, Am. Mineral., 78, 113–131, 1993.
Pattison, E. F.: Coexisting micas in igneous and metamorphic rocks, Masters thesis, McGill University, 1965.
Phillips, T. L., Loveless, J. K., and Bailey, S. W.: Cr3+ coordination in chlorites: a structural study of ten chromian chlorites, Am. Mineral., 65, 112–122, 1980.
Plamenevskaya, N. L.: Biotite and the Facies of Contact Metamorphism, Int. Geol. Rev., 17, 300–310, https://doi.org/10.1080/00206817509471696, 1975.
Plunder, A., Agard, P., Dubacq, B., Chopin, C., and Bellanger, M.: How continuous and precise is the record of P–T paths? Insights from combined thermobarometry and thermodynamic modelling into subduction dynamics (Schistes Lustrés, W. Alps), J. Metamorph. Geol., 30, 323–346, https://doi.org/10.1111/j.1525-1314.2011.00969.x, 2012.
Powell, R., White, R., Green, E., Holland, T., and Diener, J.: On parameterizing thermodynamic descriptions of minerals for petrological calculations, J. Metamorph. Geol., 32, 245–260, https://doi.org/10.1111/jmg.12070, 2014.
Rancourt, D. G.: Mössbauer spectroscopy of tetrahedral Fe3+ in trioctahedral micas – Reply, Am. Mineral., 78, 669–671, 1993.
Rancourt, D. G., Dang, M. Z., and Lalonde, A. E.: Mössbauer spectroscopy of tetrahedral Fe3+ in trioctahedral micas, Am. Mineral., 77, 34–43, 1992.
Rancourt, D. G., Mercier, H. J., Cherniak, D. J., Desgreniers, S., Kodama, H., Robert, J.-L., and Murad, E.: Mechanisms and crystal chemistry of oxidation in annite: resolving the hydrogen-loss and vacancy reactions, Clay. Clay Miner., 49, 455–491, https://doi.org/10.1346/CCMN.2001.0490601, 2001.
Ransom, B. and Helgeson, H.: Compositional End Members and Thermodynamic Components of Illite and Dioctahedral Aluminous Smectite Solid Solutions, Clay. Clay Miner., 41, 537–550, https://doi.org/10.1346/CCMN.1993.0410503, 1993.
Rebbert, C. R., Partin, E., and Hewitt, D. A.: Synthetic biotite oxidation under hydrothermal conditions, Am. Mineral., 80, 345–354, https://doi.org/10.2138/am-1995-3-416, 1995.
Reynes, J., Jollands, M., Hermann, J., and Ireland, T.: Experimental constraints on hydrogen diffusion in garnet, Contrib. Mineral. Petr., 173, 69, https://doi.org/10.1007/s00410-018-1492-z, 2018.
Rieder, M., Povondra, P., and Fryda, J.: Coexisting biotite and muscovite: An example from a Moinian mica schist at Glenfinnan, Scottish Highlands, Miner. Petrol., 53, 63–74, https://doi.org/10.1007/bf01171947, 1995.
Righter, K., Dyar, M. D., Delaney, J. S., Vennemann, T. W., Hervig, R. L., and King, P. L.: Correlations of octahedral cations with OH−, O2−, Cl−, and F− in biotite from volcanic rocks and xenoliths, Am. Mineral., 87, 142–153, https://doi.org/10.2138/am-2002-0115, 2002.
Rimšaite, J.: On micas from magmatic and metamorphic rocks, Beiträge zur Mineralogie und Petrographie, 10, 152–183, https://doi.org/10.1007/bf02652613,1964.
Rule, A. C. and Bailey, S. W.: Refinement of the crystal structure of a monoclinic ferroan clinochlore, Clay. Clay Miner., 35, 129–138, 1987.
Ryan, C. and Reynolds, R. C. J.: The Chemical Composition of Serpentine/Chlorite in the Tuscaloosa Formation, United States Gulf Coast: EDX vs. XRD Determinations, Implications for Mineralogic Reactions and the Origin of Anatase, Clay. Clay Miner., 45, 339–352, https://doi.org/10.1346/CCMN.1997.0450305, 1997.
Sainz-Diaz, C. I., Hernández-Laguna, A., and Dove, M. T.: Modeling of dioctahedral 2 : 1 phyllosilicates by means of transferable empirical potentials, Phys. Chem. Miner., 28, 130–141, https://doi.org/10.1007/s002690000139, 2001.
Schingaro, E., Kullerud, K., Lacalamita, M., Mesto, E., Scordari, F., Zozulya, D., Erambert, M., and Ravna, E. J.: Yangzhumingite and phlogopite from the Kvaløya lamproite (North Norway): Structure, composition and origin, Lithos, 210–211, 1–13, https://doi.org/10.1016/j.lithos.2014.09.020, 2014.
Schumacher, J. C.: Empirical ferric iron corrections: necessity, assumptions, and effects on selected geothermobarometers, Mineral. Mag., 55, 3–18, https://doi.org/10.1180/minmag.1991.055.378.02, 1991.
Scordari, F., Ventruti, G., Sabato, A., Bellatreccia, F., Della Ventura, G. and Pedrazzi, G.: Ti-rich phlogopite from Mt. Vulture (Potenza, Italy) investigated by a multianalytical approach: substitutional mechanisms and orientation of the OH dipoles, Eur. J. Mineral., 18, 379–391, https://doi.org/10.1127/0935-1221/2006/0018-0379, 2006.
Serna, C. J., Velde, B., and White, J. L.: Infrared evidence of order-disorder in amesites, Am. Mineral., 62, 296–303, 1977.
Shannon, R. D.: Revised effective ionic radii and systematic studies of interatomic distances in halides and chalcogenides, Acta Crystallogr. A, 32, 751–767, https://doi.org/10.1107/S0567739476001551, 1976.
Siron, G., Baumgartner, L., and Bouvier, A.-S.: Significance of OH, F and Cl content in biotite during metamorphism of the Western Adamello contact aureole, Contrib. Mineral. Petr., 173, 63, https://doi.org/10.1007/s00410-018-1491-0, 2018.
Smyth, J., Dyar, M. D., May, H. M., Bricker, O., and Acker, J. G.: Crystal structure refinement and Mössbauer spectroscopy of an ordered, triclinic clinochlore, Clay. Clay Miner., 45, 544–550, https://doi.org/10.1346/CCMN.1997.0450406, 1997.
Tajčmanová, L., Connolly, J. A. D., and Cesare, B.: A thermodynamic model for titanium and ferric iron solution in biotite, J. Metamorph. Geol., 27, 153–165, https://doi.org/10.1111/j.1525-1314.2009.00812.x, 2009.
Thompson, J. B.: The Graphical Analysis of Mineral Assemblages in Pelitic Schists, Am. Mineral., 42, 842–858, 1957.
Thompson, J. B.: Biopyriboles and polysomatic series, Am. Mineral., 63, 239–249, 1978.
Tischendorf, G., Rieder, M., Förster, H.-J., Gottesmann, B., and Guidotti, C.: A new graphical presentation and subdivision of potassium micas, Mineral. Mag., 68, 649–667, https://doi.org/10.1180/0026461046840210, 2004.
Tischendorf, G., Förster, H.-J., Gottesmann, B., and Rieder, M.: True and brittle micas: composition and solid-solution series, Mineral. Mag., 71, 285–320, https://doi.org/10.1180/minmag.2007.071.3.285, 2007.
Trincal, V. and Lanari, P.: Al-free di-trioctahedral substitution in chlorite and a ferri-sudoite end-member, Clay Miner., 51, 675–689, https://doi.org/10.1180/claymin.2016.051.4.09, 2016.
Trzcienski Jr., W. E.: Staurolite and garnet parageneses and related metamorphic reactions in metapelites from the Whetstone Lake area, Southeastern Ontario, Doctoral thesis, McGill University, 1971.
Veblen, D. R. and Buscek, R.: Microstructures and reaction mechanisms in biopyriboles, Am. Mineral., 65, 599–623, 1980.
Velde, B.: Phengite micas: synthesis, stability, and natural occurrence, Am. J. Sci., 263, 886–913, https://doi.org/10.2475/ajs.263.10.886, 1965.
Vidal, O. and Parra, T.: Exhumation paths of high-pressure metapelites obtained from local equilibria for chlorite–phengite assemblages, Geol. J., 35, 139–161, https://doi.org/10.1002/gj.856, 2000.
Vidal, O., Parra, T., and Trotet, F.: A Thermodynamic Model for Fe-Mg Aluminous Chlorite Using Data from Phase Equilibrium Experiments and Natural Pelitic Assemblages in the 100 ° to 600 °C, 1 to 25 kb Range, Am. J. Sci., 301, 557–592, https://doi.org/10.2475/ajs.301.6.557, 2001.
Vidal, O., De Andrade, V., Lewin, E., Munoz, M., Parra, T., and Pascarelli, S.: P-T-deformation-Fe3+/Fe2+ mapping at the thin section scale and comparison with XANES mapping: application to a garnet-bearing metapelite from the Sambagawa metamorphic belt (Japan), J. Metamorph. Geol., 24, 669–683, https://doi.org/10.1111/j.1525-1314.2006.00661.x, 2006.
Vidal, O., Lanari, P., Munoz, M., Bourdelle, F., and De Andrade, V.: Deciphering temperature, pressure and oxygen-activity conditions of chlorite formation, Clay Miner., 51, 615–633, https://doi.org/10.1180/claymin.2016.051.4.06, 2016.
Vinograd, V.: Substitution of [4]Al in layer silicates: Calculation of the Al-Si configurational entropy according to 29Si NMR Spectra, Phys. Chem. Miner., 22, 87–98, https://doi.org/10.1007/BF00202468, 1995.
Walker, J. R. and Bish, D. L.: Application of Rietveld Refinement Techniques to a Disordered IIb Mg-Chamosite, Clay. Clay Miner., 40, 319–322, https://doi.org/10.1346/CCMN.1992.0400311, 1992.
Warr, L. N.: Recommended abbreviations for the names of clay minerals and associated phases, Clay Miner., 55, 261–264, https://doi.org/10.1180/clm.2020.30, 2020.
Waters, D. and Charnley, N.: Local equilibrium in polymetamorphic gneiss and the titanium substitution in biotite, Am. Mineral., 87, https://doi.org/10.2138/am-2002-0402, 2002.
Waters, D. J.: Metamorphic constraints on the tectonic evolution of the High Himalaya in Nepal: the art of the possible, Geol. Soc. Lond. Spec. Publ., 483, 325–375, https://doi.org/10.1144/SP483-2018-187, 2019.
Welch, M. D. and Marshall, W. G.: High-pressure behavior of clinochlore, Am. Mineral., 86, 1380–1386, https://doi.org/10.2138/am-2001-11-1206, 2001.
Welch, M. D., Barras, J., and Klinowski, J.: A multinuclear NMR study of clinochlore, Am. Mineral., 80, 441–457, 1995.
White, R. W., Powell, R., and Holland, T. J. B.: Progress relating to calculation of partial melting equilibria for metapelites, J. Metamorph. Geol., 25, 511–527, https://doi.org/10.1111/j.1525-1314.2007.00711.x, 2007.
White, R. W., Powell, R., Holland, T. J. B., Johnson, T. E., and Green, E. C. R.: New mineral activity-composition relations for thermodynamic calculations in metapelitic systems, J. Metamorph. Geol., 32, 261–286, https://doi.org/10.1111/jmg.12071, 2014.
Yamada, H.: On Biotites in Thermally Metamorphosed Slates from Senmaya, Iwate Prefecture, Japan, P. Jpn. Acad., 29, 172–177, https://doi.org/10.2183/pjab1945.29.172, 1953.
Zanazzi, P., Montagnoli, M., Nazzareni, S., and Comodi, P.: Structural effects of pressure on triclinic chlorite: A single-crystal study, Am. Mineral., 91, 1871–1878, https://doi.org/10.2138/am.2006.2191, 2006.
Zanazzi, P., Montagnoli, M., Nazzareni, S., and Comodi, P.: Structural effects of pressure on monoclinic chlorite: A single-crystal study, Am. Mineral., 92, 655–661, https://doi.org/10.2138/am.2007.2341, 2007.
Zanazzi, P., Francesco Comodi, P., Nazzareni, S., and Battista, A. G.: Thermal behaviour of chlorite: an in situ single-crystal and powder diffraction study, Eur. J. Mineral., 21, 581–589, https://doi.org/10.1127/0935-1221/2009/0021-1928, 2009.
- Abstract
- Introduction
- Database
- Formula units in phyllosilicates and the effect of selecting an anionic basis
- Tetrahedral ordering in phyllosilicates
- Substitutions, phase components, and end-members for modelling
- Summary and concluding remarks
- Data availability
- Author contributions
- Competing interests
- Disclaimer
- Acknowledgements
- Review statement
- References
- Supplement