the Creative Commons Attribution 4.0 License.
the Creative Commons Attribution 4.0 License.
 | 14 Jun 2024
The use of MgO–ZnO ceramics to record pressure and temperature conditions in the piston–cylinder apparatus
Hugh St. C. O'Neill
The factors affecting the calibration of pressure in the piston–cylinder and other solid-media apparatus are so multifaceted and complex as to challenge existing approaches. Here we demonstrate how MgO–ZnO ceramics may be used in piston–cylinder assemblies to routinely record the pressure–temperature conditions experienced by samples in each run. The miscibility gap between rock-salt- and wurtzite-structured phases in the binary system MgO–ZnO is well suited for this purpose as it is capable of recording pressure and/or temperature in situ with a typical sensitivity to pressure of ± 0.02 GPa (1 standard deviation) if temperature is known, or variations in temperature around a sample of ∼ 10 °C assuming pressure is constant. MgO–ZnO ceramics can simply replace the widely used MgO surrounding samples under most conditions, since they are almost as inert chemically as MgO and have similar mechanical properties. As a demonstration, we apply the method to a redetermination of the quartz–coesite univariant phase transition in the piston–cylinder, using different assembly materials, sizes, and pressure–temperature path protocols. Continuous monitoring of piston travel during the entirety of each run helps reveal the differences in behaviour of the apparatus under these variables. We show that several assumptions about the behaviour of the piston–cylinder apparatus are ill-founded, that there may be a discrepancy of ∼ 10 % in pressure between otherwise identical experiments conducted using slightly different experimental protocols, and that the effects of the various options for assembly materials are complex, depending on the pressure–temperature path of the experiment throughout its duration. We have also used the sensitivity of the miscibility gap to temperature to map the temperature distribution in two dimensions surrounding a platinum capsule in a piston–cylinder experiment. The routine inclusion of the ceramic in piston–cylinder assemblies would provide an archive of actual experimental P–T conditions experienced by samples.
- Article
(2378 KB) - Full-text XML
- Companion paper
-
Supplement
(173 KB) - BibTeX
- EndNote


Although high-temperature, high-pressure experimentation using internally heated piston–cylinder apparatus (Boyd and England, 1960) is a mature technique widely used in the Earth and planetary sciences (e.g. Holloway and Wood, 1988), uncertainty and inconsistency in the calibration of sample pressure persist. To illustrate the continued significance of this problem, consider the discrepancies of the order of 20 % in pressure between studies of the spinel-to-garnet phase transition in the systems MgO–Al2O3–SiO2 and CaO–MgO–Al2O3–SiO2 (e.g. Klemme and O'Neill, 2000; Walter et al., 2002; Longhi, 2005; Green et al., 2012), one of the most important cornerstones in the development of thermodynamic models of the mantle.
The actual pressure experienced by a sample during an experiment (Psample) may differ from the nominal pressure (Pnominal), which is calculated from the oil pressure in the hydraulic system driving the piston, and the geometry of the piston and the hydraulic ram that pushes it. Any such difference may be parameterized using a correction factor, f, such that
It has been well established that the use of different materials in piston–cylinder assemblies can affect the magnitude of f considerably (Johannes et al., 1971; Johannes, 1978; McDade et al., 2002; Condamine et al., 2022) – so too can the different sequences by which pressure and temperature are brought to the desired conditions (Johannes et al., 1971; Akella, 1979; Bose and Ganguly, 1985). Given the known material properties of the components of piston–cylinder assemblies, it would not be surprising if f were to be a function of temperature, pressure, and run duration, although these factors have been but sparsely investigated. Even less known are the effects of variations from the nominal dimensions of piston and core, as well as wear and tear on them, including plastic deformation, perhaps inherited from previous use. The magnitude of f proposed for seemingly similar experimental protocols can vary markedly between laboratories, from zero to ∼ 15 % (e.g. Klemme and O'Neill, 2000; McDade et al., 2002).
In this paper we evaluate the behaviour of the piston–cylinder apparatus using the miscibility gap between the rock salt and wurtzite (rs–wz) phases in the binary system MgO–ZnO, which has been calibrated as a pressure–temperature sensor (Farmer and O'Neill, 2023). The pressure range of applicability is from zero to the pressure of the rs-to-wz univariant curve in the ZnO endmember, which occurs a bit above 5 GPa, depending on temperature. Up to 4 GPa, the precision with which the composition of the coexisting phases can be determined using an electron probe microanalyser (EPMA) translates to a precision of about 0.02 GPa (1 standard deviation) in pressure if temperature is measured independently. The huge advantage of this sensor is that a small amount of MgO–ZnO ceramic of a suitable composition may be included in each run to record P–T conditions as experienced by the sample, instead of relying solely on calibration experiments done separately. The reactivity of MgO–ZnO with adjacent materials, hydrogen, and oxygen is generally similar to that of MgO, and a MgO + ZnO material can be used to replace MgO in any experimental pressure assembly, except where the temperature exceeds the solidus, or under very reducing conditions where ZnO may be reduced to metal vapour. These conditions were not explored in this study. An obvious strategy is to replace the MgO ceramic that is often used to surround the capsule in existing pressure assemblies with an MgO–ZnO ceramic, which also has similar mechanical properties.
Here we report the results of a series of experiments demonstrating the use of the sensor and the insights that its use gives into the realization of precise pressure control in the piston–cylinder apparatus when combined with continuous piston-travel monitoring. The experiments cover a range of pressure and temperature conditions, different high-pressure cell assemblies, and piston-in and piston-out sequences. We show that the sensor can give quantitative results at temperatures between approximately 800 °C and the MgO–ZnO eutectic. This eutectic is at ∼ 1700 °C at atmospheric pressure and has a negative slope, decreasing to less than 1400 °C at 3.7 GPa (Farmer and O'Neill, 2023). The sensor can also map temperature distributions in the piston–cylinder surrounding a capsule in two dimensions. Previous methods have measured temperature using multiple thermocouples at a small number of discrete points (e.g. Boyd and England, 1963), along linear features within the assembly (Watson et al., 2002), or have used two-phase equilibria such as coexisting ortho- and clinopyroxene within a capsule similar to that employed in the experimental campaign (e.g. Zarei et al., 2018; Farmer et al., 2020). The advantage of using MgO–ZnO ceramic surrounding the capsule is that the temperature distribution could be measured for each experiment individually. If implemented, many types of rogue experiment, such as those caused by the thermocouple jacking out, could be identified. Assuming constant pressure, the sensor can measure temperature differences of the order of 10 °C. An Excel spreadsheet with a VBA macro for carrying out the calculation of pressure or temperature from the thermodynamic model of Farmer and O'Neill (2023) is included in the Supplement.
2.1 Experimental
2.1.1 Starting materials
Starting materials for rock salt and wurtzite are mixtures of powdered MgO and ZnO with grain size in the order of 1 µm, in different proportions from 70 mol % to 85 mol % ZnO depending on experimental pressure. Compositions were selected that would produce a two-phase assemblage at the experimental conditions, using Fig. 4 in Farmer and O'Neill (2023) as a guide. Grain size in starting materials can be an important consideration, especially in low-temperature experiments: we have found that grains in the order of 5 µm in size recrystallize readily at temperatures above ∼ 800 °C (see Sect. 3.5) to form crystals > 10 µm in diameter, which are suitable for precise EPMA analysis. Grains in the order of 1 µm recrystallize into crystals of this size in as little as 3 h (see Sect. 3.4).
For experiments bracketing the quartz–coesite univariant phase boundary, the starting materials are a 1:1 (by mass) mixture of quartz and coesite, with coesite synthesized in the piston–cylinder from quartz at ∼ 4 GPa, 1200 °C. The phase transformation was verified by Raman spectroscopy.
2.1.2 Piston–cylinder apparatus
Piston–cylinder experiments were conducted using a computer-controlled end-loaded 200 t piston–cylinder press developed in-house at the Research School of Earth Sciences, ANU. The piston–cylinder press is largely conventional in its mechanical design, following Boyd and England (1960), and is described in detail in Appendix A. Notable improvements over conventional piston–cylinder apparatus include a computerized pressure control system that can maintain nominal pressure to within 0.2 % and an extensive logging function that records the temperature, nominal pressure, and piston position (measured using an electronic micrometer) at a user-selectable frequency. This apparatus is generally able to control the temperature as measured by the thermocouple to ± 1 °C.
2.1.3 High-pressure cell assemblies
Multiple samples were equilibrated in these experiments, using either a single multi-well Ag capsule machined from Ag rod or an assembly containing multiple Pt capsules fashioned from tubes of either 2.3 or 1.5 mm diameter with crimped and welded ends, placed at the same height within the assembly, side by side in a radially symmetrical arrangement (see Fig. 1).
Experiments were conducted using various types of assembly, a subset of which is shown in Fig. 1, to measure the effect of different assembly sizes and materials on sample pressure. These assemblies comprise concentric cylinders with a graphite heater and outer NaCl pressure medium. The main variables were (i) whether a sleeve of Pyrex borosilicate glass was introduced between the pressed NaCl pressure medium and the graphite heater and (ii) differences in assembly diameter. Spacers of crushable MgO (∼ 30 % porosity, supplied by Tateho Ozark, Webb City, Missouri, USA) were placed within the heater, with the sample capsule held in drilled-out (and for the larger Ag capsules, milled) wells in the spacer at the centre of the assembly. A type B (Pt70Rh30-Pt94Rh6) thermocouple was used in every experiment, introduced through the top of the assembly within an alumina sheath and always either close to the top of the capsule or aligned with the centre of the capsules in multi-capsule experiments.
These assemblies are of a conventional design, similar to those used in other laboratories (e.g. Manning and Boettcher, 1994; McDade et al., 2002; Condamine et al., 2022). Experiments were conducted using assemblies with outer diameters of in. (∼ 12.7 mm), in. (∼ 15.9 mm), and in. (∼ 19.1 mm).
One key experiment was conducted using a in. assembly in which the MgO ceramic spacer was replaced with 20 mol % MgO + 80 mol % ZnO. This material was pressed into a 5.5 mm diameter pellet with a polyvinyl acetate (PVA) binder (following Wade and Wood, 2002) and sintered for several hours at 1000 °C, which burned off the binder and caused a slight decrease in volume. Comparison with a control experiment conducted at identical conditions showed that this material was found to perform indistinguishably from the commercial MgO used in other experiments (see Table 3), demonstrating how the sensor may be routinely used in the future.
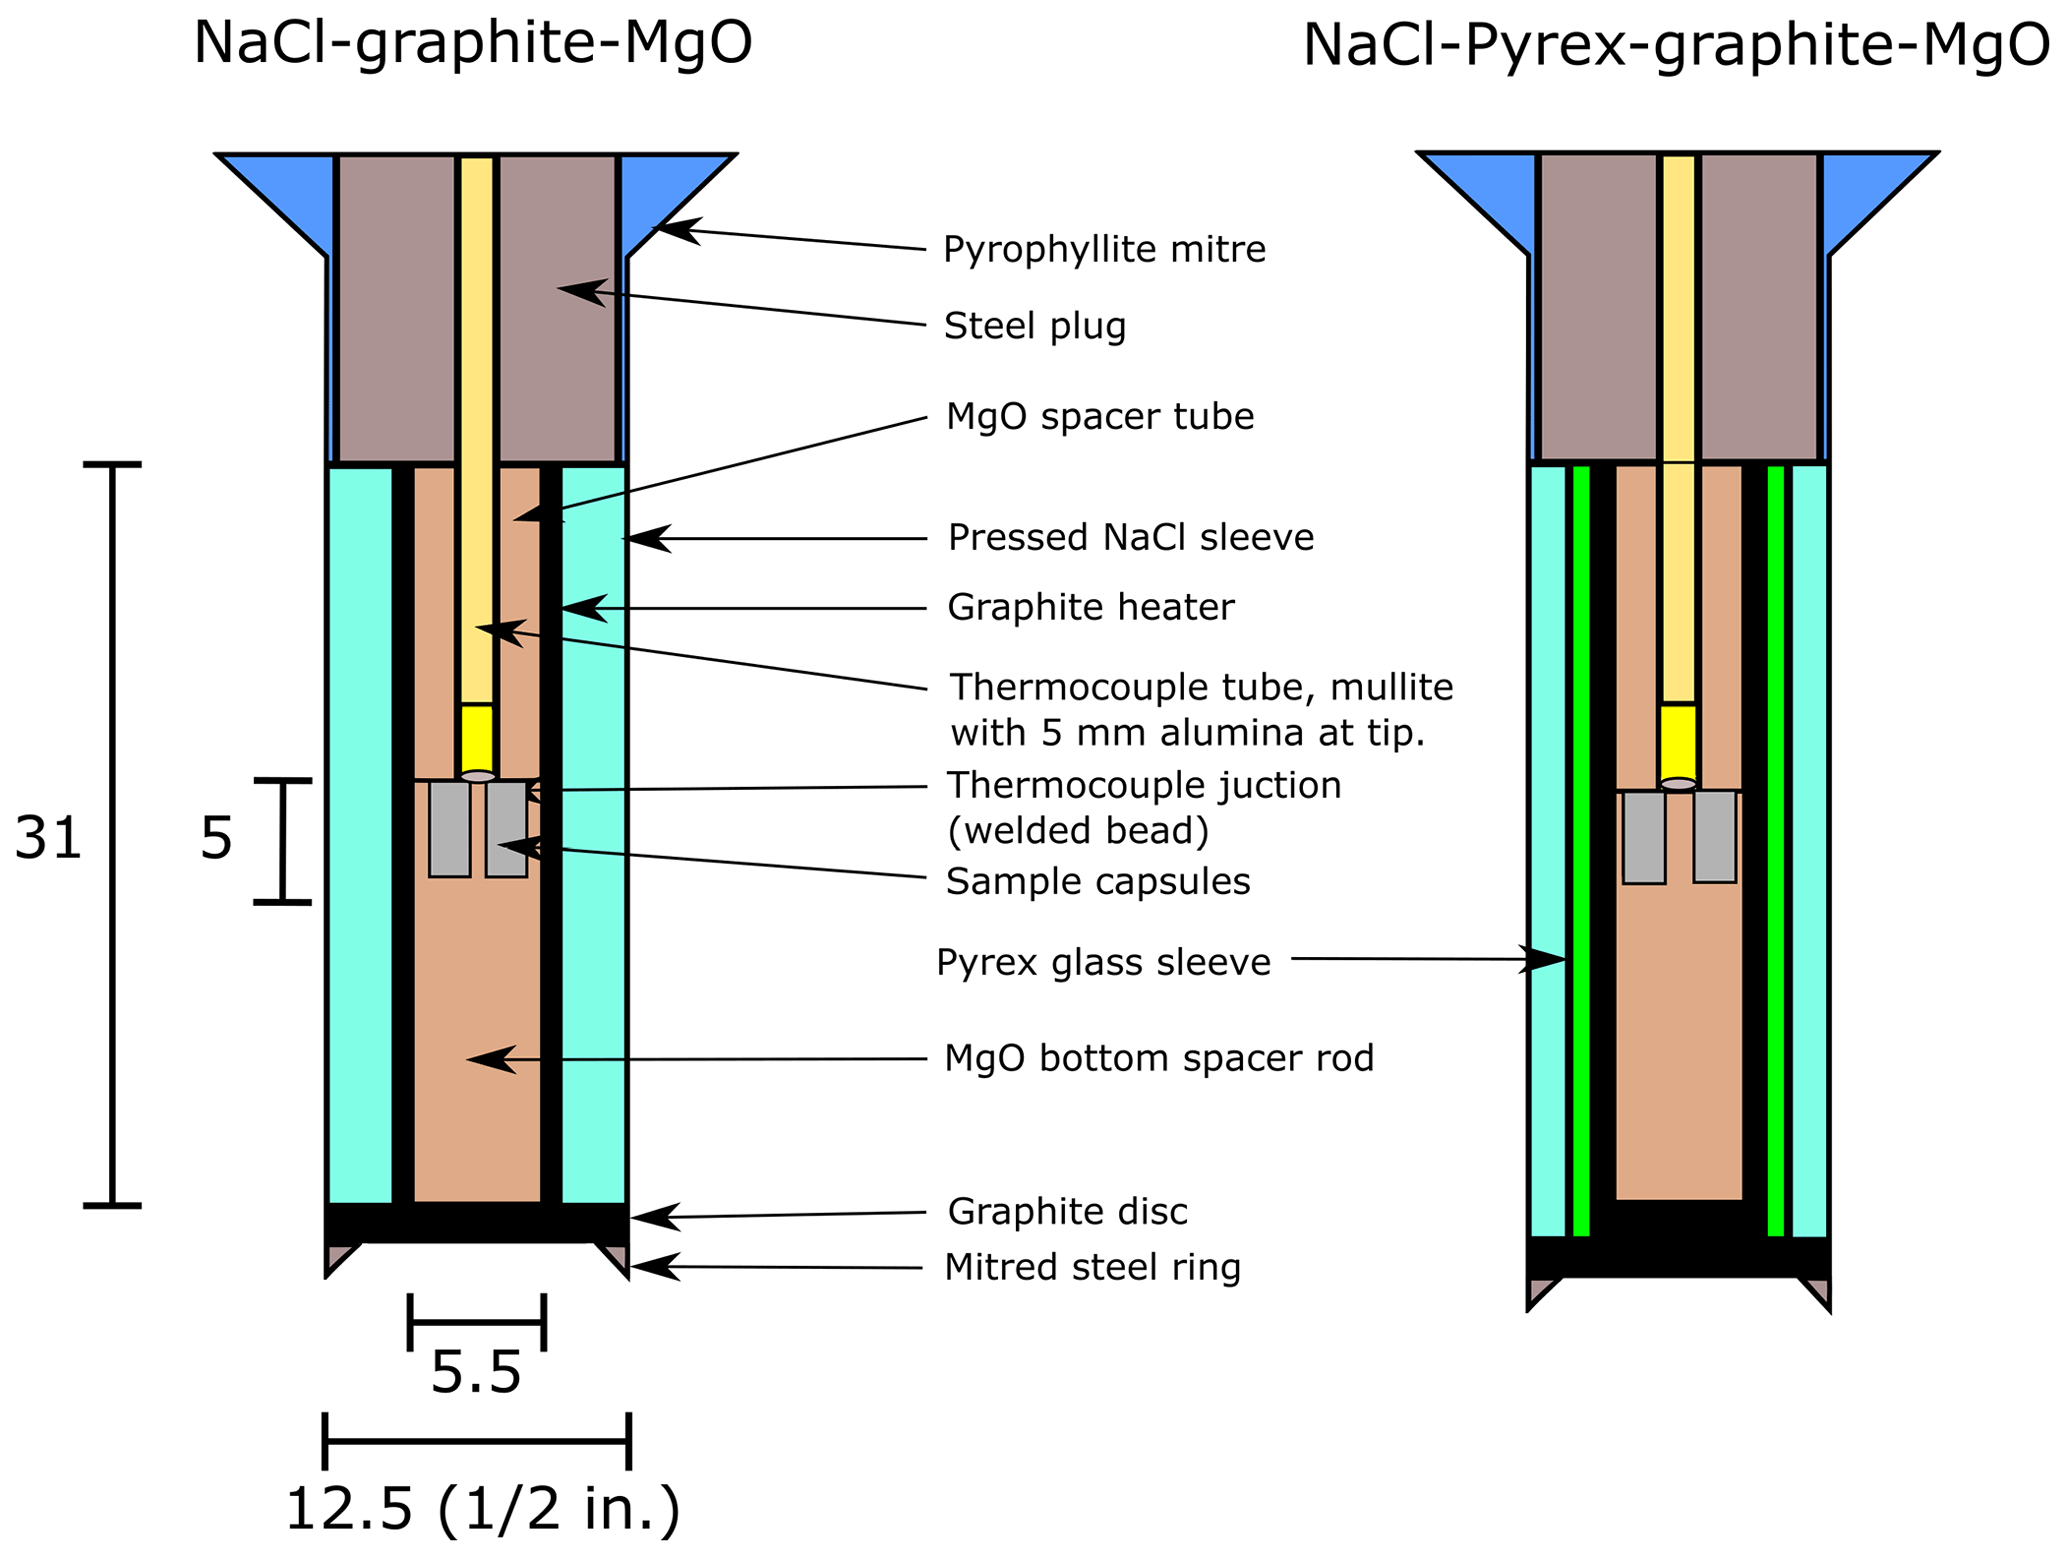
Figure 1The in. NaCl–graphite–MgO and NaCl–Pyrex–graphite–MgO piston–cylinder assemblies used in this study, with dimensions in millimetres. The and in. assemblies are constructed from the same materials and are of a similar design, with different dimensions.
2.1.4 Experimental routines
Experiments were conducted using various sequences of increasing and decreasing pressure and temperature, referred to here as “experimental routines”, which have long been known to impact sample pressure (Green et al., 1966; Johannes et al., 1971). “Piston-in” experiments were conducted by increasing Pnominal and temperature to the desired value simultaneously over a period of ∼ 20 min, whereas “piston-out” experiments are conducted by raising Pnominal to a greater pressure than the final pressure at a lower temperature (typically 450 °C); holding the experiment at this low-temperature, high-pressure overpressure condition for 12 h; and then simultaneously decreasing Pnominal and increasing sample temperature to the final value over 5 min.
A series of experiments bracketed the quartz–coesite phase transition at 800, 1000, and 1200 °C using both piston-in and piston-out methods. This phase transition has traditionally been used to calibrate piston–cylinder apparatus (e.g. Green et al., 1966; Huang and Wyllie, 1976; McDade et al., 2002; Condamine et al., 2022). For piston-out experiments in this series, an initial overpressure of 0.5 GPa (i.e. Pnominal 0.5 GPa in excess of the final run value) was applied at 450 °C, following the suggestion of Johannes et al. (1978). After 30 min at these conditions, the temperature was then increased to the final run temperature, and the pressure was released to the target pressure, with piston position monitored continuously. The effect of the magnitude of the overpressure was explored with two additional experiments using an overpressure of 0.2 GPa.
2.2 Analytical
2.2.1 Electron probe microanalysis
Samples to be analysed by electron probe microanalyser (EPMA) were cast in 25 mm diameter epoxy discs, exposed using fine sandpaper, polished to a mirror finish using diamond pastes down to 1 µm particle size, and then coated with 30 nm of carbon. EPMA analysis was conducted using a JEOL 8530F at the Centre for Advanced Microscopy, ANU, using the analytical routine detailed in Farmer and O'Neill (2023). Briefly, endmember phases were used as standards: periclase from a commercially supplied standard block (Astimex Standards Ltd.) and synthetic zincite purchased commercially (MTI Corp). The instrument was calibrated using these standards at the start of each analytical session, with the Kα emission line of both elements analysed. Analyses were conducted with beam settings of 15 keV and 20 nA, and the default JEOL software and matrix correction routine were used to calculate composition.
2.2.2 Raman spectroscopy
SiO2 phases in the quartz/coesite experiments were identified using a Renishaw inVia Raman spectrometer equipped with a 532 nm laser. Spectra were visually compared to quartz and coesite spectra in the RRUFF online database (Lafuente et al., 2016) and classified as quartz or coesite on the basis of the position of the most prominent peak (520 nm for coesite, 465 nm for quartz) and the greater number of significant peaks at lower wavelength in the coesite spectrum. Several (> 12) spectra were acquired for each sample at different positions in the exposed capsule. An exposed surface, polished or unpolished, was sufficient for this Raman analysis, as the difference between quartz and coesite spectra is stark.
In some experimental charges, both quartz and coesite were detected, but with one in much greater abundance than the other. As the starting materials were equal parts quartz and coesite by mass, the predominance of one phase rather than the other is evidence of a reaction occurring, although the persistence of a minor amount of the second phase may indicate that the conditions of the experiment were close to the phase boundary.
2.2.3 QEMSCAN
The experiment conducted with MgO–ZnO replacing MgO ceramic was analysed using QEMSCAN (Gottlieb et al., 2000). The entire high-pressure assembly from this experiment was mounted in a 25 mm epoxy disc in two sections and sectioned axially using a diamond saw. This surface was polished and carbon coated. EPMA analyses were made of several areas of this sample within the Pt capsule, and an FEI QEMSCAN instrument, a scanning electron microscope equipped with two high-count-rate energy dispersive X-ray spectroscopy (EDS) detectors, was used to make EDS maps of the sample at 2.57 µm spacing, with 6000 EDS counts at each point. The data output from this comprises a spatially resolved database of EDS spectra that can be processed into various maps.
2.3 Pressure calculation from the MgO–ZnO sensor
For experimental charges in which rock salt and wurtzite were present, pressure was calculated from the compositions measured by EPMA using the Excel macro calculator included in the Supplement. The calculation uses the weighted average of both phases. The uncertainties in calculated pressure were propagated from the observed standard deviations of the EPMA analyses (usually 10 analyses on each phase) and an assumed uncertainty in temperature, as measured by the thermocouple in the experiment, of 5 °C, 1 standard deviation. All uncertainties in this paper refer to single standard deviations. Because the problem is over-determined (one unknown, namely pressure, and two observations, namely the compositions of the rock salt and the wurtzite), we also report the weighted sum of squares of the differences between the observed composition and composition calculated using the thermodynamic model at the pressure and temperature conditions fit by the model, which provides a goodness-of-fit statistic. While the precise value of this statistic is not itself of much statistical significance because there is only the single degree of freedom, it is still useful in that high values may signal some problem, such as the temperature being in error.
Both temperature and pressure can be calculated from the two compositions, but we do not recommend relying on such a calculation because of the high covariance between the two, as shown in Fig. 2. This plot showing covariance between simultaneously calculated pressure and temperature is generated from a probability distribution calculated using a Markov chain Monte Carlo method described in Appendix B. The precision in temperature from the thermodynamic model obtained by assuming pressure is around ± 10 °C (see also Appendix B), which compares unfavourably to the thermocouple precision but is still useful in the context of measuring temperature gradients (see Sect. 3.5). Precision in pressure from the thermodynamic model is around ± 0.02 GPa when temperature is known from the thermocouple and its standard deviation (s(T)) is assumed to be 5 °C.
In order to maintain consistency with the calibration of the miscibility gap from Farmer and O'Neill (2023), we recommend the use of single-crystal MgO and ZnO as standards for EPMA analysis.
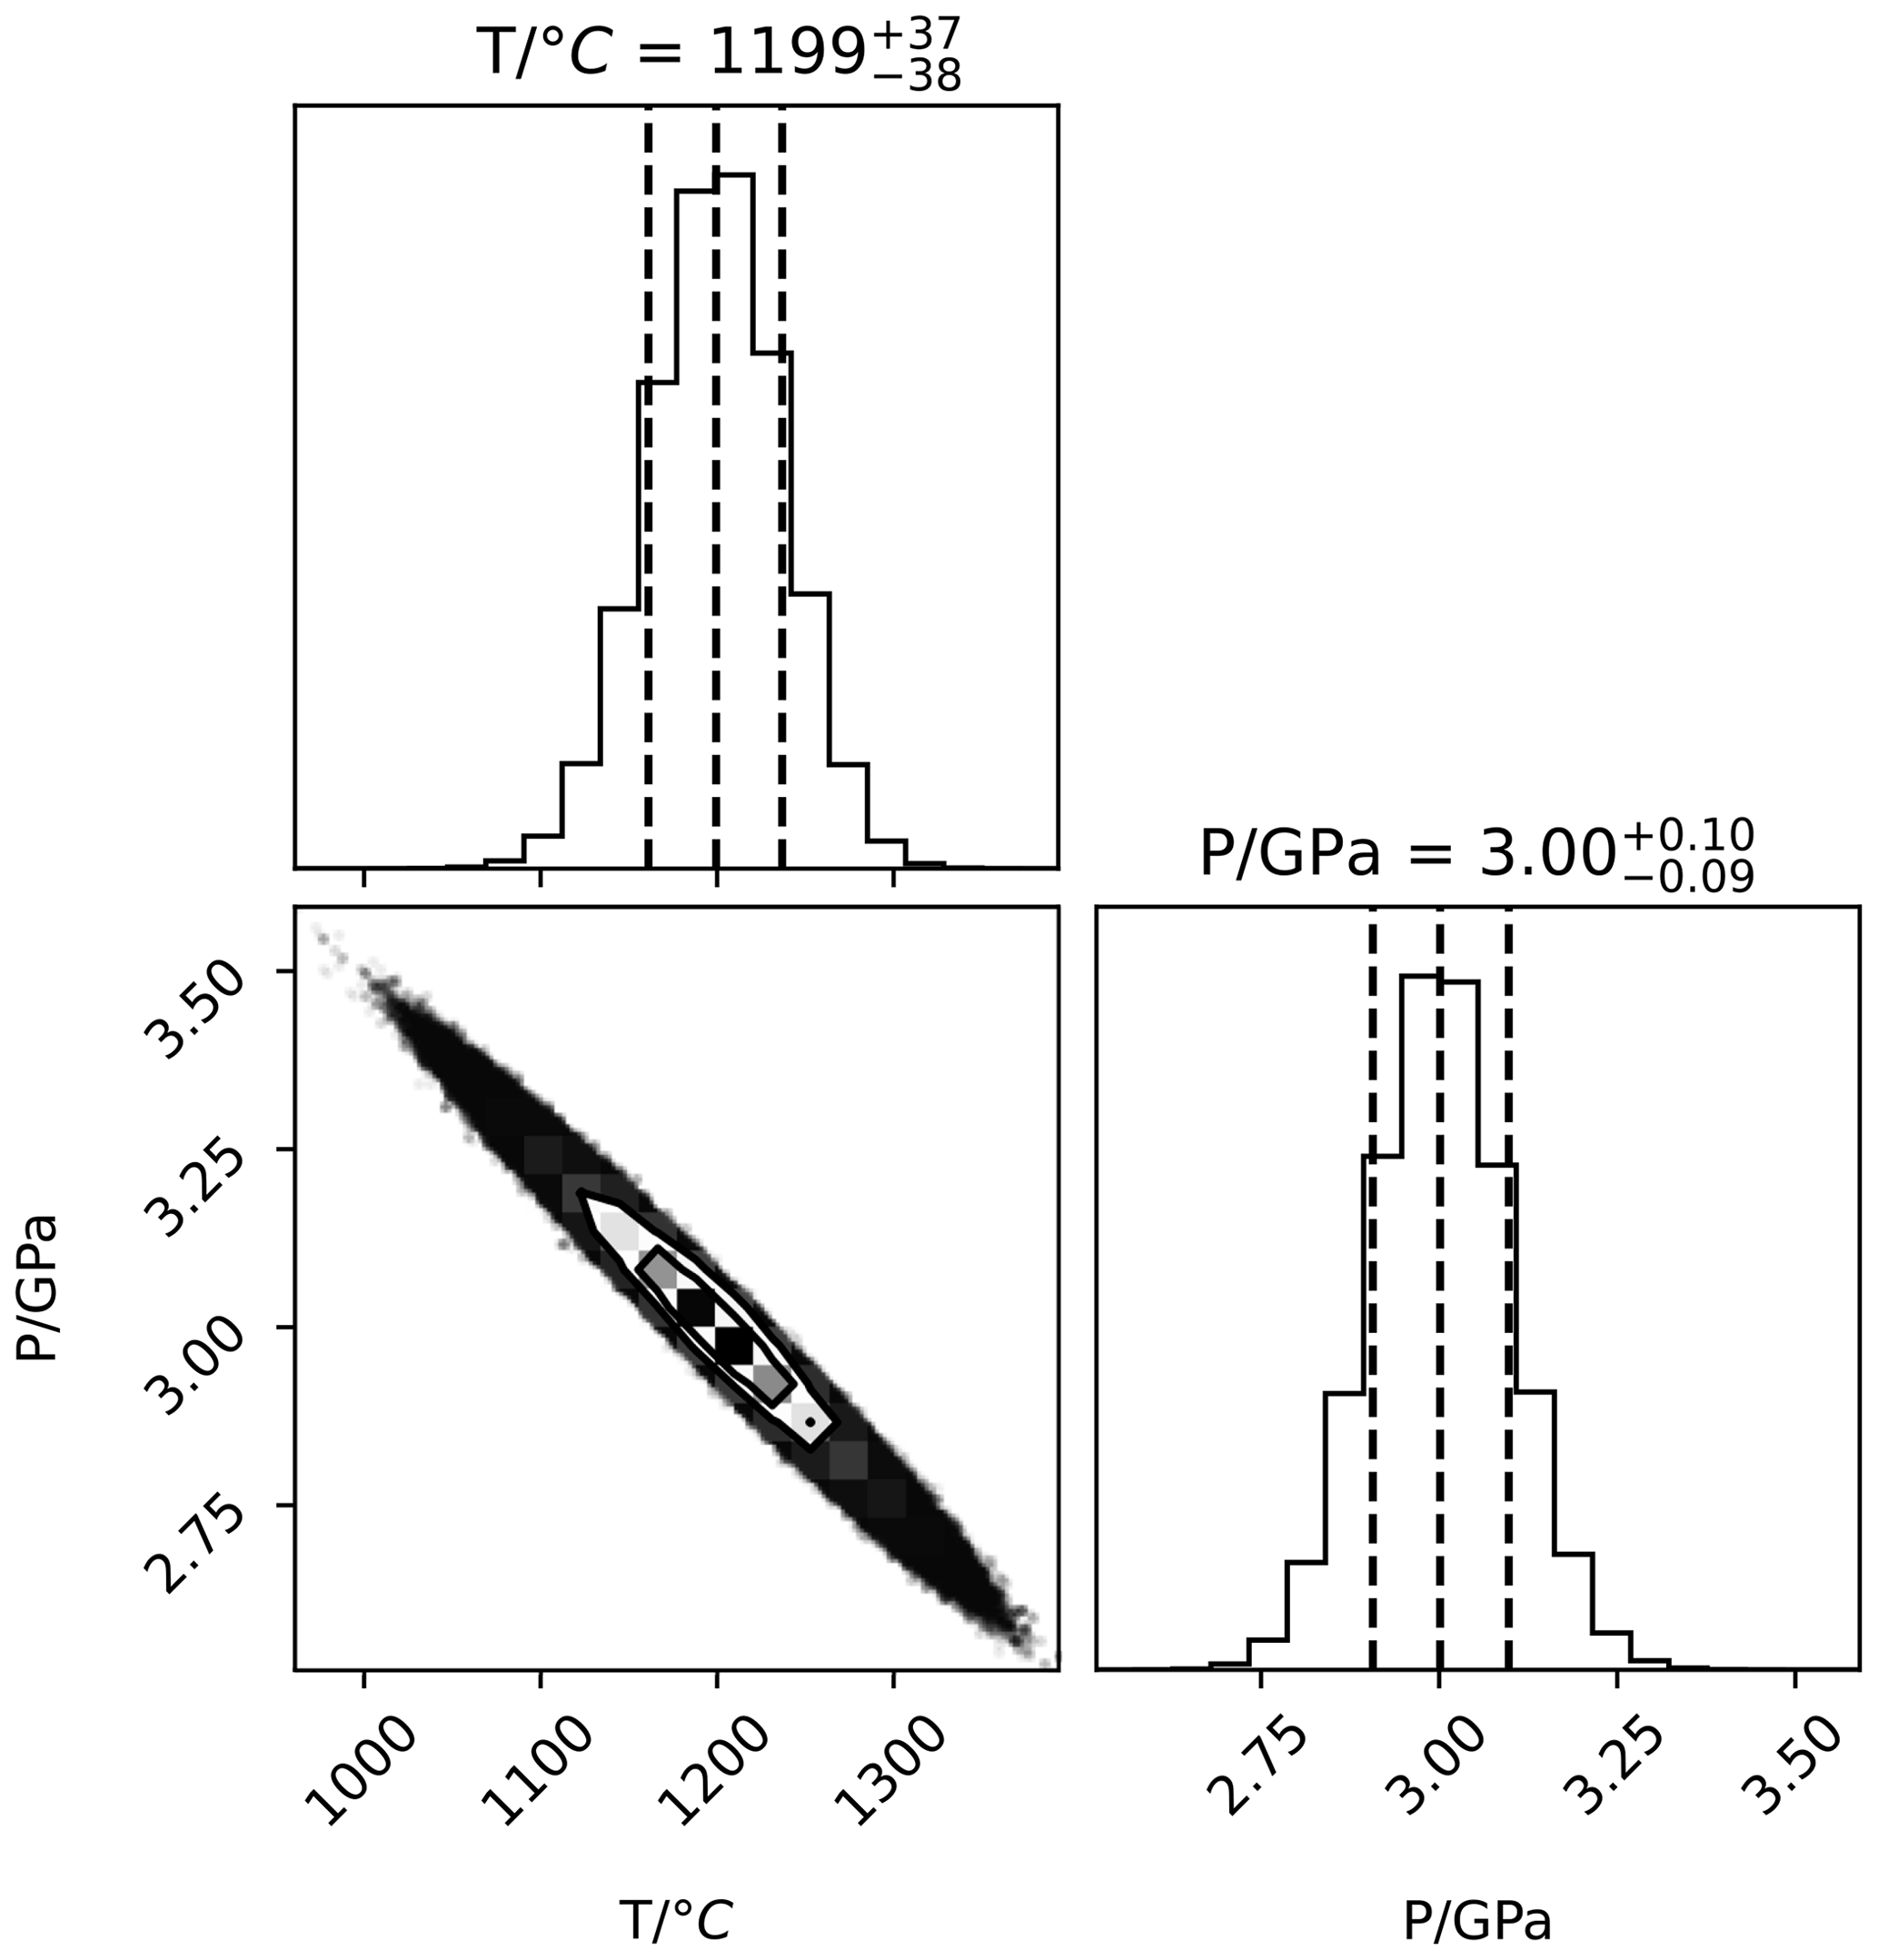
Figure 2Plot of covariance between uncertainty in pressure and temperature when both parameters are fit simultaneously from rock salt and wurtzite composition using the thermodynamic model, calculated using a Markov chain Monte Carlo model.
3.1 Quartz/coesite bracketing experiments
Experiments bracketing the quartz–coesite phase transition were conducted using the in. NaCl–graphite–MgO (Pyrex-free NaCl) assembly in both piston-in and piston-out experimental routines. Single multi-well Ag capsules were used in the 800 and 1000 °C series and three Pt capsules for experiments at 1200 °C. Experimental routines were kept consistent, as described above. For piston-out experiments, movement of the piston outwards was verified by reviewing the logged values for piston position using the Pistonbuddy interface (for further details, see Appendix A).
3.1.1 Nominal pressure analysis
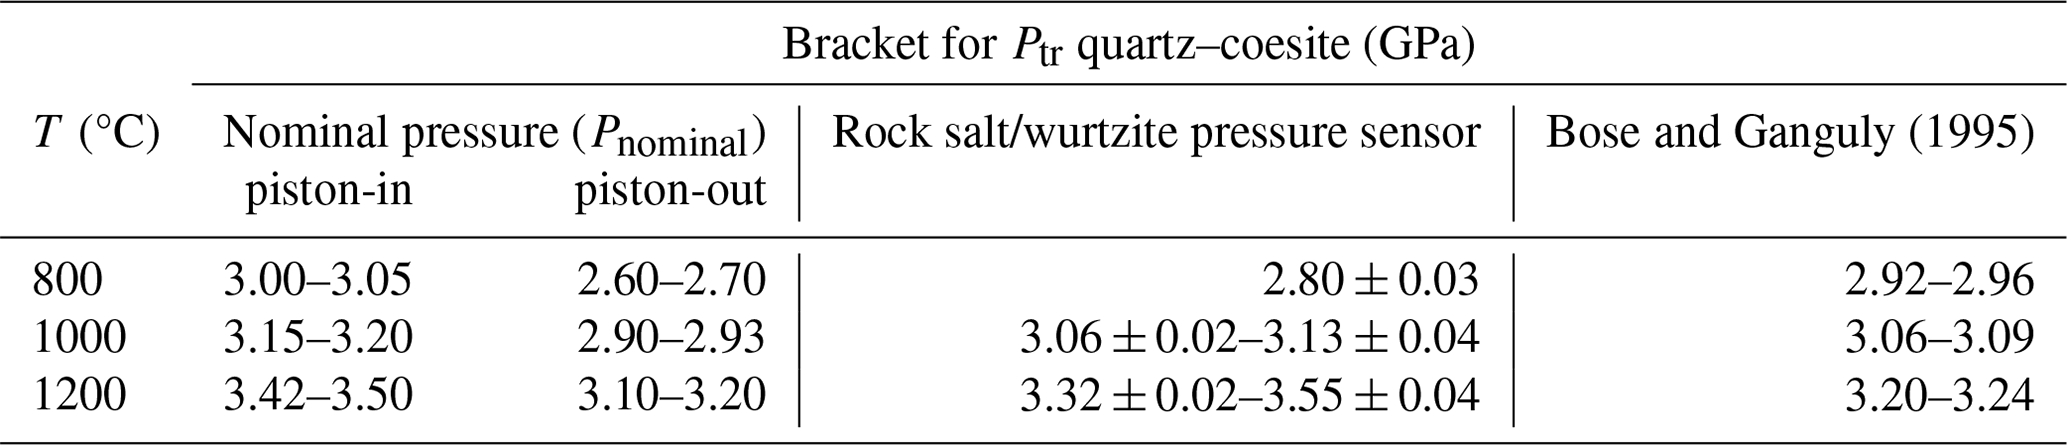
Pressure brackets for the quartz–coesite phase transition were obtained at 800, 1000, and 1200 °C using both piston-in and piston-out methods (Table 1, Fig. 3) and are discussed here in terms of the nominal pressure (Pnominal) of each experiment, as calculated from pressure in the hydraulic system according to Eq. (1).
In some experimental charges, both quartz and coesite were detected by Raman spectroscopy, but with one in much greater abundance than another. In these, the sense of reaction is given by the most abundant phase, with the less abundant phase reported as a minor component. In all experiments, one phase was clearly more abundant than the other, which is evidence of reaction occurring because the starting material was equal parts quartz and coesite by mass, although the persistence of a minor amount of the second phase may be evidence that the conditions of these experiments were close to the phase boundary.
The difference in sample pressure at given nominal pressure is significant, because the nominal pressure at which the phase transition is detected is different in piston-in and piston-out experiments (Fig. 3): in the order of 0.4 GPa at 800 °C and 0.3 GPa at 1000 and 1200 °C. This shows that, at least for the NaCl cells in use at RSES, the assertion that NaCl piston–cylinder cells are frictionless does not hold, as the cell is able to support a pressure difference of ∼ 10 % depending on whether a piston-in or piston-out routine has been used.
Table 1Results of quartz/coesite bracketing experiments, with the calculated pressure and sum-of-squares term from the Excel macro calculator. Brackets are 1 standard deviation and the equivalent propagated uncertainty in the pressure calculation. “Pcalc sum sq.” is a goodness-of-fit statistic; see text.
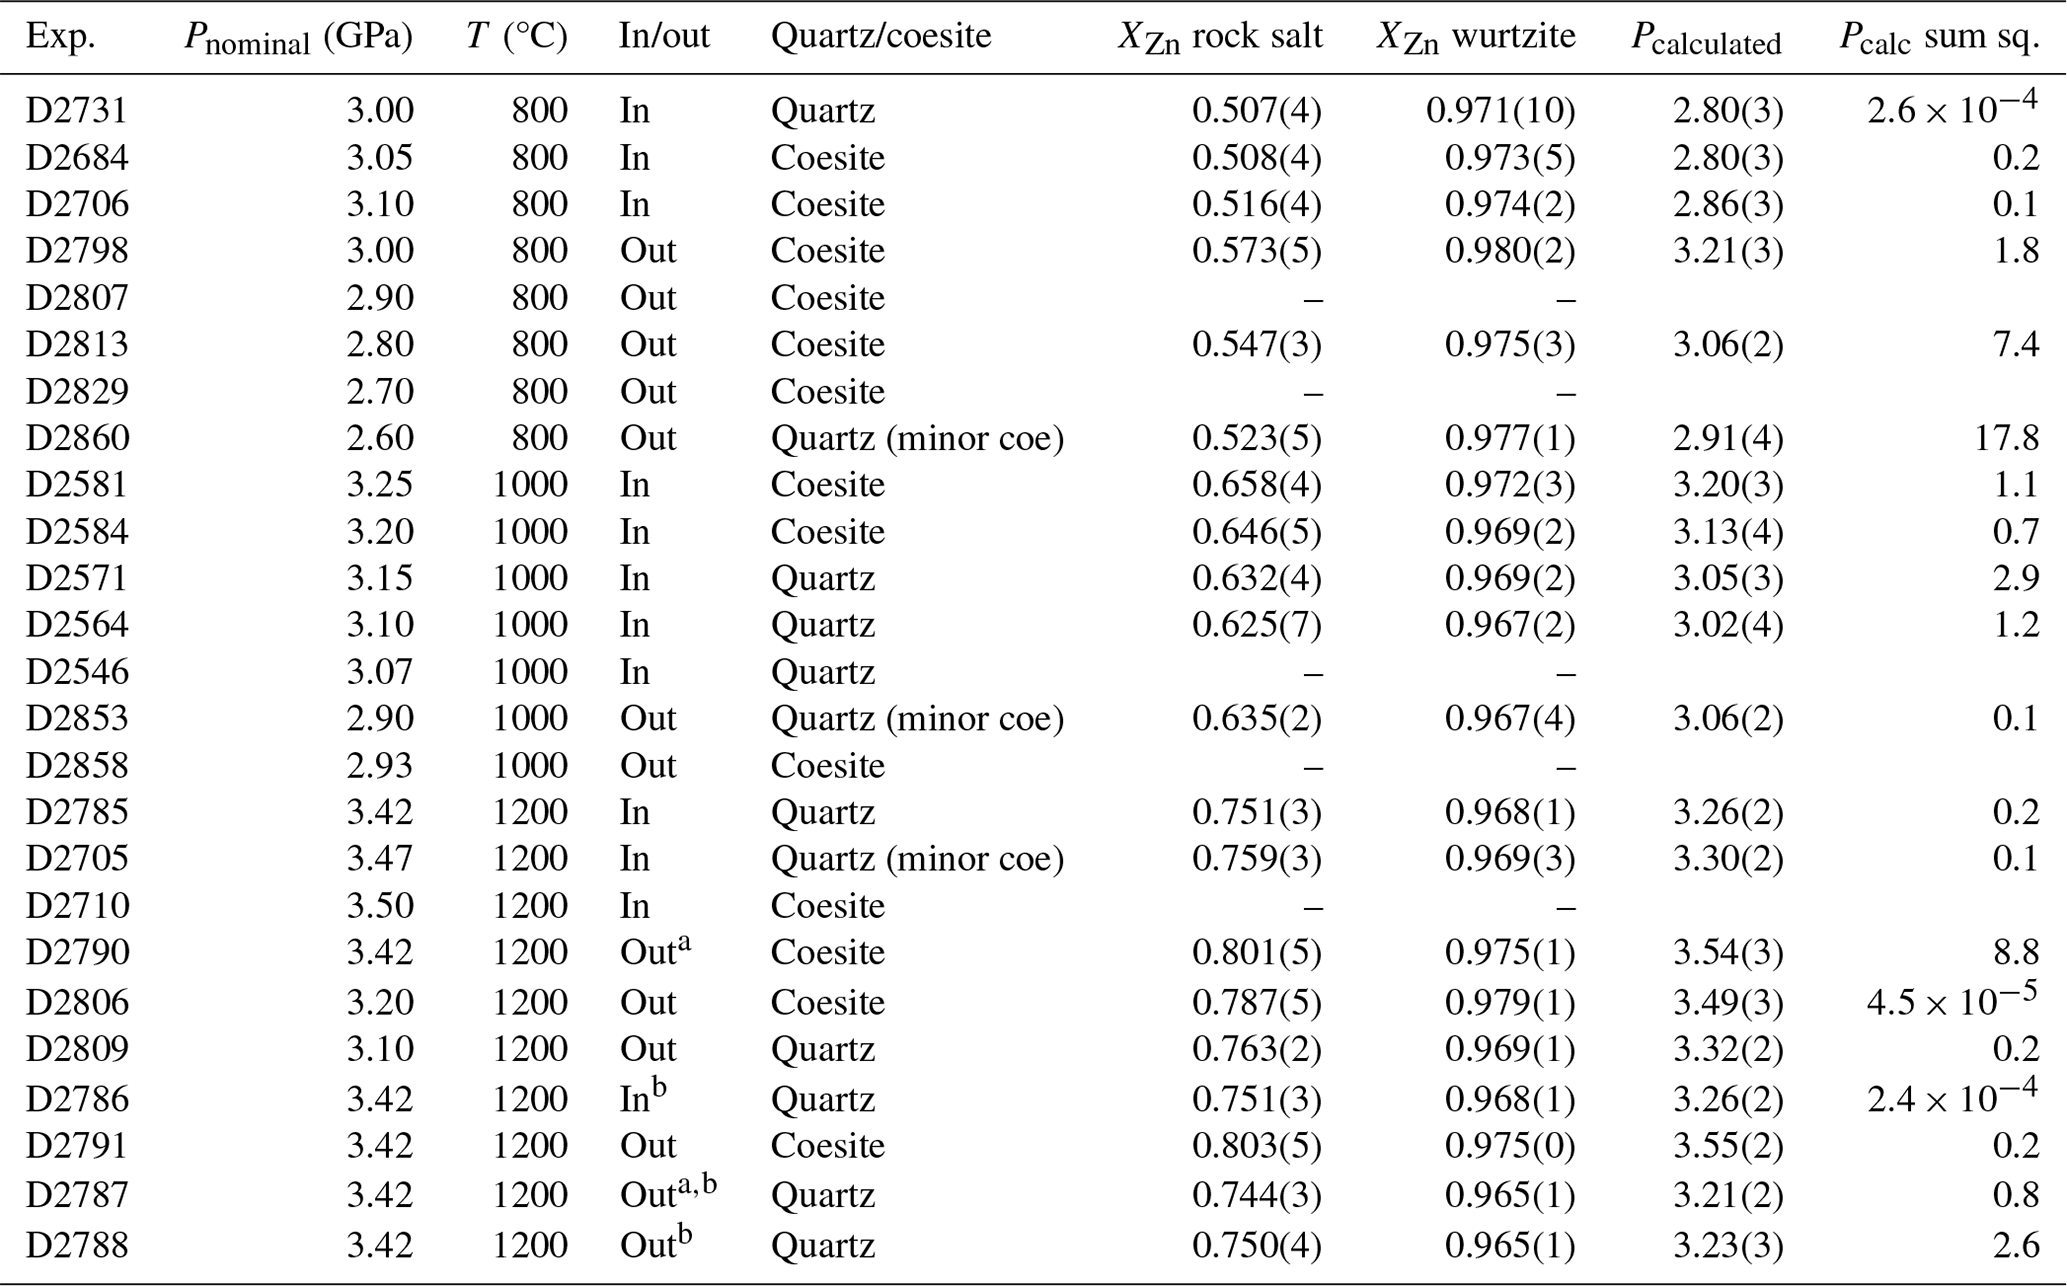
a Denotes piston-out experiments with 0.2 GPa overpressure; all other piston-out experiments have 0.5 GPa overpressure. b Denotes experiments using Pyrex assemblies; all other experiments use Pyrex-free assemblies.
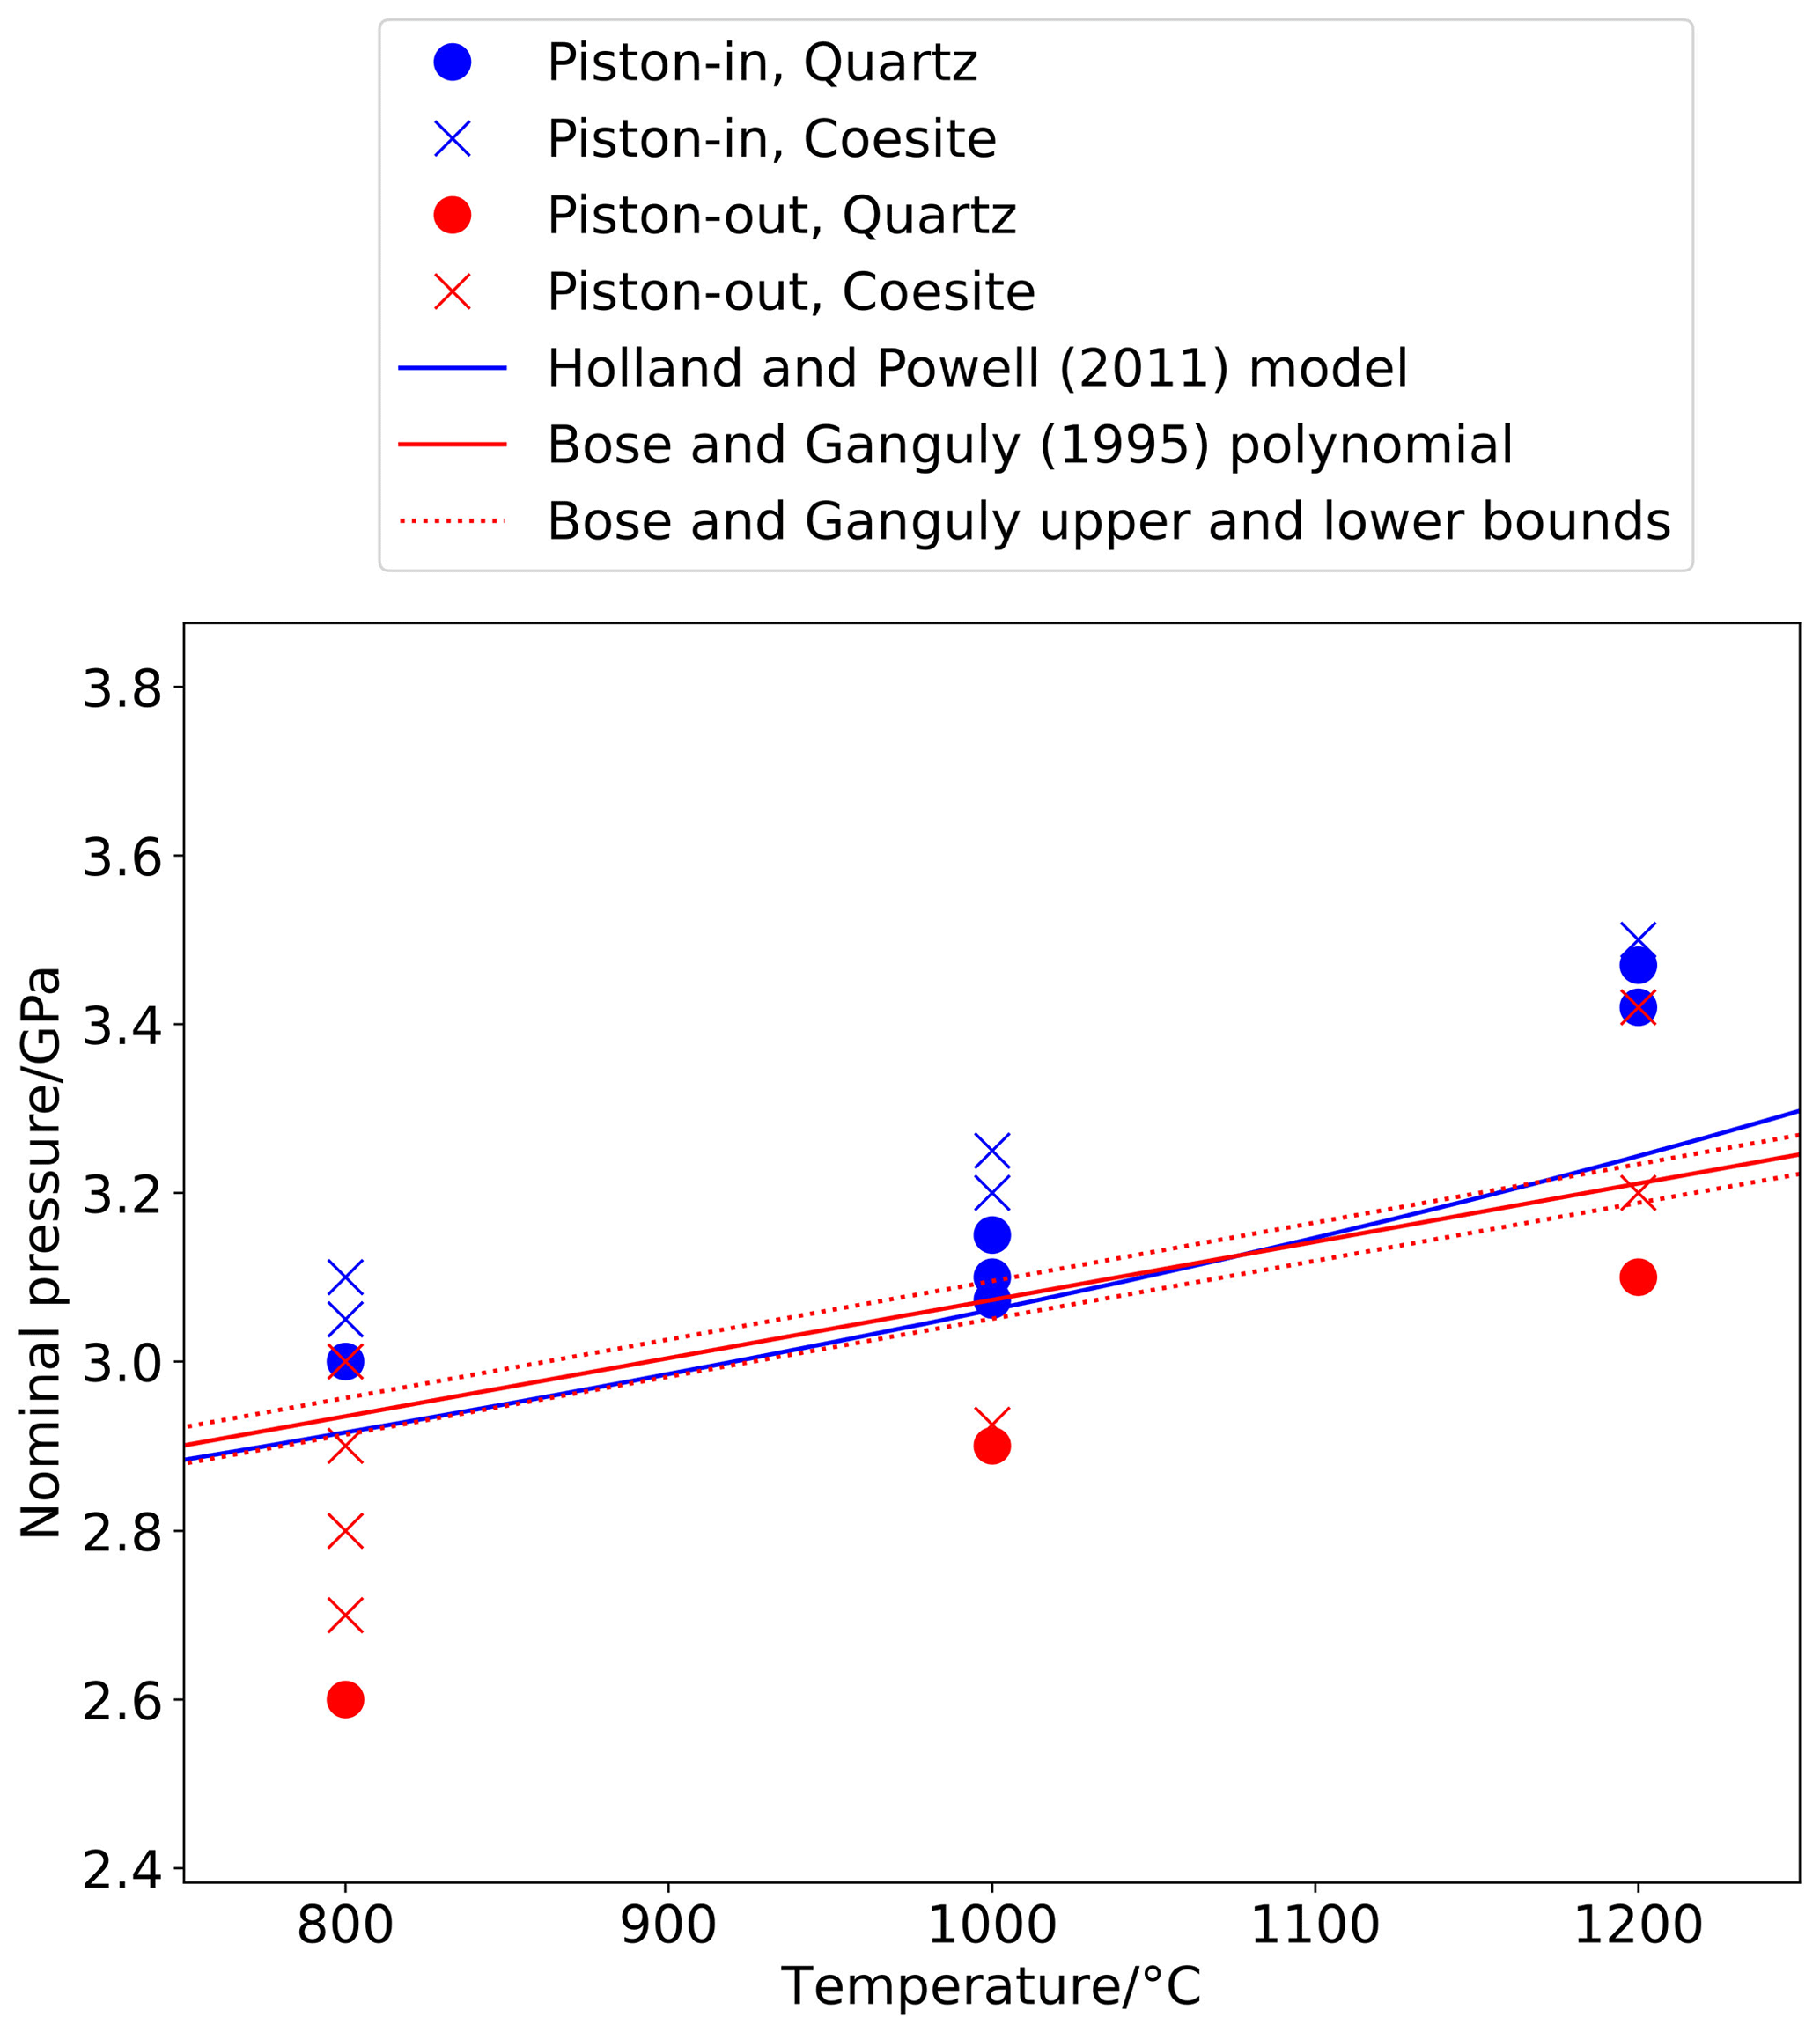
Figure 3Nominal pressure (i.e. uncorrected pressure calculated from hydraulic system pressure) of experiments bracketing the quartz–coesite transition in piston-in and piston-out experiments, showing a ∼ 10 % discrepancy between the two, with canonical values (Bose and Ganguly, 1995) falling in between.
These results can be compared to those of Bose and Ganguly (1995), which are frequently invoked as a calibration standard for solid-media apparatus (McDade et al., 2002; Dasgupta et al., 2004; Frost et al., 2004; Leinenweber et al., 2012). They used a in. diameter assembly and an experimental routine that can be briefly summarized as compressing cold, allowing the assembly to compact and settle overnight, followed by heating and pressure adjustment to the dwell condition, after which all valves in the hydraulic system are closed and Pnominal is allowed to decay during long-duration experiments (50–100 h) with no adjustment. They interpret the final value of Pnominal before the experiment is quenched to be an accurate reflection of Psample.
This experimental routine is a hybrid of piston-in and piston-out methods, so it comes as no surprise that their results fall between the piston-in and piston-out results of this study. The for the transition is markedly steeper in both piston-in and piston-out sets of results presented here than in Bose and Ganguly (1995): at 800 °C their result is similar to that of the piston-in experiments in this study, whereas at 1200 °C it is closer to the piston-out results. Part of this difference may be attributed to the straight line that Bose and Ganguly used to fit the transition in the temperature range 500–1200 °C, although must bend at the inversion in quartz, with greater above this second-order phase transition (Mirwald and Massonne, 1980). Bose and Ganguly consider this in their fitting of the thermodynamic properties of the quartz–coesite transition but not in the polynomial fit to the phase transition. However, comparison to the pressure of the quartz–coesite transition determined using the Holland and Powell (2011) thermodynamic model, itself derived from the data of Bose and Ganguly as well as the earlier studies of Bohlen and Boettcher (1982) and Gasparik (1984), but taking into account the α/β transition through a model following Landau (1937), indicates that there is greater difference between these results and those of Bose and Ganguly than just the transition.
3.1.2 The MgO–ZnO pressure sensor
Comparison of the rock salt and wurtzite phases in piston-in and piston-out experiments also shows the offset between piston-in and piston-out experiments and allows for more precise quantification. Not all experiments are present in the rock-salt–wurtzite dataset, because, due to the small size of the samples, some were plucked out during polishing and lost.
Combining calculated pressures from piston-in and piston-out experiments (Fig. 4) yields results from which the pressure of the quartz–coesite transition can be bracketed using calculated pressures, with no reference to the nominal pressures of the experiments. At 800 °C, the calculated pressure of the piston-out experiment with quartz (D2860: 2.96 GPa) is slightly higher than the lowest-pressure piston-in experiment with coesite (D2684: 2.80 GPa), with s(P)=0.004 and 0.003 respectively. However, when the weighted sum of squares from the thermodynamic model calculation is considered, the rock salt and wurtzite composition from D2860 returns a value of 17.8, indicating a far worse fit to the thermodynamic model than D2684 (weighted sum of squares = 0.2). This value can be treated as a test of the reasonableness of the input values, with an average value of 2 expected. Values greatly in excess of 2 suggest either disequilibrium (most likely in experiments at low temperature ≤ 800 °C), equilibration at a temperature other than the desired experimental temperature (possible in piston–cylinder experiments with a complex pressure–temperature path such as piston-out experiments), or highly inaccurate chemical analytical data (very unlikely, especially when using an EPMA).
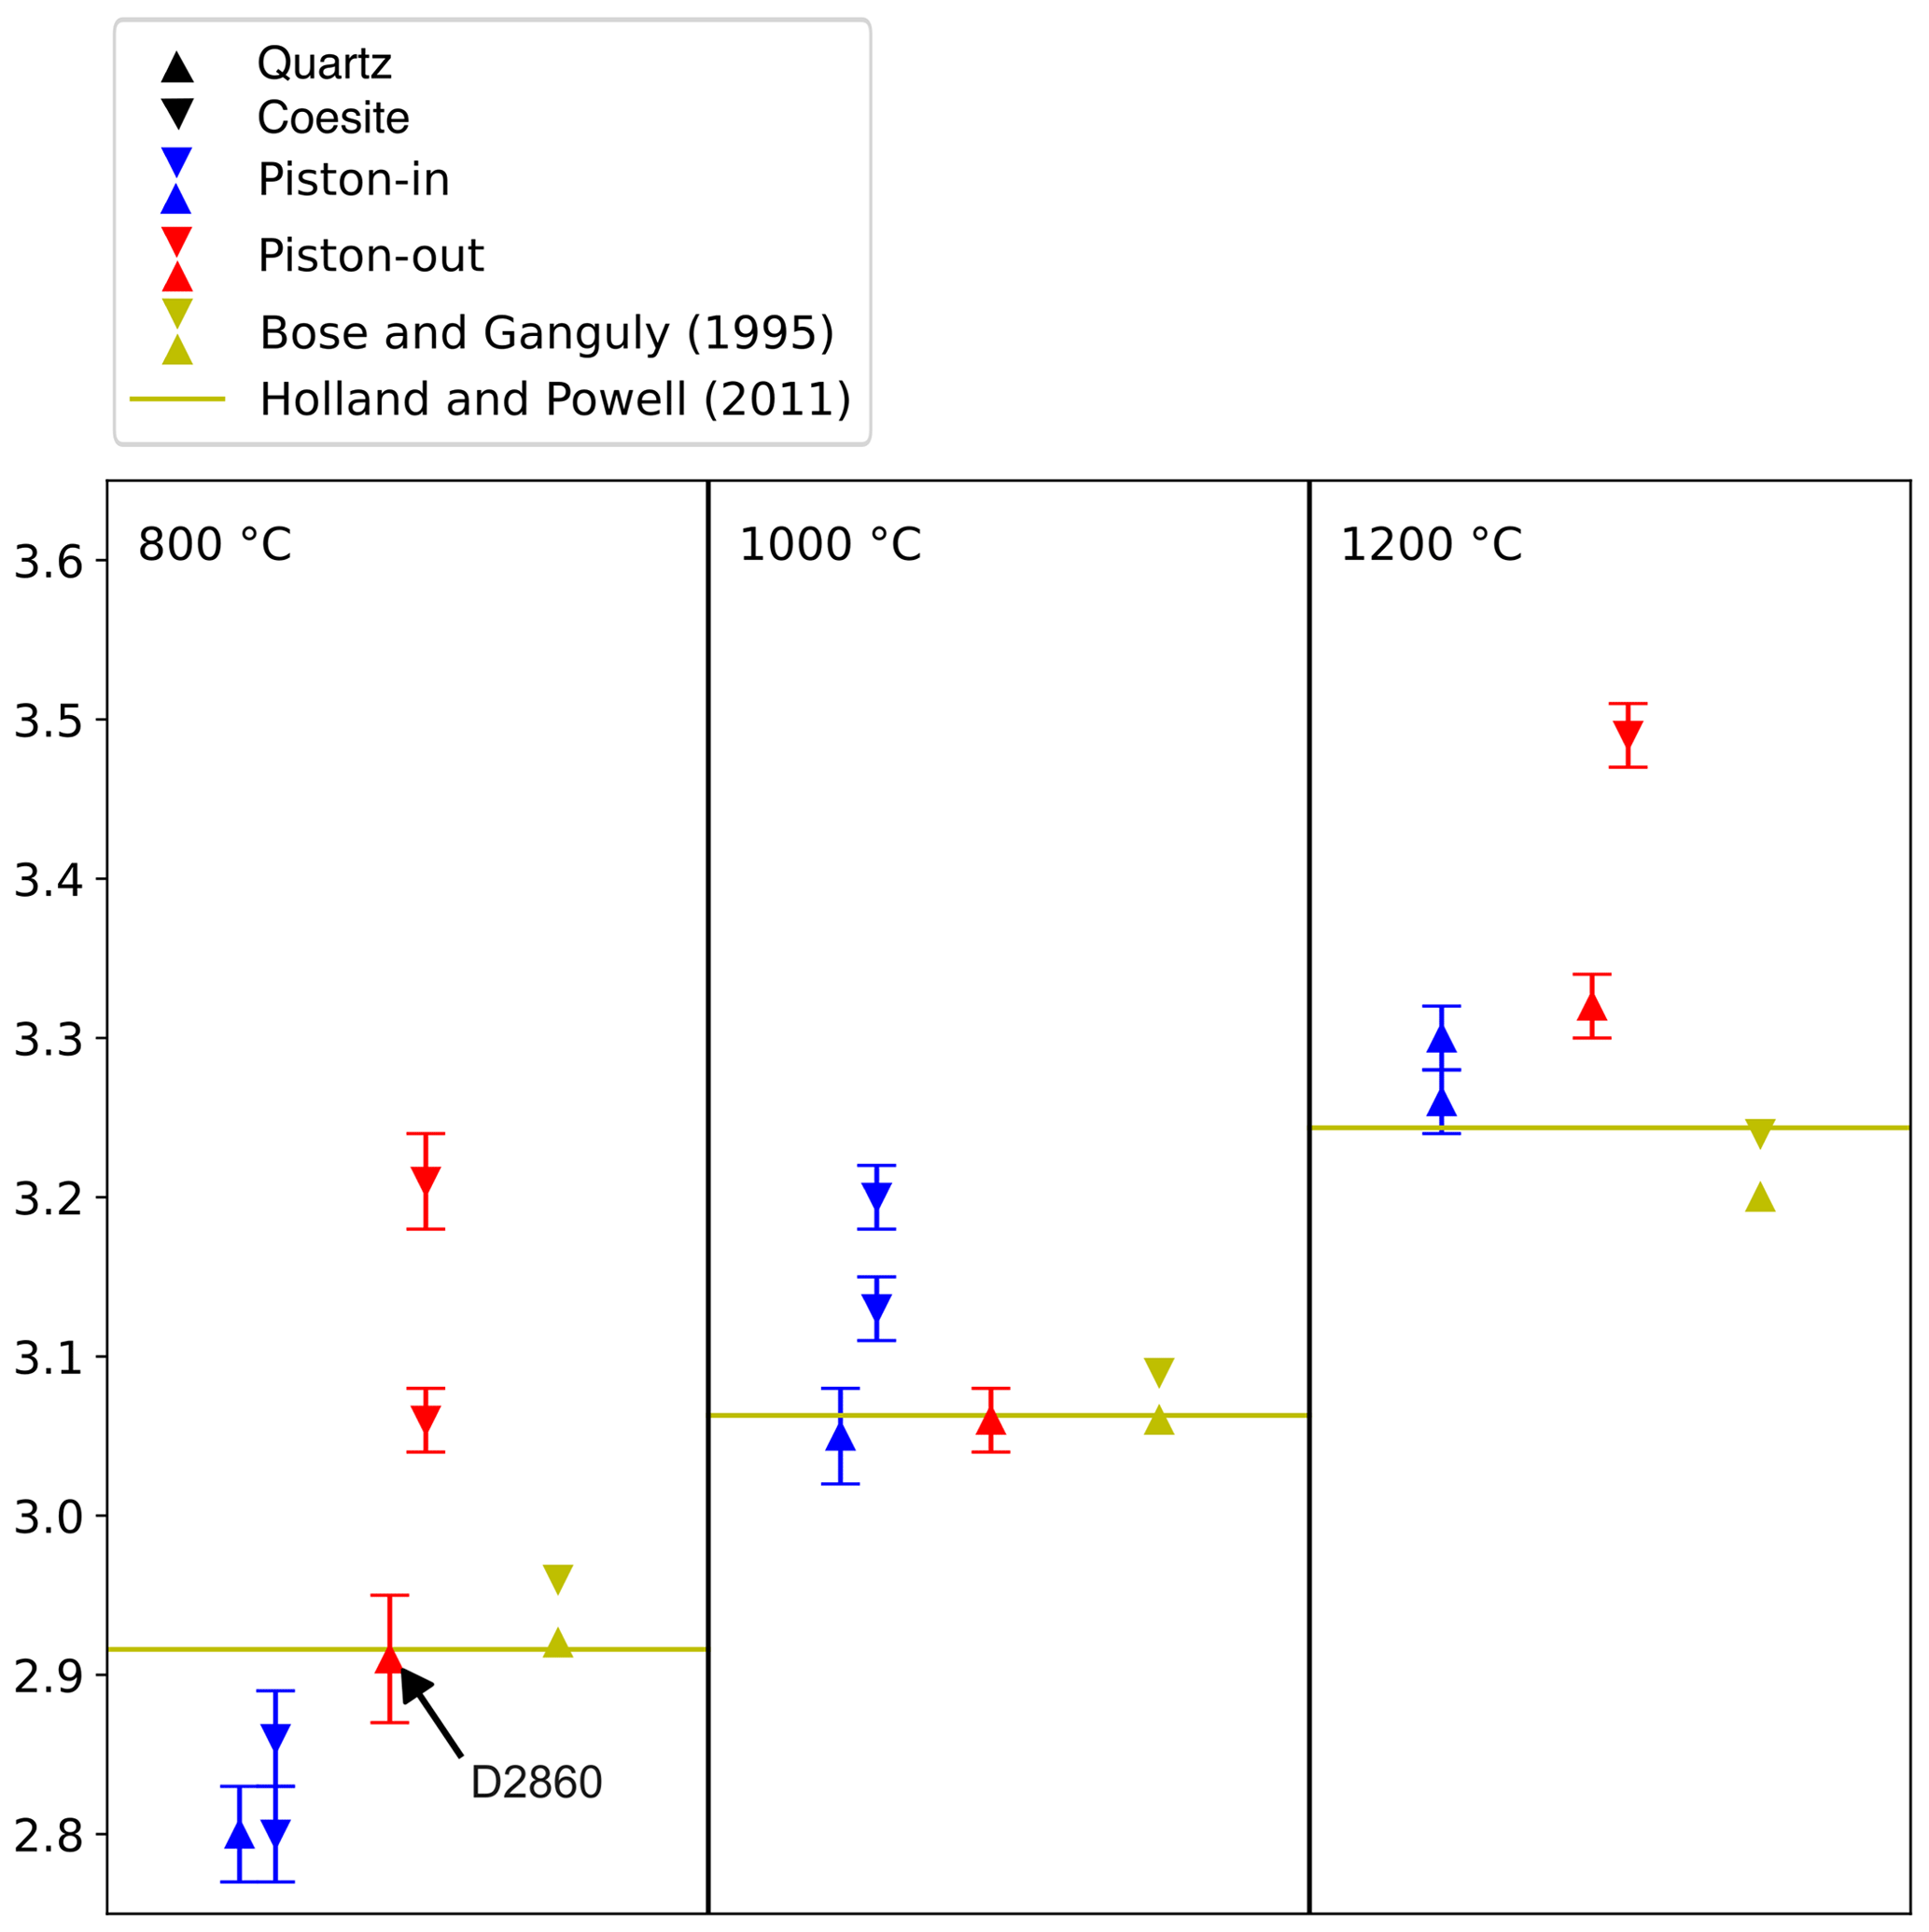
Figure 4Summary of quartz/coesite bracketing experiments showing pressure calculated using rock-salt–wurtzite for experiments bracketing the phase transition in piston-in and piston-out experiments vs. experimental data from Bose and Ganguly (1995) and the thermodynamic model of Holland and Powell (2011). Bars are 1σ from EPMA analysis, propagated through the pressure calculation macro program. Experiment D2860 is discussed in text.
Because there is lower confidence in the pressure calculated for the piston-out experiment D2860 than in the piston-in experiments D2731 and D2684, the most likely value for Ptr for quartz/coesite is close to 2.80 GPa at 800 °C, approximately 0.1 GPa less than the value calculated using the thermodynamic model of Holland and Powell (2011). The pressure of the quartz–coesite transition determined from a combination of piston-in and piston-out experiments at 1000 °C is between 3.06 ± 0.02 GPa (D2853) and 3.13 ± 0.04 GPa (D2584), identical to both the Holland and Powell model (3.06 GPa) and the experimental results of Bose and Ganguly (1995, their Table 2) of between 3.06 and 3.09 GPa. At 1200 °C these results indicate the pressure of the quartz–coesite transition is markedly greater, between 3.32 ± 0.02 GPa (D2809) and 3.55 ± 0.02 GPa (D2806). By contrast, Bose and Ganguly (1995) report brackets at 3.20 and 3.24 GPa. This suggests that the pressure of the quartz–coesite transition may be between 0.08 and 0.35 GPa greater than reported in Bose and Ganguly (1995). Walter et al. (2002) bracketed the quartz–coesite transition in an in situ experiment at 3.05 ± 0.23 GPa at 1357 °C, which they noted was 0.2 to 0.4 GPa lower in pressure than previous studies, but this observation may be influenced by the significant thermal gradients in multi-anvil experiments in the order of 50 to 150 °C mm−1 (Frost et al., 2004; Leinenweber et al., 2012; Farmer et al., 2020).
These experiments clearly show that piston-out experiments attain higher Psample with the same Pnominal as piston-in experiments. These results are consistent with values of fdetermined for different in. diameter assembly types and experimental routines by Farmer and O'Neill (2023) of +5.3 % for piston-in and −6.1 % for piston-out, but we caution that these corrections are sensitive to the assumed P–T locus of the univariant curve between rs-ZnO and wz-ZnO. These results are also close to the values f for the in. diameter NaCl assembly in piston-in mode determined by Condamine et al. (2022) of 5.4 % and 4.8 % in 24 h experiments at 900 and 1300 °C respectively.
Table 2Pressure of the quartz–coesite phase transition determined using different methods in this study, compared to Bose and Ganguly (1995).
3.1.3 Pyrex-bearing assemblies
Experiments were conducted using Pyrex-bearing (NaCl–Pyrex–graphite–MgO) assemblies at identical nominal conditions to an experiment conducted using the NaCl (Pyrex-free) assembly (D2785: piston-in at 3.42 GPa, 1200 °C). Rock salt and wurtzite equilibrated in a piston-in experiment using the Pyrex assembly (D2786) were identical to the Pyrex-free assembly, showing that the presence of Pyrex in the assembly has no effect on sample pressure over a timescale of 48 h at 1200 °C.
Conversely, piston-out experiments using the Pyrex assembly with the methodology used in quartz/coesite bracketing experiments (D2787, with overpressure of 0.5 GPa at 450 °C) produced rock salt and wurtzite indicating Psample=3.21(2) GPa, identical to the Pyrex-free piston-in experiment (D2785: 3.22(2) GPa), indicating ∼ 10 % lower sample pressure than the comparable piston-out experiment conducted in the Pyrex-free assembly (D2791: 3.57(2) GPa). The implication is that Pyrex-bearing assemblies are not suitable for piston-out experiments but do return identical results to Pyrex-free assemblies when used in piston-in experiments of reasonably long duration. The additional friction may initially be imposed by the greater strength of the Pyrex sleeve below the glass transition of borosilicate glass (∼ 525 °C; Schott Technical Glass Solutions, 2022) but decays during experiments of longer duration. This is borne out by the piston travel during these experiments (Fig. 5): in the Pyrex-free piston-in experiment (D2785) and in the Pyrex-bearing piston-out experiment (D2787) the piston moves inward throughout the experiment in discrete steps which continue after several hours at the dwell conditions. This inward movement has two components: firstly, mechanical compaction of gaps between assembly components and porosity within the ceramic spacer (initially ∼ 30 %) and, then, the removal of vestigial porosity due to constant recrystallization of the MgO ceramic spacer. By comparison, in the Pyrex-free piston-out experiment (D2791), there is a small amount of outward movement of the piston when the pressure is decreased and temperature is increased to the dwell condition, with no further piston movement.
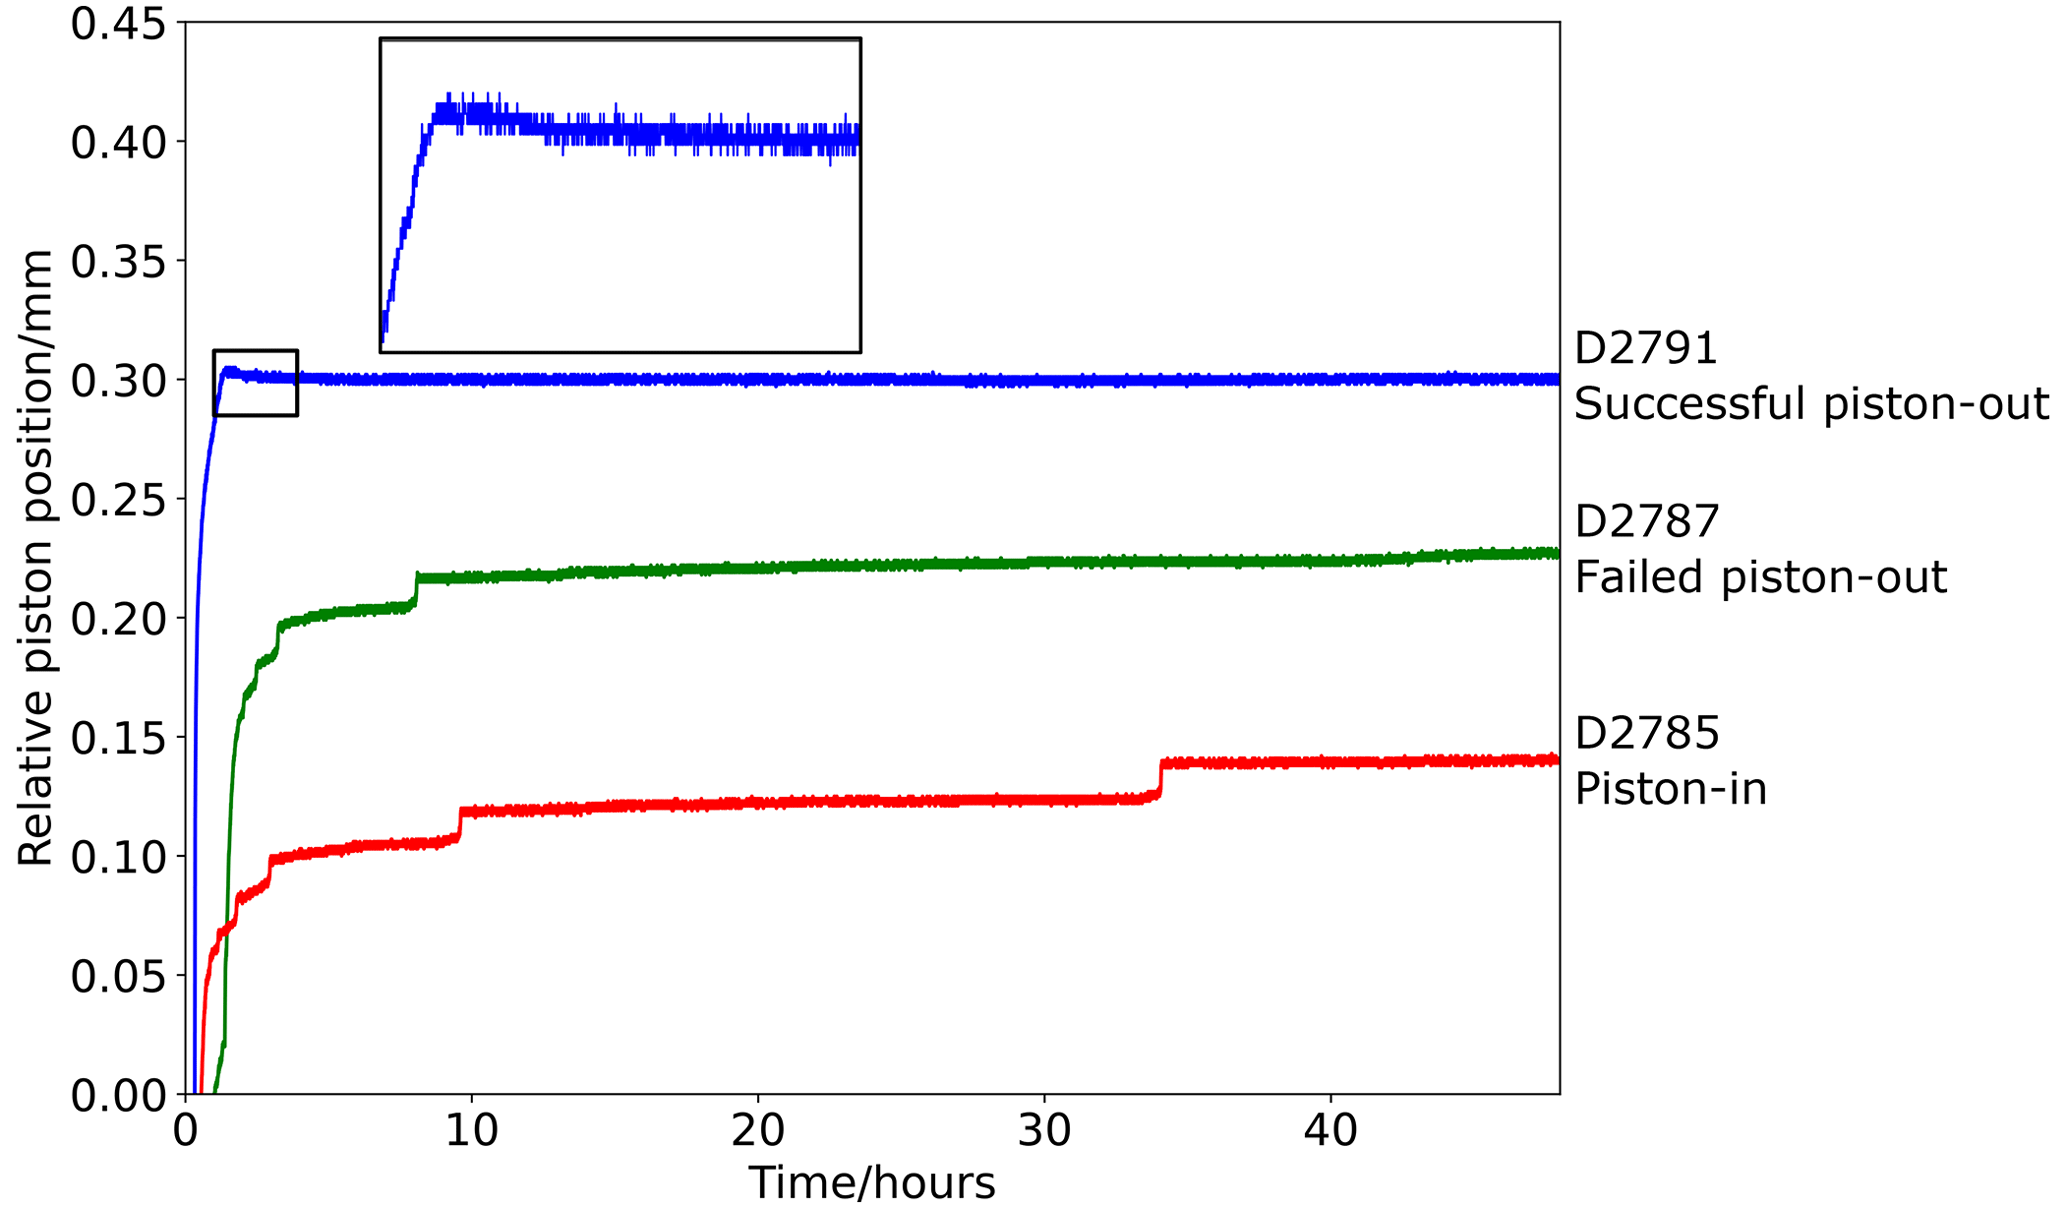
Figure 5Plot of relative piston movement in a piston-in experiment, a failed piston-out experiment using the NaCl–Pyrex assembly (i.e. piston did not move outward and sample pressure is equivalent to piston-in experiments), and a successful piston-out experiment (i.e. piston moved outward; see detail inset).
Even in the attempted piston-out experiment in which no piston movement outward eventuated, pressure in the hydraulic system still needed to be reduced using the bleed valve, which has been considered diagnostic of a piston-out experiment (e.g. Hudon et al., 1994; Klemme and O'Neill, 2000). We contend that the only reliable method for determining whether a piston–cylinder experiment is piston-in or piston-out is to track piston motion, which has been done here with a digital micrometer connected to a data logging system.
3.2 Hysteresis loop experiments
A further test of the relative friction of different piston–cylinder assemblies and experimental routines is to measure piston displacement over successive cycles of compression and decompression. The discrepancy in piston position at given Pnominal approached from a higher or lower pressure, or alternatively the discrepancy in Pnominal at a given piston position approached by intrusion or extrusion, has been referred to as a hysteresis loop (Kim, 1974; Mirwald et al., 1975; Akella, 1979; Bose and Ganguly, 1995).
Experiments were conducted using NaCl–graphite–MgO and NaCl–Pyrex–graphite–MgO assemblies, with piston position monitored during an initial compression to 2.0 GPa Pnominal over 15 min with simultaneous heating to 1000 °C and then during four cycles of compression and decompression between 4.0 and 2.0 GPa at a constant rate of 0.67 GPa min−1, punctuated by 24 h dwells at 3.0 GPa approached from higher and from lower pressure. In terms of the hysteresis loop plot (Fig. 6), this can be thought of as moving anticlockwise through the plotted piston position/nominal pressure space.
The hysteresis loop shows that, at a given Pnominal, the piston will have intruded further into the pressure vessel when that Pnominal pressure is approached from decompression rather than from compression. For example, at 3 GPa Pnominal, the relative piston position approached from compression in the second and third compression cycles is ∼ 0.1 mm, whereas when 3 GPa Pnominal is approached from decompression, the relative piston position is ∼ 0.85 mm. This provides clear confirmation of significant friction in the piston–cylinder assembly, otherwise the piston position would be identical between compression and decompression. The magnitude of the hysteresis loop in the piston-position axis is greater for the NaCl–Pyrex–graphite–MgO assembly than for the NaCl–MgO assembly, suggesting greater friction in the NaCl–Pyrex–MgO assembly. Moreover, the Pyrex assembly is significantly more compacted (> 0.1 mm) in the second and third loops than after the initial compression to 4.0 GPa, whereas the NaCl–MgO assembly is fully compacted after the initial compression.
This difference in piston position between the initial compression and subsequent compression cycles shows that mechanical compaction of the assembly is significant. In the hysteresis loop experiments, this compaction is achieved through repeated increases in pressure, but in standard piston-in experiments this can be accounted for by continuous piston movement inward during the high-pressure dwell segments of experiments (e.g. Fig. 5). However, the persistence of significant differences in piston position between compression and decompression shows that mechanical friction persists even when the assembly has undergone mechanical compaction.
The greater initial friction in the Pyrex-bearing assembly may explain why it was more difficult to achieve a piston-out condition in experiments using Pyrex assemblies, although the equivalence of sample pressure in piston-in experiments conducted with Pyrex-bearing and Pyrex-free assemblies indicates that this difference in friction is no longer present at the end of long piston–cylinder experiments.
The piston position after 24 h dwells is significantly different between piston-in and piston-out segments of the experiments, with the magnitude of piston movement during the dwell far less (< 10 %) than the difference between piston-in and piston-out piston positions in both NaCl–MgO and NaCl–Pyrex–MgO assemblies. This is further evidence that friction does not decay to zero in either assembly.
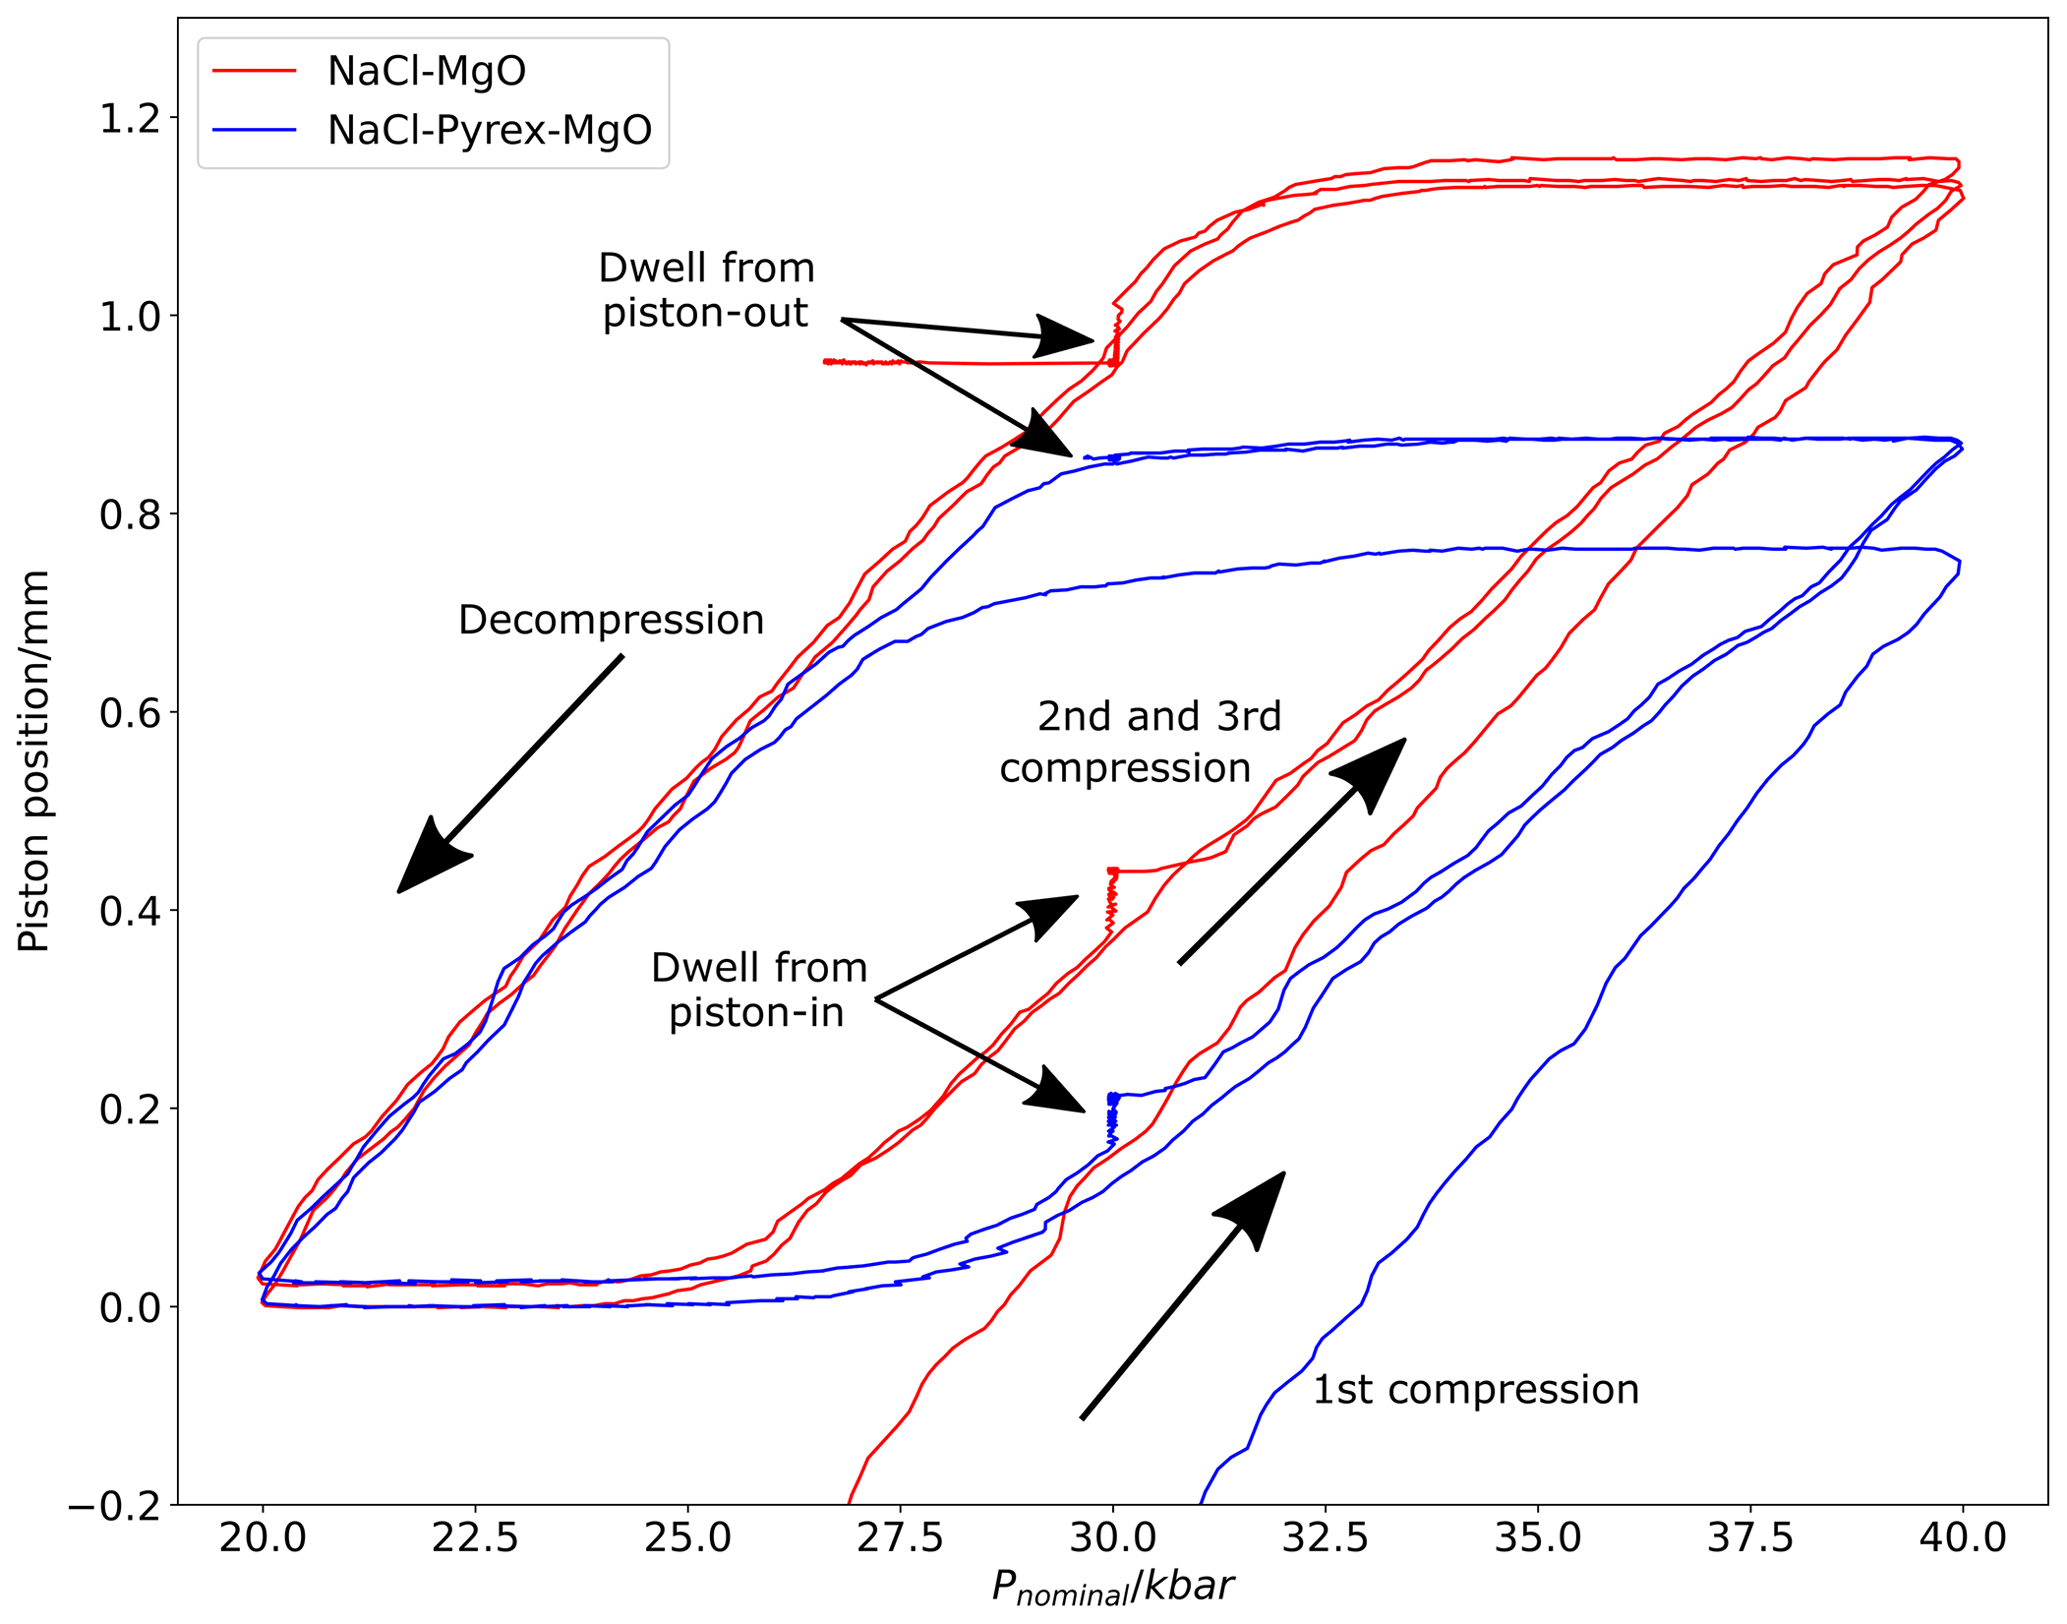
Figure 6Plot of piston position vs. nominal pressure during repeated compression and decompression cycles (i.e. hysteresis loops) using in. NaCl–Pyrex–graphite–MgO and NaCl–graphite–MgO assemblies.
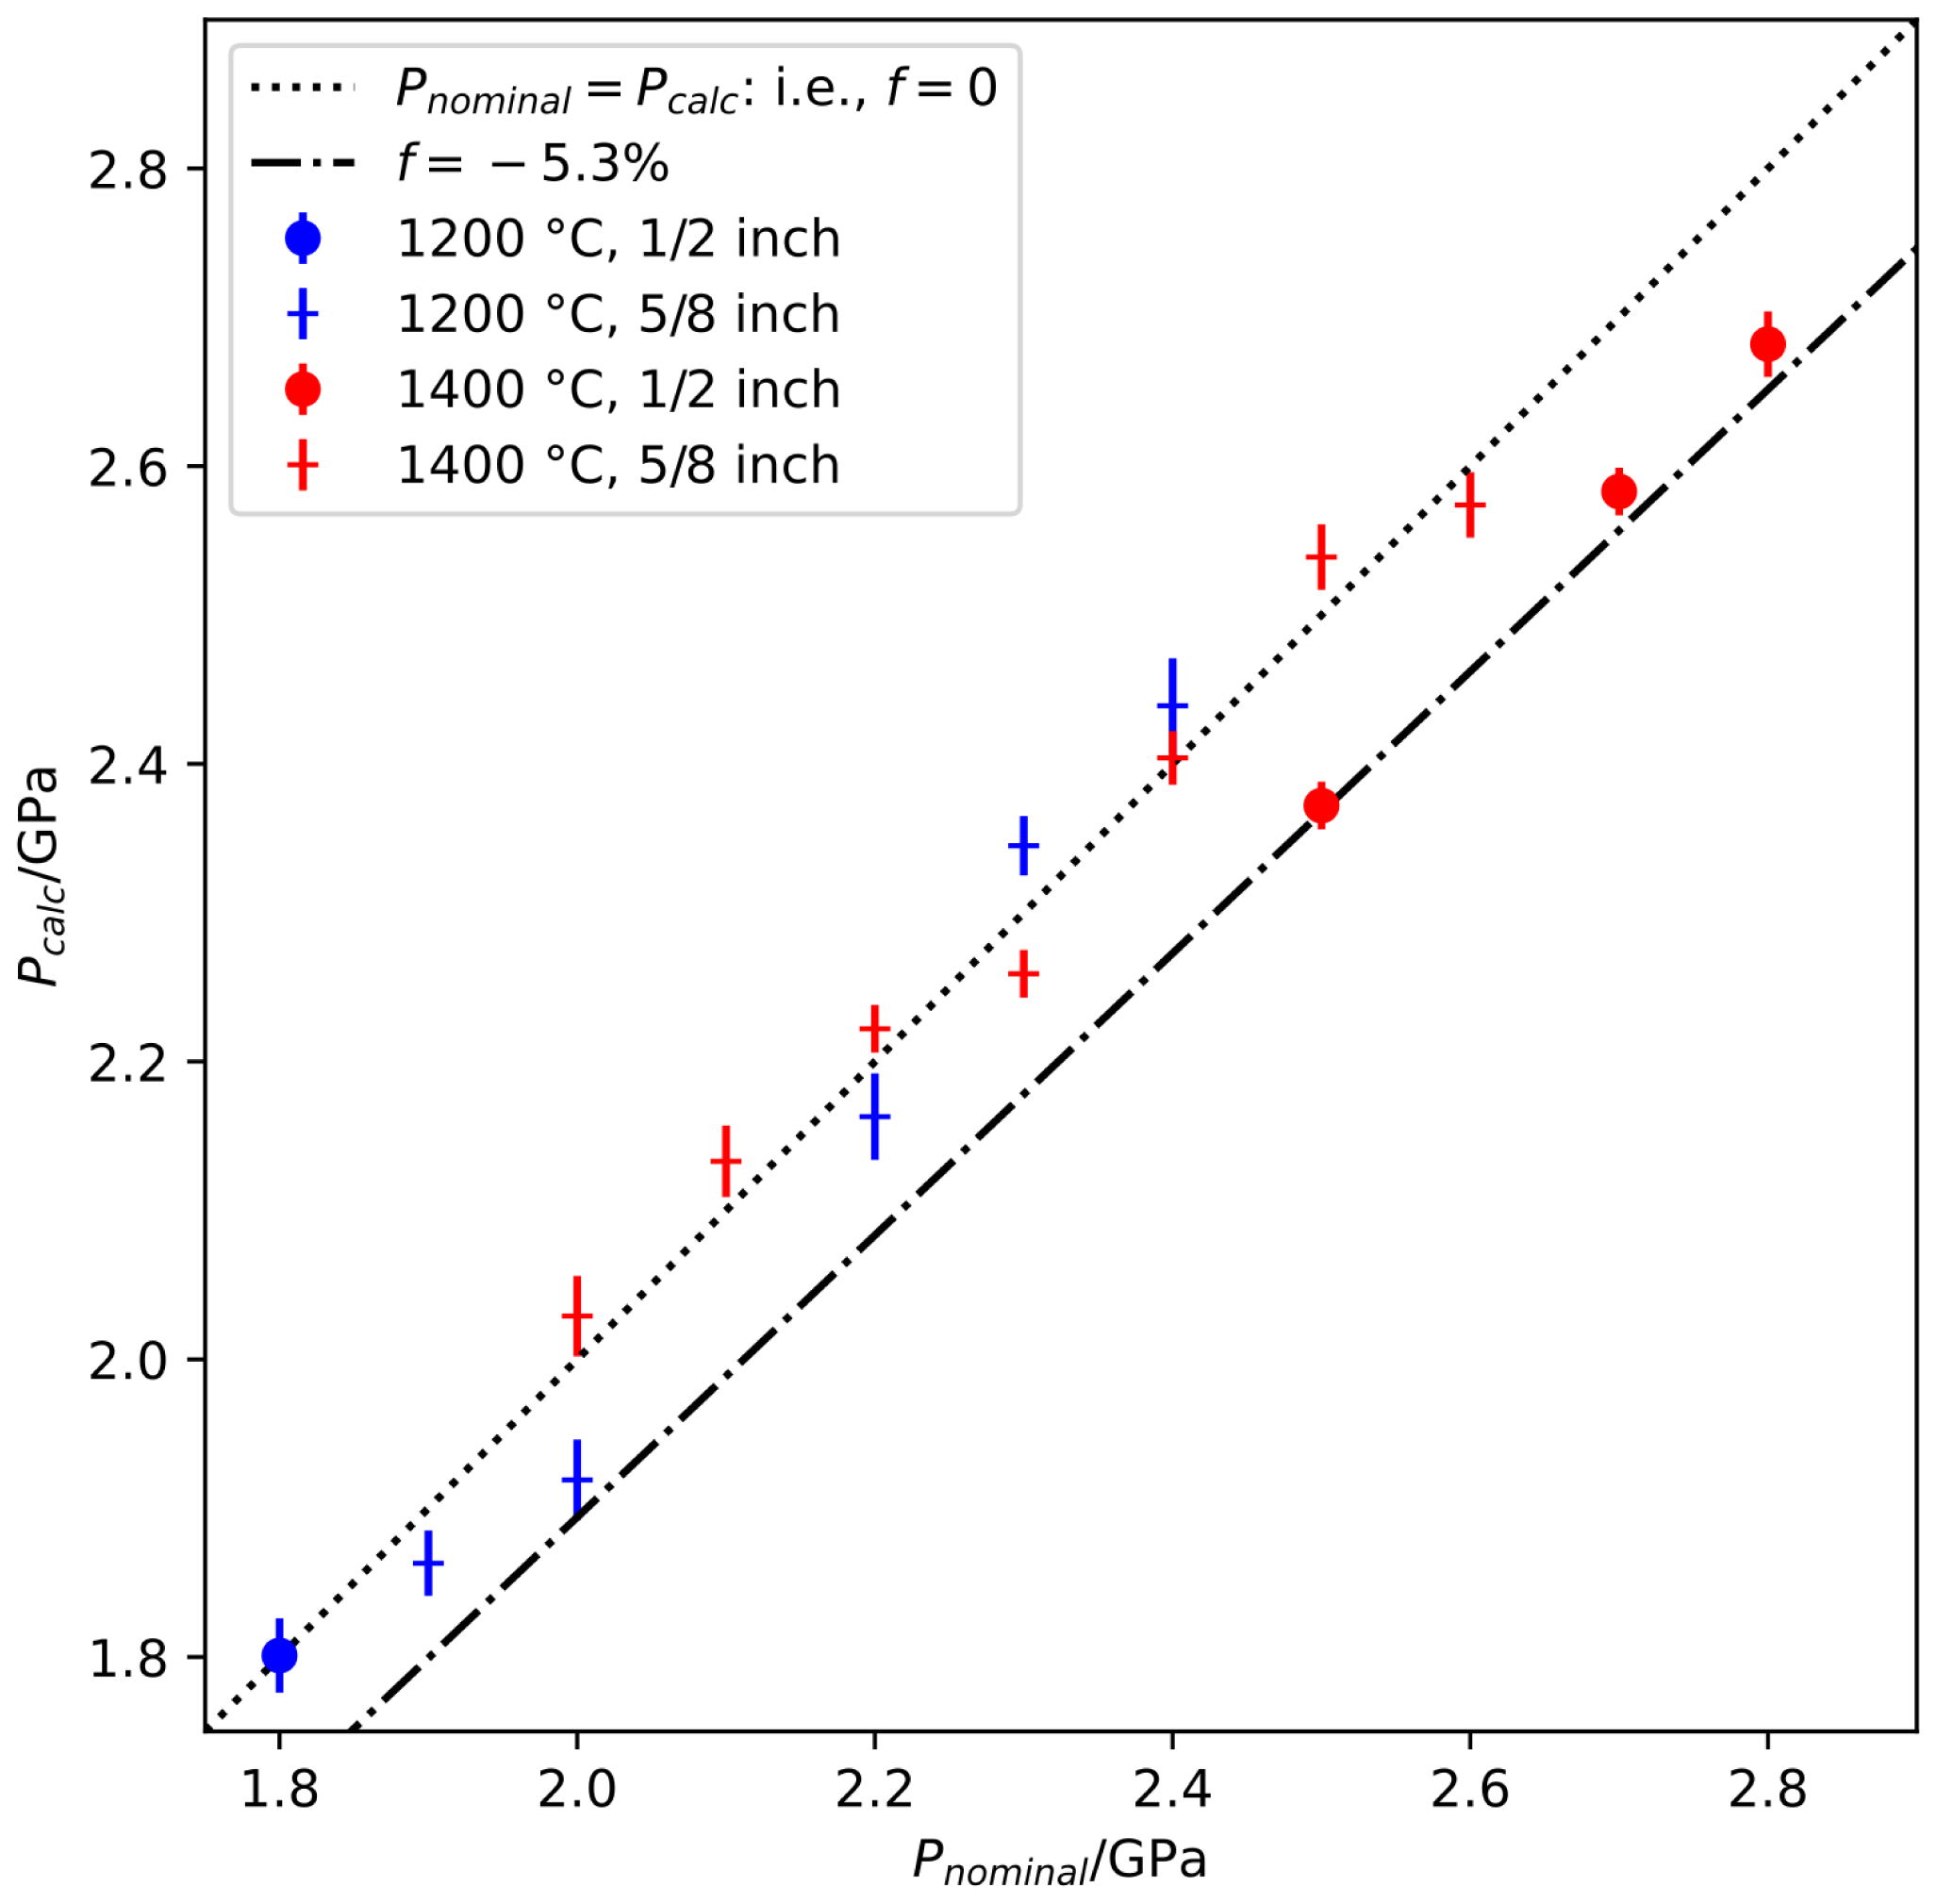
Figure 7Comparison of Psample vs. Pnominal in experiments using and in. diameter assemblies.
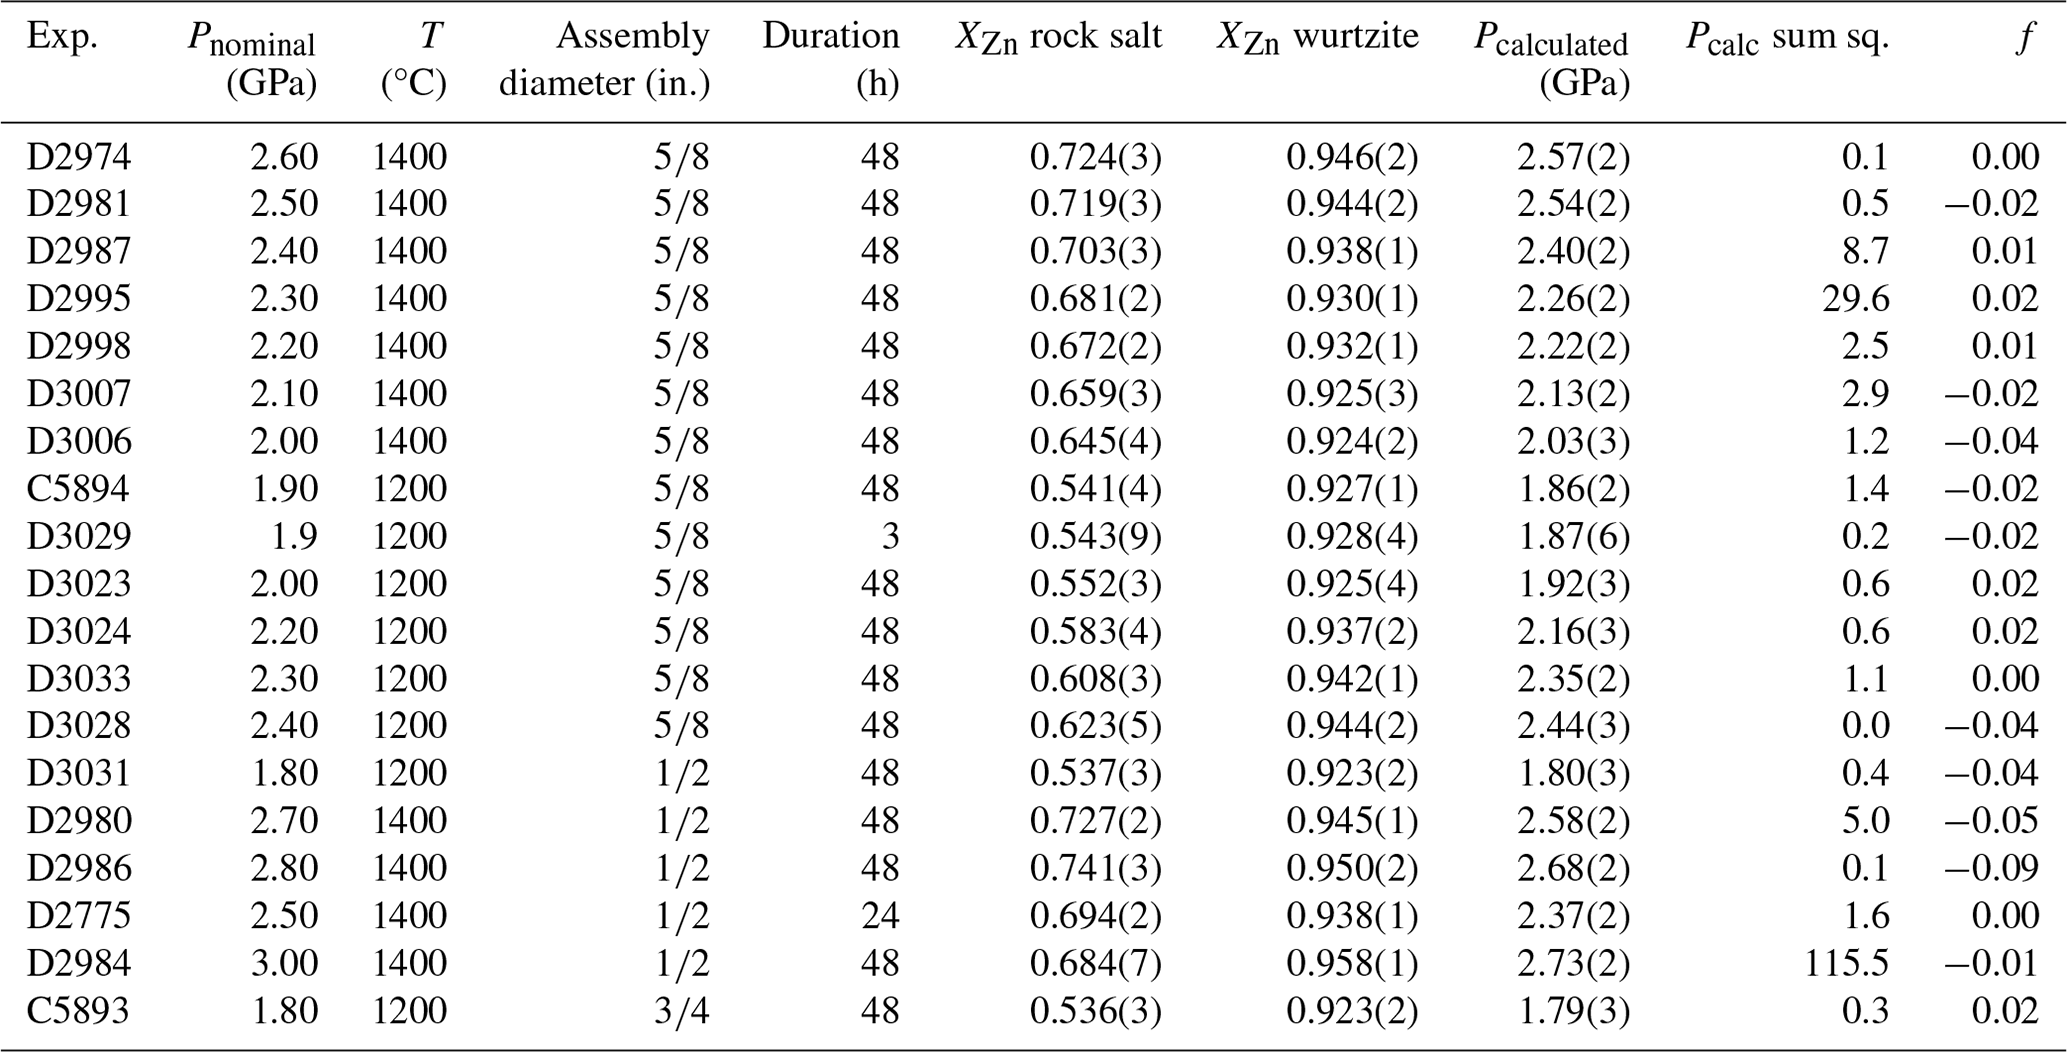
Table 3Experiments conducted using assemblies of different diameter. All experiments using a piston-in experimental routine.
3.3 Assembly diameter
A series of experiments were conducted using piston–cylinder assemblies of , , and in. diameter as part of a study of the spinel-to-garnet phase transition in simplified chemical systems, detailed in Table 3. In this series of experiments, sample pressure calculated using the MgO–ZnO pressure sensor shows that sample pressure is greater in in. diameter assemblies than in in. diameter assemblies, to the extent that f is close to zero. However, a comparison of experiments conducted at the same nominal conditions using in. and in. diameter assemblies (D3031 and C5893 respectively) returned sample pressures that were identical within estimated uncertainty. A similar comparison between in. and in. diameter assemblies using talc as a pressure medium found identical sample pressure (Condamine et al., 2022), with f ∼ 16 % for both assembly diameters. Bose and Ganguly (1995) report a small difference in sample pressure between and in. assemblies using CsCl as a pressure medium less than 30 h into experiments, in the order of 1 % of sample pressure, with convergence of sample pressure between the two assembly sizes after around 33 h.
It is likely that assembly diameter exerts a small influence on sample pressure, but this effect is of far lower magnitude than other factors such as the use of piston-in vs. piston-out experimental routines, or the choice of pressure medium (e.g. McDade et al., 2002; Condamine et al., 2022).
3.4 Temporal stability
Experiments were conducted at identical nominal conditions (1200 °C, 1.90 GPa), using the piston-in experimental routine with the in. assembly, with durations of 3 and 48 h (see Table 3, experiments D3029 and C5984 respectively). The composition of the rock salt and wurtzite pressure sensors in each of these experiments is identical, although the standard deviation of EPMA measurements is greater in the shorter-duration experiment. In both experiments, rock salt and wurtzite crystals were 10–50 µm in size. This shows that the MgO–ZnO pressure sensor equilibrates quickly in high-temperature experiments in high-pressure apparatus – far more quickly than in experiments at equivalent temperature at ambient pressure (e.g. Xia et al., 2016; Farmer and O'Neill, 2023). This result shows that sample pressure does not change between 3 and 48 h in experiments at this temperature, despite continuous piston movement inwards throughout the experiment due to mechanical compaction and recrystallization of the MgO ceramic spacer.
3.5 Thermal gradients
Measuring thermal gradients has been a key part of characterizing the sample environment in the piston–cylinder apparatus. Historically, multiple thermocouples at various locations within the assembly have been used to measure thermal gradients (Boyd and England, 1963; Cohen et al., 1966). From these measurements, thermal gradients in the piston–cylinder are generally thought to be modest, with variation in the order of ∼ 20 °C through the hottest region at the centre of the assembly where a sample would typically be located. This temperature gradient is further attenuated by strongly thermally conductive metal capsules (Hudon et al., 1994; Hack and Mavrogenes, 2006). It has been suggested that the thermal profile of piston–cylinder assemblies is asymmetric, with slightly elevated temperature above the sample, with the hottest point slightly offset from the geometric centre of the assembly (Boyd and England, 1963; Cohen et al., 1966; Hudon et al., 1994; and far more pronounced in Pickering et al., 1998).
Disadvantages of using thermocouples to measure thermal gradients include the limited number of additional thermocouples that can be incorporated into a piston–cylinder assembly and the likelihood of altering the thermal and structural properties of the assembly though the modifications that are required to incorporate the additional thermocouples. Watson et al. (2002) avoided the first of these problems by measuring thermal gradients based on the growth rate of spinel where alumina and MgO are in contact. They used this to measure profiles along linear features (e.g. alumina thermocouple sleeves), but to measure thermal gradients away from existing alumina features they made significant modifications to the assembly, introducing additional alumina, which is much less compressible and shows far less thermal expansion than the MgO that it replaces. The bulk modulus [κ0] for Al2O3 is 254 GPa, versus 162 GPa for MgO, and the thermal expansion coefficients [α0] are vs. (Holland and Powell, 2011, and references therein). This method is also sensitive to volatiles (such as H2O), which are pervasive and of variable concentration in piston–cylinder apparatus and act as fluxes to promote more rapid crystal growth.
The results of Watson et al. (2002) show limited asymmetry, and the hotspot is not significantly offset from the centre of the assembly. In their experiment with a 19 mm diameter assembly at 1400 °C, 1.7 GPa, the temperature 7.5 mm above the thermocouple placed at the centre of the assembly is ∼ 1250 °C, whereas 7.5 mm below the thermocouple it is ∼ 1300 °C (see Watson et al., 2002, their Fig. 10). Watson et al. (2002) also applied their method to a stepped heater, which lessens temperature gradients, and to multi-anvil assemblies, which tend to have precipitously greater thermal gradients.
Computational approaches have also been employed: Schilling and Wunder (2004) used a 3D finite-difference model to calculate thermal gradients in several types of piston–cylinder assembly, some of which were checked using multiple thermocouple measurements. The results suggest that thermal gradients across centrally positioned noble metal capsules are low, and they also suggest that there is a radial temperature gradient within the heater. However, they considered assemblies with CaF2 and NaCl internal spacers rather than MgO: both materials show far lower thermal conductivity than MgO (Stackhouse et al., 2010), which would tend to promote thermal gradients.
The composition of coexisting ortho- and clinopyroxene has also been used to measure thermal gradients in multi-anvil apparatus (Zarei et al., 2018; Farmer et al., 2020). This technique allows the temperature to be measured spatially continuously within the sample region of the assembly but can only be used in the pressure–temperature range in which there is a solvus between ortho- and clinopyroxene. Furthermore, compositional variation due to temperature is strongly variable with temperature: at 3 GPa, dXCa ranges from 0.01 between 900 and 1000 °C to 0.09 between 1300 and 1400 °C (Nickel et al., 1985), resulting in strong variations in precision across the temperature range. Compositional variation across the temperature range is far more consistent in the MgO–ZnO binary system.
We measured thermal gradients in a piston–cylinder assembly by replacing all the MgO ceramic spacers with MgO–ZnO ceramic, as described in the methods Sect. 2.1. This experiment demonstrates the feasibility of routinely replacing MgO with MgO–ZnO in piston–cylinder experiments to record the actual experimental conditions experienced by a sample.
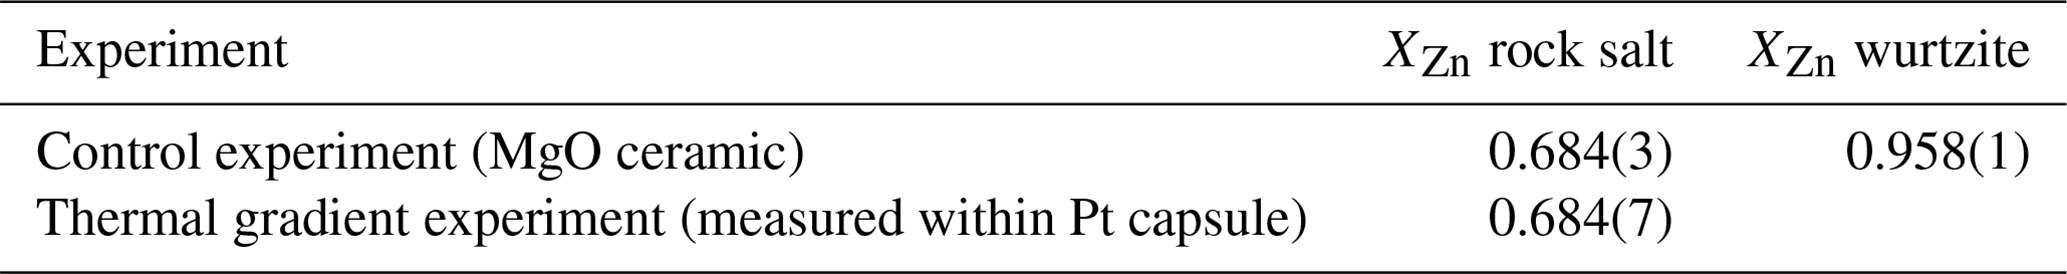
The composition of the rock salt + wurtzite assemblage within the Pt capsule was the same as in the sintered MgO–ZnO ceramic surrounding the capsule, showing that the P–T conditions within and immediately outside the capsule are identical. Furthermore, rock salt and wurtzite run in a control experiment under the same conditions except the standard MgO-bearing in. assembly was also identical within analytical uncertainty, showing that the substitution of MgO–ZnO for MgO did not affect the conditions of the experiment (Table 3). Sample pressure calculated from the rock salt and wurtzite composition is 2.81 GPa, where Pnominal is 3.00 GPa.
Table 4Composition measured by EPMA for rock salt and wurtzite in the thermal gradient experiment with the MgO–ZnO ceramic spacer vs. control experiment using the conventional MgO spacer, both Pnominal=3.00 GPa, T=1200 °C.
QEMSCAN EDS map data were processed in the proprietary Nanomin software (FEI) into an image in which each analysis of rock salt or wurtzite was represented by a pixel with colour on the scale red to white (i.e. values for blue and green channels are 0 to 255, while the red channel for each pixel containing rock salt or wurtzite has a value of 255) representing its composition in the range from Mg0.7Zn0.3O to ZnO. These colour scale data were separated into 48×48 pixel bins, for which average intensity values for rock salt were found by fitting peaks in histograms of the intensity of the green channel in each bin using the Python package “lmfit” (Newville et al., 2014). Bins for which no clear peaks corresponding to rock salt were fit were excluded from the heat map and corresponding temperature profile.
These intensity data were converted to composition through the relationship
where I is intensity of the green or blue channel in the scale 0 to 255. This is a small deviation from the intended relationship between composition and image intensity (), derived from fitting the intensity–composition relationship to EPMA data.
The expected rock salt composition at 100 °C increments between 500 and 1700 °C, at 2.81 GPa pressure, was calculated using the thermodynamic model Excel workbook (see Supplement). A second-order polynomial was fit to describe the temperature–composition relationship at this pressure: . Using these polynomials, temperature was calculated for each 48×48 pixel bin (Fig. 8), and the mean temperature for each row of pixels (i.e. vertical thermal profile) was calculated.
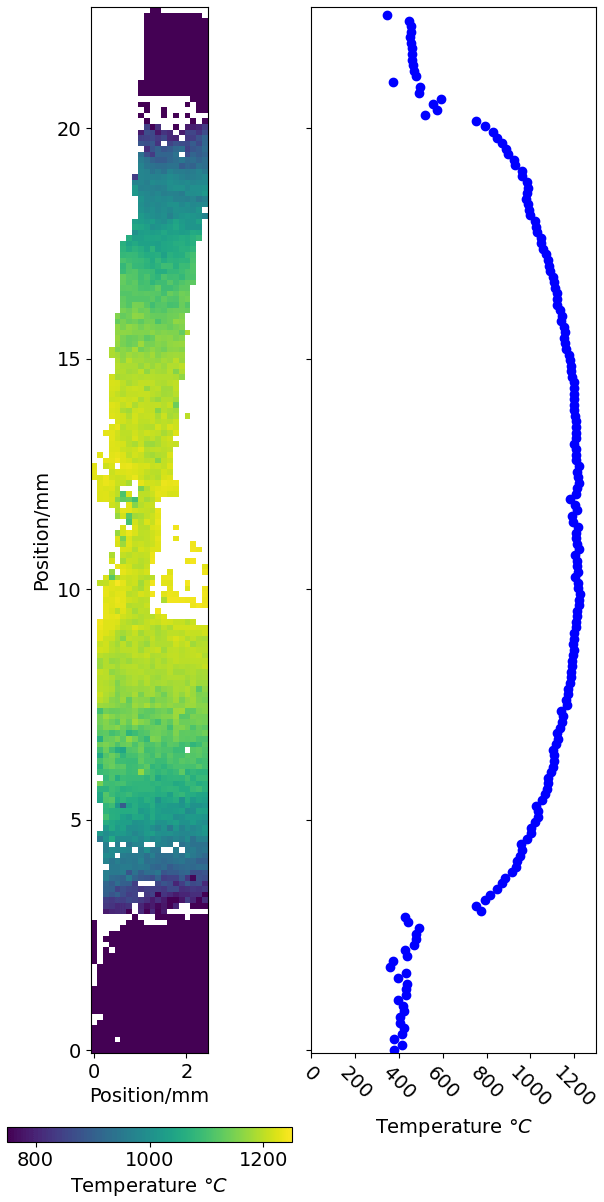
Figure 8Temperature distribution within the piston cylinder, shown as two-dimensional map and as a vertical temperature profile. See text for details.
At the ends of the assembly, the rock salt and wurtzite composition inherits the sintering conditions of the pellets (∼ 1000 °C, ambient pressure), with lower XZn than sections of the assembly that equilibrated at high pressure. The transition from the low-pressure sinter composition to material re-equilibrated at high pressure is sharp, with a step change in rock salt XZn which corresponds to a lower temperature when fit to the T–X relationship at 2.81 GPa (Fig. 8). The lowest temperature recorded in material re-equilibrated at high pressure in this experiment (∼ 750 °C) reflects the temperature limit of this technique in experiments of 24 h duration.
Within the re-equilibrated high-temperature region, the temperature profile is close to flat in the central region of the assembly around the Pt capsule and drops off smoothly away from the centre of the assembly. This suggests that sample temperature in most piston–cylinder experiments, in which capsule materials with high thermal conductivity are used and the capsule length is in the order of 10 % of the total assembly length, is consistent throughout the assembly and identical to that measured by the thermocouple.
No evidence of horizontal temperature gradients within the assembly was observed. This suggests that any lateral thermal gradient that is present must be of smaller magnitude than the sensitivity of this technique (∼ 10 °C), in contrast to the results of some previous studies of temperature distribution in the piston–cylinder (Watson et al., 2002; Schilling and Wunder, 2004).
The piston–cylinder is far from frictionless (non-zero f in Eq. 1), even when cell assemblies containing a large proportion of NaCl are used, with a ∼ 10 % variation in pressure between otherwise identical experiments when different pressure and temperature paths are used. In addition, assembly diameter influences sample pressure. Experiment duration, which had been thought to affect sample pressure (Bose and Ganguly, 1995), was not found to be significant, with no indication that Psample converged with Pnominal in the 24 to 48 h of the experiments of this study.
The effect of using Pyrex within the assembly on f was insignificant in piston-in experiments at ∼ 3 GPa and 1200 °C, but it did influence the piston-out experiments, introducing ambiguity in applying a friction correction. Piston-position monitoring is necessary to determine with any confidence whether a piston-out condition is actually attained. By contrast, piston-in experiments are more internally consistent and reproducible, whether with or without the Pyrex sleeves – far more so than piston-out experiments.
The discrepancy between Psample and Pnominal in piston-in and piston-out experiments using the in. assembly was of nearly identical magnitude but opposite sign (, , respectively) in this study, but numerous differences in the design and materials of piston–cylinder assemblies between laboratories render any kind of correction purporting to be widely applicable for piston–cylinder pressure calibration little more than a guess and do not address the central problem of inter-laboratory discrepancies.
We propose a simple solution to this problem: when the pressure and temperature of an experiment is within the range of applicability of the MgO–ZnO sensor, the ceramic spacer surrounding the sample (commonly MgO) may be replaced with MgO–ZnO ceramic. The proportion of MgO and ZnO in this ceramic must be in the two-phase rock salt + wurtzite field at the conditions of the experiment (see Fig. 4, Farmer and O'Neill, 2023). However, the miscibility gap in the MgO–ZnO binary system is especially wide, and a mixture of 80 mol % ZnO, 20 mol % MgO will adequately cover piston–cylinder experiments up to 3.5 GPa. This will record the P–T conditions of the run, regardless of the wear and tear on the apparatus, or other real-life variables, such as what follows on from changes in the ambient temperature of the laboratory in which the apparatus is housed. This easily implemented advance would enable direct comparison in the sample pressure attained between different laboratories and experimental protocols. Here, we have used this method to show that temperature gradients in piston–cylinder apparatus are minimal when noble metal capsules are used, and we have confirmed that substituting MgO–ZnO for MgO ceramic does not affect the sample pressure in the piston–cylinder.
If a rock-salt–wurtzite standard is routinely included in experiments, then the pressure and temperature conditions actually experienced in the area surrounding the sample capsule can be recorded. Moreover, if the composition of coexisting rock salt and wurtzite phases is reported along with experimental data, the pressure of experiments can be revised as the thermodynamic model of this system is refined. Such refinement may be realized through experiments equilibrating rock salt + wurtzite assemblages with the pressure independently determined using in situ X-ray diffraction (e.g. Beyer et al., 2018). Confirmation of the pressure and temperature of the wz–rs univariant transition in endmember ZnO through in situ monitoring would also be most valuable, as the calibration of Farmer and O'Neill (2023) is quite sensitive to their selection of the results of Kusaba et al. (1999).
A1 Piston–cylinder devices at RSES
New, highly automated 200 t piston cylinder presses developed at the Research School of Earth Sciences of the Australian National University made much of the precise pressure calibration detailed herein possible. In this appendix, some of the key improvements over standard piston–cylinder apparatus are described and presented in simplified schematic diagrams.
A2 Pressure control
Automatic pressure control to within ∼ 0.005 GPa is an important feature of these piston–cylinder presses. The pressure control system is shown schematically in Fig. A1. Pressure in the hydraulic system driving the sample piston is generated using an air-powered pump, which maintains high pressure in a section of the hydraulic system. The pressure in the section of the hydraulic system containing the ram that acts on the piston is controlled by opening values, one of which connects to the high-pressure section containing the air-powered pump, while the other is a bleed valve. This valve system is controlled through a Eurotherm process controller, which outputs a −10 to +10 V analogue signal that actuates the advance (+) or bleed (−) valves.
Control is achieved through a PID algorithm, with readback from a Keller pressure transducer in the hydraulic system. An analogue Heise gauge is also present as a backup to allow the pressure to be checked at a glance. If a sudden (in the order of GPa s−1) change in pressure is detected which would normally indicate a blowout, usually a broken piston or pressure vessel, the system goes into a failsafe mode, where bleed and advance valves are closed, the heater power supply is turned off, a flashing warning light is illuminated, and an audible warning sounded. Before any further operation, the system must be reset by the user.
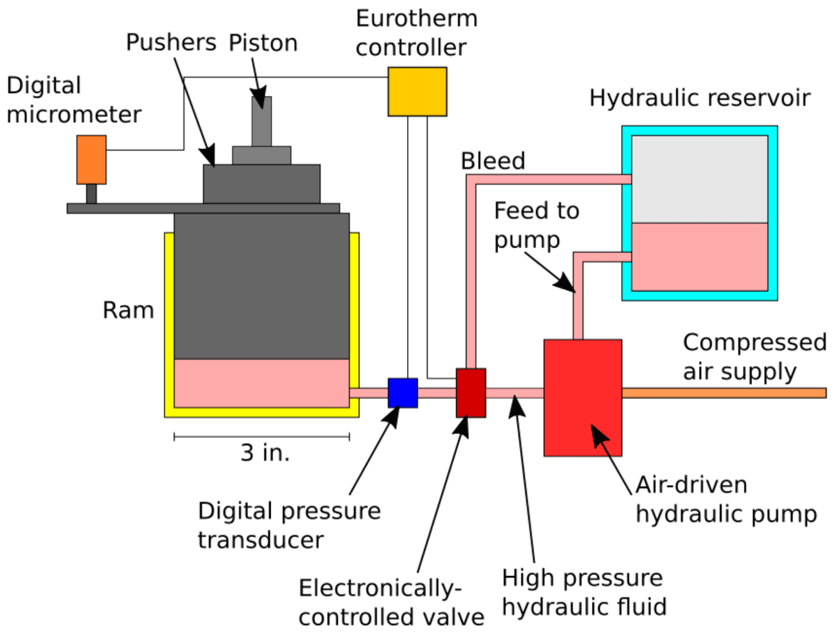
Figure A1Schematic diagram of the pressure generation and control system for the ANU-RSES 200 t automated press.
A3 Temperature control
Temperature control is more conventional. The current that passes through the piston, graphite heater, top plug, and top plate is controlled by the Eurotherm controller. The Eurotherm analogue voltage output drives a phase angle SCR that drives a transformer. The result of this is an increase in heater power with Eurotherm voltage output. Again, this is controlled using a PID algorithm, with readback from the type B thermocouple within the assembly. Manual control without the thermocouple is possible, but unlike in multi-anvil apparatus thermocouple failures are rare (and usually indicative of some other failure within the assembly), so this is not something that is done routinely. Heater current is also measured using an analogue gauge on the front control panel of the press.
If the system does not detect any heater current or elevated temperature above an output value of ∼ 9 % (where experiments at 1200 and 1400 °C are generally in the 20 %–25 % range), a warning will sound, and heater power will be fixed at 9 % until heater contact is detected. This ensures that the PID system does not continue to increase power to a value that will damage or melt parts of the assembly, if greater piston pressure is required for the heater components to make electrical contact. The heater system is also interlocked to the cooling water system, which is monitored by digital flowmeters attached to the inlet and outlet; if no flow of cooling water, or too great a discrepancy between water inflow and outflow, is detected, heater power will be cut to zero and the emergency warning system described above will activate.
If the thermocouple electrical connection breaks during an experiment at high temperature, the system is set to treat this as a high value (∼ 2500 °C), which means that the experiment will be quenched. This is a rare occurrence and ensures that partially complete experiments are able to be recovered rather than be melted or damaged by uncontrolled heater input.
A4 Piston-position monitoring
In this paper, the usefulness of tracking piston movement has been demonstrated. In these piston–cylinder presses, the bridge that supports the pressure vessel from below has a small slot cutout, within which there is a steel arm driven by the pushers between the piston ram and the piston. This arm is connected to a digital micrometer, which is attached to the bridge. The piston position read from this micrometer is logged to a PC with other useful data throughout the experiment.
A5 Logging
The Eurotherm controller, through which electronic signals to and from components of the press are routed, is connected to a PC using a serial connection and the MODBUS protocol. A custom-made program, Pistonbuddy, written in LabView (National Instruments), reads key parameters such as hydraulic system pressure and sample temperature (set point and readback), as well as ancillary parameters such as piston position, cooling water flow, and outputs for pressure and heater control. These data are saved to disc at a customizable interval, generally every 2 s.
A6 Programming
Pressure and temperature paths for experiments can be set up using the Pistonbuddy program. This allows users to build up a program in segments, which can include dwells (maintaining at constant value), ramps (increases or decreases of the relevant parameter at a user-defined rate), and quenches (in the temperature part of the program). These are set up using a touchscreen interface in Pistonbuddy, saved to file for future reference and uploaded to the Eurotherm controller. Because the program is loaded to the Eurotherm controller, crashes and restarts on the PC only affect the logging function for experiments in progress, with no disruption to the progress of the experiment.
B1 Error propagation in calculated pressure and/or temperature using the Markov chain Monte Carlo method
To propagate uncertainty in EPMA measurements through the thermodynamic model to a meaningful uncertainty in calculated pressure and/or temperature, and to show the covariance of uncertainty in these parameters when both are fit simultaneously, a Markov chain Monte Carlo (MCMC) method was used. Propagating uncertainties through conventional methods is complicated by the model simultaneously optimizing values of pressure and temperature to satisfy particular values for Gibbs energy for two equilibria (wz-ZnO = rs-ZnO and wz-MgO = rs-MgO; see Farmer and O'Neill, 2023) and having two variables (P and T) for which to calculate or consider uncertainty.
B2 Fitting both pressure and temperature
First, a typical set of conditions for the rock-salt–wurtzite pressure sensor were selected: 1200 °C and 3.00 GPa. The expected rock salt and wurtzite compositions at these conditions were calculated using the thermodynamic model from Farmer and O'Neill (2023): XZn rock salt = 0.708 and XZn wurtzite = 0.960. A standard deviation of 0.003 was assumed for the composition of both phases, which is typical of microprobe analyses in this study.
The natural log of the probability that the thermodynamic model fits the data takes the form
where and are compositions calculated using values of P and T selected by the Markov chain sampler. Very briefly, the MCMC algorithm (implemented in the Python library “emcee”, Foreman-Mackey et al., 2013) uses “walkers” which move randomly in intensive parameter (i.e. P, T) space, and where ln (p|P,T) improves, those values of P and T are saved in a sampler chain. This chain is then treated as a probability distribution, with differences between values at the 16th and 84th percentiles treated as ±1σ and plots of the probability distribution in two-parameter (P,T) space illustrating covariance between uncertainty in these parameters.
Using this Markov chain Monte Carlo sampler with 100 walkers running for 100 000 iterations, there is strong covariance between pressure and temperature, as discussed in Sect. 3.1.2.
B3 Fitting only pressure or temperature
When temperature is considered known, which is generally the case in piston–cylinder and multi-anvil experiments due to the use of thermocouples, only uncertainty on pressure needs to be calculated. However, while we consider temperature to be well known when thermocouples are used, there is still some small uncertainty in temperature due to factors such as distance between the sample and thermocouple (see Sect. 3.5). We estimate uncertainty in temperature for piston–cylinder experiments to be approximately s(T)=5 °C. Multi-anvil assemblies are more variable in design and materials, resulting in a wider range of temperature uncertainty.
The MCMC method was adapted, with only P included as a variable controlled by the sampler algorithm and T drawn randomly from a Gaussian distribution with a mean = 1200 and s(T)=5 °C at every iteration of the sampler. s(XZn) was again assumed to be 0.03 for both rock salt and wurtzite. When this MCMC sampler is run with 100 walkers for 100 000 iterations, s(P)=0.02 GPa, which is identical to the result of the alternative uncertainty propagation technique used in the Excel macro which accompanies this paper in the Supplement.
Conducting the same exercise for temperature, assuming s(P)=0.03 GPa, results in s(T)=10 °C.
Code for calculations of pressure and temperature from rock salt and wurtzite composition, and vice versa, using the thermodynamic model of Farmer and O'Neill (2023) is provided in the Supplement, in Excel macro format.
All data analysed or generated in this study are included in this paper and its appendix, apart from unprocessed QEMSCAN data used to generate Fig. 8. This is a large file in an obscure proprietary binary format, and we believe that Fig. 8 contains all the useful information that can be derived from these data.
The supplement related to this article is available online at: https://doi.org/10.5194/ejm-36-473-2024-supplement.
HSCO'N identified the MgO–ZnO system as a field of study. NF conducted piston–cylinder experiments. NF did the EPMA and QEMSCAN analysis and data processing. HSCO'N prepared the Excel macro P,T calculator spreadsheet. NF prepared the manuscript and figures with contributions from HSCO'N.
The contact author has declared that neither of the authors has any competing interests.
Publisher’s note: Copernicus Publications remains neutral with regard to jurisdictional claims made in the text, published maps, institutional affiliations, or any other geographical representation in this paper. While Copernicus Publications makes every effort to include appropriate place names, the final responsibility lies with the authors.
This article is part of the special issue “Probing the Earth: experiments on and for our planet”. It is a result of the EMPG 2023 conference, Milan, Italy, 12–15 June 2023.
Our thanks are due to David Clark and Dean Scott for providing technical support for the experimental work in the RSES Experimental Petrology Laboratory and to David Cassar for assistance with the Pistonbuddy system for automatic control of piston–cylinder presses. We thank Jeremy Wykes and Zsanett Pintér for fruitful discussions about the challenges of pressure calibration in solid-media apparatus. We acknowledge the scientific and technical assistance of the Australian Microscopy and Microanalysis Research Facility at the Centre for Advanced Microscopy, Australian National University, especially the assistance of Jeff Chen with electron probe microanalysis and the assistance of Frank Brink and Hua Chen with QEMSCAN analysis and data processing. We acknowledge funding from the Australian Research Council through grant FL130100066 awarded to Hugh St C. O'Neill. We very much appreciate the careful and constructive review of this paper by Bob Myhill, as well as the editorial handling of Simone Tumiati.
This research has been supported by the Australian Research Council (grant no. FL130100066).
This paper was edited by Simone Tumiati and reviewed by Robert Myhill and one anonymous referee.
Akella, J.: Quartz = coesite transition and the comparative friction measurements in piston-cylinder apparatus using talc-alsimag-glass (TAG) and NaCl high-pressure cells, Neues Jb. Miner. Monat., 5, 217–224, 1979.
Beyer, C., Rosenthal, A., Myhill, R., Crichton, W. A., Yu, T., Wang, Y., and Frost, D. J.: An internally consistent pressure calibration of geobarometers applicable to the Earth's upper mantle using in situ XRD, Geochim. Cosmochim. Ac., 222, 421–435, https://doi.org/10.1016/j.gca.2017.10.031, 2018.
Bohlen, S. R. and Boettcher, A. L.: The quartz-coesite transformation: a precise determination and the effects of other components, J. Geophys. Res.-Sol. Ea., 87, 7073–7078, https://doi.org/10.1029/JB087iB08p07073, 1982.
Bose, K. and Ganguly, J.: Quartz-coesite transition revisited: Reversed experimental determination at 500–1200 °C and retrieved thermochemical properties, Am. Mineral., 80, 231–238, https://doi.org/10.2138/am-1995-3-404, 1995.
Boyd, F. R. and England, J. L.: Apparatus for phase-equilibrium measurements at pressures up to 50 kilobars and temperatures up to 1750 °C, J. Geophys. Res., 65, 741–748, https://doi.org/10.1029/JZ065i002p00741, 1960.
Boyd, F. R. and England, J. L.: Effect of pressure on the melting of diopside, CaMgSi2O6, and albite, NaAlSi3O8, in the range up to 50 kilobars, J. Geophys. Res., 68, 311–323, https://doi.org/10.1029/JZ068i001p00311, 1963.
Cohen, L. H., Klement, W., and Kennedy, G. C.: Investigation of phase transformations at elevated temperatures and pressures by differential thermal analysis in piston-cylinder apparatus, J. Phys. Chem. Sol., 27, 179–186, https://doi.org/10.1016/0022-3697(66)90179-X, 1966.
Condamine, P., Tournier, S., Charlier, B., Médard, E., Triantafyllou, A., Dalou, C., Tissandier, L., Lequin, D., Cartier, C., Füri, E., Burnard, P. G., Demouchy, S., and Marrocchi, Y.: Influence of intensive parameters and assemblies on friction evolution during piston-cylinder experiments, Am. Mineral., 107, 1575–1581, https://doi.org/10.2138/am-2022-7958, 2022.
Dasgupta, R., Hirschmann, M. M., and Withers, A. C.: Deep global cycling of carbon constrained by the solidus of anhydrous, carbonated eclogite under upper mantle conditions, Earth Planet. Sc. Lett., 227, 73–85, https://doi.org/10.1016/j.epsl.2004.08.004, 2004.
Farmer, N. and O'Neill, H. St. C.: The miscibility gap between the rock salt and wurtzite phases in the MgO–ZnO binary system to 3.5 GPa, Eur. J. Mineral., 35, 1051–1071, https://doi.org/10.5194/ejm-35-1051-2023, 2023.
Farmer, N., Rushmer, T., Wykes, J., and Mallmann, G.: The Macquarie Deformation-DIA facility at the Australian Synchrotron: A tool for high-pressure, high-temperature experiments with synchrotron radiation, Rev. Sci. Instrum., 91, 114501, https://doi.org/10.1063/5.0022849, 2020.
Foreman-Mackey, D., Hogg, D. W., Lang, D., and Goodman, J.: emcee: The MCMC Hammer, Publ. Astron. Soc. Pac., 125, 306–312, https://doi.org/10.1086/670067, 2013.
Frost, D. J., Poe, B. T., Trønnes, R. G., Liebske, C., Duba, A., and Rubie, D. C.: A new large-volume multianvil system, Phys. Earth Planet. Int., 143/144, 507–514, https://doi.org/10.1016/j.pepi.2004.03.003, 2004.
Gasparik, T.: Experimental study of subsolidus phase relations and mixing properties of pyroxene in the system CaO–Al2O3–SiO2, Geochim. Cosmochim. Ac., 48, 2537–2545, https://doi.org/10.1016/0016-7037(84)90304-1, 1984.
Gottlieb, P., Wilkie, G., Sutherland, D., Ho-Tun, E., Suthers, S., Perera, K., Jenkins, B., Spencer, S., Butcher, A., and Rayner, J.: Using quantitative electron microscopy for process mineralogy applications, JOM, 52, 24–25, https://doi.org/10.1007/s11837-000-0126-9, 2000.
Green, E. C. R., Holland, T. J. B., Powell, R., and White, R. W.: Garnet and spinel lherzolite assemblages in MgO–Al2O3–SiO2 and CaO–MgO–Al2O3–SiO2: thermodynamic models and an experimental conflict, J. Metamorph. Geol., 30, 561–577, https://doi.org/10.1111/j.1525-1314.2012.00981.x, 2012.
Green, T. H., Ringwood, A. E., and Major, A.: Friction effects and pressure calibration in a piston-cylinder apparatus at high pressure and temperature, J. Geophys. Res., 71, 3589–3594, https://doi.org/10.1029/JZ071i014p03589, 1966.
Hack, A. C. and Mavrogenes, J. A.: A cold-sealing capsule design for synthesis of fluid inclusions and other hydrothermal experiments in a piston-cylinder apparatus, Am. Mineral., 91, 203–210, https://doi.org/10.2138/am.2006.1898, 2006.
Holland, T. J. B. and Powell, R.: An improved and extended internally consistent thermodynamic dataset for phases of petrological interest, involving a new equation of state for solids: Thermodynamic dataset for phases of petrological interest, J. Metamorph. Geol., 29, 333–383, https://doi.org/10.1111/j.1525-1314.2010.00923.x, 2011.
Holloway, J. R. and Wood, B. J.: Simulating the Earth: Experimental Geochemistry, Springer Netherlands, https://doi.org/10.1007/978-94-011-8028-3, 1988.
Huang, W.-L. and Wyllie, P. J.: Melting relationships in the systems CaO-CO2 and MgO-CO2 to 33 kilobars, Geochim. Cosmochim. Ac., 40, 129–132, https://doi.org/10.1016/0016-7037(76)90169-1, 1976.
Hudon, P., Baker, D. R., and Toft, P. B.: A high-temperature assembly for 1.91-cm (-in.) piston-cylinder apparatus, Am. Mineral., 79, 145–147, 1994.
Johannes, W.: Pressure comparing experiments with NaCl, AgCl, talc, and pyrophyllite assemblies in a piston cylinder apparatus, Neues Jb. Miner. Monat., 2, 84–92, 1978.
Johannes, W., Bell, P. M., Mao, H. K., Boettcher, A. L., Chipman, D. W., Hays, J. F., Newton, R. C., and Seifert, F.: An interlaboratory comparison of piston-cylinder pressure calibration using the albite-breakdown reaction, Contrib. Mineral. Petr., 32, 24–38, https://doi.org/10.1007/BF00372231, 1971.
Kim, K.-T.: Analysis of pressures generated in a piston-cylinder type apparatus, J. Geophys. Res., 79, 3325–3333, https://doi.org/10.1029/JB079i023p03325, 1974.
Klemme, S. and O'Neill, H. S.: The near-solidus transition from garnet lherzolite to spinel lherzolite, Contrib. Mineral. Petr., 138, 237–248, https://doi.org/10.1007/s004100050560, 2000.
Kusaba, K., Syono, Y., and Kikegawa, T.: Phase transition of ZnO under high pressure and temperature, Proc. Jpn. Acad. Ser. B, 75, 1–6, https://doi.org/10.2183/pjab.75.1, 1999.
Lafuente, B., Downs, R. T., Yang, H., and Stone, N.: “1. The power of databases: The RRUFF project”, Highlights in Mineralogical Crystallography, edited by: Armbruster, T. and Danisi, R. M., Berlin, München, Boston, De Gruyter (O), 1–30, https://doi.org/10.1515/9783110417104-003, 2016.
Landau, L. D.: On the theory of phase transitions, Ukr. J. Phys., 11, 19–32, 1937.
Leinenweber, K. D., Tyburczy, J. A., Sharp, T. G., Soignard, E., Diedrich, T., Petuskey, W. B., Wang, Y., and Mosenfelder, J. L.: Cell assemblies for reproducible multi-anvil experiments (the COMPRES assemblies), Am. Mineral., 97, 353–368, https://doi.org/10.2138/am.2012.3844, 2012.
Longhi, J.: Temporal stability and pressure calibration of barium carbonate and talc/pyrex pressure media in a piston-cylinder apparatus, Am. Mineral., 90, 206–218, https://doi.org/10.2138/am.2005.1348, 2005.
Manning, C. E. and Boettcher, S. L.: Rapid-quench hydrothermal experiments at mantle pressures and temperatures, Am. Mineral., 79, 1153–1158, 1994.
McDade, P., Wood, B. J., Van Westrenen, W., Brooker, R., Gudmundsson, G., Soulard, H., Najorka, J., and Blundy, J.: Pressure corrections for a selection of piston-cylinder cell assemblies, Mineral. Mag., 66, 1021–1028, https://doi.org/10.1180/0026461026660074, 2002.
Mirwald, P. W. and Massonne, H.-J.: The low-high quartz and quartz-coesite transition to 40 kbar between 600° and 1600 °C and some reconnaissance data on the effect of NaAlO2 component on the low quartz-coesite transition, J. Geophys. Res.-Sol. Ea., 85, 6983–6990, https://doi.org/10.1029/JB085iB12p06983, 1980.
Mirwald, P. W., Getting, I. C., and Kennedy, G. C.: Low-friction cell for piston-cylinder high-pressure apparatus, J. Geophys. Res., 80, 1519–1525, https://doi.org/10.1029/JB080i011p01519, 1975.
Newville, M., Stensitzki, T., Allen, D. B., and Ingargiola, A.: LMFIT: Non-Linear Least-Square Minimization and Curve-Fitting for Python (0.8.0), Zenodo [code], https://doi.org/10.5281/zenodo.11813, 2014.
Nickel, K. G., Brey, G. P., and Kogarko, L.: Orthopyroxene-clinopyroxene equilibria in the system CaO-MgO-Al2O3-SiO2 (CMAS): new experimental results and implications for two-pyroxene thermometry, Contrib. Mineral. Petr., 91, 44–53, https://doi.org/10.1007/BF00429426, 1985.
Pickering, J. M., Schwab, B. E., and Johnston, A. D.: Off-center hot spots; double thermocouple determination of the thermal gradient in a 1.27 cm ( in.) CaF2 piston-cylinder furnace assembly, Am. Mineral., 83, 228–235, https://doi.org/10.2138/am-1998-3-405, 1998.
Schilling, F. and Wunder, B.: Temperature distribution in piston-cylinder assemblies: Numerical simulations and laboratory experiments, Eur. J. Mineral., 16, 7–14, https://doi.org/10.1127/0935-1221/2004/0016-0007, 2004.
Schott Technical Glass Solutions: BOROFLOAT® 33 – Thermal Properties, https://www.schott.com/en-au/products/borofloat-P1000314/downloads (last access: 5 June 2024) 2022.
Stackhouse, S., Stixrude, L., and Karki, B. B.: Thermal Conductivity of Periclase (MgO) from First Principles, Phys. Rev. Lett., 104, 208501, https://doi.org/10.1103/PhysRevLett.104.208501, 2010.
Wade, J. and Wood, B. J.: A high-temperature (3000 K) assembly for piston cylinder experiments, Geochem. Geophy. Geosy., 3, 1–4, https://doi.org/10.1029/2001GC000180, 2002.
Walter, M., Katsura, T., Kubo, A., Shinmei, T., Nishikawa, O., Ito, E., Lesher, C., and Funakoshi, K.: Spinel–garnet lherzolite transition in the system CaO-MgO-Al2O3-SiO2 revisited: an in situ X-ray study, Geochim. Cosmochim. Ac., 66, 2109–2121, https://doi.org/10.1016/S0016-7037(02)00845-1, 2002.
Watson, E., Wark, D., Price, J., and Orman, J. V.: Mapping the thermal structure of solid-media pressure assemblies, Contrib. Mineral. Petr., 142, 640–652, https://doi.org/10.1007/s00410-001-0327-4, 2002.
Xia, L., Liu, Z., and Taskinen, P.: Solubility study of the halite and wurtzite solid solutions in the MgO-ZnO system within temperature range from 1000 to 1600 °C, J. Alloys Compd., 687, 827–832, https://doi.org/10.1016/j.jallcom.2016.06.191, 2016.
Zarei, A., Li, Y., Fei, H., and Katsura, T.: A nearly zero temperature gradient furnace system for high pressure multi-anvil experiments, High Press. Res., 38, 243–249, https://doi.org/10.1080/08957959.2018.1479851, 2018.