the Creative Commons Attribution 4.0 License.
the Creative Commons Attribution 4.0 License.
 | 27 Nov 2023
The miscibility gap between the rock salt and wurtzite phases in the MgO–ZnO binary system to 3.5 GPa
Hugh St. C. O'Neill
At ambient pressure, MgO crystallizes in the rock salt (B1) structure, whereas ZnO crystallizes in the wurtzite structure (B4). The asymmetric miscibility gap between these two structures in the MgO–ZnO binary system narrows with increasing pressure, terminating at the wurtzite-to-rock-salt phase transition in pure ZnO, which occurs at approximately 5 GPa at 1000 ∘C. Despite their essential simplicity, the pressure–temperature–composition (P–T–X) relations in the MgO–ZnO binary system have been sparsely studied experimentally, with disparate results that are inconsistent with available thermodynamic data. Here we report the experimental determination of the P–T–X relations of the miscibility gap from 940 to 1500 ∘C and 0 to 3.5 GPa, which we combine with calorimetric and equation-of-state data from the literature and on the transition in endmember ZnO, to build a thermodynamic model that resolves many of the inconsistencies. The model treats the rock salt phase as an ideal solution (no excess Gibbs free energy of mixing), while in the wurtzite phase the MgO component follows Henry's law and the ZnO component Raoult's law in the range of compositions accessed experimentally. However, there is an inconsistency between the partial molar volume of wurtzite-structured MgO deduced from this model and that inferred from lattice parameter measurements by X-ray diffraction in the quenched samples. This discrepancy may be caused by unquenchable disordering of some significant fraction of the substituting Mg2+ into normally vacant octahedral interstices of the wurtzite structure.
- Article
(3740 KB) - Full-text XML
- Companion paper
- BibTeX
- EndNote


Unlike other divalent cations (except the very small Be2+), Zn2+ shows a marked preference for tetrahedral coordination with oxygen in crystal structures, and the stable phase of ZnO at ambient conditions has the hexagonal wurtzite (B4) structure – the mineral zincite, with Zn2+ in slightly distorted tetrahedral coordination (point symmetry 3 m). The oxides of other divalent cations of comparable size adopt the cubic rock salt (B1) structure. At equilibrium, compositions in the MgO–ZnO binary system crystallize subsolidus at ambient pressure into two coexisting phases: one MgO-rich phase with the rock salt structure and the other an ZnO-rich phase with the wurtzite structure. The miscibility gap separating the two phases is highly asymmetric, with the solubility of ZnO in rock salt being considerably greater than that of MgO in wurtzite. Despite both structures being derived from close packing of the oxygen anions, wurtzite structures are ∼ 18 % less dense than the rock salt form (Gerward and Olsen, 1995), and wurtzite-structured zincite (wz-ZnO) has been observed to transform to the rock salt structure (rs-ZnO) within the range 5 to 6 GPa at ∼ 900 ∘C (Kusaba et al., 1999; Decremps et al., 2000). The similarity in the ionic radii of Mg2+ and Zn2+ in both tetrahedral and octahedral coordination (Shannon, 1976) predicts that the mixing relations in both the rs-(Mg,Zn)O and wz-(Mg,Zn)O solid solutions should not deviate much from ideality (Davies and Navrotsky, 1983). The phase diagram of the MgO–ZnO system in the P–X (pressure–composition) plane thus consists of a miscibility gap between solid solutions of rock salt and wurtzite, which closes at the pressure of the wurtzite–rock salt (wz–rs) phase transition in pure ZnO. Experiments at high pressure (Li et al., 1999; Baranov et al., 2008) confirm that Zn/Mg increases in both the coexisting phases on the miscibility gap with increasing pressure. In the T–X plane (Fig. 1), the mutual solubility narrows with increasing temperature (Rigamonti, 1946; Sarver et al., 1959; Kondrashev and Omelchenko, 1964; Segnit and Holland, 1965; Hansson et al., 2004; Xia et al., 2016).
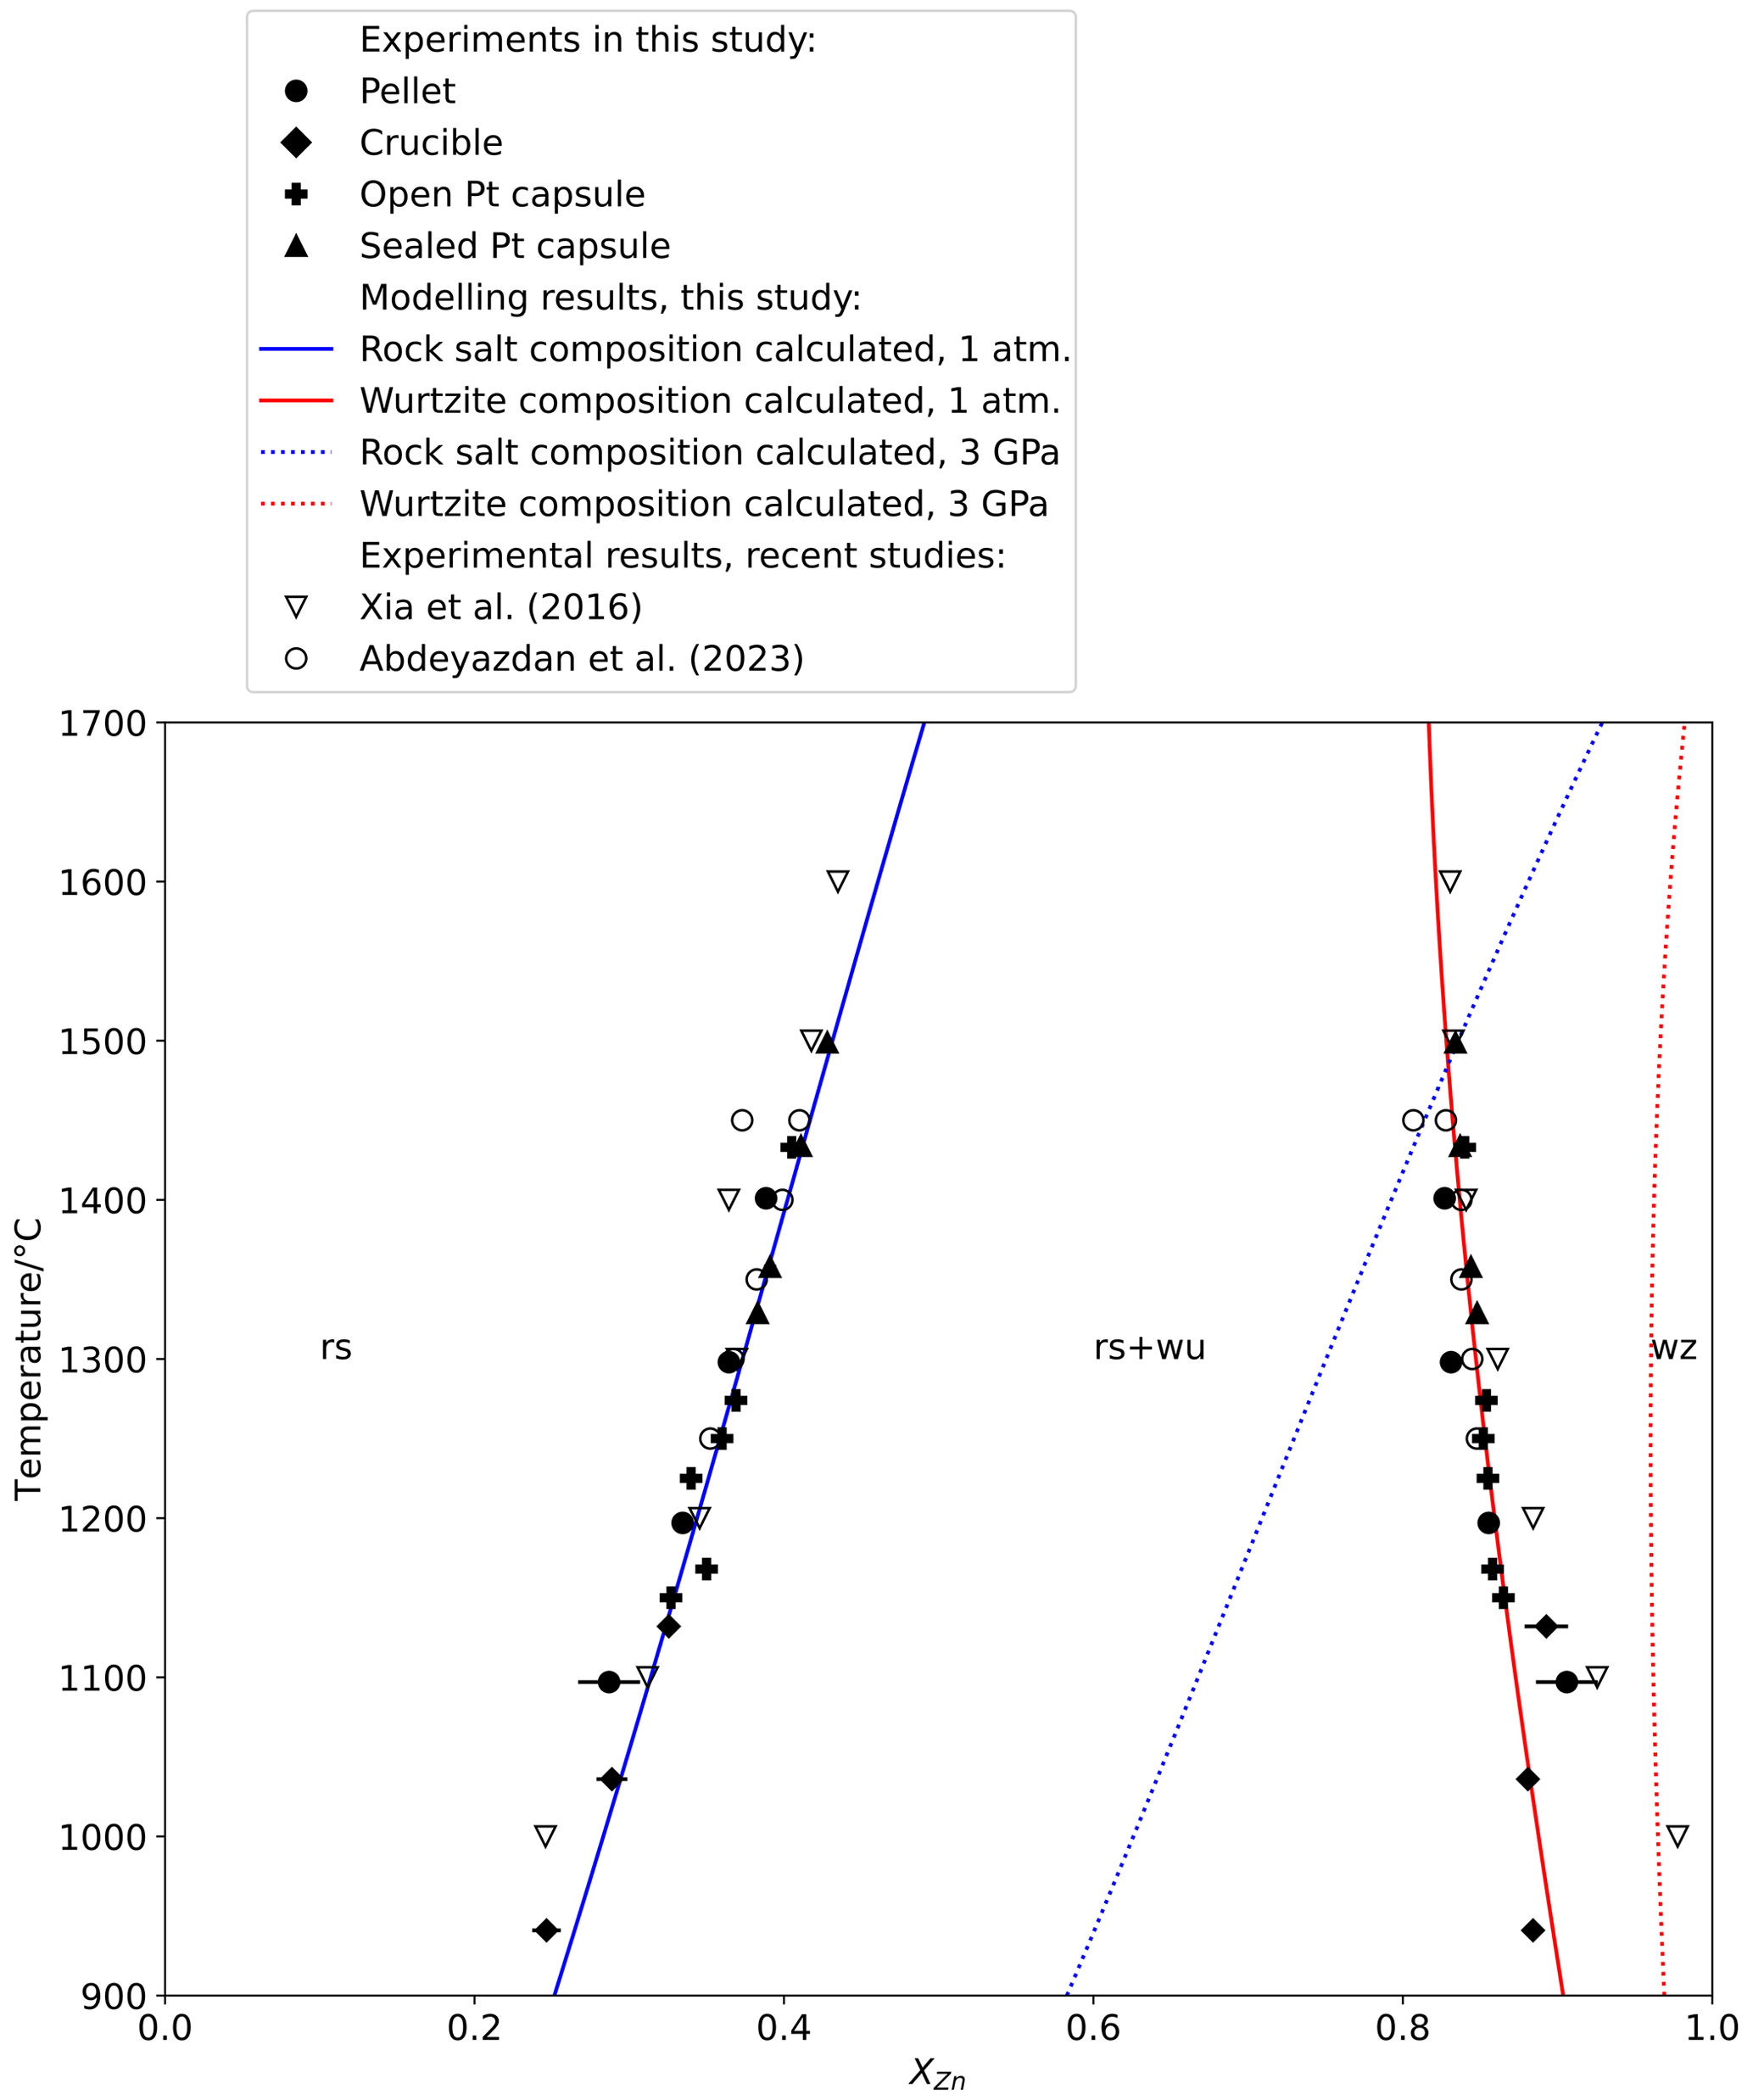
Figure 1Plot of temperature against composition measured by an electron probe microanalyser (EPMA) for rock salt and wurtzite synthesized in 1 atm experiments, with T–X relations calculated from the thermodynamic model at 1 atm (solid lines) and 3 GPa (dotted lines).
Despite the essential simplicity of this binary system, its equilibrium phase relations have not been systematically mapped in P–T–X space, and thermodynamic data on the wz–rs transition in ZnO and the properties of rs-ZnO are sparse and often inconsistent (Sokolov et al., 2010; Leitner et al., 2013). Additionally, there has been confusion between the equilibrium phase relations and what is achievable kinetically. These problems are attributable to the wz–rs transition in ZnO being martensitic or at least quasi-martensitic (Solozhenko et al., 2011). It occurs extremely rapidly, such that rs-ZnO has only been recovered to ambient conditions in nanocrystalline form (Jiang et al., 2000; Decremps et al., 2002) or in a mixture with other phases such as ammonium chloride (Bates et al., 1962), where it is preserved due to stabilization by interphase surface energies.
Here we determine the P–T–X relations in the ZnO–MgO binary system in the range 0.0001–3.5 GPa and 800–1400 ∘C. We use thermodynamic modelling incorporating relevant data from the literature together with new high-pressure, high-temperature experiments. Interpretation of such experiments could run the danger of introducing an element of circularity: prior to the results of this study, we lack the certainty in absolute pressure measurement in our high-pressure experimental apparatus (the piston–cylinder) to do justice to the precision of the results. Temperature, on the other hand, can be precisely controlled and accurately measured at ambient pressure. Accordingly, we adopt a hybrid tactic based on consistency between all the relevant observations, including variation in the high-pressure experiments using a range of assemblies and experimental procedures.
One outcome of this study will be the calibration of the miscibility gap as a P–T sensor, with a view to using MgO–ZnO ceramics to record P–T conditions in phase equilibrium experiments in situ, for which purpose it has several favourable attributes: it is applicable over a wide P–T range; it is precise (potentially to ±0.02 GPa); and MgO–ZnO ceramics are almost as inert chemically as pure MgO, which they may replace routinely in solid media pressure assemblies.
Incidentally, there appears to be confusion in the use of the term “miscibility gap”. Here we adopt the succinct definitions of Powell (1978): “The composition gap between two phases of the same structure is usually called a solvus, while the composition gap between phases of different structure is usually called a miscibility gap” (Powell, 1978, p. 33). This usage, which appears to be common in the mineralogical literature, avoids the redundancy, let alone confusion, of using “solvus” and “miscibility gap” as synonyms.
2.1 Experimental starting materials
Starting materials were MgO and ZnO powders mixed and ground in an agate mortar under acetone in various proportions. MgO was dried overnight at 1200 ∘C and then stored in a desiccator cabinet prior to use. For three experiments at atmospheric pressure, a flux of PbF2 was added. Previous experimental results were used to place the composition in the two-phase rock salt + wurtzite field under the conditions of the experiment. This meant that for high-pressure experiments above ∼ 3.5 GPa a composition with 85 mol. % ZnO was used, whereas for experiments 2.0–3.5 GPa 80 mol. % ZnO was used. Below 2.0 GPa, mixtures of 70 mol. % or 80 mol. % ZnO were used. For the ambient-pressure experiments, two bulk compositions were used, with 50 mol. % and 55 mol. % ZnO.
2.2 Ambient-pressure experiments
Ambient-pressure experiments were conducted in tube furnaces, and at lower temperatures where a larger volume crucible was used for experiments with flux, in a box furnace.
These experiments faced two potential problems: achieving equilibrium at low temperatures with a grain size adequate for analysis and coping with the volatility of ZnO at higher temperatures, which is due to loss of Zn(g) according to
The loss of Zn(g) would introduce an error if the rate of volatilization exceeds the rate of re-equilibration, which may explain some of the discrepancies between previous experimental determinations of the MgO–ZnO phase diagram at high temperature and ambient pressure. The trade-off between volatilization and re-equilibration is expected to be sensitive to temperature, as indicated by the following considerations. Since this problem is encountered frequently in phase equilibrium studies where the system is open to loss of volatile components, our assessment of it in this example may be of community interest. It is accordingly described in detail.
Solid-state diffusion, which sets a lower limit on the rates of re-equilibration, is a thermally activated process in which the rate of diffusion increases exponentially with temperature, as expressed by the activation energy of diffusion. The diffusivity of Zn into single-crystal MgO was measured by Wuensch and Vasilos (1965), who found (1273 to 1918 K, DZn in m2 s−1). For an assumed timescale t, the characteristic diffusion distance, x, is . This characteristic diffusion distance needs to be compared with the rate of Zn volatilization. The latter will depend on several factors, including diffusion, but arguably the rate-controlling step is the partial pressure of Zn(g), pZn, which also varies exponentially with temperature according to the enthalpy of volatilization. Because evaporation in the experiments takes place with rs and wz coexisting, the activity of ZnO is buffered, suggesting that the rate of evaporation is independent of time (diffusion permitting). The rate will also depend on geometrical factors, including the ratio of area to volume and porosity (see Sossi et al., 2019). These considerations suggest that the relative mass loss, ΔmZn, may be parameterized as a function of temperature as , where A is a constant of proportionality for a given geometry, to be determined experimentally. It has units of mass divided by time. The enabling assumption is that A is independent of temperature. Equating the timescale of diffusive re-equilibration with the timescale of mass loss then gives the time-independent relationship:
Here is the partial pressure of Zn(g) at the temperature at which A is determined. From an experimental view, a characteristic distance (x) based on the requirements for quality electron microprobe analyses is 10 µm (see Appendix A1), while mass-balance considerations suggest that a mass loss of 1 % of the ZnO would affect coexisting compositions within the precision anticipated for electron probe microanalyser (EPMA) analyses (ca. 0.005 in XZn; see the results). These order-of-magnitude estimates give a target for of 100 µm2 %−1; experiments in which is much smaller may be expected to deviate from the equilibrium compositions by more than analytical precision.
To determine the constant A for our experimental set-up, a weight-loss test was conducted. An aliquot of the MgO + ZnO mix with 55 mol. % ZnO (71 wt % ZnO) was pressed into a pellet of 12.7 mm diameter and briefly sintered for a few minutes at ∼ 1430 ∘C, which was sufficient to harden it, while it also shrank. Its weight was then determined to be 0.593 g. The pellet was then suspended by Pt wire in the tube furnace at 1433 ∘C for 25.5 h in air, following which the weight was re-determined as 0.448 g, for a loss by evaporation of 34.3 % of the original ZnO. With this value combined with DZn from Wuensch and Vasilos (1965) and thermodynamic data from Robie and Hemingway (1995), values of were calculated as a function of temperature, the results of which were parameterized as , where and T are in units of µm2 %−1 and K respectively. The temperature at which reaches the suggested threshold of 100 µm2 %−1 is then calculated to be 1556 K. At substantially higher temperatures, re-equilibration may not keep up with Zn loss, unless something is done to reduce the latter. Support for this inference comes from the time-series experiments of Xia et al. (2016), who found that coexisting rock salt and wurtzite compositions stabilized within 20 h at 1100 ∘C, but at 1500 ∘C, XZn in the rock salt phase continued to decrease through to their longest observation of 20 h.
The low-temperature limit to attaining equilibrium depends on achieving grain growth to the grain size needed for quality analysis by EPMA (∼ 10 µm), together with the time available to ensure equilibration by solid-state diffusion over this distance, assuming solid-state diffusion is rate-determining. This time depends on the patience of the experimentalist, here taken to be 10 d (240 h). Using the diffusivities of Wuensch and Vasilos (1965), the temperature needed to reach the characteristic diffusion distance of 10 µm would be 1020 ∘C in this time. In practice, we found that experiments at ambient pressure in the absence of a flux produced little grain growth below approximately 1100 ∘C. This was not a problem in the high-pressure experiments, where good grain growth was achieved down to 800 ∘C, the lowest temperature of the experiments reported here, arguably mediated by the gas phase (Dohmen et al., 1998).
Based on these considerations the ambient-pressure experiments were conducted as follows. At temperatures below 1100 ∘C, a flux of PbF2 was used, which grows larger crystals while promoting equilibration by dissolution–reprecipitation. PbF2 has been used as a flux for synthesizing both rs-MgO and wz-ZnO crystals (e.g. Nielsen and Dearborn, 1969; Garton et al., 1972) with negligible incorporation of Pb, as may be expected from the lack of Pb measured in either phase in equilibrium with high-PbO melts in the systems MgO–PbO–SiO2 ± ZnO (Abdeyazdan et al., 2022, 2024). A large sample (∼ 5 g) was placed in a Pt crucible, which was heated in a box furnace ∼ 10 × 15 × 20 cm in size. Temperature was controlled using a generic PID controller connected to an alumina-sheathed thermocouple at the back of the furnace, with temperature additionally monitored using a type B thermocouple placed 2 mm next to the crucible halfway up. The thermocouple was connected to a MAX31856 analog-to-digital converter (ADC) and an Arduino Uno configured to write temperature measured at the thermocouple junction to a memory card at 0.5 Hz. This showed that temperature within the box furnace initially overshoots the set value by tens of degrees and cools to a steady state ∼ 8 h into an experiment. Samples in this furnace could not be quenched rapidly but cooled over a period of ∼ 3 h to near room temperature. This cooling rate may seem slow, but it is insignificant in the context of diffusion timescales as calculated using the diffusivities measured by Wuensch and Vasilos (1965).
Ambient-pressure experiments without the flux were conducted at 1100 to 1500 ∘C using a vertical tube furnace, in air. Three configurations were used. Most simply, the starting material was pressed into a small pellet (∼ 100 µg) and suspended by Pt wire from an alumina rod. Secondly, the starting material was loosely loaded into a 5 mm Pt capsule, sealed at one end but open at the other, which could be re-used. Lastly, experiments above 1300 ∘C were sealed into 5 mm Pt capsules to eliminate Zn loss. The capsules were squashed flat before the second weld to minimize trapped air. All these arrangements were held in the constant temperature zone of the furnace. A type B thermocouple was introduced through the alumina rod, terminating close to the sample. Temperature was controlled using a Eurotherm PID controller connected to a second thermocouple external to the furnace tube. Experiments were terminated by dropping the samples onto the ball valve at the bottom of the furnace. The sealed capsules were noticeably puffed up when recovered, indicating that they remained sealed. Given this, the volume of the capsule, at approximately 0.2 cm3, is too small for the implied vaporization of Zn to have changed the bulk chemistry of the solids significantly.
2.3 Piston–cylinder experiments
In the piston–cylinder experiments, starting materials were contained in Ag or Pt capsules. Sometimes a multi-well capsule or several capsules were used, so that multiple samples could be equilibrated under identical conditions. Many of the experiments reported here were conducted with an additional sample of a mixture of quartz and coesite in addition to ZnO + MgO, results of which will be examined in a subsequent paper.
The experiments used pistons of in. (12.7 mm), in. (∼ 15.9 mm), or in. (∼ 19 mm) diameter with graphite heaters and NaCl plus pyrex glass as the pressure medium, except for some of the in. assemblies, which dispensed with the pyrex. Experiments were conducted using both “piston-in” and “piston-out” experimental routines, which are expected to yield different sample pressures (Psample) at equivalent nominal pressure (Pnominal) (Johannes et al., 1971; McDade et al., 2002), where Pnominal is defined as the expected sample pressure calculated from pressure measured in the hydraulic system driving the piston, and the ratio of cross-sectional area of the piston in the hydraulic ram and the sample piston. The discrepancy between the two pressure values is parameterized as f, colloquially referred to as friction:
In the piston-in experiments, pressure and temperature were increased to the desired values (nominal) simultaneously over a period of ∼ 20 min, whereas in the piston-out experiments pressure was raised above the desired value at a lower temperature (typically 400 ∘C); the experiment was held at this low-temperature, high-pressure condition for some time (typically an hour); and then pressure was decreased while temperature was increased to the final value over 5 min.
The experiments were run using automated piston–cylinder devices developed at the Research School of Earth Sciences, Australian National University. These devices have an automated pressure control system that allows pressure in the hydraulic system driving the piston (i.e. Pnominal) to be maintained within 0.2 % of the set value for the duration of the experiment.
Experiments were heated by passing a current through the graphite resistive heater. Temperature was monitored using a type B thermocouple introduced through the top of the assembly within an alumina sheath and controlled using a Eurotherm PID controller. Temperature was generally maintained within 1 ∘C of the set value. Experiments were quenched by turning off the power to the transformer providing the heater current, which results in a drop in temperature of ∼ 130 ∘C s−1 (Bondar et al., 2020). Reported temperatures do not include any attempt to correct for possible pressure effects on the electromotive force (emf) of the thermocouple (e.g. Getting and Kennedy, 1970).
2.4 Analytical
Samples to be analysed by an electron probe microanalyser (EPMA) were cast in epoxy discs (25 mm diameter), exposed using fine sandpaper, polished to a mirror finish using diamond pastes down to 1 µm particle size, and then coated with 30 nm of carbon. EPMA analysis was performed using a JEOL 8530F at the Centre for Advanced Microscopy, ANU. Kα X-ray emission lines of Mg and Zn were measured using thallium acid phthalate (TAP) and lithium fluoride (LIF) crystals respectively, with commercially supplied pure synthetic periclase (Astimex Ltd.) and zincite (MTI Corp) used as standards. The instrument was calibrated using these standards at the start of each analytical session. The beam setting was 15 keV and 20 nA, with a spot size of 1 µm. The default JEOL software, which implements the XPP (simplified PAP) matrix correction routine (Pouchou et al., 1990), was used to calculate compositions.
Where crystal size was smaller than around 30 µm, the largest rock salt crystals were targeted for EPMA analysis. Modelling in PENEPMA (Llovet and Salvat, 2017) using the CalcZAF software package (Armstrong et al., 2013) showed secondary fluorescence of Zn Kα from 95 mol. % ZnO wurtzite surrounding rock salt with 30 mol. % or 50 mol. % ZnO is insignificant for particle diameters of 5 µm or above (see Appendix). Analysed rock salt grains were >10 µm, so there is no possibility of secondary fluorescence increasing apparent Zn in rock salt. Furthermore, a subset of the ambient-pressure experiments were also analysed using the Zn Lα emission line at the same conditions, with results identical to Zn Kα analyses (see Appendix).
Mole fractions were obtained by calculating the molar ratio Zn/Mg for each individual analysis and then taking the average and standard deviation of these ratios, from which and . This imposes the constraint that mole fractions sum to unity. All the uncertainties in this paper refer to 1 standard deviation.
Some experiments were analysed by X-ray diffraction to characterize the relationship of unit cell dimensions to composition in rock salt solid solutions. The ambient-pressure samples were ground to a target grain size of ∼ 30 µm using a pestle and mortar, and an aliquot of the sample was placed onto low-background quartz or Si holders in an acetone suspension. Diffraction patterns were acquired using an Empyrean S3 diffractometer with a Co X-ray source and were collected over the angular range 2Θ=10 to 110∘, with a step of 0.013∘. A small amount of silicon metal powder (NIST 640c) was added as an internal standard.
Diffraction patterns were also collected on two high-pressure experiments from samples within Pt capsules in polished mounts prepared for EPMA analysis. The mount external to the Pt capsule was masked with Pb foil. While this method accesses fewer grains, producing less precise results, it does preserve the sample for further EPMA analysis. Pt from the capsule was used as an internal standard.
Lattice parameters of the rock salt and wurtzite phases were obtained by Rietveld refinement using GSAS-II (Toby and Von Dreele, 2013), with peaks from the Si or Pt internal standard used to constrain sample displacement (typically 0–20 µm). Because of residual impurity phases in the flux-grown samples, Rietveld refinement was not attempted, and instead the lattice parameter of the rock salt phase was obtained from the position of the 200 peak (around 50∘ 2Θ for Co Kα1) using the Si 111 peak at 33.15∘ 2Θ for the standard, with the Python program “lmfit” (Newville et al., 2014). The reflections of Kα1 and Kα2 were sufficiently distinct that the Kα1 peak could be fitted separately to Kα2. The lattice parameters of the wurtzite phase were not obtained for these samples. Representative examples of diffraction patterns can be found in Appendix A3.
The compositions of the coexisting phases in the ambient-pressure experiments are reported in Table 1 and the high-pressure experiments in Table 2. Uncertainties in parentheses are 1 standard deviation, typically from 12 analyses.
Table 1Results of 1 atm experiments in the MgO–ZnO system. Values in brackets denote 1σ of EPMA analyses.
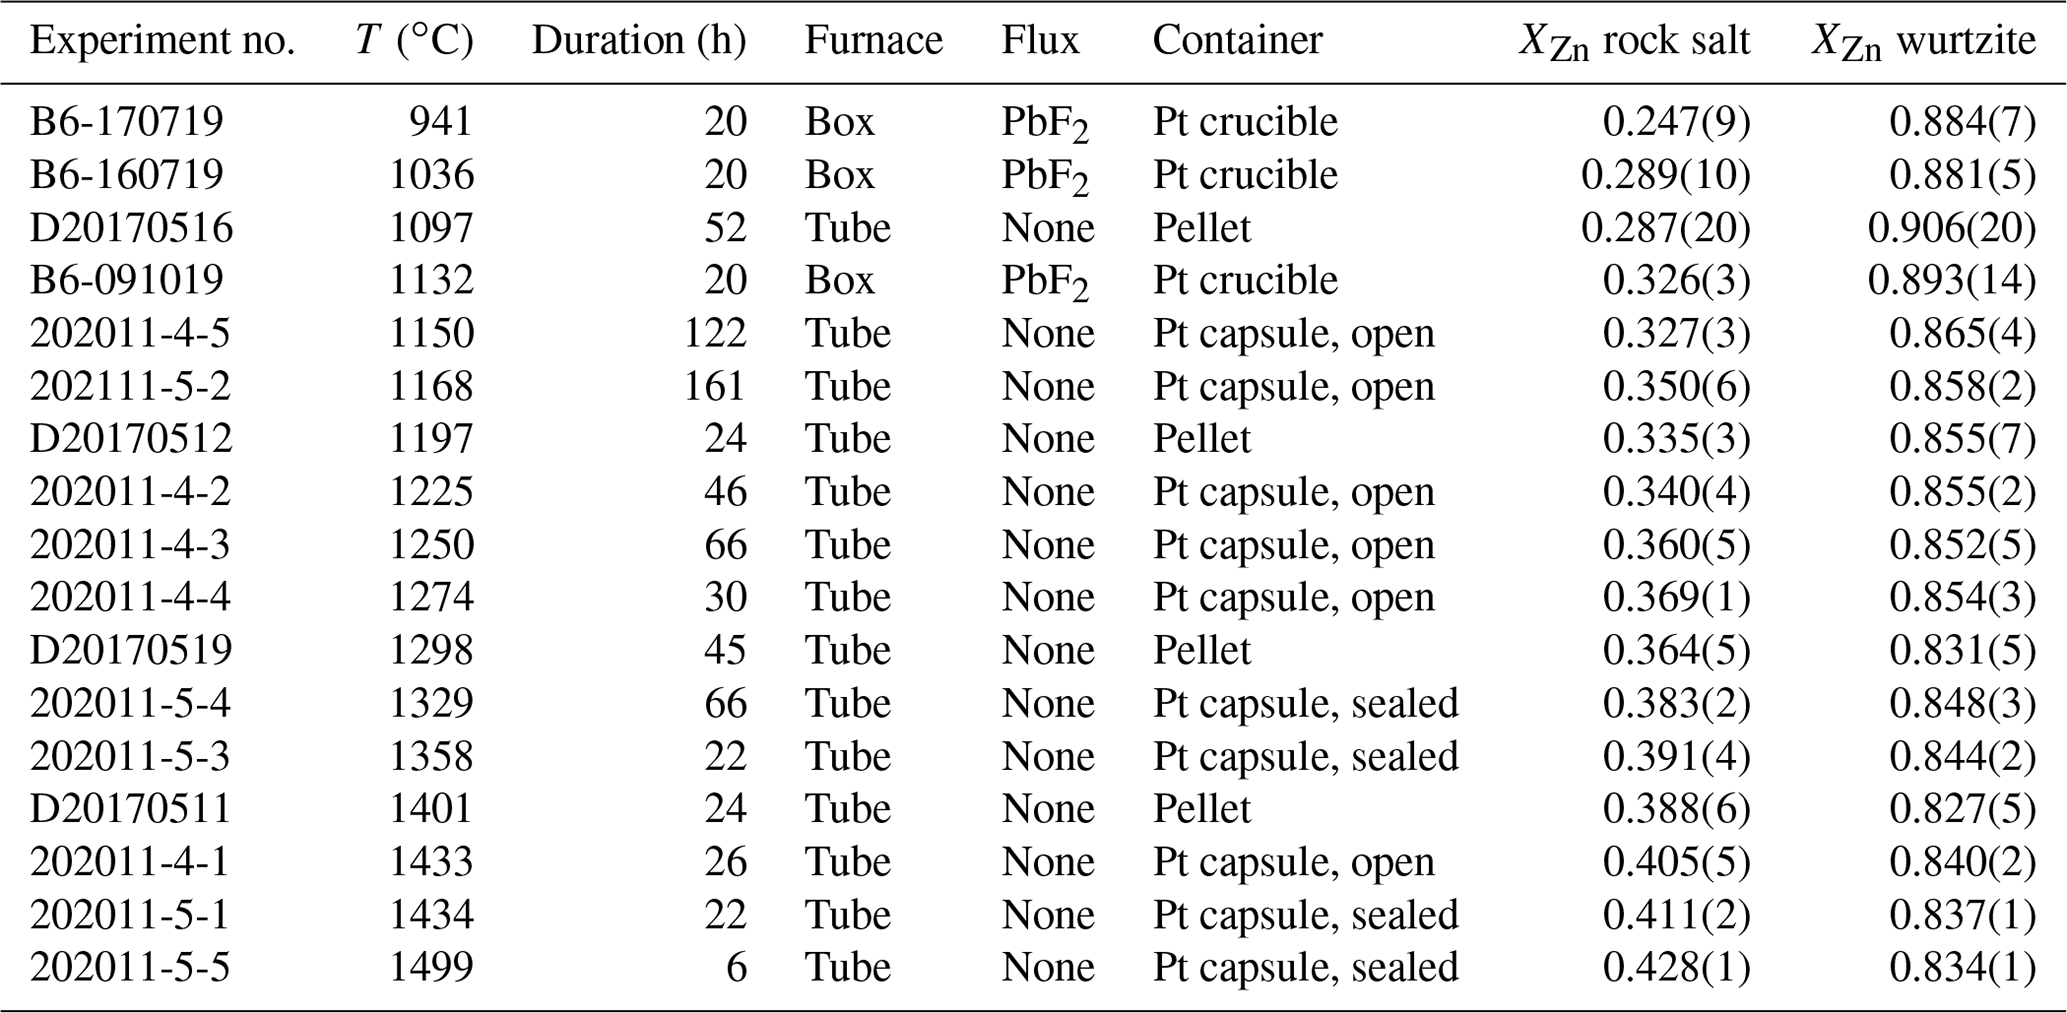
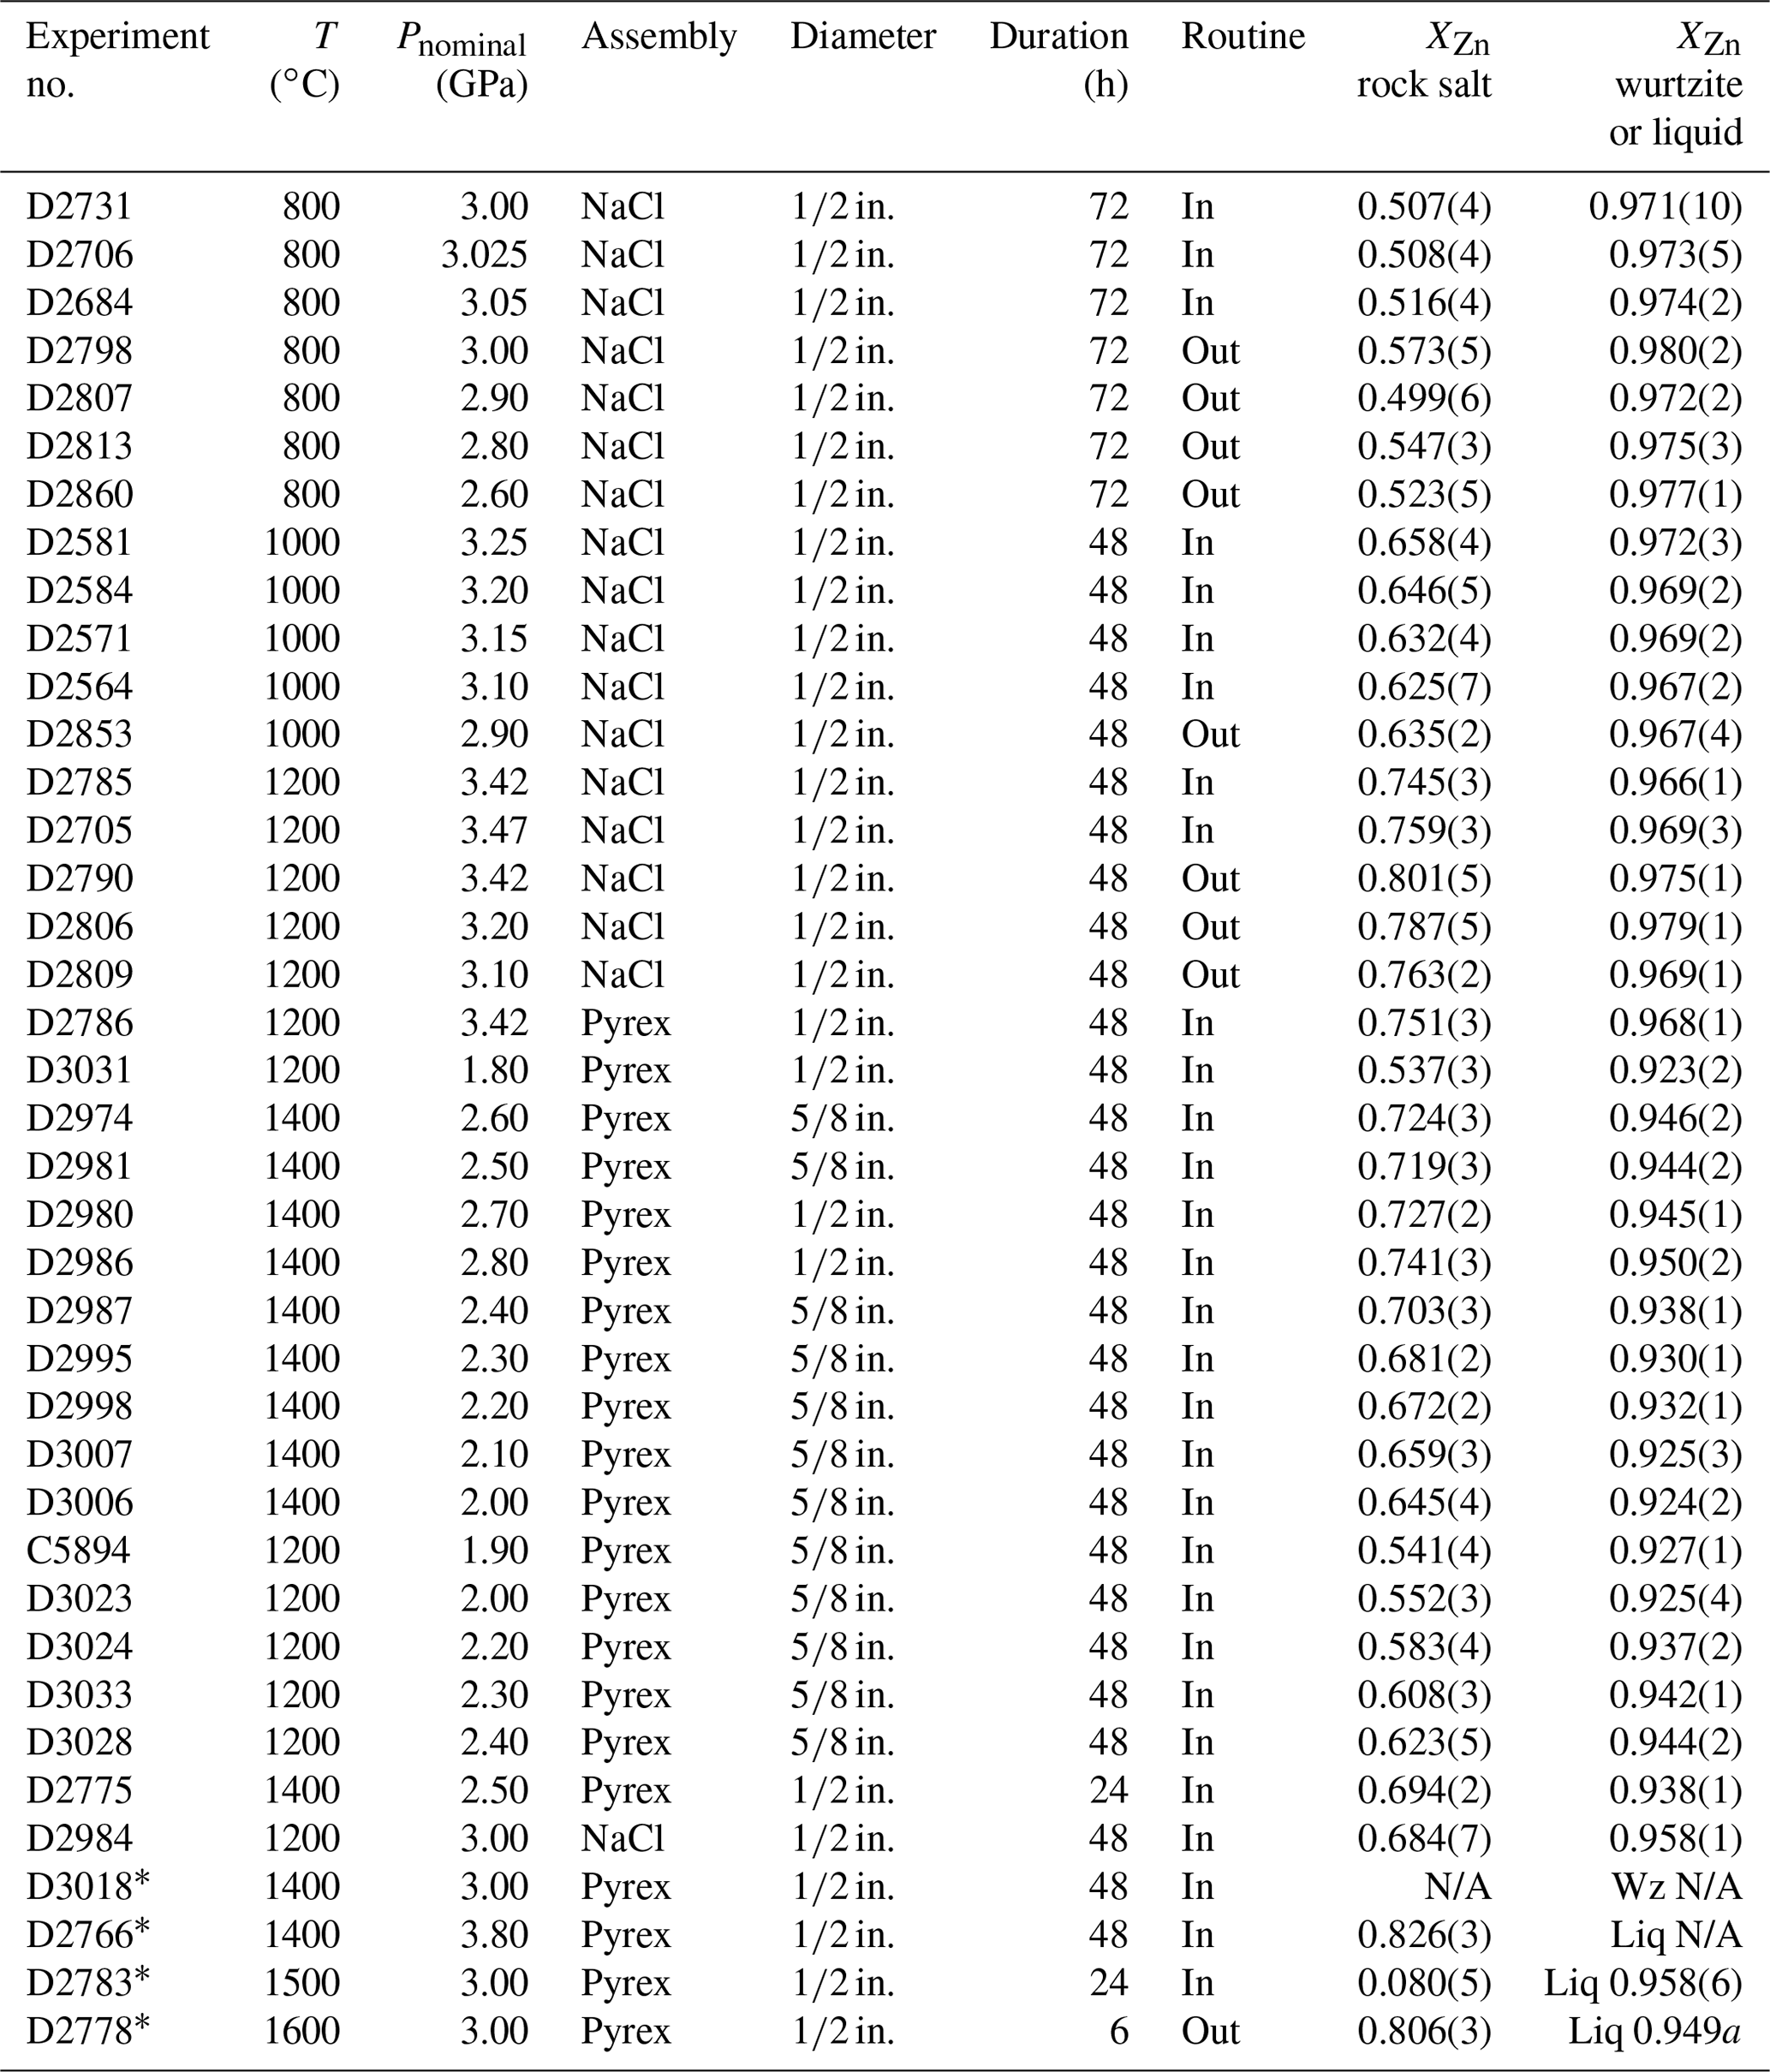
Table 2Results of high-pressure experiments in the MgO–ZnO system, including experiments bracketing the eutectic melting point (marked with ∗). Wz: wurtzite; Liq: liquid; N/A: not analysed by EPMA; a: number of analyses = 1.
The ambient-pressure experiments extend from 940 to 1400 ∘C and confirm the expected narrowing of the miscibility gap with increasing temperature (Fig. 1), and they are closely consistent with the results of similar experiments reported in Abdeyazdan et al. (2024). The sensitivity , where XZn is the mole fraction of ZnO, is in the order of ∘C for rock salt but much less in wurtzite. At high temperatures, experiments in sealed capsules gave slightly greater Zn concentrations in rock salt (by ∼ 0.01 in XZn) than experiments in unsealed capsules and the results reported in Xia et al. (2016), highlighting the importance of Zn volatilization at high temperatures (Fig. 2). Similarly, low-temperature experiments conducted with PbF2 flux show greater solubility of Zn in rock salt (28 mol. % vs. 25 mol. % at 1000 ∘C) and much greater solubility of Mg in wurtzite (10 mol. % vs. 2 mol. % at 1000 ∘C) than the results of Xia et al. (2016) from unfluxed experiments, demonstrating the necessity of using a flux to obtain equilibrium in low-temperature experiments at atmospheric pressure.
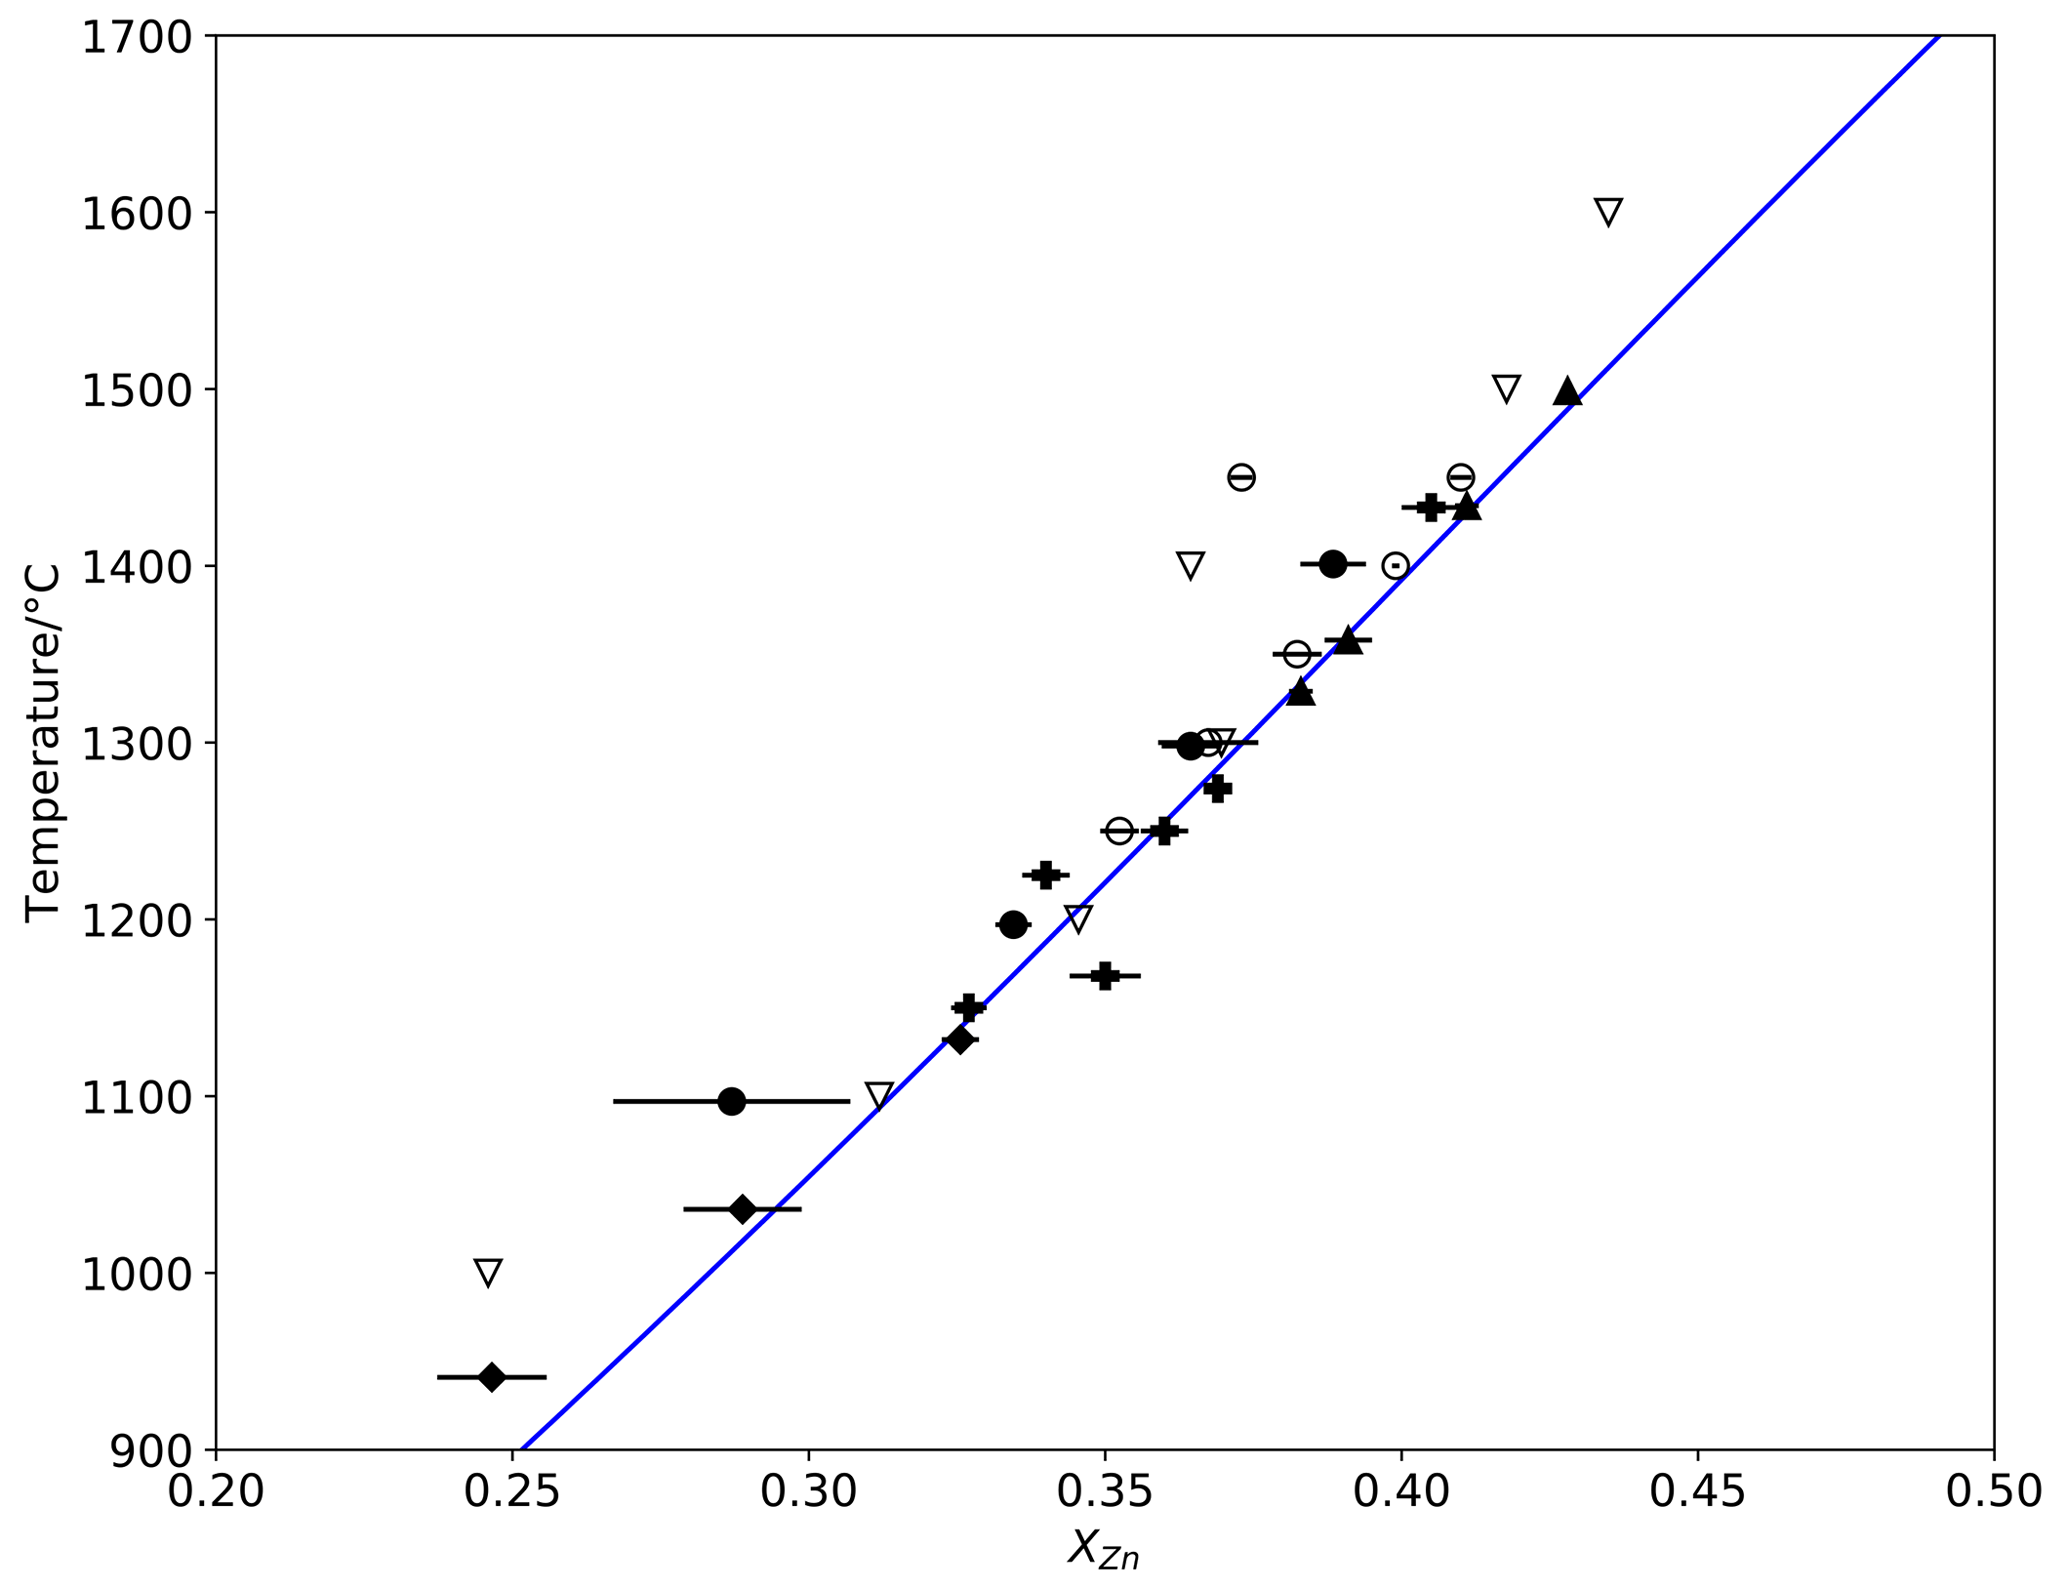
Figure 2Detailed view of the rock salt limb from Fig. 1, showing parabolic discrepancy between the data of Xia et al. (2016) and modelling results (lines) and experimental data from this study. Symbols as in Fig. 1, with 1σ error bars.
3.1 High-pressure experiments
The products of high-pressure piston–cylinder experiments confirm the expected increase in Zn concentrations in both coexisting phases with pressure (Fig. 3). In the rock salt, is ∼ 0.3 GPa−1 at 3.0 GPa, 1000 ∘C, where analytical precision is typically 0.005 in XZn. Comparison of piston–cylinder experiments of similar pressure at different temperatures confirms that, as at ambient pressure, solubility of Zn in periclase and of Mg in wurtzite increases with temperature at high pressure.
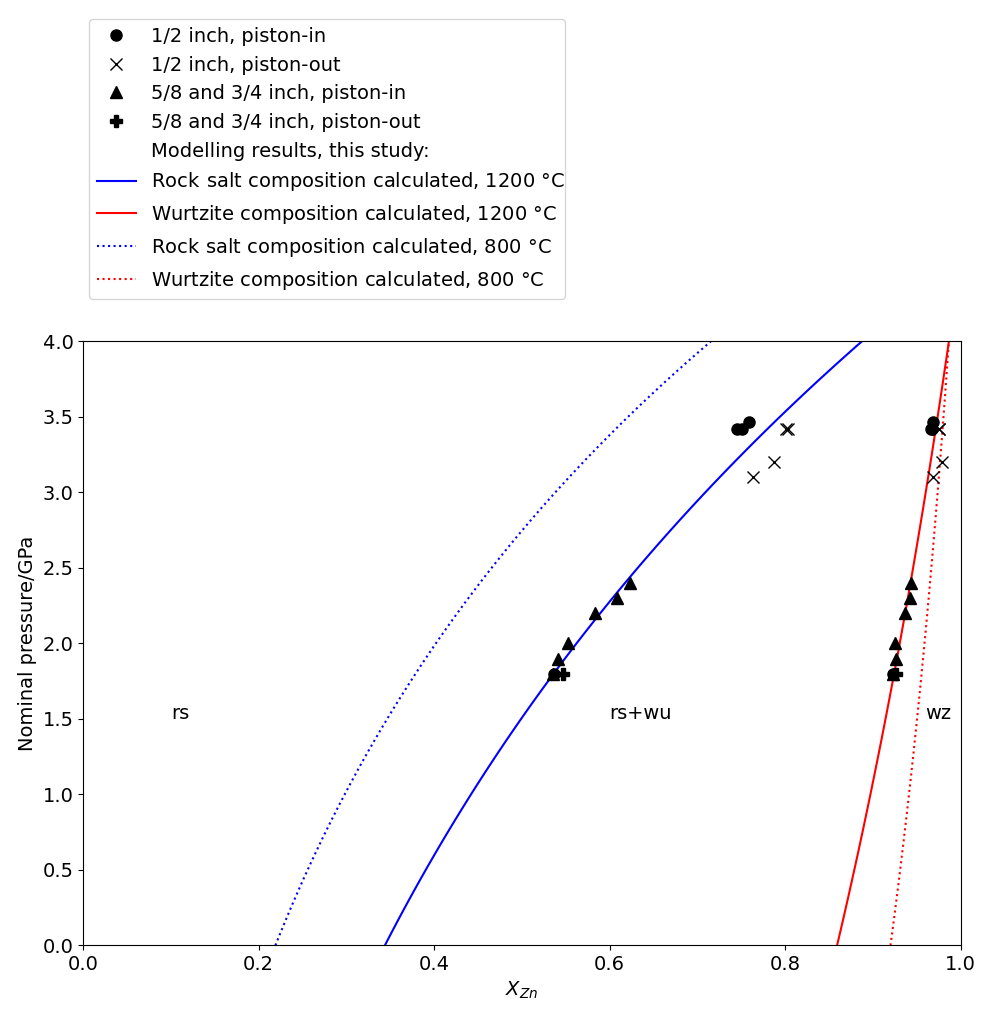
Figure 3Plot of nominal experimental pressure (Pnominal) against composition measured by EPMA in rock salt and wurtzite synthesized in piston–cylinder experiments at 1200 ∘C up to ∼ 3.7 GPa, with modelled P–X relations at 1200 ∘C (solid lines) and 800 ∘C (dotted lines).
In experiments at and above 3.5 GPa, in which XZn in the rock salt was greater than 0.75, the rock salt reverted to the wurtzite structure during quenching. This can be seen in electron photomicrographs of recovered experimental charges (Fig. 4), where the reverted phase has a cracked and mottled texture, compared to smoothly polished intact crystals. Despite this texture, analyses of this phase by EPMA gave satisfactory analytical totals, with a mean of 99.5 wt % from 10 analyses of the reverted material.
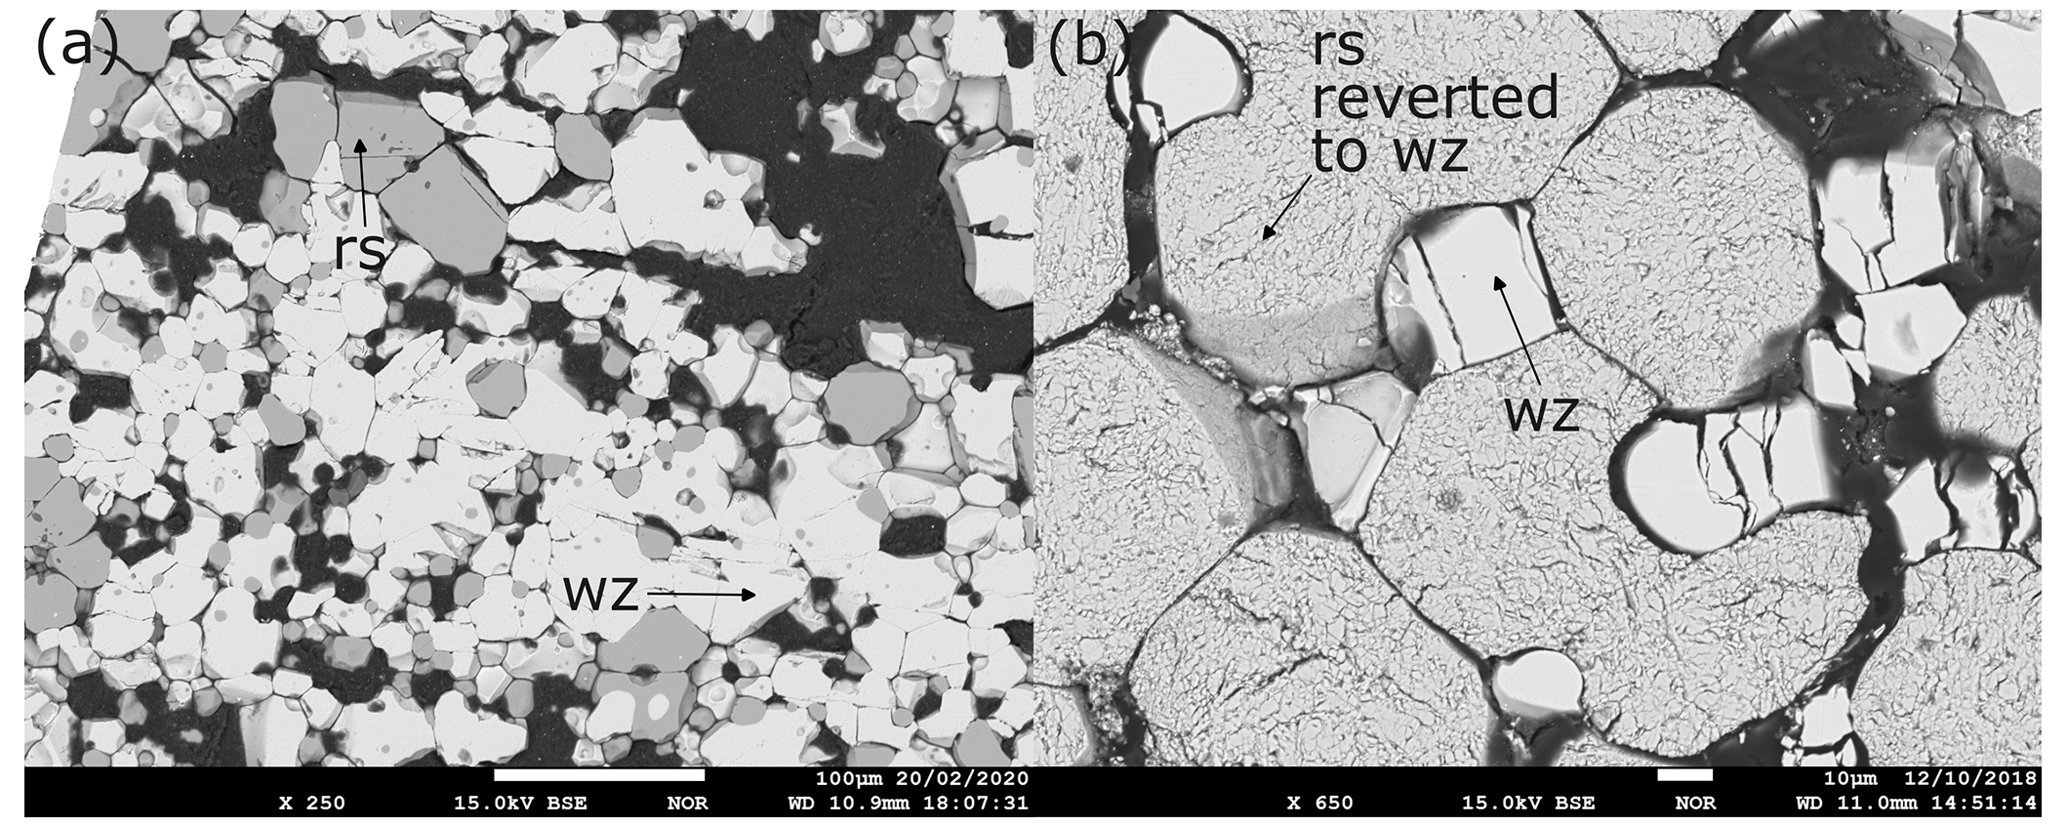
Figure 4Backscattered electron photomicrographs showing the texture of the intact rock salt + wurtzite assemblage (a) in sample D3031 and the texture of reverted rock salt (b) in D2786, which transformed martensitically from the high-pressure cubic rock salt structure to the hexagonal structure during the quenching process.
In one experiment, intact high-Zn rock salt was recovered adjacent to the walls of the Pt capsule, with the usual reverted material at the centre of the capsule. Plausibly, contact with another phase stabilizes the rock salt structure, just as the rock salt structure was partially stabilized by the presence of ammonium chloride in the experiments of Bates et al. (1962). Alternatively, the faster cooling rate at the edges of the capsule may preserve the rock salt structure. This opens up the possibility that accelerating the quenching rate in solid media apparatuses (e.g. Bondar et al., 2020) may provide a new route to the synthesis of high-Zn rock salt solid solutions.
3.2 Melting relations
Quenched liquid (inferred from the texture) plus rock salt was observed in the four samples run under the highest T–P conditions in this study (Table 2). These experiments are irrelevant to the mapping of the miscibility gap but are nevertheless of interest to the crystal chemistry of Zn. An unusual feature of ZnO and MgO–ZnO solid solutions, which is shared with ZnS and Zn2SiO4, is that the melting point decreases with increasing pressure (Sharp, 1969). The eutectic in the MgO–ZnO binary is at ∼ 1700 ∘C at 1 atm (Segnit and Holland, 1965), but at 2.89 GPa it is between 1400 and 1500 ∘C, and at 3.66 GPa it is below 1400 ∘C. As the transition from a crystalline structure to a liquid is accompanied by an increase in entropy, the Clausius–Clapeyron relation (Clapeyron, 1834) requires that the molar volume of molten ZnO is lower than that of crystalline ZnO in the pressure range studied. This implies that the coordination number of Zn in molten ZnO is greater than that of the crystalline solids; i.e. some or all of the Zn in the melt is in 5- or 6-fold coordination rather than all being tetrahedrally coordinated as in the wurtzite structure.
The Zn content of the rock salt coexisting with melt increases with pressure, as does the quenched melt, suggesting that the eutectic converges towards the composition of endmember ZnO with increasing pressure. This is expected, because at pressures above the invariant point in pure ZnO (rock salt + wurtzite + melt), the melting relations must take the form of a simple binary loop. The phase relations around the solidus at 3 GPa are summarized in Fig. 5, where they are contrasted to the ambient-pressure phase diagram after Segnit and Holland (1965).
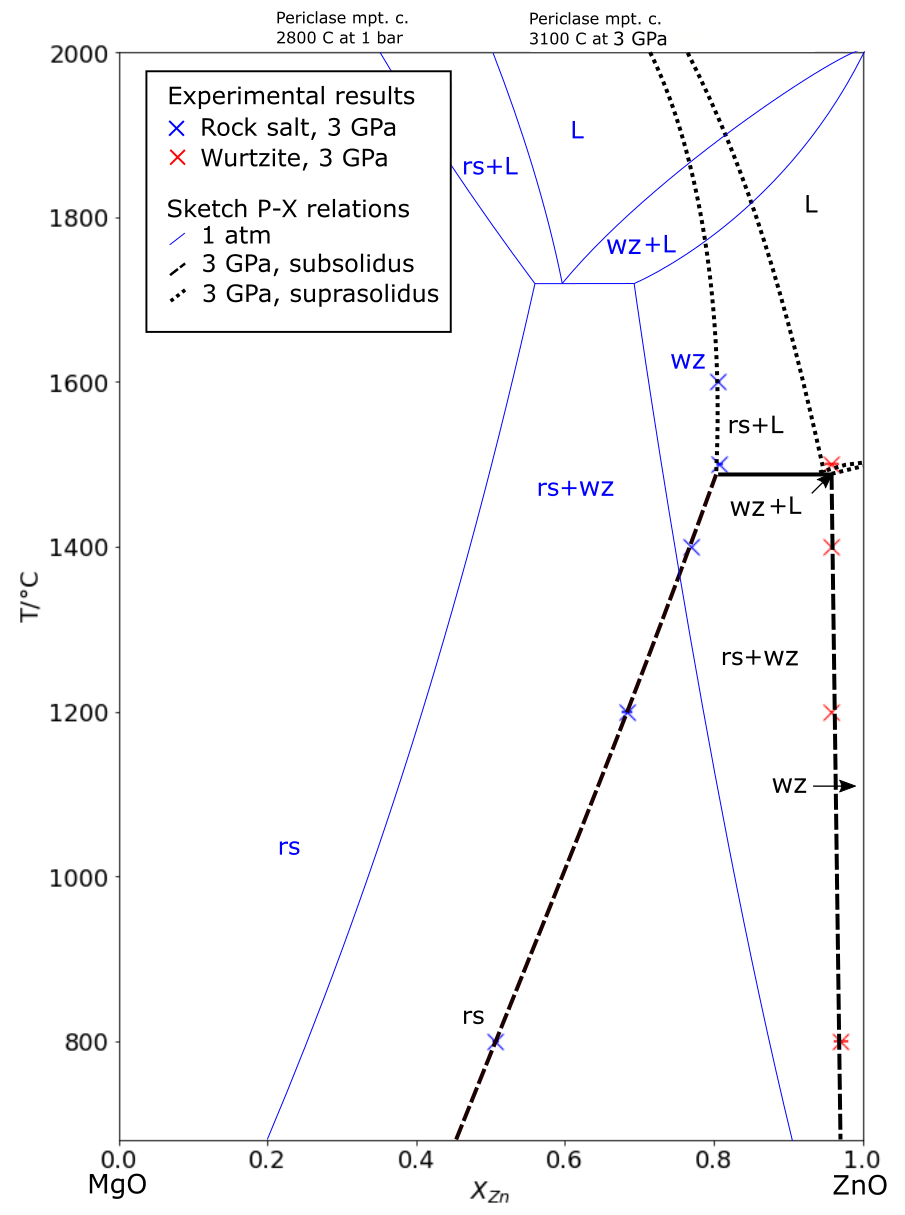
Figure 5Sketch of temperature–composition relations in MgO–ZnO at 3.0 GPa, with data from experiments ∼ 3 GPa, showing subsolidus T–X relations (dashed), mutually saturated solidus (solid), and extrapolation of T–X relations above. The sketched 1 bar T–X relations and eutectic following Segnit and Holland (1965) are shown in blue. rs: rock salt; wz: wurtzite; L: liquid.
3.3 Unit cell dimensions
3.3.1 Rock salt solid solution
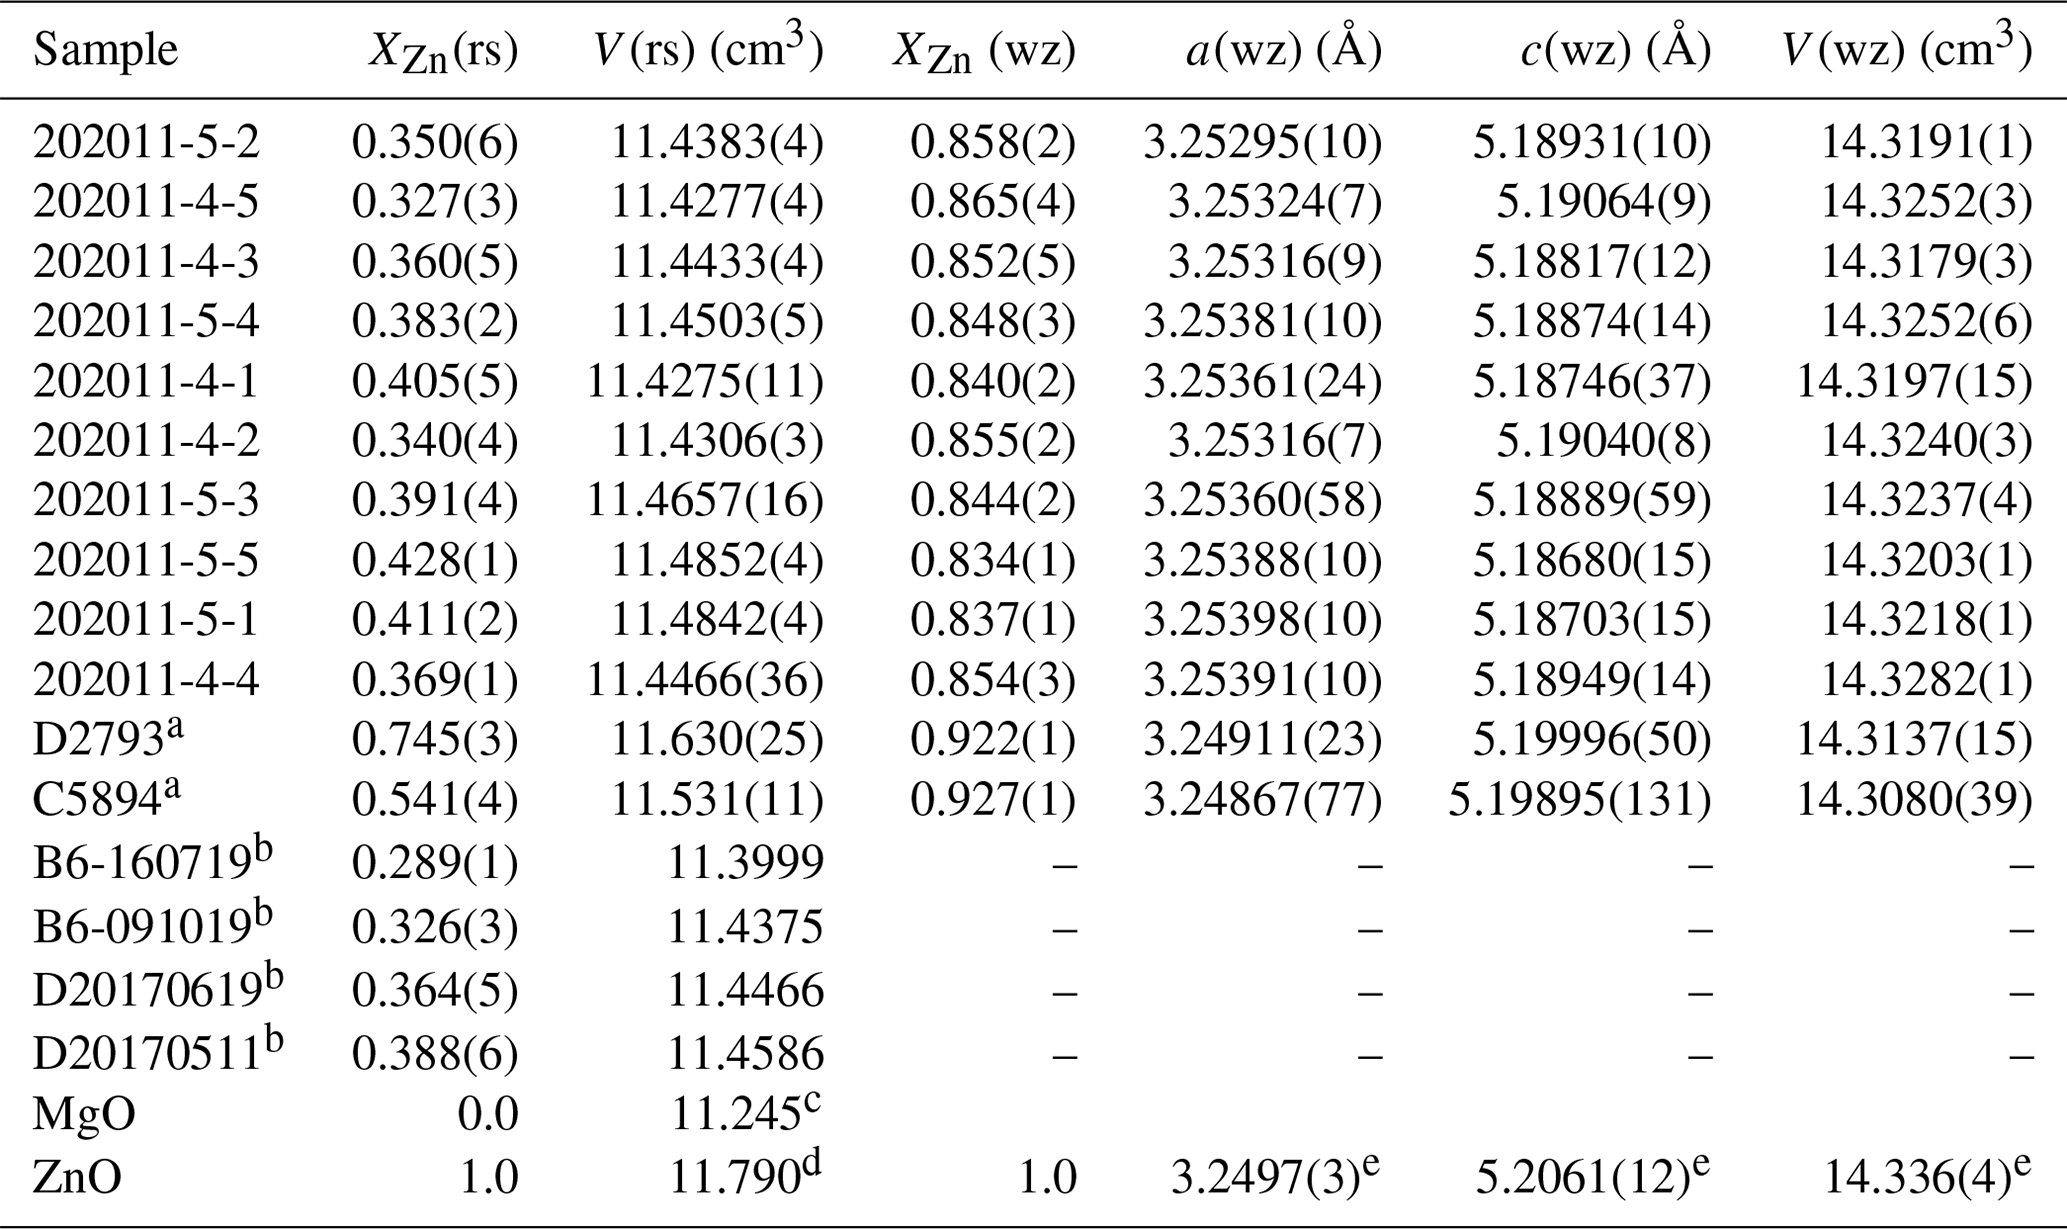
The molar volumes of the rock salt phase from the Rietveld refinements of the powder X-ray diffraction (XRD) measurements (Table 3, plotted in Fig. 6) fall on the straight line which intersects with the volume of endmember periclase (rs-MgO), which is very well known (e.g. Reeber et al., 1995). To quantify the excess volume of mixing and determine the molar volume of endmember rock salt ZnO (rs-ZnO), these data were fitted by weighted least squares to a three-term polynomial in composition:
Here describes the excess volume of mixing in the regular solution formalism. The fit returned cm3, with , assuming uncertainties in from Tables 1 and 2 and in volumes of 0.008 cm3 (propagated from σ(a0)=0.001 Å), except for endmember MgO, whose molar volume is known very precisely (σ=0.001 cm3). The small positive excess volume of mixing is within 2 standard deviations of zero, and as it is almost trivial in thermodynamic terms, it was assumed to be zero, which gave cm3. This value falls in the middle of previous determinations (summarized in Decremps et al., 2000, see also Kusaba et al., 1999), and we have used it in the thermodynamic modelling for internal consistency. Excess volumes of mixing are a manifestation of strain in a solid solution, in the absence of complexities like order–disorder between different crystal sites. The lack of a significant excess volume of mixing is therefore an indication that the excess enthalpies and entropies of mixing in the rock salt solution are small.
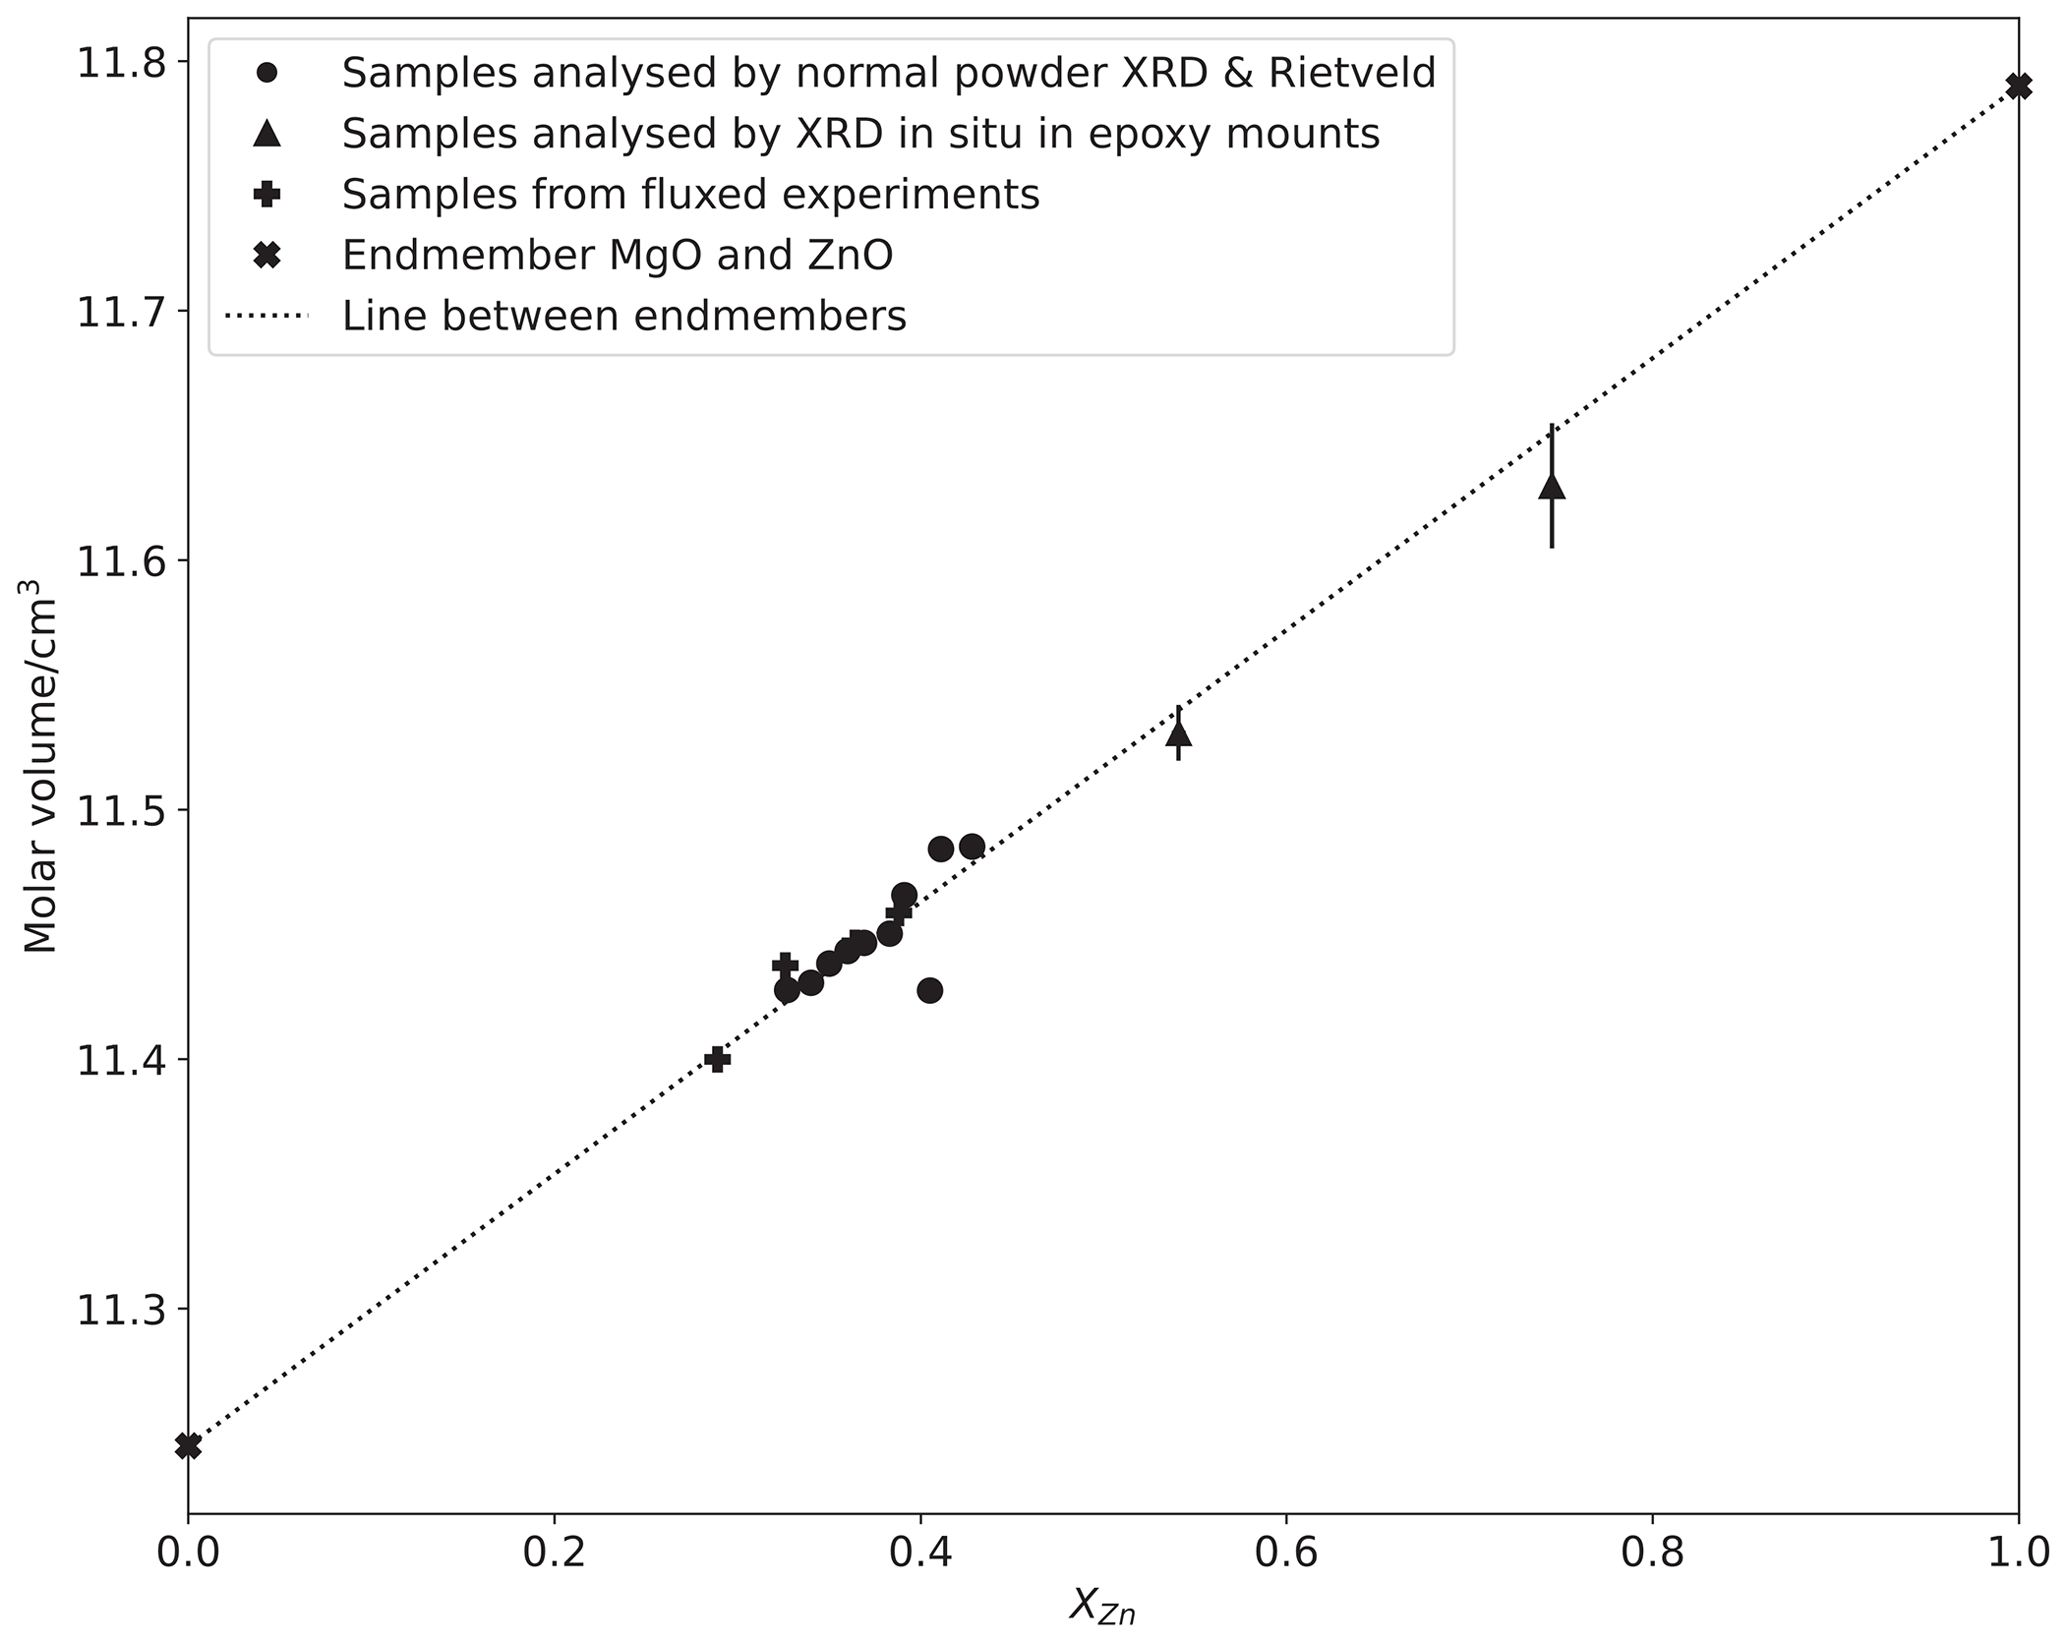
Figure 6Plot of rock salt unit cell volume measured by XRD against composition measured by EPMA, with the line showing a least-squares fit to the data using a two-term model (i.e. excess volume of mixing is zero). Error bars represent 1σ and are smaller than symbols for all composition data and all but two molar volumes, which are derived from measurements made of material in situ in sectioned Pt capsules in polished epoxy mounts (see text).
Table 3Molar volume of rock salt and dimensions of wurtzite solid solutions measured by XRD. a Samples analysed in situ in polished epoxy mounts. b Fluxed samples analysed by peak fitting (rather than Rietveld refinement), for which no uncertainty on rock salt volume has been estimated; see text for details. Endmember values are from c Reeber et al. (1995), d Kusaba et al. (1999) and e Reeber (1970) and references therein.
3.3.2 Wurtzite solid solution
The lattice parameters and volumes of mixing across the wurtzite solid solution are not so well constrained, because of the limited compositional range over which this phase is experimentally accessible. Calculations have suggested non-linear behaviour (e.g. Shimada et al., 2013; Djelal et al., 2017). Our results show a small decrease in the a0 lattice parameter with decreasing and a small increase in c0, resulting in almost constant molar volume. Ohtomo et al. (1998) observed the same in (Zn,Mg)O thin films grown epitaxially on polished sapphire crystals by pulsed laser deposition. This method can produce compositions with lower than those accessible at thermodynamic equilibrium. The fact that while conforms with expectations from the relative sizes of the ionic radii of Mg2+ and Zn2+ in tetrahedral versus octahedral coordination in oxide spinels (O'Neill and Navrotsky, 1983).
The compositions of the coexisting rock salt (rs) and wurtzite (wz) phases in the binary system MgO–ZnO are given by
where γ terms are activity coefficients relating solid solution composition to activity through relationships of the type , and ΔG0(T, P) is the change in Gibbs free energy for the wurtzite-to-rock-salt phase transition for either MgO or ZnO at temperature and pressure conditions (T and P).
The thermodynamic properties needed for this model can be divided up into three kinds: (1) the first-order quantities needed to evaluate (where M = Mg or Zn) for the four endmembers at standard-state conditions, namely, their enthalpies of formation, , their entropies, , and their molar volumes, ; (2) the second-order quantities for calculating from , namely heat capacities and equation-of-state (EoS) quantities (bulk moduli and thermal expansivities); and (3) activity–composition relations in the two solid solutions (the terms). For the heat capacities and EoS data, we have adopted the treatment of Holland and Powell (2011), which uses the same extended Maier–Kelley equation for heat capacities as their earlier work (Holland and Powell, 1998), while they introduced a modified Tait EoS augmented with a thermal pressure term, which produces a very similar result in the temperature–pressure range of interest here to their earlier and rather simpler choice of the Murnaghan EoS adjusted for temperature. As shown by Holland and Powell (2011), their new EoS reduces to their 1998 formalism with a few simplifying assumptions.
4.1 Thermodynamic quantities
The necessary thermodynamic quantities for the four endmembers are given in Table 4. For periclase (rock-salt-structured MgO: rs-MgO) and zincite (wurtzite-structured ZnO: wz-ZnO), both first- and second-order properties are well known. The properties of rs-MgO are taken from the ds62 version of Holland and Powell (2011), and references therein detailed in Table 4, while for wz-ZnO all except the EoS quantities are from Robie and Hemingway (1995), with thermal expansivity (α0) from Gadzhiev (2003), checked against experimental data in Iwanaga et al. (2000), and bulk modulus and its derivatives from Desgreniers (1998).
Table 4Data used for the thermodynamic model, including starting values and values fit using the thermodynamic model (bold), with 1σ uncertainty. Note that all data for rs-MgO are as they appear in Holland and Powell (2011); the sources of data cited therein are given here. Sources: (A) Robie and Hemingway (1995); (B) Richet and Fiquet (1991); (C) Dubrovinsky and Saxena (1997); (D) Hazen (1976) and Fei (1999);(E) average of rs-MgO and wz-ZnO; (F) as suggested in Holland and Powell (2011); (G) Robie et al. (1989); (H) Gadzhiev (2003), checked against experimental data in Iwanaga et al. (2000); (I) Desgreniers (1998); (J) extrapolation of measured rock salt solid solution molar volumes assuming ideality (see text); (K) Seko et al. (2005), corrected using wz-ZnO heat capacity (G) as described in the text; (L) Decremps et al. (2000).
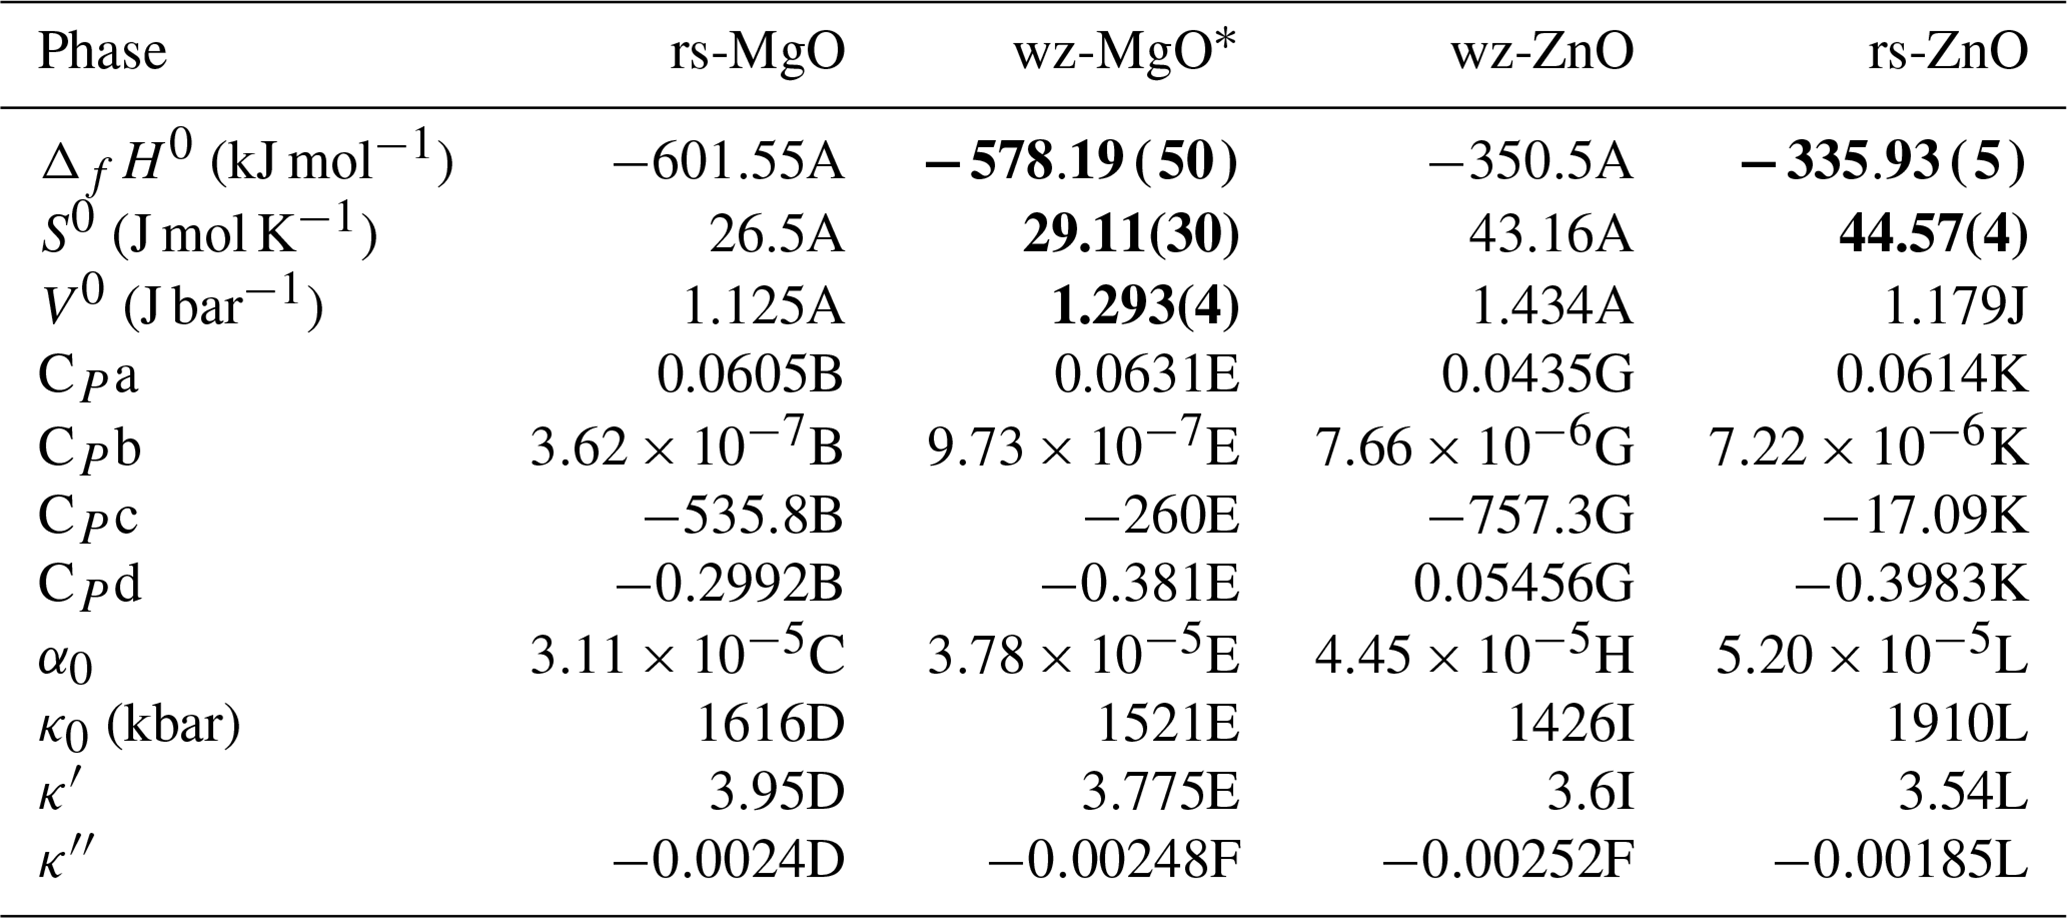
* The properties of wz-MgO are the partial molar values for MgO at low dilution in the wurtzite phase and should not be taken as applying to pure wz-MgO, which to our knowledge has not yet been synthesized.
For rs-ZnO the molar volume was taken to be that extrapolated from our XRD measurements, as this value is well constrained in our fitting and is consistent with previous determinations. The second-order properties such as bulk modulus and thermal expansion coefficient are from experimental observations using in situ XRD at high pressure and temperature (Decremps et al., 2000). The enthalpy and entropy of rs-ZnO are from the fitting, as the existing estimates necessarily relied on indirect methods, such as dissolution calorimetry of rock salt solid solution samples with XZn<0.5 (Davies and Navrotsky, 1981) or measurements of metastable nanocrystalline materials (Sharikov et al., 2017) in which surface free energy plays a significant role.
We were unable to locate any experimental data for the heat capacity of rs-ZnO, but some computational studies have addressed this issue (Seko et al., 2005; Alvarado et al., 2015). However, when the thermodynamic model is fit using rs-ZnO heat capacity values from Seko et al. (2005) and experimentally measured wz-ZnO heat capacity values (Robie et al., 1989), the wz-ZnO–rs-ZnO phase transition curves steeply due to the strong divergence of the heat capacity of wz-ZnO and the Seko et al. (2005) values for rs-ZnO heat capacity at high temperature. This is inconsistent with the experimental results of Kusaba et al. (1999), suggesting that the Seko et al. (2005) values for rs-ZnO heat capacity are incorrect.
Seko et al. (2005) and Alvarado et al. (2015) also model wz-ZnO heat capacity, but their values are far higher than experimental determinations (e.g. Robie et al., 1989), and the difference in modelled values for heat capacity between the two ZnO phases is lower than in the combined modelled and experimental dataset. Our adopted heat capacity for rs-ZnO has been corrected to account for this by determining the difference between modelled values for wz-ZnO and rs-ZnO and then adding this difference to the experimentally measured wz-ZnO data, which were then fit to the polynomial form used in Holland and Powell (2011).
None of the thermodynamic properties of wurtzite-structured MgO (wz-MgO) have been measured experimentally, as this endmember has no stability field in accessible pressure–temperature space and has to our knowledge never been synthesized. Theoretically based calculations do not achieve the accuracy needed for phase equilibrium modelling even for first-order properties like molar volumes, which may be demonstrated by comparing the results of such calculations for such well-studied substances as rs-MgO and wz-ZnO against experimental measurements (e.g. Schleife et al., 2006; see their Table 1). The second-order properties of wz-MgO were therefore estimated by taking an average of rs-MgO, which has the same composition, and wz-ZnO, which is similar in structure.
4.2 Activity–composition relations
The small difference between the molar volumes of rs-MgO and rs-ZnO suggests that mixing in the rock salt solid solution may be close to ideal, so it was parameterized in the simplest way, as a regular solution (i.e. ). For the wurtzite solid solution, the ZnO component is in or at least close to the Raoult's law region in the compositional range accessed in the experiments, while the MgO component will be close to the Henry's law region, where excess partial molar quantities approach constant values. These are conveniently handled by changing the standard state to the “infinite dilution” convention that is often used for dilute solutes in aqueous chemistry or metallurgical alloys. With this convention, both and are defined as 1. In any case, the less dense, more open structure of the wurtzite solid solution may accommodate strain due to volume mismatch more readily, while the almost constant molar volume (but see below) would imply no strain anyway.
4.3 Fitting phase equilibrium results to the thermodynamic model
In addition to the unknown thermodynamic quantities, the friction correction factors (f) relating sample pressure to nominal pressure (, , etc.) are included in the model. These correction factors are necessary, given that the only experimental data for which pressure is unambiguously known are from ambient-pressure experiments.
The model was optimized by χ2 minimization:
The compositional variables and were weighted with the standard deviations in Tables 1 and 2 or with 0.002, whichever is larger. The rounding up accounts for additional contributions to the reported uncertainties from factors like instrument variability between sessions and avoids privileging any one experiment with an excessive weight. The value of s(P) in the high-pressure experiments was taken as 0.03 GPa. This amounts to only 1 % at 3 GPa and is based on the typical variations in piston travel and oil pressure during experiments lasting 24 h or longer.
The first stage of fitting was conducted by minimizing the weighted sum of squares of residuals using the “Solver” function in Microsoft Excel. Preliminary fitting revealed a gentle topography to the χ2 value in parameter space, reflecting strong correlations among some of the parameters. Additional information is required to discriminate between fits of almost equal probability, and this is best supplied by the P–T curve of the univariant wz-ZnO–rs-ZnO phase equilibrium data. Of the several determinations reported in the literature, that of Kusaba et al. (1999) stands out as the only one to give quantitative results based on experimental observations that recognized the problems of achieving thermodynamic equilibrium. Moreover, pressures in their experiments were calibrated in situ using NaCl, and hydrostatic conditions were ensured by using a fluid (a 4 : 1 methanol ethanol mixture sealed in an aluminium–copper capsule). While being broadly similar in most respects, the position of the univariant curve illustrated by Decremps et al. (2000) in their Fig. 3 is systematically higher in pressure by 0.6 to 0.7 GPa.
Only fits with combined with values of near zero were consistent with the univariant curve of Kusaba et al. (1999). The model was therefore simplified by fixing and at zero and specifying that all three correction factors for piston out should take the same value; this left seven parameters to be refined. A further constraint was then imposed based on the univariant curve of Kusaba et al. (1999) across the temperature range that they studied (500–900 ∘C).
For the initial fitting using the Solver function in Excel, this was implemented in terms of ΔG for the reaction rs-ZnO = wz-ZnO at 100 ∘C intervals on the univariant curve of Kusaba et al. (1999) from 500 to 900 ∘C (five values), which would be zero if the model was completely consistent with the curve. We set a constraint that the sum of squares of ΔG must be less than or equal to 10 000, corresponding to a maximum discrepancy of ∼ 0.01 GPa at each point on the univariant curve. Our best fit (χ2 minimum) returned a value for the sum of squares of ΔG that was well within this range (∼ 8700), indicating a set of thermodynamic quantities and friction correction factors that is consistent with both our experimental pressure–composition and temperature–composition data, as well as the phase transition measured by in situ XRD by Kusaba et al. (1999). Furthermore, the fit value of fin for the in. assembly (5.3 %; see Table 5) is similar to the 5 % found by Condamine et al. (2022), who used a series of well-studied univariant reactions to calibrate pressure in the piston–cylinder apparatus.
Table 5Matrix of correlation coefficients (italics) for the thermodynamic model derived from the MCMC algorithm (see Fig. 7) with best-fit values and their 1σ uncertainties (bold).
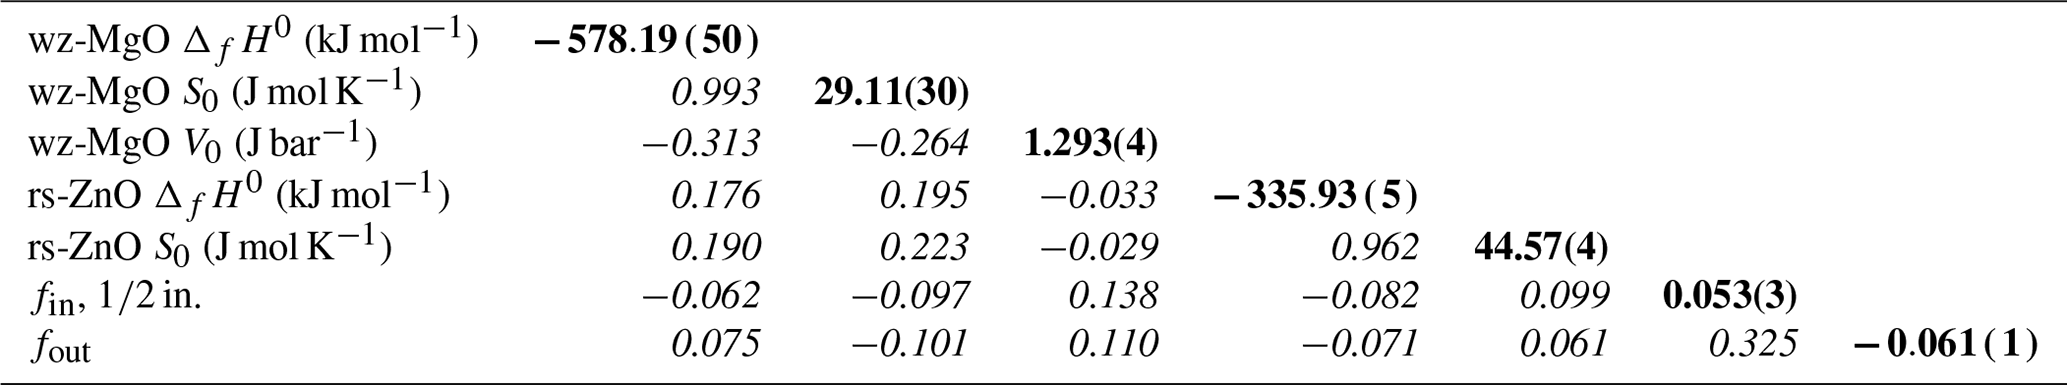
fin for and in. assemblies is constrained to be 0.
To quantify the uncertainty on each parameter and the correlations between parameters, the model was then refit using a Markov chain Monte Carlo (MCMC) algorithm as implemented in the Python library “emcee” (Foreman-Mackey et al., 2013). The MCMC algorithm uses an iterative approach to randomly move to different values in parameter space and accept or reject new values based on the calculated probability function (Metropolis and Ulam, 1949; Hastings, 1970; Goodman and Weare, 2010). The positions of the algorithm are recorded, and when a large number (∼ 106) of samples are taken, these values represent the posterior distribution of the probability function. Due to the use of randomness in the sampling algorithm and the large number of samples, this method is far more resilient to the false minima problems that affect conventional least-squares algorithms, which is useful in validating our initial calculation.
In the MCMC fitting, we incorporated the additional constraint of the univariant transition curve of Kusaba et al. (1999) in a more sophisticated way than in the χ2 fitting: rather than constraining modelled parameters to an arbitrary increment of the wz-ZnO–rs-ZnO (Ptr ZnO) curve, we added this to the probability function. For each set of modelled parameters (i.e. each set of modelled ΔfH0 and S0 for rs-ZnO), Ptr ZnO was calculated at 100 ∘C intervals in the temperature range studied by Kusaba et al. (1999; 500–900 ∘C), and the difference between this pressure and that of Kusaba et al. (1999) was calculated. Kusaba et al. (1999) did not specify uncertainty for their values, so we adopted a value for s(PKusaba) of 0.2 GPa. This is comparable to uncertainty estimates of pressure calculated using in situ diffraction in comparable experiments (Beyer et al., 2018), although uncertainty in pressure and temperature measured by in situ diffraction in DIA-type multi-anvil apparatus can be greater than this (Farmer et al., 2020).
The full probability function, expressed as natural logarithm of probability (ln (p)) is as follows:
The model was run for 10 000 iterations, each of which contained 100 samples of the probability distribution, and converged on values for each of the fit parameters that are close to, but not identical to, those of the least-squares model. Histograms of the posterior distribution for each value and scatter/intensity plots of the correlation between each parameter (Fig. 7) show that the uncertainty of each parameter in the model (given in Table 5) is approximately normally distributed. Outside of the peak ranges of the histograms, there are some deviations from the perfectly Gaussian distribution (i.e. the covariance plots in Fig. 7 do not look like a perfect bullseye). This illustrates the complex topography of the probability distribution of the modelled parameters, with numerous possible solutions of approximately equal probability, and vindicates the inclusion of the additional constraints to the univariant curve.
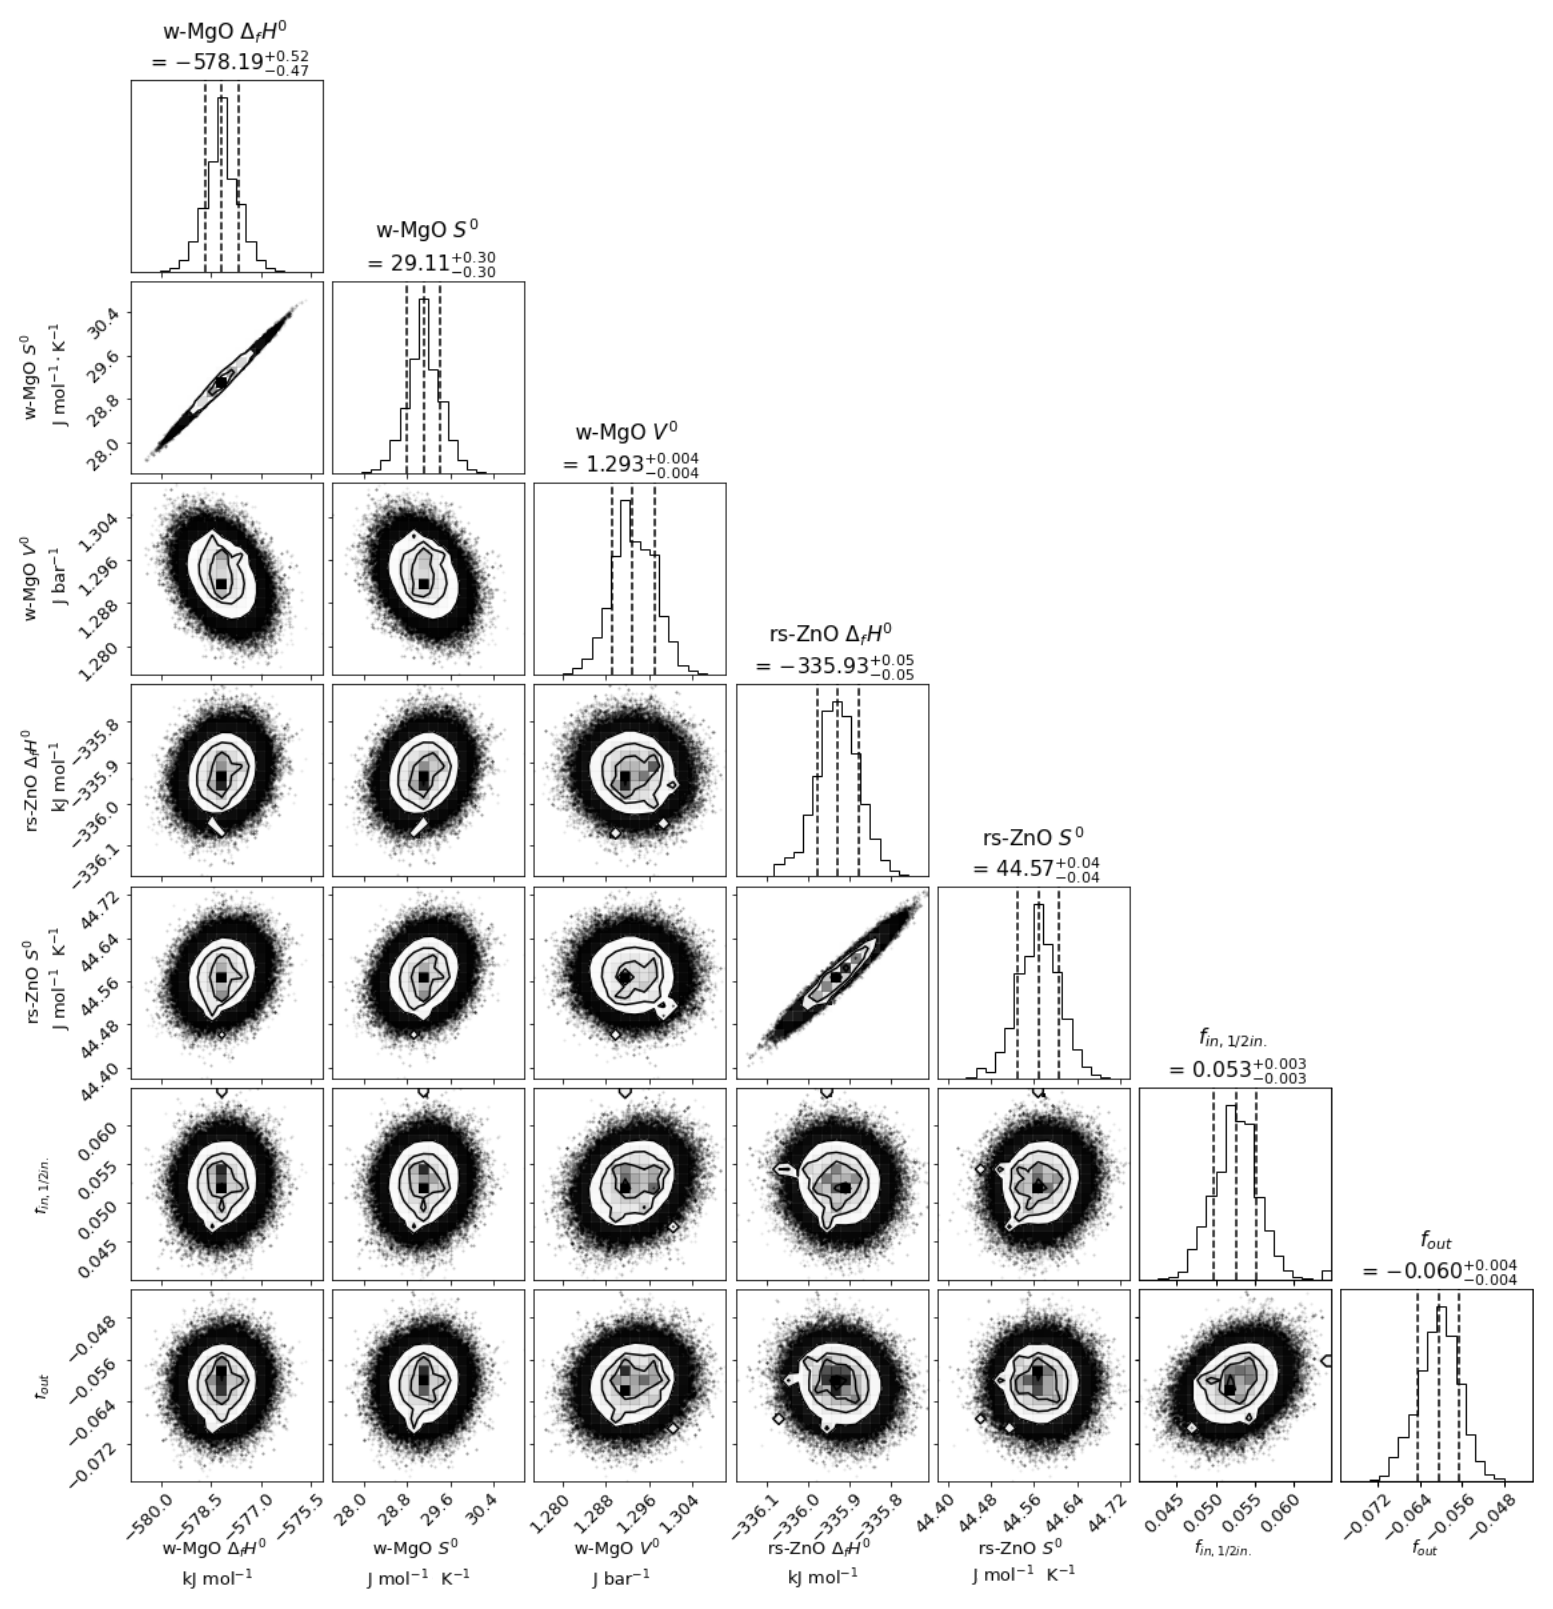
Figure 7Corner plot consisting of histograms showing the posterior distribution of each modelled parameter, with scatter/gradient plots showing correlation between parameters. Dashed lines denote 16th, 50th, and 84th percentile values. Most probable parameter values and their 68 % confidence intervals (approximately equivalent to ±1 s for a normal distribution) are given above each histogram.
The strong positive correlations between enthalpy and entropy for both wz-MgO and rs-ZnO (0.993 and 0.962 respectively) may seem surprising considering the large temperature range covered by the experiments (∼ 700 ∘C) but reflect the tight precision required of these quantities to fit the observations. The negative correlations between the properties of rs-ZnO and the piston–cylinder correction factors (∼ −0.5) illustrate the desirability of having additional observations to confirm the pressure calibration.
4.4 Calculated phase diagrams
The results of this model have been used to construct calculated phase diagrams describing the MgO–ZnO binary. Calculated T–X relations at 1 bar closely fit experimental data (Fig. 1), as do high-pressure P–X relations (Fig. 2). T–X relations at 3 GPa calculated using this model (Fig. 1) show that, compared to 1 bar T–X relations at equivalent temperature, the miscibility gap is narrower and both phases have higher XZn. At high pressure the composition of wurtzite is almost constant with temperature, while rock salt composition shows even greater than at 1 bar.
The topology of T–X relations at 1 bar does not show either the pronounced curvature with increasing at high temperature suggested in some older studies (Segnit and Holland, 1965; Raghavan et al., 1991) or the opposite curvature with greater change in XZn at low temperature modelled using the MTDATA program and MTOX 8.1 database by Xia et al. (2016). As mentioned above, the discrepancy between these data and the results of Xia et al. (2016) is likely due to slow reaction kinetics at low temperature in the absence of a flux and due to evaporation of Zn in their high-temperature experiments. Our experimental data are also in good agreement with Abdeyazdan et al. (2024), who avoided this evaporation problem with experiment durations as short as 8 min for experiments at 1450 ∘C and the use of high PbO melt as a flux.
5.1 Thermodynamic equilibrium
With starting mixtures of MgO(rs) and ZnO(wz) there is no nucleation barrier to achieving equilibrium in the subsolidus two-phase region of the MgO–ZnO phase diagram; instead the question is how closely the measured compositions of the phases approach equilibrium, given that the rate-limiting factor is solid-state diffusion. Performing what have inappropriately been termed “reversals” of the type needed to address nucleation barriers (e.g. Fyfe, 1960) is pointless in such circumstances, not least because so-called reversals do not necessarily converge on the equilibrium state from different directions, as discussed by Pattison (1994) and Girnis et al. (2003). The equilibration problems addressed in these studies arise when diffusion is slow compared to experimental length scales (xexp) and timescales (texp); that is, D is small compared to . This is not the case in the present study. Diffusion of Zn in rs-MgO is sufficiently fast that for the experimental timescale texp of 122 h for the lowest ambient-temperature experiment without flux of 1150 ∘C (see Table 1), xexp, is 15 µm (Wuensch and Vasilos, 1965). Self-diffusion of Zn in wz-ZnO is similar or faster, as are the tracer diffusion coefficients of a range of other 2+ cations; see Tomlins et al. (2000), Koskelo et al. (2010), and references therein. Diffusion timescales provide only upper limits to equilibration times, which are expected to be much shorter due to recrystallization and grain growth – obvious features in all experiments (see Fig. 4). Even at 800 ∘C, the lowest temperature investigated in the piston–cylinder experiments, conspicuous grain growth is apparent. Such grain growth may be facilitated by the intergranular fluid (Dohmen et al., 1998), whose effectiveness in this system is anticipated from the high vapour pressure of Zn. To our knowledge, no process has been proposed that could produce homogeneous coexisting crystalline phases that were not in thermodynamic equilibrium in these circumstances. On the other hand, diffusion would not be fast enough to affect compositions in the PbF2-fluxed experiments during cooling.
In addition to the lack of discernible zoning in even the largest crystals in the run products, other criteria for assessing equilibration are the consistency of the results from one T–P condition to another and the internal consistency of all data with the simple thermodynamic model of Sect. 4.
5.2 Thermodynamic properties of rock-salt-structured ZnO
The enthalpy of the wurtzite–rock-salt transition in ZnO (ΔtrHo), and by extension ΔfHo for rs-ZnO, has been the subject of some disagreement in the literature (Leitner et al., 2013). Our result from the phase diagram modelling gives −14.57(5) kJ mol−1 – in between the two calorimetric determinations but agreeing with neither. Davies and Navrotsky (1981) determined by high-temperature oxide solution calorimetry, with the heat of solution of ZnO(rs) estimated by extrapolating the heats of solution of ZnO–NiO solutions stable at atmospheric pressure to the ZnO endmember. They reported a value of −24.5 kJ mol−1 at 970 K, which gives −23.5 kJ mol−1 at 298 K using the heat capacities in Table 4. The uncertainty was given as 3.6 kJ mol−1, which is 1 standard deviation. The extrapolation was predicated on a large negative excess enthalpy of mixing in ZnO–NiO ( kJ mol−1), but the heats of solution could be fitted almost as well with , in which case would be −17.1 kJ mol−1. Sharikov et al. (2017) obtained kJ mol−1 directly by solution calorimetry in sulfuric acid but on nanocrystalline materials. Zhang et al. (2007) have shown that the enthalpy of solution of nanocrystalline wz-ZnO varies by several kilojoules per mole (kJ mol−1) according to the molar surface area. Whether the surface enthalpies of the nanocrystalline wz-ZnO and rs-ZnO used in this calorimetry were the same, and therefore cancelled out, is not clear.
5.3 The mystery of the partial molar volume of wz-MgO
More disconcerting but at the same time intriguing is the huge discrepancy between for wz-MgO measured by extrapolation of the measured lattice parameters (∼ 14.3 cm3) and that required to fit the phase diagram (12.93(4) cm3). To be rigorous, for wz-MgO also depends on the estimated second-order quantities in the EoS like the bulk modulus, which are only estimates, but the discrepancy is so large that changing these within physical feasibility could provide only a minor part of the explanation. The value of 14.3 cm3 for for wz-MgO from the XRD lattice parameter measurements would predict a rapid collapse of the MgO content of the wurtzite limb of the miscibility gap with increasing pressure – nowhere near to what is observed. Clearly something highly unusual is going on.
An explanation may lie with a substantial fraction of Mg2+ substituting by the Frenkel mechanism into the otherwise vacant octahedrally coordinated interstices in the wurtzite crystal structure. The wurtzite structure is based on hexagonal close packing (hcp) of the oxygen anions, with the anion sublattice defining interstices into which the cations substitute to meet the requirements of charge balance. In wz-ZnO, half of the tetrahedrally coordinated interstices are filled by the Zn2+ cations. An hcp lattice also contains octahedrally coordinated interstices – half as many as the tetrahedral interstices. The NiAs structure (B81) results when all of these are filled by cations, with all the tetrahedral interstices left empty. This structure is even denser than rock salt (e.g. Navrotsky and Davies, 1981), although it is not usually realized in oxides because it produces short metal–metal distances along the c axis. Nevertheless, the inherent density of the NiAs structure suggests the possibility that Mg2+ hopping into the octahedral interstices lowers the partial molar volume of the MgO component, while increasing its partial molar entropy.
The details of this proposal are as follows. Both the wurtzite and NiAs structures can be viewed as slight distortions of a theoretical aristotype in which the anion lattice has the idealized hcp geometry, requiring the unit cell, with two formula units, to have . In this idealization, if the anions are assigned to the equipoints (0, 0, 0) and (, , ), the tetrahedral cations (Zn2+) would occupy the equipoints (0, 0, ) and (, , ), with the octahedral interstices at (, , ) and (, , ). Each tetrahedral Zn2+ cation is surrounded by three octahedral interstices and one vacant tetrahedral interstice, all oriented in the antibonding directions of the Zn2+-O bonds (Kihara and Donnay, 1985). Our proposal is that some of the Mg2+ substituting for Zn2+ may disorder into one of these octahedral interstices. The tetrahedral–octahedral metal–metal distance would be 2.74 Å assuming a=3.25 Å, which is short but not excessively so. The cation–cation distance along the c axis in the NiAs structure with this unit cell dimension would be 2.65 Å, while, for comparison, the Mg2+-Mg2+ distance in the spinel polymorph of Mg2SiO4 (synthetic ringwoodite) is 2.85 Å (Sasaki et al., 1982). The distortion from a spherical charge distribution about Zn2+ caused by sp3 hybridization (the reason for ZnO favouring the wurtzite structure in the first place) would also lessen the electrostatic repulsion. Meanwhile, the partial molar entropy of wz-MgO would be augmented by three factors: (1) configurational entropy depending on the fraction of the Mg2+ cations displacing to the octahedral interstices, (2) configurational entropy from the multiplicity of the interstices (three around each tetrahedral cation site), and (3) vibrational entropy from the large size of the octahedral interstices. Without local lattice distortion, the six Mg2+-O2− distances in a filled interstice would be 2.30 Å, which is substantially greater than the 2.115 Å found for the octahedral Mg2+-O2− distance in oxide spinels (O'Neill and Navrotsky, 1983). Local contraction of the lattice around the octahedral Mg2+ would then contribute to the low partial molar volume of wz-MgO. The extra entropy explains why the partial molar entropy of wz-MgO is larger than the molar entropy of rs-MgO, whereas the molar entropy of wz-ZnO is smaller than that of rs-ZnO (Table 4). The proposed Mg2+ disordering should hardly affect the thermodynamic properties of the ZnO component of the wurtzite phase, as these are in, or close to, the Raoult's law region in the compositional range of interest to the phase diagram. On the other hand, the partial molar quantities derived for wz-MgO listed in Table 4 would give a misleading impression of the thermodynamic properties of pure endmember wz-MgO. Maintaining a local charge balance favours an octahedral Mg2+ cation being located next to a vacant tetrahedral site, which then allows for rapid re-ordering on cooling. The Frenkel defects stable at high temperatures and pressures may then be unquenchable on normal experimental timescales, accounting for the lattice parameters of the solid solution measured at room temperature (Table 3) being consistent with straightforward substitution of Mg2+ for Zn2+ in the usual tetrahedral sites.
Against this hypothesis, high-temperature, ambient-pressure transport properties in pure ZnO do not appear consistent with Frenkel interstitials (Tomlins et al., 2000), nor does tracer diffusion of other divalent cations (e.g. Koskelo et al., 2010, and references therein). A more direct test would be precise lattice parameter measurements of MgO-doped wz-ZnO in situ and at high temperatures and pressures. The low energy of the Mg K edge makes in situ X-ray absorption spectroscopy impractical experimentally, but if Co2+ or Ni2+ was to show the same behaviour, an in situ X-ray absorption spectroscopy (XAS) investigation of Ni2+- or Co2+-doped wz-ZnO would be illuminating. Optical spectroscopy of Co2+-doped wz-ZnO at room temperature did not reveal any Co2+ in octahedral coordination (Pepe et al., 1975), but this would be expected if the disordering is unquenchable.
The limiting factor for the accuracy of the thermodynamic model presented here is the necessity to bootstrap the piston–cylinder pressure corrections. The key item validating these corrections is the P–T curve of the univariant phase transition in endmember ZnO. Our model agrees well with the equation for this univariant curve given by Kusaba et al. (1999), which summarized their in situ, synchrotron-mediated measurements. But their results disagree by more than experimental uncertainty with those from the similar experiments of Decremps et al. (2000). If it were feasible to determine this transition in situ, with improved precision and calibrated against the state-of-the-art internal standards (e.g. NaCl, MgO, Pt, Au), that would be most valuable in ascertaining the reliability of the model. Another improvement would come from mid-range pressure experiments in gas-media apparatuses, which avoid the friction correction required by the piston–cylinder. These would fill in the gap in pressure between our ambient-pressure and our piston–cylinder results. It should be noted that we have avoided addressing the age-old problem of accounting for the effect of pressure on thermocouples in solid-media devices (e.g. Getting and Kennedy, 1970), worrying about which has dropped out of fashion, but it still remains a hurdle to achieving accuracy.
Combining the experiments reported here with the thermodynamic model resolves many of the discrepancies and inconsistencies in the literature but reveals anomalies in the partial molar quantities of wz-MgO that are required to fit the phase diagram. Having a well-determined phase diagram for this iconic B1-to-B4 phase transition sets up a target for testing computational methods, which might also shed light on the wz-MgO anomalies. The use of MgO–ZnO ceramics as pressure–temperature sensors will be presented elsewhere.
A1 PENEPMA modelling
In order to test whether EPMA analyses of small Mg-rich rock salt grains surrounded by Zn-rich wurtzite could be affected by secondary fluorescence of Zn, modelling was carried out in PENEPMA (Llovet and Salvat, 2017) using the interface provided in the “Standard” program packaged with CalcZAF (Armstrong et al., 2013).
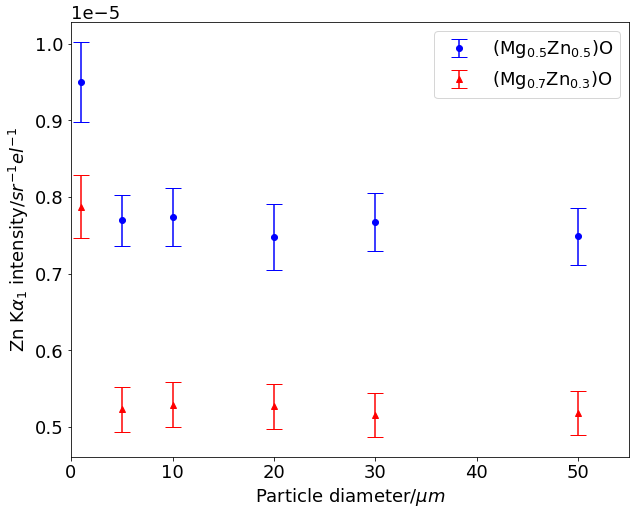
Figure A1Zn Kα1 intensity determined using PENEPMA for rock salt spheres of different diameters surrounded by 95 mol. % ZnO wurtzite. Error bars show 3σ uncertainty reported by PENEPMA.
Table A1Results of EPMA analysis of the same materials using Zn Kα and Lα emission lines, with standard deviation.
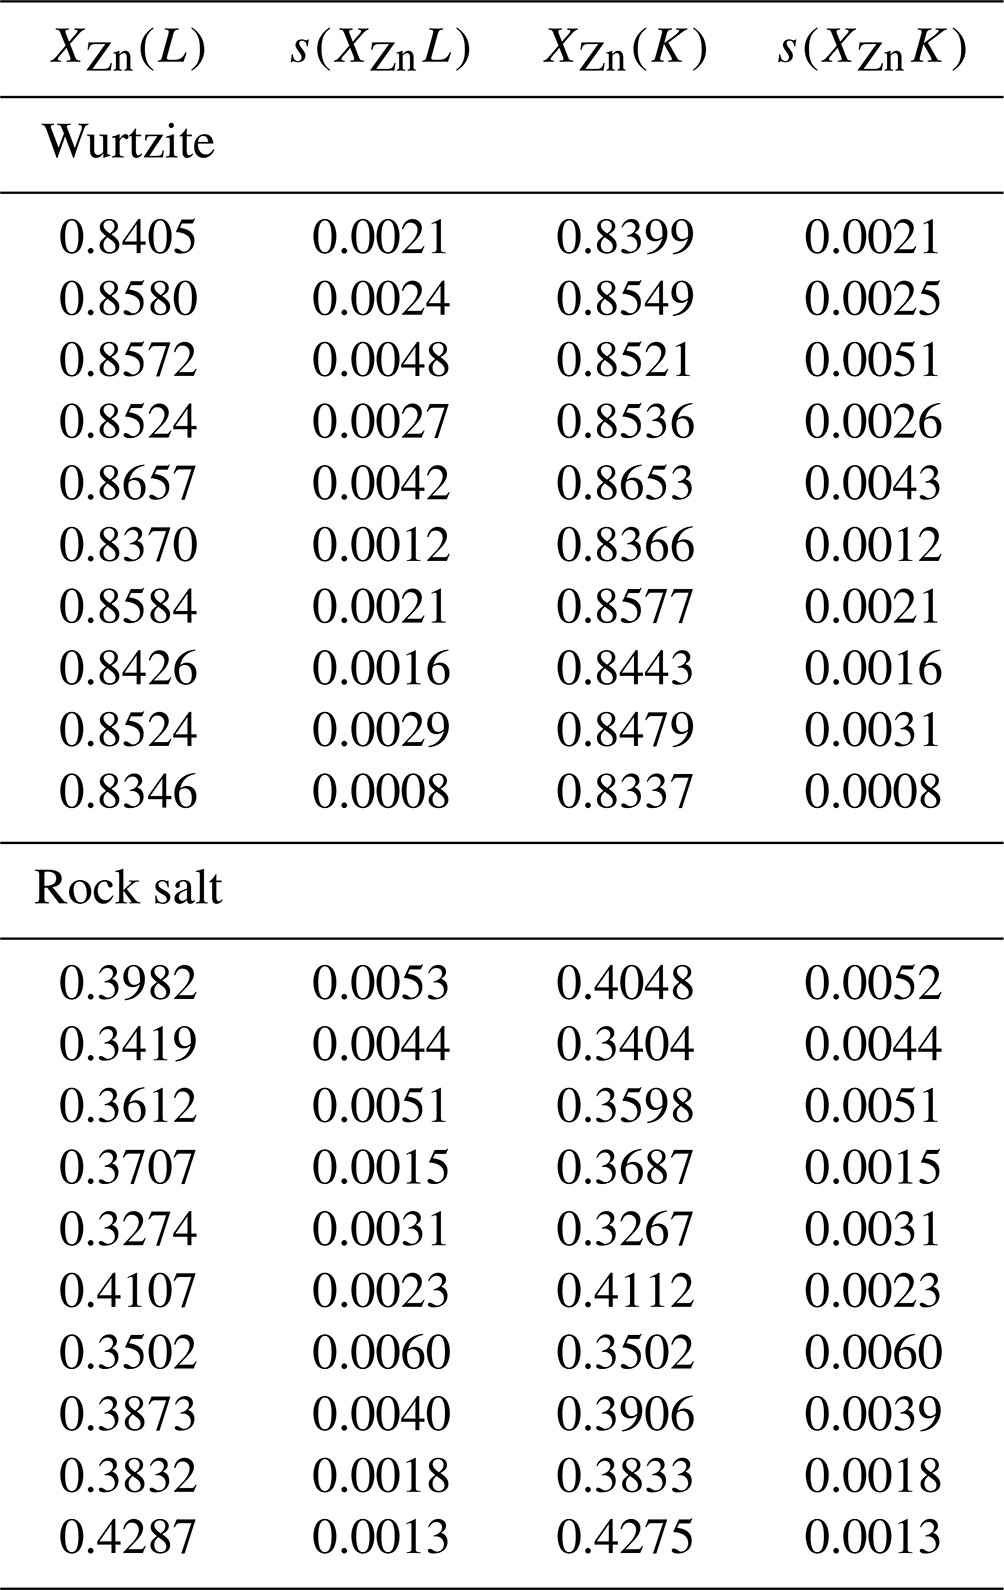
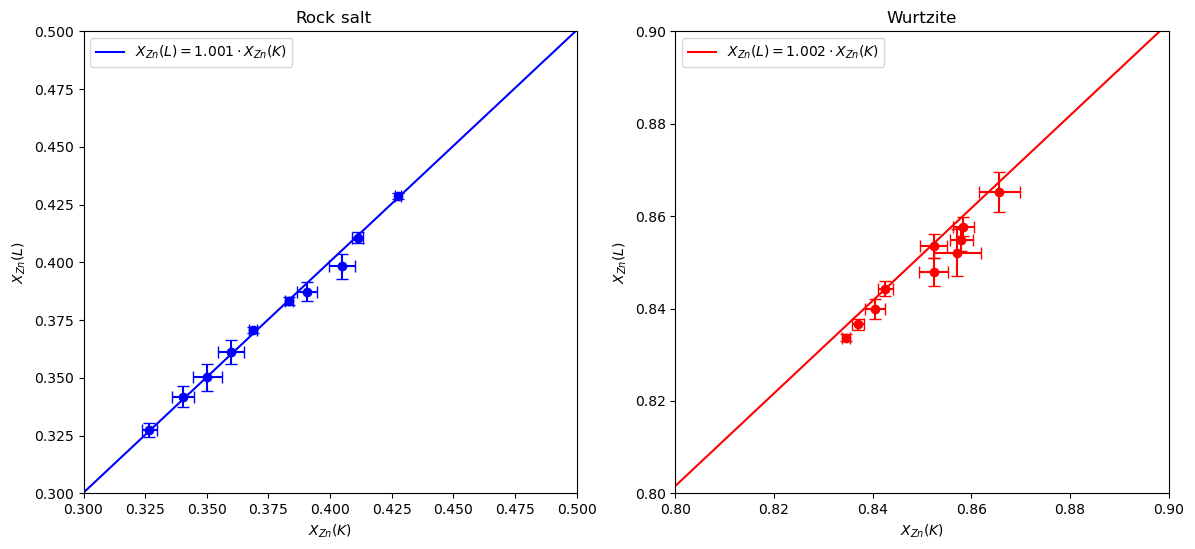
Figure A2EPMA analyses of rock salt and wurtzite using Zn Kα and Lα emission lines, with the fit polynomial () shown as a line. Fit standard deviation for a is smaller than the plotted line for both rock salt and wurtzite.
The model geometry comprised a sphere of rock salt in a matrix of more Zn-rich wurtzite. Two compositions of rock salt were considered, with Mg0.7Zn0.3O approximating products of low-temperature ambient-pressure experiments and Mg0.5Zn0.5O approximating products of high-pressure piston–cylinder experiments. The composition of the surrounding wurtzite phase was fixed at Mg0.1Zn0.9O in both cases.
The diameter of the sphere was varied in several increments between 1 and 50 µm, with all other parameters consistent between model runs, namely accelerating voltage set to 15 kV, a take-off angle of 40∘, and a beam diameter of 1 µm approximating the conditions of the EPMA instrument. The model was run for 20 min for each sphere size. An annular detector (360∘) geometry was used, assuming that X-ray trajectories will have no horizontal variation as the model geometry is axially symmetric.
Compared to the largest sphere diameter of 50 µm, smaller grain sizes show no increase in Zn Kα1 intensity (i.e. no secondary fluorescence of Zn from wurtzite) in particles of 5 µm or above. A marked increase in Zn intensity is observed in both models for particles 1 µm in size.
The results of this modelling show that rock salt grains of 10 µm diameter are of sufficient size for EPMA analysis at 15 kV without significant additional Zn Kα flux due to self-absorption or excitation of Zn in wurtzite surrounding analysed rock salt. In practice, the largest grains were targeted for EPMA analysis, and in most experiments only grains larger than 20 µm were analysed.
A2 Analysis of Zn Kα vs. Lα emission lines
As an additional check that the analyses were not affected by secondary X-ray fluorescence, 10 of the 1 atm experiments were re-analysed using the Lα emission line for Zn. The same standards were used, which is important (e.g. Llovet et al., 2022), and an accelerating voltage of 15 kV with a probe current of 20 nA was used, with a the electron beam set to 0.1 µm diameter. As for Kα analyses, the Pouchou and Pichoir XPP (simplified PAP) matrix correction was used (Pouchou et al., 1990), as implemented in the JEOL software. The results are compared to Kα analyses in Table A1.
To quantify the agreement between Kα and Lα analyses, the two sets of analyses were compared by least-squares fitting to the equation:
where a is a constant. The fit assumed uncertainties in both variables, with the data weighted according to the standard deviations in Table A1. For wurtzite analyses a=1.001(1) and for rock salt analyses a=1.002(3), which reduced χ2 values of 0.38 and 0.28 respectively. These low values are likely due to weighting with standard deviations rather than the standard errors of the mean. Nevertheless, they indicate that the standard deviations are not unreasonable estimates of experimental uncertainty.
A3 X-ray diffraction
Representative examples of diffraction patterns can be found in Fig. A3.
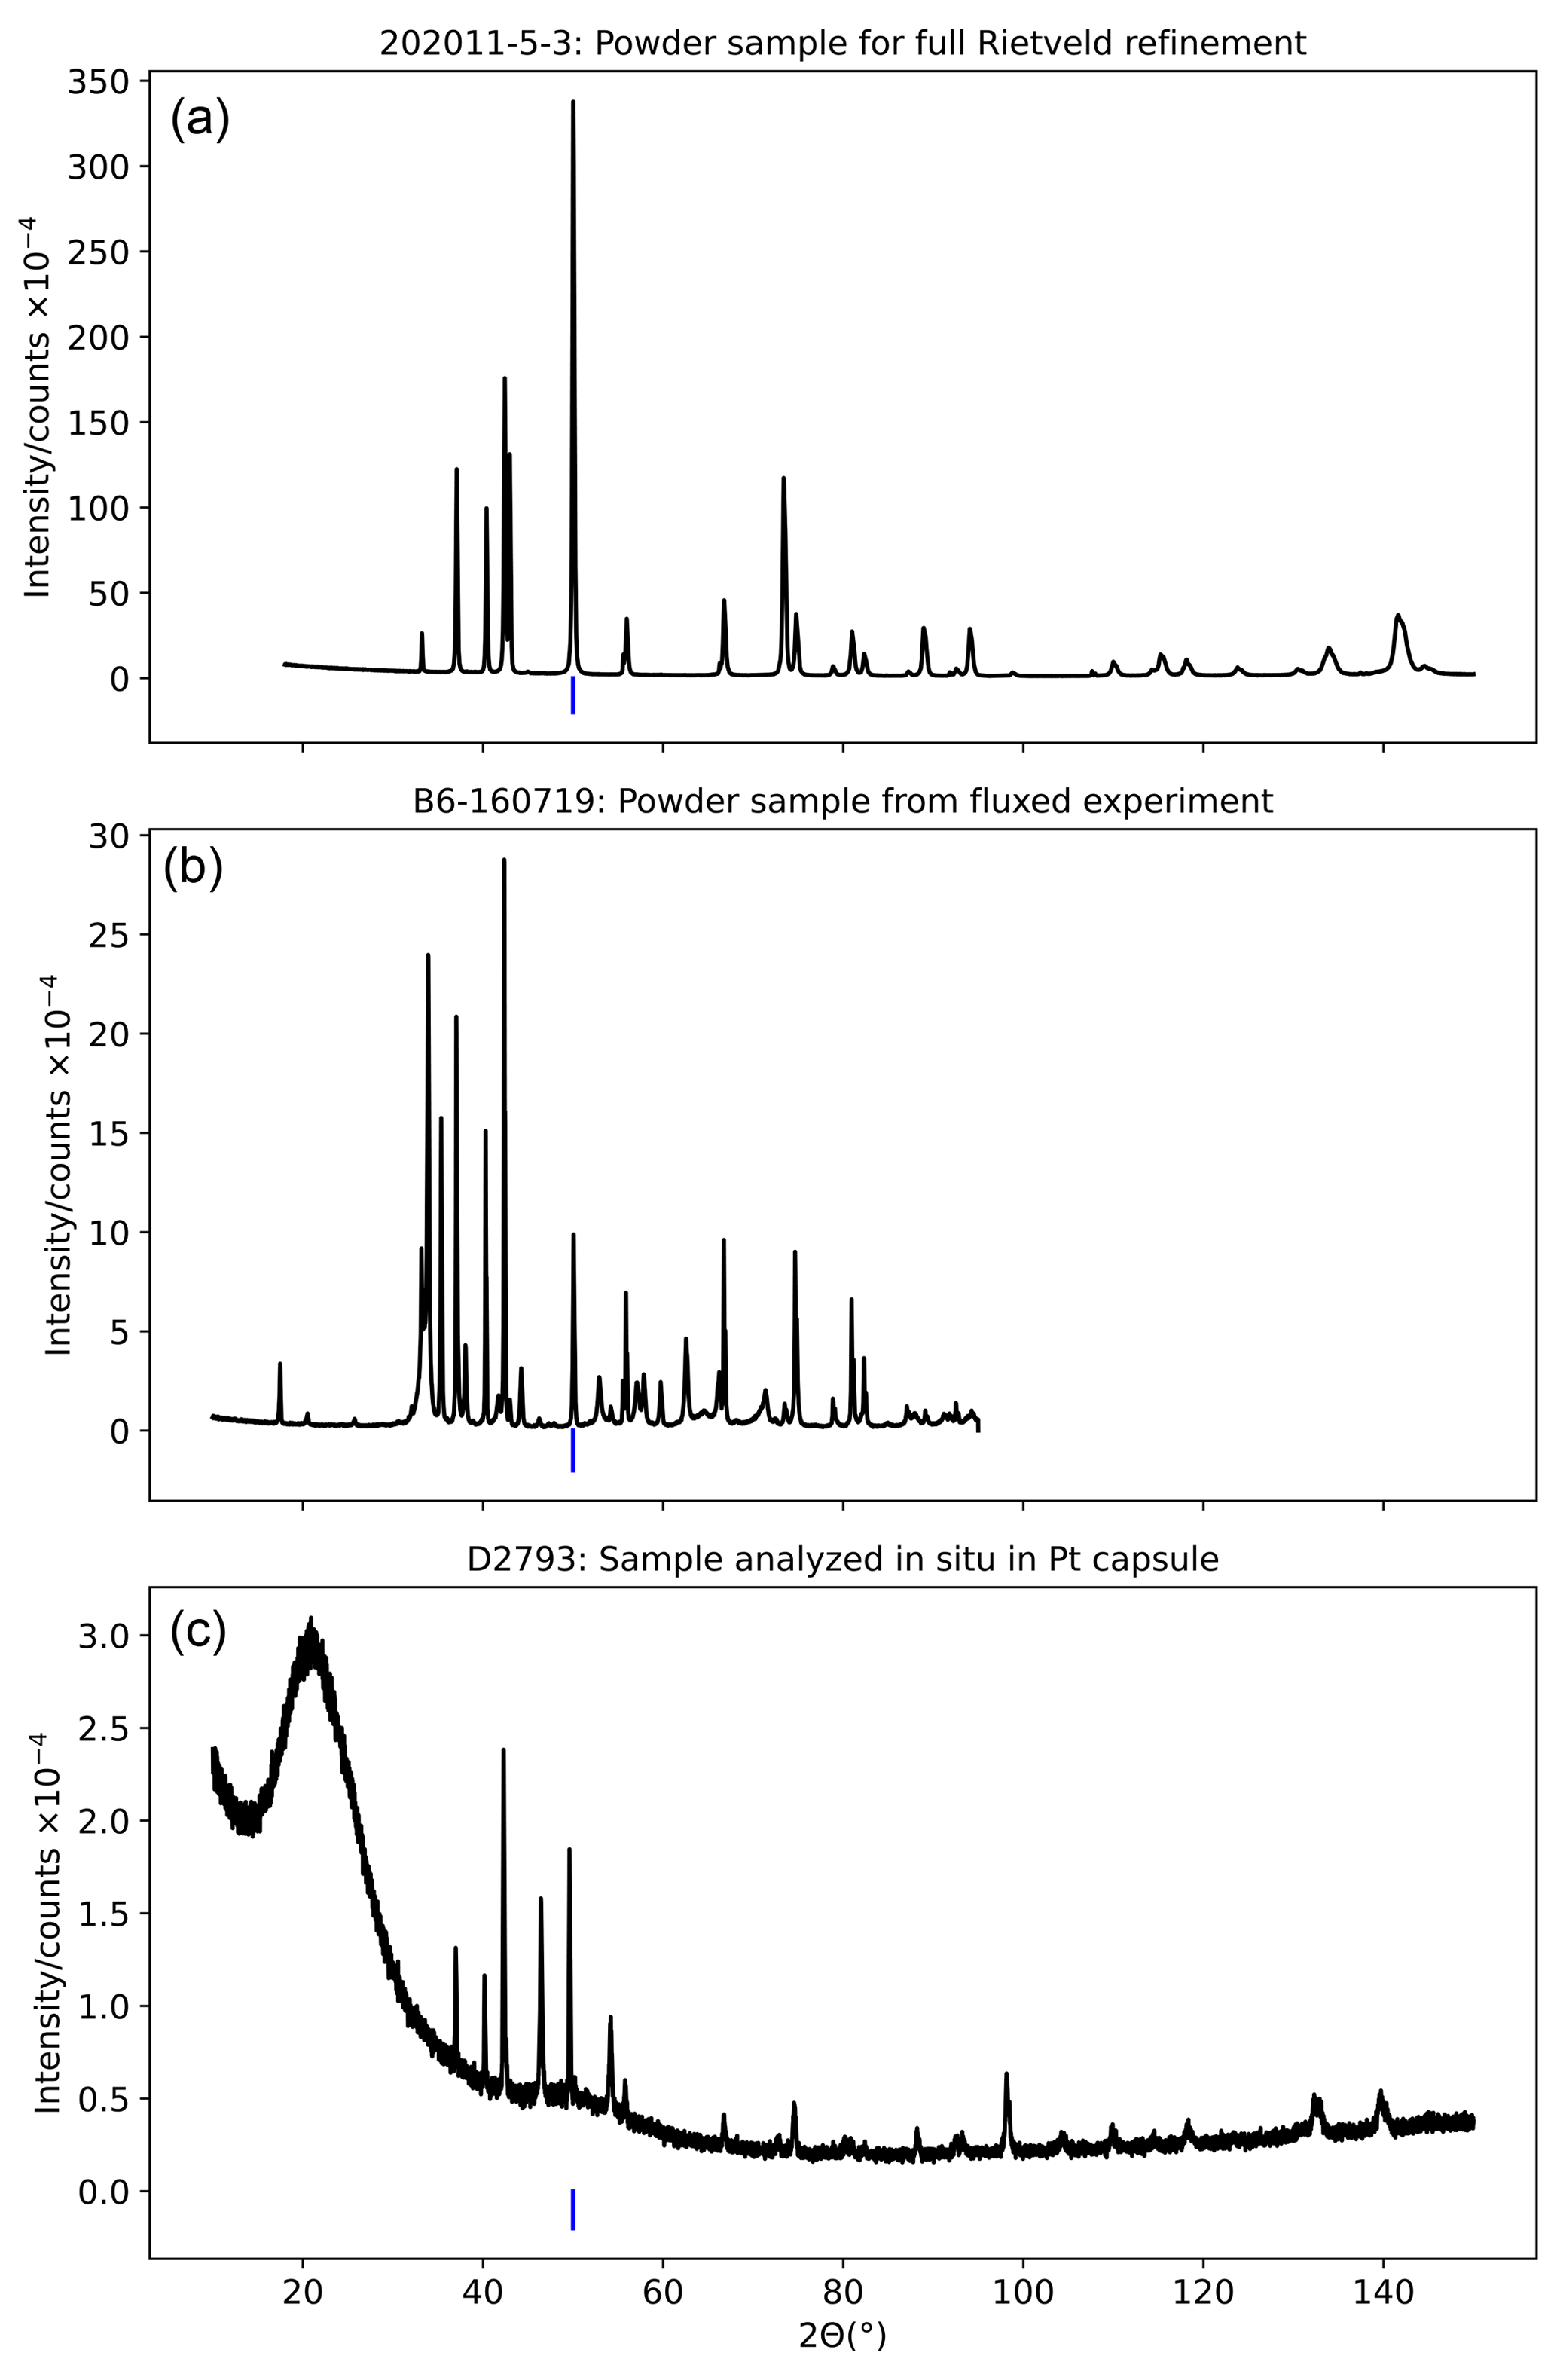
Figure A3Representative examples of X-ray diffraction patterns showing a powder sample recovered from the high-temperature 1 atm experiment (a), for which full Rietveld refinement was conducted; a powder sample recovered from a low-temperature 1 atm experiment in which PbF2 flux was used, for which only peak fitting on the rock salt 200 peak was conducted (b); and a pattern collected from a polished epoxy block containing a high-pressure piston–cylinder sample, for which Rietveld refinement was conducted (c). The position of the rock salt 200 peak is marked in blue.
All data analysed or generated in this study are included in this paper and its Appendix.
HSCO'N identified the MgO–ZnO system as a field of study. NF and HSCO'N conducted 1 atm experiments. NF conducted piston–cylinder experiments. NF did most of the EPMA analysis. NF did all the XRD analysis. HSCO'N fit the results using the Excel Solver. NF did the Monte Carlo analysis. NF prepared the manuscript and figures with contributions from HSCO'N.
The contact author has declared that neither of the authors has any competing interests.
Publisher’s note: Copernicus Publications remains neutral with regard to jurisdictional claims made in the text, published maps, institutional affiliations, or any other geographical representation in this paper. While Copernicus Publications makes every effort to include appropriate place names, the final responsibility lies with the authors.
We acknowledge the scientific and technical assistance of the Australian Microscopy and Microanalysis Research Facility at the Centre for Advanced Microscopy, Australian National University, especially the assistance of Jeff Chen with electron probe microanalysis, in particular Zn Lα emission line analysis. Our thanks are due to David Clark and Dean Scott for providing technical support for the experimental work in the RSES Experimental Petrology Laboratory, as well as to Ulrike Troitzsch for technical assistance with X-ray diffraction analysis and for guidance and instruction in Rietveld analysis. Charles le Losq is thanked for suggesting the Markov chain Monte Carlo sampling approach for uncertainty estimation and for guidance in implementing this in Python. Antony Burnham is thanked for helpful suggestions throughout. We much appreciate the careful and constructive reviews of Christopher Beyer and Bob Myhill, as well as the editorial handling of Tiziana Boffa Ballaran.
This research has been supported by the Australian Research Council (grant no. FL130100066).
This paper was edited by Tiziana Boffa Ballaran and reviewed by Christopher Beyer and Robert Myhill.
Abdeyazdan, H., Shevchenko, M., Hayes, P. C., and Jak, E.: Integrated experimental and thermodynamic modeling investigation of phase equilibria in the PbO–MgO–SiO2 system in air, Metall. Mater. Trans. B, 53, 954–967, https://doi.org/10.1007/s11663-022-02440-6, 2022.
Abdeyazdan, H., Shevchenko, M., Chen, J., Hayes, P. C., and Jak, E: Phase equilibria in the ZnO-MgO-SiO2 and PbO-ZnO-MgO-SiO2 systems for characterizing MgO-based refractory–slag interactions, J. Eur. Ceram. Soc., 44, 510–531, https://doi.org/10.1016/j.jeurceramsoc.2023.08.036, 2024.
Alvarado, A., Attapattu, J., Zhang, Y., and Chen, C.: Thermoelectric properties of rocksalt ZnO from first-principles calculations, J. Appl. Phys., 118, 165101, https://doi.org/10.1063/1.4934522, 2015.
Armstrong, J. T., Donovan, J., and Carpenter, P.: CALCZAF, TRYZAF and CITZAF: The Use of Multi-Correction-Algorithm Programs for Estimating Uncertainties and Improving Quantitative X-ray Analysis of Difficult Specimens, Microsc. Microanal., 19, 812–813, https://doi.org/10.1017/S1431927613006053, 2013.
Baranov, A. N., Sokolov, P. S., Kurakevych, O. O., Tafeenko, V. A., Trots, D., and Solozhenko, V. L.: Synthesis of rock-salt MeO–ZnO solid solutions (Me = Ni2+, Co2+, Fe2+, Mn2+) at high pressure and high temperature, High Pressure Res., 28, 515–519, https://doi.org/10.1080/08957950802379307, 2008.
Bates, C. H., White, W. B., and Roy, R.: New high-pressure polymorph of zinc oxide, Science, 137, 993–993, 1962.
Beyer, C., Rosenthal, A., Myhill, R., Crichton, W. A., Yu, T., Wang, Y., and Frost, D. J.: An internally consistent pressure calibration of geobarometers applicable to the Earth's upper mantle using in situ XRD, Geochim. Cosmochim. Ac., 222, 421–435, https://doi.org/10.1016/j.gca.2017.10.031, 2018.
Bondar, D., Fei, H., Withers, A. C., and Katsura, T.: A rapid-quench technique for multi-anvil high-pressure-temperature experiments, Rev. Sci. Instrum., 91, 065105, https://doi.org/10.1063/5.0005936, 2020.
Clapeyron, É.: Mémoire sur la puissance motrice de la chaleur, Journal de l'École polytechnique, 14, 153–190, 1834.
Condamine, P., Tournier, S., Charlier, B., Médard, E., Triantafyllou, A., Dalou, C., Tissandier, L., Lequin, D., Cartier, C., Füri, E., Burnard, P. G., Demouchy, S., and Marrocchi, Y.: Influence of intensive parameters and assemblies on friction evolution during piston-cylinder experiments, Am. Mineral., 107, 1575–1581, https://doi.org/10.2138/am-2022-7958, 2022.
Davies, P. K. and Navrotsky, A.: Thermodynamics of solid solution formation in NiO-MgO and NiO-ZnO, J. Solid State Chem., 38, 264–276, https://doi.org/10.1016/0022-4596(81)90044-X, 1981.
Davies, P. K. and Navrotsky, A.: Quantitative correlations of deviations from ideality in binary and pseudobinary solid solutions, J. Solid State Chem., 46, 1–22, https://doi.org/10.1016/0022-4596(83)90122-6, 1983.
Decremps, F., Zhang, J., and Liebermann, R. C.: New phase boundary and high-pressure thermoelasticity of ZnO, Europhys. Lett., 51, 268, https://doi.org/10.1209/epl/i2000-00347-0, 2000.
Decremps, F., Pellicer-Porres, J., Datchi, F., Itié, J. P., Polian, A., Baudelet, F., and Jiang, J. Z.: Trapping of cubic ZnO nanocrystallites at ambient conditions, Appl. Phys. Lett., 81, 4820–4822, https://doi.org/10.1063/1.1527696, 2002.
Desgreniers, S.: High-density phases of ZnO: Structural and compressive parameters, Phys. Rev. B, 58, 14102, https://doi.org/10.1103/PhysRevB.58.14102, 1998.
Djelal, A., Chaibi, K., Tari, N., Zitouni, K., and Kadri, A.: Ab-initio DFT-FP-LAPW/TB-mBJ/LDA-GGA investigation of structural and electronic properties of MgxZn1−xO alloys in Würtzite, Rocksalt and Zinc-Blende phases, Superlattice. Microst., 109, 81–98, https://doi.org/10.1016/j.spmi.2017.04.041, 2017.
Dohmen, R., Chakraborty, S., Palme, H., and Rammensee, W.: Solid-solid reactions mediated by a gas phase: An experimental study of reaction progress and the role of surfaces in the system olivine + iron metal, Am. Mineral., 83, 970–984, https://doi.org/10.2138/am-1998-9-1005, 1998.
Dubrovinsky, L. S. and Saxena, S. K.: Thermal Expansion of Periclase (MgO) and Tungsten (W) to Melting Temperatures, Phys. Chem. Miner., 24, 547–550, https://doi.org/10.1007/s002690050070, 1997.
Farmer, N., Rushmer, T., Wykes, J., and Mallmann, G.: The Macquarie Deformation-DIA facility at the Australian Synchrotron: A tool for high-pressure, high-temperature experiments with synchrotron radiation, Rev. Sci. Instrum., 91, 114501, https://doi.org/10.1063/5.0022849, 2020.
Fei, Y.: Effects of temperature and composition on the bulk modulus of (Mg,Fe)O, Am. Mineral., 84, 272–276, https://doi.org/10.2138/am-1999-0308, 1999.
Foreman-Mackey, D., Hogg, D. W., Lang, D., and Goodman, J.: emcee: The MCMC Hammer, Publ. Astron. Soc. Pac., 125, 306–312, https://doi.org/10.1086/670067, 2013.
Fyfe, W. S.: Hydrothermal Synthesis and Determination of Equilbrium between Minerals in the Subliquidus Regon, J. Geol., 68, 553–566, https://doi.org/10.1086/626687, 1960.
Gadzhiev, G. G.: The thermal and elastic properties of zinc oxide-based ceramics at high temperatures, High Temp., 41, 778–782, https://doi.org/10.1023/B:HITE.0000008333.59304.58, 2003.
Garton, G., Hann, B. F., Wanklyn, B. M., and Smith, S. H.: Flux growth of MgO and LaA1O3 crystals doped with isotope 17O, J. Cryst. Growth, 12, 66–68, https://doi.org/10.1016/0022-0248(72)90341-7, 1972.
Gerward, L. and Olsen, J. S.: The high-pressure phase of zincite, J. Synchrotron Radiat., 2, 233–235, https://doi.org/10.1107/S0909049595009447, 1995.
Getting, I. C. and Kennedy, G. C.: Effect of pressure on the emf of chromel-alumel and platinum-platinum 10 % rhodium thermocouples, J. Appl. Phys., 41, 4552–4562, https://doi.org/10.1063/1.1658495, 1970.
Girnis, A. V., Brey, G. P., Doroshev, A. M., Turkin, A. I., and Simon, N.: The system MgO-Al2O3-SiO2-Cr2O3 revisited: reanalysis of Doroshev et al.'s (1997) experiments and new experiments, Eur. J. Mineral., 15, 953–964, https://doi.org/10.1127/0935-1221/2003/0015-0953, 2003.
Goodman, J. and Weare, J.: Ensemble samplers with affine invariance, Comm. App. Math. Com. Sc., 5, 65–80, https://doi.org/10.2140/camcos.2010.5.65, 2010.
Hansson, R., Hayes, P. C., and Jak, E.: Phase equilibria at sub-solidus conditions in the Fe–Mg–Zn–O system in air, Scand. J. Metall., 33, 355–361, https://doi.org/10.1111/j.1600-0692.2004.00706.x, 2004.
Hastings, W. K.: Monte Carlo sampling methods using Markov chains and their applications, Biometrika, 57, 97–109, https://doi.org/10.2307/2334940, 1970.
Hazen, R. M.: Effects of temperature and pressure on the crystal structure of forsterite, Am. Mineral., 61, 1280–1293, 1976.
Holland, T. J. B. and Powell, R.: An internally consistent thermodynamic data set for phases of petrological interest, J. Metamorph. Geol., 16, 309–343, https://doi.org/10.1111/j.1525-1314.1998.00140.x, 1998.
Holland, T. J. B. and Powell, R.: An improved and extended internally consistent thermodynamic dataset for phases of petrological interest, involving a new equation of state for solids: Thermodynamic dataset for phases of petrological interest, J. Metamorph. Geol., 29, 333–383, https://doi.org/10.1111/j.1525-1314.2010.00923.x, 2011.
Iwanaga, H., Kunishige, A., and Takeuchi, S.: Anisotropic thermal expansion in wurtzite-type crystals, J. Mater. Sci., 35, 2451–2454, https://doi.org/10.1023/A:1004709500331, 2000.
Jiang, J. Z., Olsen, J. S., Gerward, L., Frost, D., Rubie, D., and Peyronneau, J.: Structural stability in nanocrystalline ZnO, Europhys. Lett., 50, 48, https://doi.org/10.1209/epl/i2000-00233-9, 2000.
Johannes, W., Bell, P. M., Mao, H. K., Boettcher, A. L., Chipman, D. W., Hays, J. F., Newton, R. C., and Seifert, F.: An interlaboratory comparison of piston-cylinder pressure calibration using the albite-breakdown reaction. Contrib. Mineral. Petr., 32, 24–38, https://doi.org/10.1007/BF00372231, 1971.
Kihara, K. and Donnay, G.: Anharmonic thermal vibrations in ZnO, Can. Mineral., 23, 647–654, 1985.
Kondrashev, Y. D. and Omelchenko, Y. A.: X-Ray diffraction examination of some oxide and sulphide systems, Russ. J. Inorg. Chem., 9, 512–516, 1964.
Koskelo, O., Räisänen, J., Tuomisto, F., Eversheim, D., Grasza, K., and Mycielski, A. Diffusion of cobalt in ion-implanted ZnO, Thin Solid Films, 518, 3894–3897, https://doi.org/10.1016/j.tsf.2009.11.081, 2010.
Kusaba, K., Syono, Y., and Kikegawa, T.: Phase transition of ZnO under high pressure and temperature, P. Jpn. Acad. B-Phys., 75, 1–6, https://doi.org/10.2183/pjab.75.1, 1999.
Leitner, J., Kamrádek, M., and Sedmidubský, D.: Thermodynamic properties of rock-salt ZnO, Thermochim. Acta, 572, 1–5, https://doi.org/10.1016/j.tca.2013.08.004, 2013.
Li, J., Kornprobst, J., and Laporte, D.: Subsolidus phase relations in the system MgO-ZnO-SiO2 at high pressure, Chinese Sci. Bull., 44, 1146–1149, https://doi.org/10.1007/BF02886147, 1999.
Llovet, X. and Salvat, F.: PENEPMA: A Monte Carlo Program for the Simulation of X-Ray Emission in Electron Probe Microanalysis, Microsc. Microanal., 23, 634–646, https://doi.org/10.1017/s1431927617000526, 2017.
Llovet, X., Moy, A., and Fournelle, J. H.: Electron Probe Microanalysis of Transition Metals using L lines: The Effect of Self-absorption, Microsc. Microanal., 28, 123–137, https://doi.org/10.1017/S1431927621013684, 2022.
McDade, P., Wood, B. J., Van Westrenen, W., Brooker, R., Gudmundsson, G., Soulard, H., Najorka, J., and Blundy, J.: Pressure corrections for a selection of piston-cylinder cell assemblies, Mineral. Mag., 66, 1021–1028, https://doi.org/10.1180/0026461026660074, 2002.
Metropolis, N. and Ulam, S.: The Monte Carlo method, J. Am. Stat. Assoc., 44, 335–341, https://doi.org/10.1080/01621459.1949.10483310, 1949.
Navrotsky, A. and Davies, P. K.: Cesium chloride versus nickel arsenide as possible structures for (Mg, Fe)O in the lower mantle, J. Geophys. Res.-Sol. Ea., 86, 3689–3694, https://doi.org/10.1029/JB086iB05p03689, 1981.
Nielsen, J. W. and Dearborn, E. F.: The growth of large single crystals of zinc oxide, J. Phys. Chem., 64, 1762–1763, https://doi.org/10.1021/j100840a503, 1960.
Newville, M., Stensitzki, T., Allen, D. B., and Ingargiola, A.: LMFIT: Non-Linear Least-Square Minimization and Curve-Fitting for Python, Zenodo [code], https://doi.org/10.5281/zenodo.11813, 2014.
Ohtomo, A., Kawasaki, M., Sakurai, Y., Yoshida, Y., Koinuma, H., Yu, P., Tang, Z. K., Wong, G. K. L., and Segawa, Y.: Room temperature ultraviolet laser emission from ZnO nanocrystal thin films grown by laser MBE, Mater. Sci. Eng. B-Adv., 54, 24–28, https://doi.org/10.1016/S0921-5107(98)00120-2, 1998.
O'Neill, H. S. C. and Navrotsky, A.: Simple spinels; crystallographic parameters, cation radii, lattice energies, and cation distribution, Am. Mineral., 68, 181–194, 1983.
Pattison, D. R. M.: Are reversed Fe-Mg exchange and solid solution experiments really reversed?, Am. Mineral., 79, 938–950, 1994.
Pepe, F., Schiavello, M., and Ferraris, G.: Characterization of CoO-ZnO solid solutions, J. Solid State Chem., 12, 63–68, https://doi.org/10.1016/0022-4596(75)90178-4, 1975.
Powell, R.: Equilibrium Thermodyamics in Petrology: An Introduction, Harper & Row, 1978.
Pouchou, J., Pichoir, F., and Boivin, D.: XPP procedure applied to quantitative EDS X-ray analysis in the SEM, Microbeam Anal., San Francisco Press, 120–126, 1990.
Raghavan, S., Hajra, J. P., Iyengar, G. N. K., and Abraham, K. P.: Terminal solid solubilities at 900–1000 ∘C in the magnesium oxide-zinc oxide system measured using a magnesium fluoride solid-electrolyte galvanic cell, Thermochim. Acta, 189, 151–158, https://doi.org/10.1016/0040-6031(91)87109-A, 1991.
Reeber, R. R.: Lattice parameters of ZnO from 4.2 to 296 K, J. Appl. Phys., 41, 1039–1048, 1970.
Reeber, R. R., Goessel, K., and Wang, K.: Thermal expansion and molar volume of MgO, periclase, from 5 to 2900 K, Eur. J. Mineral., 7, 1039–1048, 1995.
Richet, P. and Fiquet, G.: High-temperature heat capacity and premelting of minerals in the system MgO-CaO-Al2O3-SiO2, J. Geophys. Res.-Sol. Ea., 96, 445–456, https://doi.org/10.1029/90JB02172, 1991.
Rigamonti, R.: Soluzione solide tra ossido di zinco ed ossidi di metalli bivalenti, Gazz. Chim. Ital., 76, 474–484, 1946.
Robie, R. A. and Hemingway, B. S.: Thermodynamic properties of minerals and related substances at 298.15 K and 1 bar (105 pascals) pressure and at higher temperatures, US Government Printing Office, https://doi.org/10.3133/b2131, 1995.
Robie, R. A., Haselton, H. T., and Hemingway, B. S.: Heat capacities and entropies at 298.15 K of MgTiO3 (geikielite), ZnO (zincite), and ZnCO3 (smithsonite), J. Chem. Thermodyn., 21, 743–749, https://doi.org/10.1016/0021-9614(89)90058-X, 1989.
Sarver, J. F., Katnack, F. L., and Hummel, F. A.: Phase Equilibria and Manganese-Activated Fluorescence in the System Zn3(PO4)2-Mg3(PO4)2, J. Electrochem. Soc., 106, 960–963, 1959.
Sasaki, S., Prewitt, C. T., Sato, Y., and Ito, E.: Single-crystal X ray study of γ Mg2SiO4, J. Geophys. Res.-Sol. Ea., 87, 7829–7832, https://doi.org/10.1029/JB087iB09p07829, 1982.
Schleife, A., Fuchs, F., Furthmüller, J., and Bechstedt, F.: First-principles study of ground-and excited-state properties of MgO, ZnO, and CdO polymorphs, Phys. Rev. B, 73, 245212, https://doi.org/10.1103/PhysRevB.73.245212, 2006.
Segnit, E. R. and Holland, A. E.: The System MgO-ZnO-SiO2, J. Am. Ceram. Soc., 48, 409–413, https://doi.org/10.1111/j.1151-2916.1965.tb14778.x, 1965.
Seko, A., Oba, F., Kuwabara, A., and Tanaka, I.: Pressure-induced phase transition in ZnO and ZnO-MgO pseudobinary system: A first-principles lattice dynamics study, Phys. Rev. B, 72, 024107, https://doi.org/10.1103/PhysRevB.72.024107, 2005.
Shannon, R. D.: Revised effective ionic radii and systematic studies of interatomic distances in halides and chalcogenides, Acta Crystallogr. A, 32, 751–767, https://doi.org/10.1107/S0567739476001551, 1976.
Sharikov, F. Y., Sokolov, P. S., Baranov, A. N., and Solozhenko, V. L.: On the thermodynamic aspect of zinc oxide polymorphism: calorimetric study of metastable rock salt ZnO, Mendeleev Commun., 27, 613–614, https://doi.org/10.1016/j.mencom.2017.11.025, 2017.
Sharp, W. E.: Melting curves of sphalerite, galena, and pyrrhotite and the decomposition curve of pyrite between 30 and 65 kilobars, J. Geophys. Res., 74, 1645–1652, https://doi.org/10.1029/JB074i006p01645, 1969.
Shimada, K., Takahashi, N., Nakagawa, Y., Hiramatsu, T., and Kato, H.: Nonlinear characteristics of structural properties and spontaneous polarization in wurtzite MgxZn1−xO: A first-principles study, Phys. Rev. B, 88, 075203, https://doi.org/10.1103/PhysRevB.88.075203, 2013.
Sokolov, P. S., Baranov, A. N., Dobrokhotov, Z. V., and Solozhenko, V. L.: Synthesis and thermal stability of cubic ZnO in the salt nanocomposites, Russ. Chem. B., 59, 325–328, https://doi.org/10.1007/s11172-010-0082-7, 2010.
Solozhenko, V. L., Kurakevych, O. O., Sokolov, P. S., and Baranov, A. N.: Kinetics of the wurtzite-to-rock-salt phase transformation in ZnO at high pressure, J. Phys. Chem. A, 115, 4354–4358, https://doi.org/10.1021/jp201544f, 2011.
Sossi, P. A., Klemme, S., O'Neill, H. S. C., Berndt, J., and Moynier, F.: Evaporation of moderately volatile elements from silicate melts: experiments and theory, Geochim. Cosmochim. Ac., 260, 204–231, https://doi.org/10.1016/j.gca.2019.06.021, 2019.
Toby, B. H. and Von Dreele, R. B.: GSAS-II: the genesis of a modern open-source all purpose crystallography software package, J. Appl. Crystallogr., 46, 544–549, https://doi.org/10.1107/S0021889813003531, 2013.
Tomlins, G. W., Routbort, J. L., and Mason, T. O.: Zinc self-diffusion, electrical properties, and defect structure of undoped, single crystal zinc oxide, J. Appl. Phys., 87, 117–123, https://doi.org/10.1063/1.371832, 2000.
Wuensch, B. J. and Vasilos, T.: Diffusion of Zn2+ in single-crystal MgO, J. Chem. Phys., 42, 4113–4115, https://doi.org/10.1063/1.1695903, 1965.
Xia, L., Liu, Z., and Taskinen, P.: Solubility study of the halite and wurtzite solid solutions in the MgO-ZnO system within temperature range from 1000 to 1600 ∘C, J. Alloy. Compd., 687, 827–832, https://doi.org/10.1016/j.jallcom.2016.06.191, 2016.
Zhang, P., Xu, F., Navrotsky, A., Lee, J. S., Kim, S., and Liu, J.: Surface Enthalpies of Nanophase ZnO with Different Morphologies, Chem. Mater., 19, 5687–5693, https://doi.org/10.1021/cm0711919, 2007.