the Creative Commons Attribution 4.0 License.
the Creative Commons Attribution 4.0 License.
 | 29 Apr 2024
Laser-induced breakdown spectroscopy analysis of tourmaline: protocols, procedures, and predicaments
Barbara L. Dutrow
Laser-induced breakdown spectroscopy (LIBS) is an appropriate choice of analytical tool for analysis of complex minerals because it is rapid, requires little sample preparation, and acquires major and trace element compositional information on all naturally occurring elements at concentrations above their intrinsic levels of detection for the specific analyte material. Tourmaline, a complex borosilicate mineral supergroup, was chosen as a test mineral due to the complexity of its major and minor element composition.
Four analytical issues were investigated during project development: (1) the spacing between analytical laser shots to avoid analysis of the recast from previous laser ablations, (2) the efficacy of using a cleaning shot prior to data acquisition, (3) the number of ablations required to collect an average spectrum that is representative of the tourmaline sample, and (4) the effect of spectrometer drift on principal component analysis (PCA) when using the entire LIBS spectra to model the compositional variations within the sample suite.
The minimum spacing between locations of analysis was determined to be 800 µm for the analytical conditions used in this study by examining spectra acquired in a 2×2 grid across a quartz–tourmaline boundary. At a spacing of 100 µm, twice the diameter of the laser beam, the intensity of the boron I peaks at 249.68 and 249.77 nm was very low in the first location (quartz) but quite high in the fourth location (quartz) due to deposition of tourmaline-composition recast by laser shots in the second and third locations (both on tourmaline). Increasing the distance between locations to 800 µm ensured that the area analyzed largely avoided the recast layer from previous ablations. Given that the distribution of recast was taken into account, no cleaning shots were collected. PCA score plots calculated using successively larger numbers of spectra from the same sample show that a total of 64 spots, or 16 2×2 grids, are needed to acquire a representative average analysis of tourmaline.
Spectrometer drift was recognized in PCA loading plots by a characteristic splitting of element peaks; half the peak indicates positive loading and the other half of the peak indicates negative loading. Drift correction was aligned by placing the Ca II peak at 393.34 nm in the 393.398 bin; this correction eliminated split peaks in loading plots.
The resolution of these issues yielded LIBS spectra suitable for multivariate statistical analysis that can be applied to understanding geologic processes. These results contribute to the application of rapid LIBS analysis of complex geomaterials.
- Article
(2927 KB) - Full-text XML
- BibTeX
- EndNote


Laser-induced breakdown spectroscopy (LIBS) analysis of minerals requires little sample preparation and is rapid compared to more traditional analytical techniques such as electron probe microanalysis (EPMA) and laser ablation inductively coupled plasma mass spectrometry (LA-ICP-MS). In addition, LIBS spectra potentially contain a signal from all naturally occurring elements with concentrations above their intrinsic limits of detection in the specific type of analyte (Cremers and Radziemski, 2013), some isotopic ratios (Russo et al., 2011), and structural information (Serrano et al., 2015a, b). Each broadband LIBS spectrum is a unique and detailed chemical signature of the sample (Harmon et al., 2009; McManus and McMillan, 2023). When analyzed with multivariate statistical techniques, a set of LIBS spectra have the potential to provide a quantitative prediction of the lithologic origin (Farnsworth-Pinkerton et al., 2018; McMillan et al., 2018; Mount, 2018). No other technique can generate analysis of hundreds of samples over a comparably short analytical time with minimal damage to the specimens. During LIBS analysis, a pulsed laser is focused on the sample surface, ablating its surface and disbursing atoms from the sample into a high-temperature plasma that contains the surrounding atmosphere as well as the ablated material. Plasma temperatures are sufficiently high to excite bound electrons which decay to lower-energy orbitals as the plasma cools and release quantum packets of energy in the form of photons. This short-lived optical emission is collected and transmitted to a spectrometer via a fiber-optic cable or telescope. The optical emission is recorded on a charge-coupled device and converted by the spectrometer to a spectrum consisting of the intensity of peaks over a range of wavelengths, typically from ∼ 200 to 1000 nm. This process takes nanoseconds, allowing the rapid analysis of materials (Cremers and Radziemski, 2013). Rastering of the laser across the sample surface in a grid allows the rapid acquisition of many spectra from the same mineral specimen to obtain a representative average composition.
Tourmaline is a complex borosilicate mineral supergroup that consists of 39 species (e.g., Henry and Dutrow, 2021). Its chemical flexibility results from a structure that is capable of incorporating ions across a range of sizes and charges. This capacity, combined with stability over a wide range in temperature and pressure, low rates of volume diffusion, and mechanical and chemical durability in sedimentary environments, results in a remarkable ability to record and retain the compositional signature of the rock in which the tourmaline formed (e.g., Dutrow and Henry, 2011). Most provenance studies rely on quantitative studies that are time-consuming and suited only to a relatively small number of samples. LIBS is a possible tool for tourmaline provenance determination because correlating tourmaline composition with host rock lithology requires a large database that encompasses the compositional heterogeneity found in each lithologic group (Henry and Guidotti, 1985).
To predict host rock lithology using tourmaline chemistry, new methods are needed, and a study using LIBS seemed optimal after completion of a pilot study of 189 tourmaline samples (McMillan et al., 2018). Method development for an advanced project with nearly 800 samples was driven by the following parameters: (1) analytical speed, needing to analyze samples in a relatively short amount of time (∼ 30 d including sample preparation); (2) minimal sample preparation, required for samples from museums, collectors, and precious materials; and (3) addition of samples, as new samples were collected, others were being analyzed; i.e., samples with unexpected challenges could arrive during the analytical period.
This paper describes four challenges and lessons learned for the analysis of complex geomaterials, such as tourmaline, using multivariate analysis of spectra acquired by LIBS – challenges that differ from traditional univariate analysis. These challenges are (1) the required/optimal spacing between LIBS analytical point locations, (2) the number of spectra required to obtain a representative analysis of tourmaline, (3) the efficacy of LIBS cleaning shots, and (4) the spectrometer drift. Throughout the project, the spectra were modeled with the multivariate technique principal component analysis (PCA).
2.1 Instrumental
An Applied Spectra J200 LIBS instrument was used for this research. The instrument contains an Andor Mechelle ME 5000 spectrograph () and Andor iStar ICCD (intensified charge-coupled device) camera, model DH334T-18F-03. Spectra consisted of photon intensities collected at 26 770 wavelengths between 208 and 1032 nm. The laser was a Q-switched Quantel ULTRA 100 Big Sky Laser, operated at 266 nm wavelength. Laser power was 150 mJ, gate delay was 0.5 µs, and the laser beam diameter was nominally 50 µm. Samples were analyzed in an argon atmosphere, produced by introducing a stream of argon into the sample chamber at the rate of 2.0 L s−1. The presence of an inert gas enhances the sample signal compared to that produced in the ambient atmosphere because (1) the higher ionization energy of argon relative to nitrogen and oxygen causes more laser energy to be partitioned into exciting atoms ablated from the sample and (2) the inert gas pressure retards plasma expansion, permitting a longer time for species ionization (Cremers and Radziemski, 2013).
Original analytical protocols were based on reasonable expectations from prior research (McMillan et al., 2018; Mount, 2018). Analysis was programmed to occur in 8×8 grids of 64 shots each. Spacing between the center of each shot was 100 µm. This spacing allowed 50 µm between the outer edge of each laser spot, consistent with recommendations in Jolivet et al. (2019). Each grid was approximately 1 mm2. Two grids were collected at each analytical location. The first was considered a cleaning grid, meant to remove any contaminants not removed by cleaning with a lint-free wipe and isopropyl alcohol. This study retained the cleaning grids. The second, analytical grid is in exactly the same location; originally, these data were collected and used for modeling purposes.
Spectra from each grid were averaged into a single spectrum for each sample. The entire wavelength range, 208 to 1031 nm, was used for the modeling purposes in this paper.
2.2 Multivariate analysis
Multivariate statistical analysis was used for modeling, taking advantage of the unique material signatures obtained by LIBS. The Unscrambler X software by CAMO software was used for multivariate analysis.
PCA is a dimension-reducing multivariate technique that calculates a series of linear regressions (principal components or eigenvectors) through the spectral data set and plots each analysis in the space defined by the linear regressions. Commonly PC 1, the principal component that describes the most variability in the data set, and PC 2, the principal component that describes the second most variability, are used as axes that define a plane onto which the positions of spectra are projected. Such plots, called score plots, are essentially x–y diagrams with the principal components, representing a combination of the variables as axes instead of single variables. Thus, the relationships in the complex data set can be explored and understood. Score plots are interpreted in the same manner as any x–y plot; samples that plot close to each other are similar, and those that plot far from each other are dissimilar.
PCA loading plots are used to understand which variables are correlated with each other along any principal component. In a loading plot, the influence of each variable (wavelength) is plotted against wavelength. Wavelengths that have a strong control on the direction of the principal component through multi-dimensional space will have high influence; wavelengths with influence near zero do not contribute to the position of the principal component. Influence can be positive or negative. Elements whose wavelengths have positive influence increase in concentration in the positive direction of the principal component; elements with negative influence increase in concentration in the negative direction of the principal component. The combination of score plots and loading plots allows one to understand the compositional relationships in the data set.
3.1 Introduction
Spectra for this project were acquired over a 2-year period in nine sessions, each lasting 4–16 d. During this time, it was necessary to understand four issues: (1) the distance between laser shot locations to avoid the deposition of recast (ablated material) deposited on adjacent analysis locations, (2) the minimum number of analyses required to obtain an average spectrum that is representative of the sample, (3) the efficacy and necessity of cleaning shots, and (4) the effects of spectrometer drift throughout the day on the multivariate analysis.
3.2 Surface contamination by recast layer
The LIBS plasma is a dynamic environment that contains hot atoms, ions, molecules, and particles (Russo et al., 2013). These particles can be ablated fragments of the analyte or molecules that nucleate during condensation in the cooling plasma. A broad area around the ablation crater becomes covered with a recast layer because much of the ablated mass falls back to the surface propelled by a shock wave and ballistic ejection processes (Wang et al., 2004; Bruder et al., 2007; Russo et al., 2007). The diameter of the recast layer varies widely with laser energy, the efficiency of laser–sample coupling, and laser wavelength (Russo et al., 2013).
The analytical shot pattern used in Mount (2018) was 8×8 grids of 64 shots, with spacing between laser shots of 100 µm. This allowed 50 µm between laser shots, each with a beam diameter of 50 µm. Each grid was approximately 1 mm × 1 mm in area, which was convenient for the rapid analysis of samples, many of which were small (< 1 cm long). The assumption was that because the laser shot analytical pits did not overlap, each shot would sample fresh material (e.g., Jolivet et al., 2019). This method worked well for the samples used in the Mount (2018) study of tourmaline provenance.
The sample set here contained tourmaline crystals with associated minerals and mineral inclusions, typically quartz (Fig. 1a). Multivariate analysis that identifies spectra from different minerals can create mineralogical maps of complex geologic samples (Fabre et al., 2018; Jolivet et al., 2019; Merk et al., 2023; Moncayo et al., 2018; Nardecchia et al., 2021, 2022; Romppanen et al., 2017); thus, we decided to collect spectra from the entire grid and later screen out any spectra not acquired on tourmaline, saving analytical time and cost. Ideally, the non-tourmaline spectra could be eliminated from the database by screening for the boron I lines at 249.68 and 249.77 nm. However, spectra of all shots, including those on quartz grains, contained boron peaks, complicating the use of hyperspectral imaging techniques. This contamination was due to the recast layer of tourmaline material deposited by the cooling plasma as the ablated material fell back onto the sample surface of quartz. Thus, it was necessary to empirically determine the minimum spacing between analysis locations to avoid analyzing the ejecta blanket.
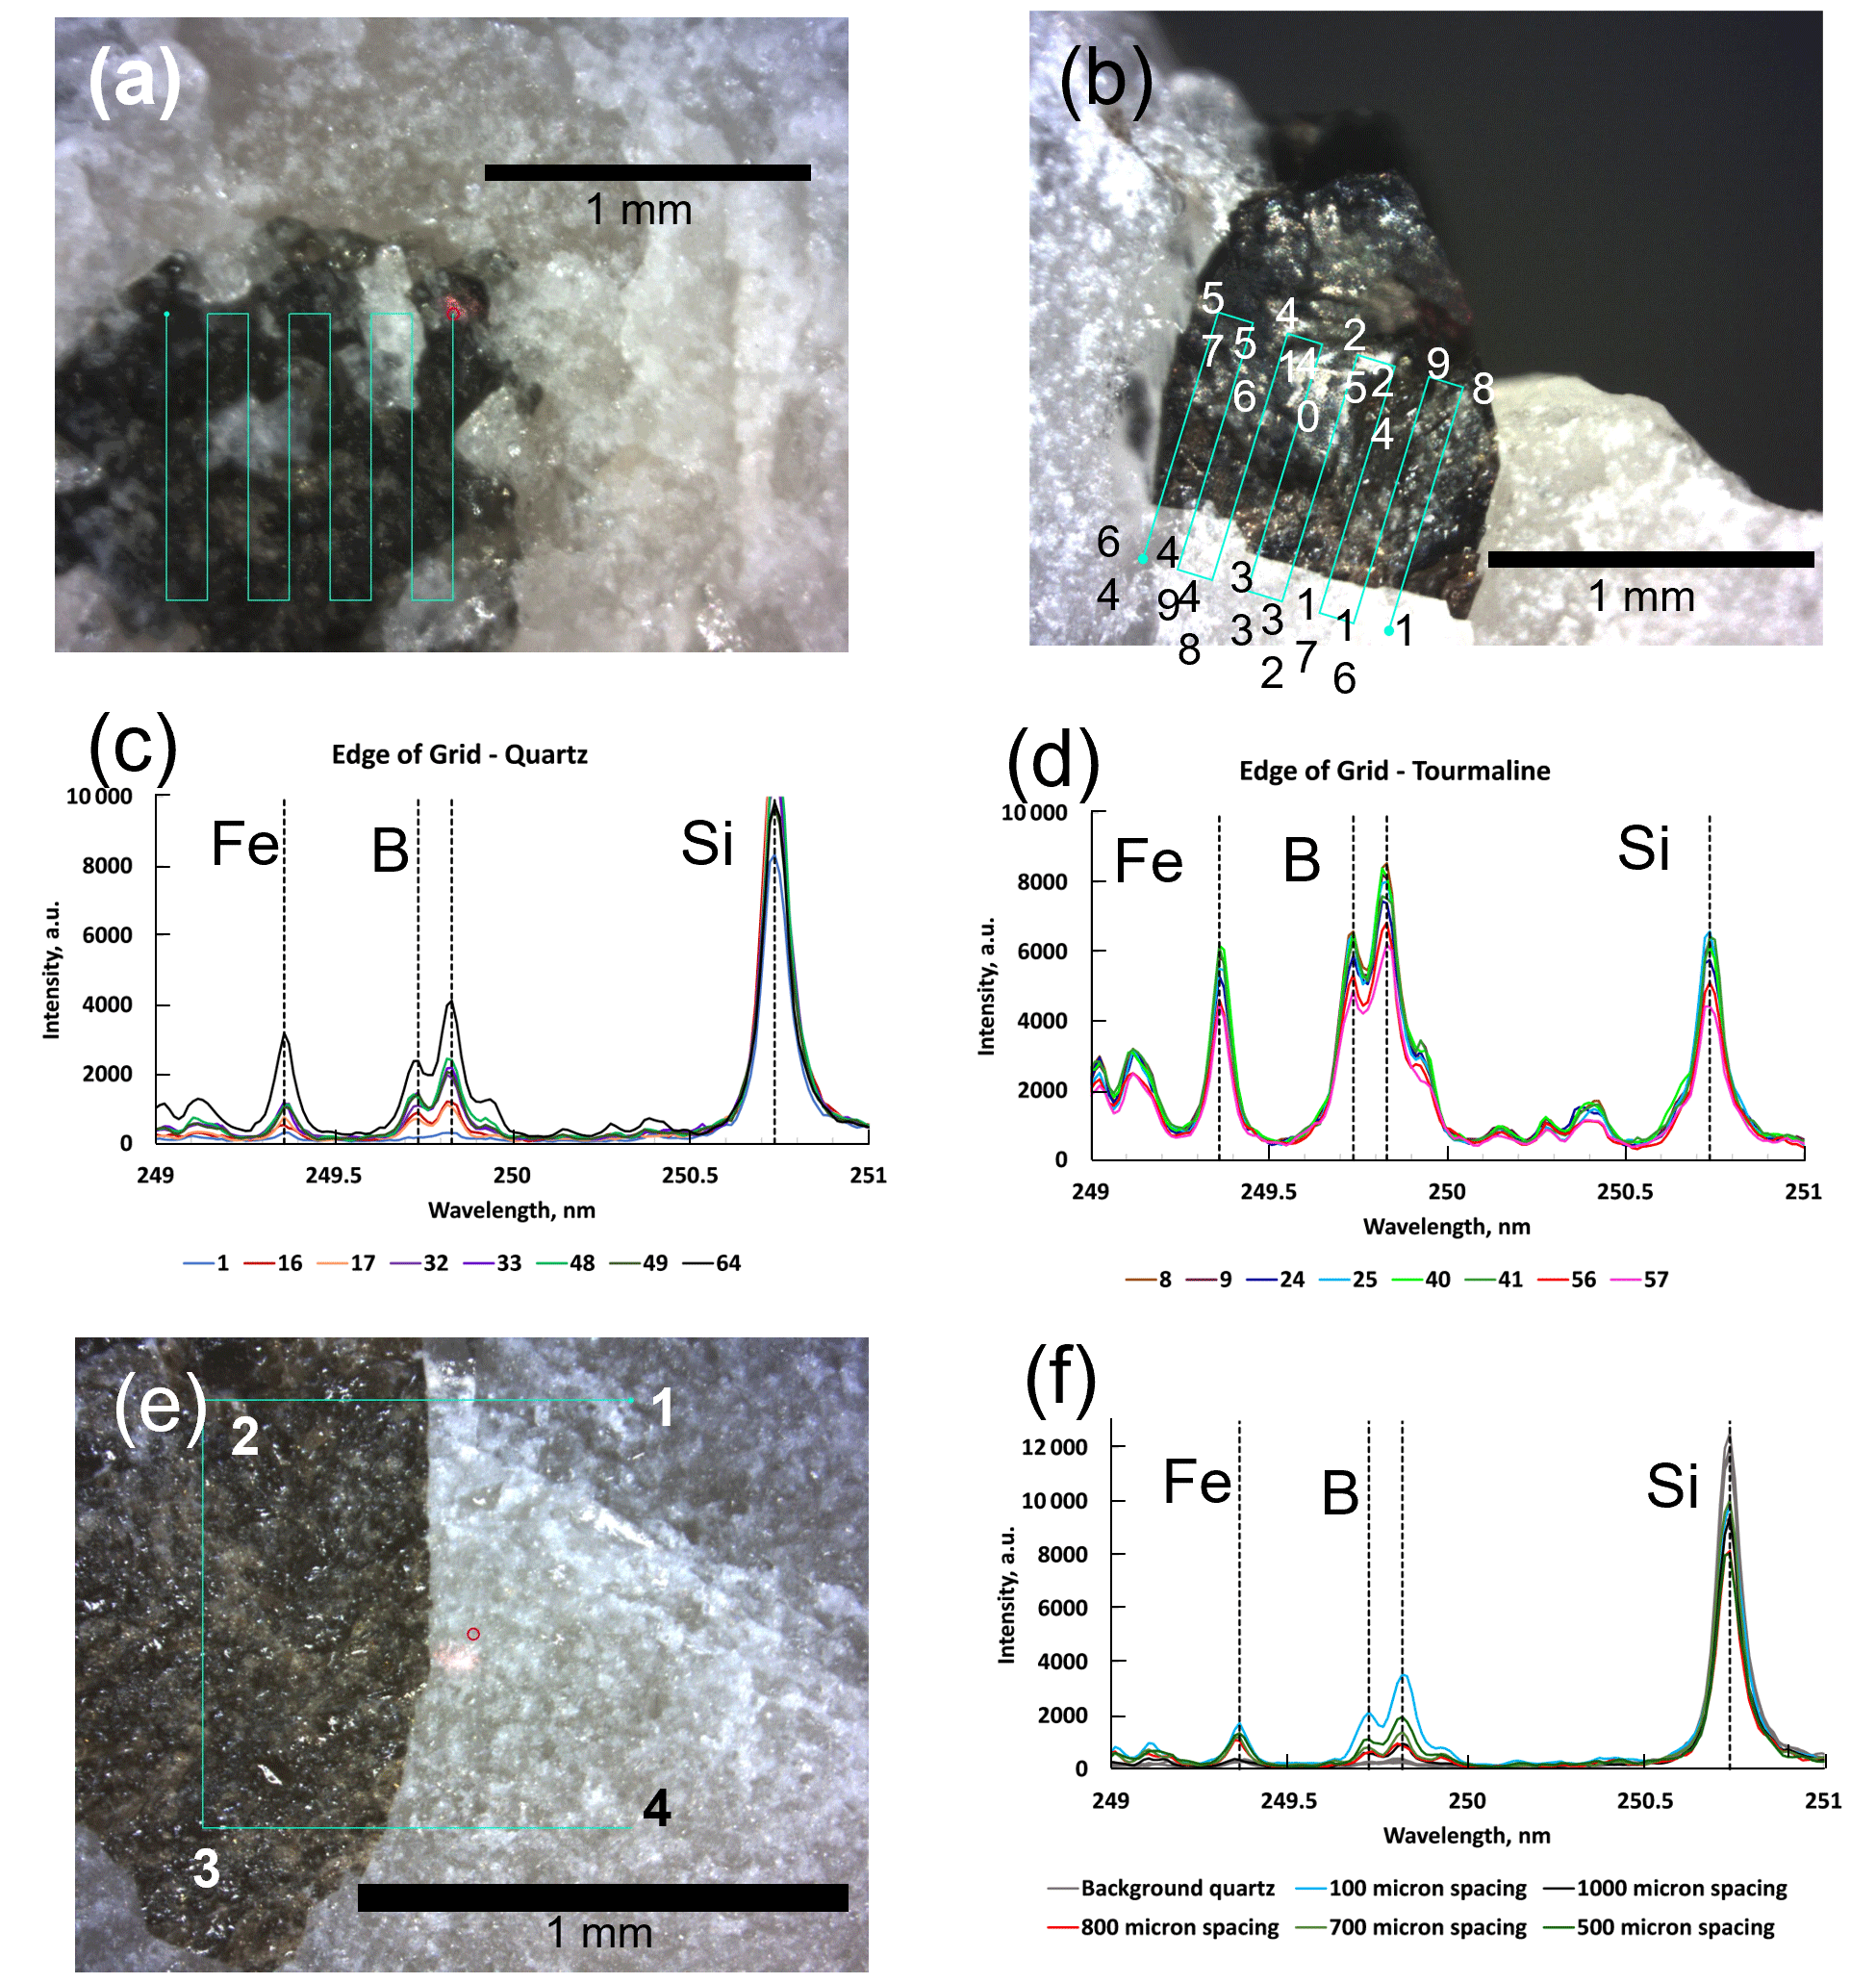
Figure 1Photographs of tourmaline and quartz samples and the spectra used to investigate the optimal spacing between laser shots. (a) Tourmaline (dark) with quartz inclusions (white) showing the 8×8 location grid. Because tourmaline commonly contains mineral inclusions, it is necessary to be able to discriminate between laser shots on inclusions and laser shots on quartz. (b) The 8×8 location grid located across the boundary between a tourmaline grain and its quartz host. Numbers refer to the shot numbers in Fig. 3c and d. (c) LIBS spectra between 249 and 251 nm for locations on quartz (location numbers shown in Fig. 2b). Peaks of Fe, B, and Si are annotated. (d) LIBS spectra between 249 and 251 nm for locations on tourmaline (location numbers shown in Fig. 3b). Peaks of Fe, B, and Si are annotated. (e) A 2×2 grid located across a tourmaline–quartz boundary that illustrates the method used to determine the optimal shot spacing. The numbers indicate the order in which spectra were acquired. (f) LIBS spectra between 249 and 251 nm for the fourth shot in 2×2 grids for shot spacings between 100 and 1000 µm. Peaks of Fe, B, and Si are labeled.
The effect of recast was investigated by placing an analytical grid across the boundary between an inclusion-free tourmaline and the surrounding quartz (Fig. 1b) and examining quartz spectra along the edge of the grid to determine if B was present in the spectra (analyses 1, 16, 17, 32, 33, 48, 49, and 64 in Fig. 1b). Shot 1 has negligible intensities for the Fe and B peaks and a significant Si peak (Fig. 1c), as would be expected for quartz. However, as the grid analysis continues, the Fe and B peaks become more intense in spectra acquired on the quartz, suggesting that the recast layer thickens on the quartz as the grid develops. Only the first quartz spectrum, acquired prior to any tourmaline shots, is free of contamination. The intensities of Fe, B, and Si peaks in spectra on tourmaline from the other edge of the grid (Fig. 1d) show no correlation with the order of analysis, probably because the recast layer has essentially the same composition as the tourmaline analyzed.
A method to determine the spacing between shots that would avoid contamination from the plasma recast layer was devised. A series of 2×2 grids at progressively greater spot spacings was placed across tourmaline–quartz boundaries on widely separated crystals (Fig. 1e). Shots 1 and 4 were on quartz; 2 and 3 were on tourmaline. If the shot distance was large enough to place shot 4 beyond the recast layer created by shots 2 and 3, the Fe and B intensities in shot 4 would be close to the background levels in shot 1. Grids with shot spacings of 100, 400, 500, 600, 700, 800, and 1000 µm were acquired; the spectra of shot 4 in selected grids is illustrated in Fig. 1f with a spectrum from background quartz for comparison. As shot spacing increases, the B and Fe peaks in shot 4 become less intense, suggesting that the recast layer thins with increasing distance from the shot location. The shot 4 spectra from 800 and 1000 µm grids are essentially the same, with low intensities of B and Fe peaks, although not quite as low as the background quartz. Shot spacing of 800 µm in 2×2 grids was chosen for the spatial analytical protocol for the project because the results were the same for 1000 µm shot spacing. Using grids saves valuable analytical time compared to single shots because the grid is automated, and the 2×2 grid possible could be used on many of the small crystals in the study.
3.3 Size of representative spectrum set
Earth materials, specifically tourmaline, can be inhomogeneous, and for determination of lithologic provenance, care must be taken to collect spectra that can be averaged to represent the sample's overall composition (i.e., Díaz Pace et al., 2011). Preliminary work on tourmaline analysis by Mount (2018) suggested that the average of 64 shots in an 8×8 grid (1 mm2 area) would produce a spectrum that is representative of the sample. The decision to analyze in 2×2 grids, also 1 mm2 area, necessitated a reevaluation of the number of spectra needed to acquire an average spectrum that is representative of the sample because the time involved in saving more spectrum files significantly lengthened total analysis time. LIBS spectra of a tourmaline sample vary naturally because of two different phenomena. First, shot-to-shot variation is characteristic of laser ablation techniques because the laser does not couple identically at two locations on the same material (Colao et al., 2004; Harmon et al., 2006, 2009; Tucker et al., 2010; Fabre et al., 2011; Ollila et al., 2012). This feature could be due to differences in the surface texture or orientation, small differences in composition, or small amounts of contamination (from the recast layer or other sources). Second, commonly tourmaline is chemically zoned and may vary significantly in composition, typically over short distances in the same crystal. The goal was to obtain an average spectrum that is representative of the outer surface of the crystal that likely was in equilibrium with the final host rock in which it was found.
The three large tourmaline crystals used as drift standards were used to determine the numbers of shots needed for a representative spectrum, in part because they had large analytical surfaces and are unzoned to the naked eye. The three tourmalines were from Badakhshan, NE Afghanistan (AFG) (Dutrow et al., 2019), the Black Hills in South Dakota, USA (SD), and North Carolina, USA (NC). To estimate the number of 2×2 (four-shot) grids necessary to obtain a representative average spectrum, 12 or 16 2×2 grids were acquired from widely spaced locations on each crystal. A PCA (principal component analysis) score plot was constructed for averages of the spectra in an increasing number of grids, i.e., the average for grid 1, the average for grids 1–2, the average for grids 1–3, and so on to the average of all grids 1−n. The average of all 16 grids contained the same number of shots as the original 8×8 grid, but they were more widely spaced over the crystal surface. The strategy in this analysis is that the average spectrum positions would eventually stop changing in the PCA score plot when incorporating more spectra did not alter the average spectrum.
PCA plots for this experiment are shown in Fig. 2. The scatter in the individual grids reflects the variation in composition of the 2×2 grids. In contrast, the spectra for cumulatively averaged spectra show large changes between averages with only a few grids (1–3) but vary less as the number of grids used in the average increases. The average spectra of 15 and 16 grids are very similar (Fig. 2b and c). Thus, collecting 16 2×2 grids from every sample, yielding 64 shots that would be averaged to make a single spectrum for the sample, was considered optimal.
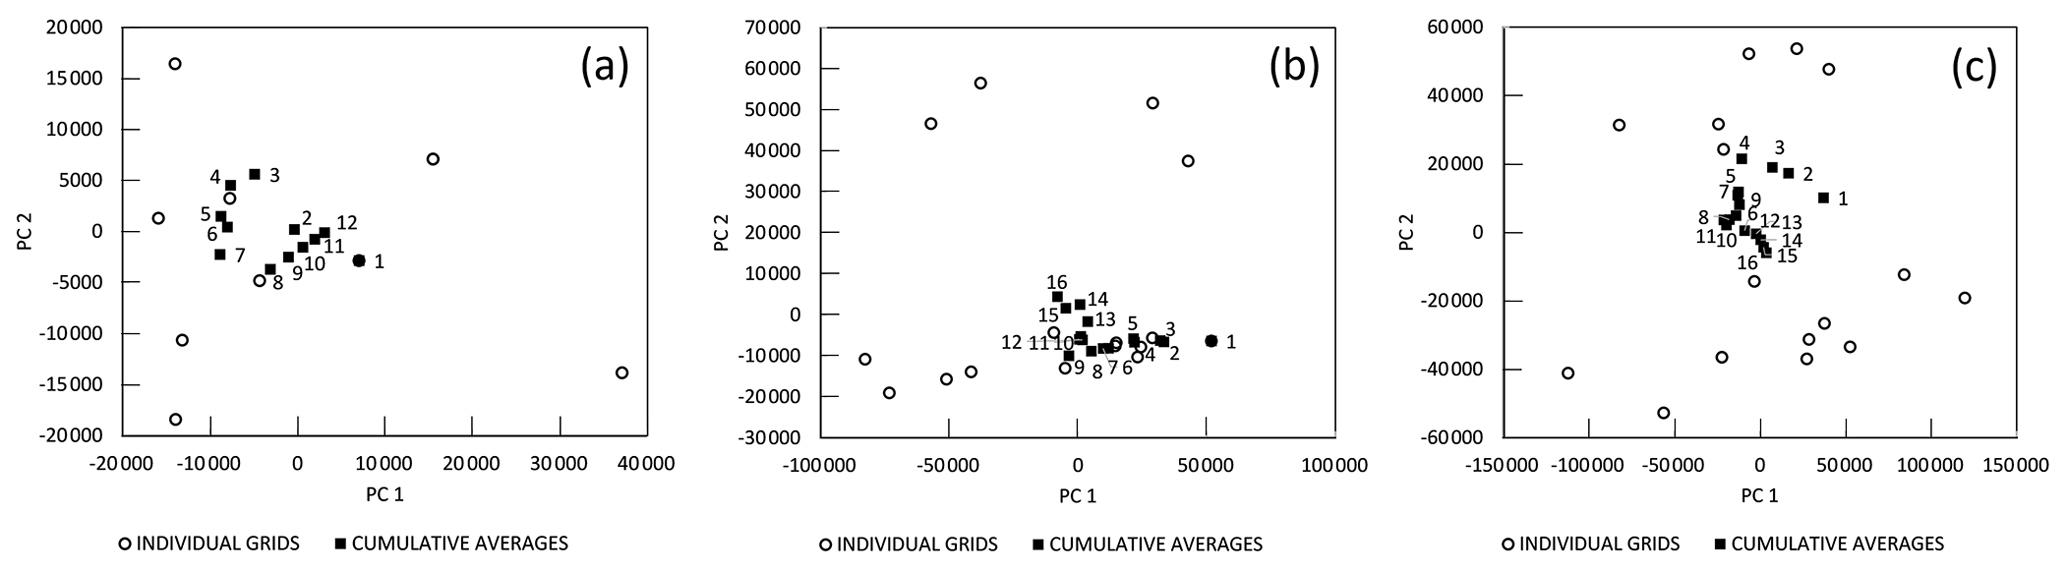
Figure 2PCA score plots that show the results of averaging an increasing number of LIBS spectra from 2×2 grids on three different tourmaline samples. Open symbols represent the compositions of individual grids. Filled squares represent the compositions of averages of an increasing number of grids. Numbers indicate the number of grids averaged. (a) Sample AFG (12 grids). (b) Sample SD (16 grids). (c) Sample NC (16 grids).
3.4 Efficacy of LIBS cleaning shots
Although cleaning shots are commonly employed for LIBS analyses (Alvey et al., 2010; Hark et al., 2012; Noll, 2012; Wang et al., 2016; Syvalay et al., 2019), they produce a layer of recast that can pre-contaminate the analytical surface. The surficial material is ablated by the cleaning shot, or grid of cleaning shots, and spectra are collected from a subsequent shot or shots in the same location. Typically, spectra from cleaning shots are not used. Mount (2018) examined the efficacy of cleaning shots when analyzing tourmaline with LIBS. Analytical surfaces of three different tourmaline samples were cleaned with methanol and a lint-free wipe; spectra from cleaning shots and analytical shots in the same locations were modeled with PCA. The compositional fields for cleaning shots and analytical shots completely overlapped for each sample, suggesting that any contamination that might have existed on the surface prior to the cleaning shot had an insignificant effect on the overall composition obtained. Given the results of Mount (2018) and the effect of the plasma recast, cleaning shots were not used because it appears that the first laser ablation is more representative of the material analyzed.
3.5 Effect of instrumental drift on multivariate analysis
Instrumental drift is caused mainly by the thermal expansion of the diffraction grating in the spectrometer. As a result, peaks are located at slightly higher wavelengths through time. Because this project employs multivariate analysis of raw spectra rather than calculating concentrations of elements from a calibration curve, a multivariate method to estimate and understand the effects of drift was needed. PCA was again used for this purpose.
Two types of materials were analyzed at the beginning and end of each analytical session. Synthetic quartz was the first sample analyzed, followed by the three large and inclusion-free tourmaline samples, termed drift samples. This order was reversed at the end of the session, with the synthetic quartz sample analyzed last. Each analytical session lasted from 4 to 16 d. Spectra from the synthetic quartz sample, lacking the compositional heterogeneity of the tourmaline drift samples, provide a clear record of drift. In contrast, the drift samples provide insight into how drift affects multivariate analysis of the more complex tourmaline spectra.
As the diffraction grating expands during run hours and peaks are recorded at higher wavelength, the amount of drift increases non-linearly with wavelength, as illustrated in Fig. 3. The change in bin width (nm bin−1) across the spectrum is also non-linear. In univariate analysis, uncorrected drift results in peak intensities recorded that are not at the highest intensity for the peak. In multivariate analysis, drift affects both the position of samples on score plots and the shape of loading plots.
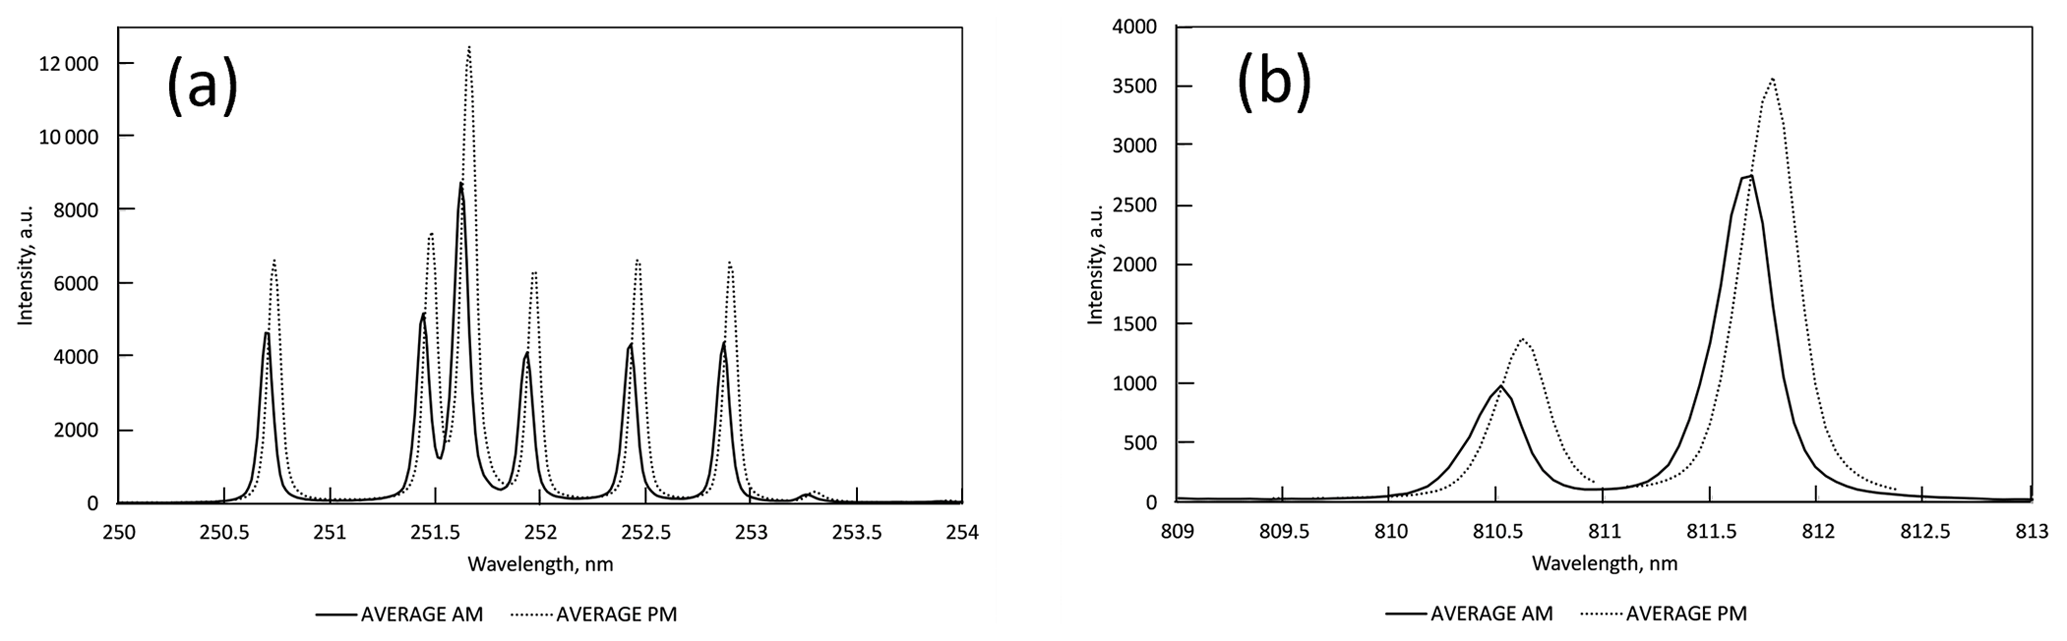
Figure 3Average of all pre-analysis (AM) and of all post-analysis (PM) spectra of synthetic quartz standard, showing the effect of drift. (a) Six Si peaks in the UV spectrum between 205 and 254 nm. (b) Two Ar peaks in the near-IR spectrum between 809 and 813 nm.
In PCA score plots calculated using spectra from each drift standard, the spectra fall into two groups rather than one, as expected for multiple analyses of the same tourmaline sample. The two groups are clearly defined by the time at which the spectra were acquired. Figure 4a is a PCA score plot for spectra for one of the tourmaline drift samples with analyses labeled for time of day: AM for prior to analysis and PM for end of analysis. In contrast, Fig. 4b is the same score plot with spectra labeled by the date of the analytical run. The position of spectra on the plot is not correlated to analytical run date, indicating that the daily drift far exceeds any long-term instrumental drift. Some of the scatter in these score plots is probably related to compositional heterogeneity in the tourmaline and some due to different lengths of time between the AM and PM analyses and thus different amounts of drift. Figure 4c is a PCA score plot for all analyses of all three tourmaline drift samples. The spectra fall into six regions: AM and PM groups for each sample.
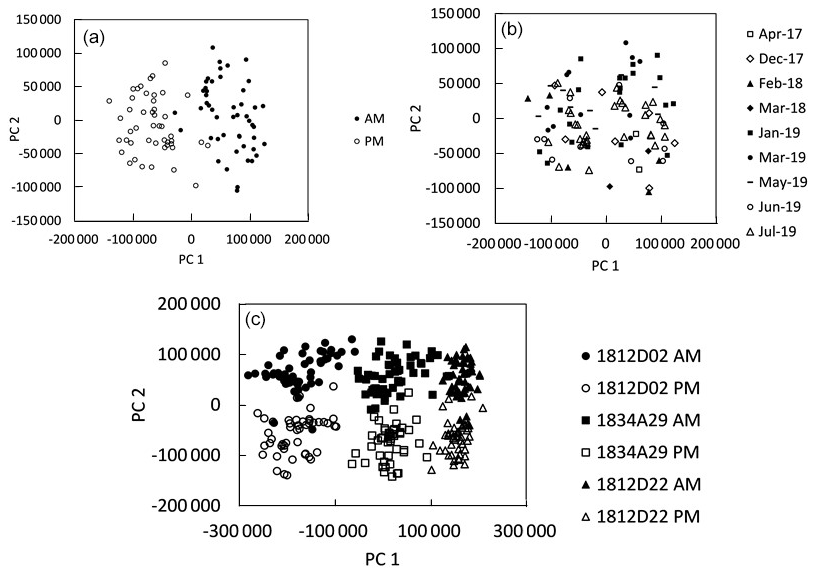
Figure 4Effect of spectrometer drift on principal component analysis (PCA) for three drift samples analyzed before (AM) and after (PM) on each day of an analytical run. (a) PCA score plot of spectra from a single tourmaline drift sample, with spectra coded by time of day. AM – prior to analysis; PM – after analysis. (b) The PCA score plot depicted in (a). with the spectra coded by analytical period between April 2017 and July 2019. (c) PCA score plot for three tourmaline standards analyzed over 2 years, separated by beginning of day (AM) and end of day (PM) analyses. Note that the spectra fall into six groups, AM and PM for each standard, rather than the expected three groups.
In loading plots, drift results in split peaks, with part of the peak indicating a positive influence and part indicating a negative influence (Fig. 5a). This phenomenon occurs because multivariate models such as PCA are sensitive to the shape of the peaks. In the model, the AM peak, which is located at a slightly lower wavelength, has a positive influence, and the direction of the principal component through the data, as well as the PM peak, at slightly higher wavelength has a negative influence. The directions of the split peaks correlate with the relative positions of the AM spectra with positive scores along PC1 and the PM spectra with negative scores along PC1 in Fig. 4a. This drift effect is more pronounced in PCA models with spectra from a single sample because the effect of drift is greater than the effect of compositional heterogeneity among several samples. For instance, Fig. 5b shows the loading plot for the same spectral range in Fig. 6a but for the score plot of all three tourmaline drift standards (Fig. 4c). While there is a notch at the peak position, the majority of the peaks are negative. Although the loading plot peak positions are no longer split, the effect of drift is not completely eliminated when modeling hundreds of tourmaline spectra; a method for correcting drift was needed.
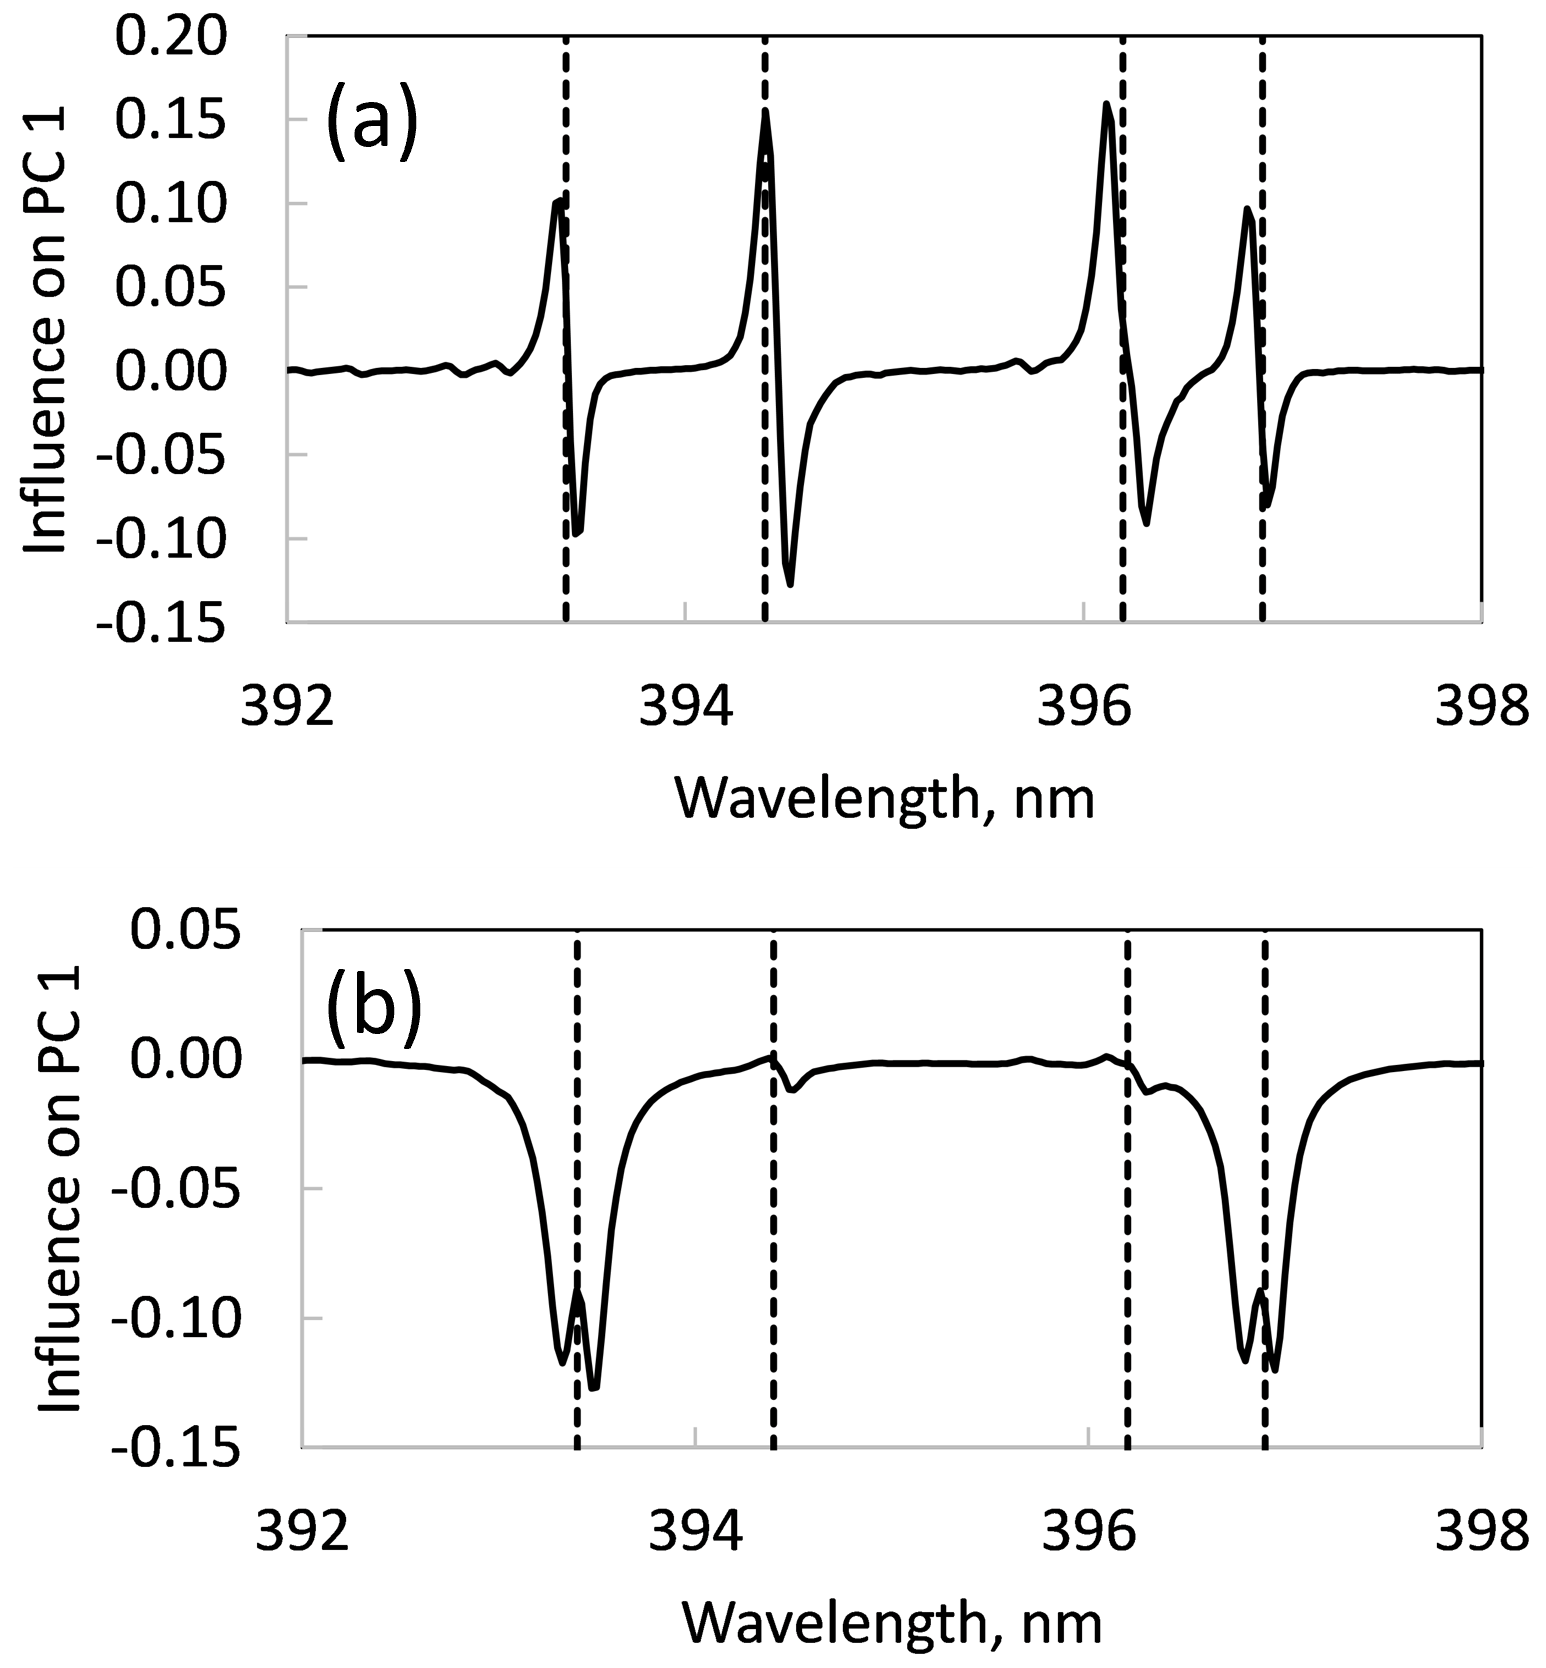
Figure 5Effect of drift on PCA loading plots. (a) Ca and Al doublet peaks in the PC 1 loading plot for score plots shown in (a) and (b) for a single tourmaline drift sample. The peaks, which normally would be entirely in either the positive or negative direction, are split because the peaks in the spectra are offset by drift. (b) Ca and Al doublet peaks in the PC 1 loading plot for the score plot for three tourmaline drift samples shown in Fig. 4c. The additional chemical complexity of the system overwhelms the drift signal and the peaks are entirely in the positive direction (see text for discussion).
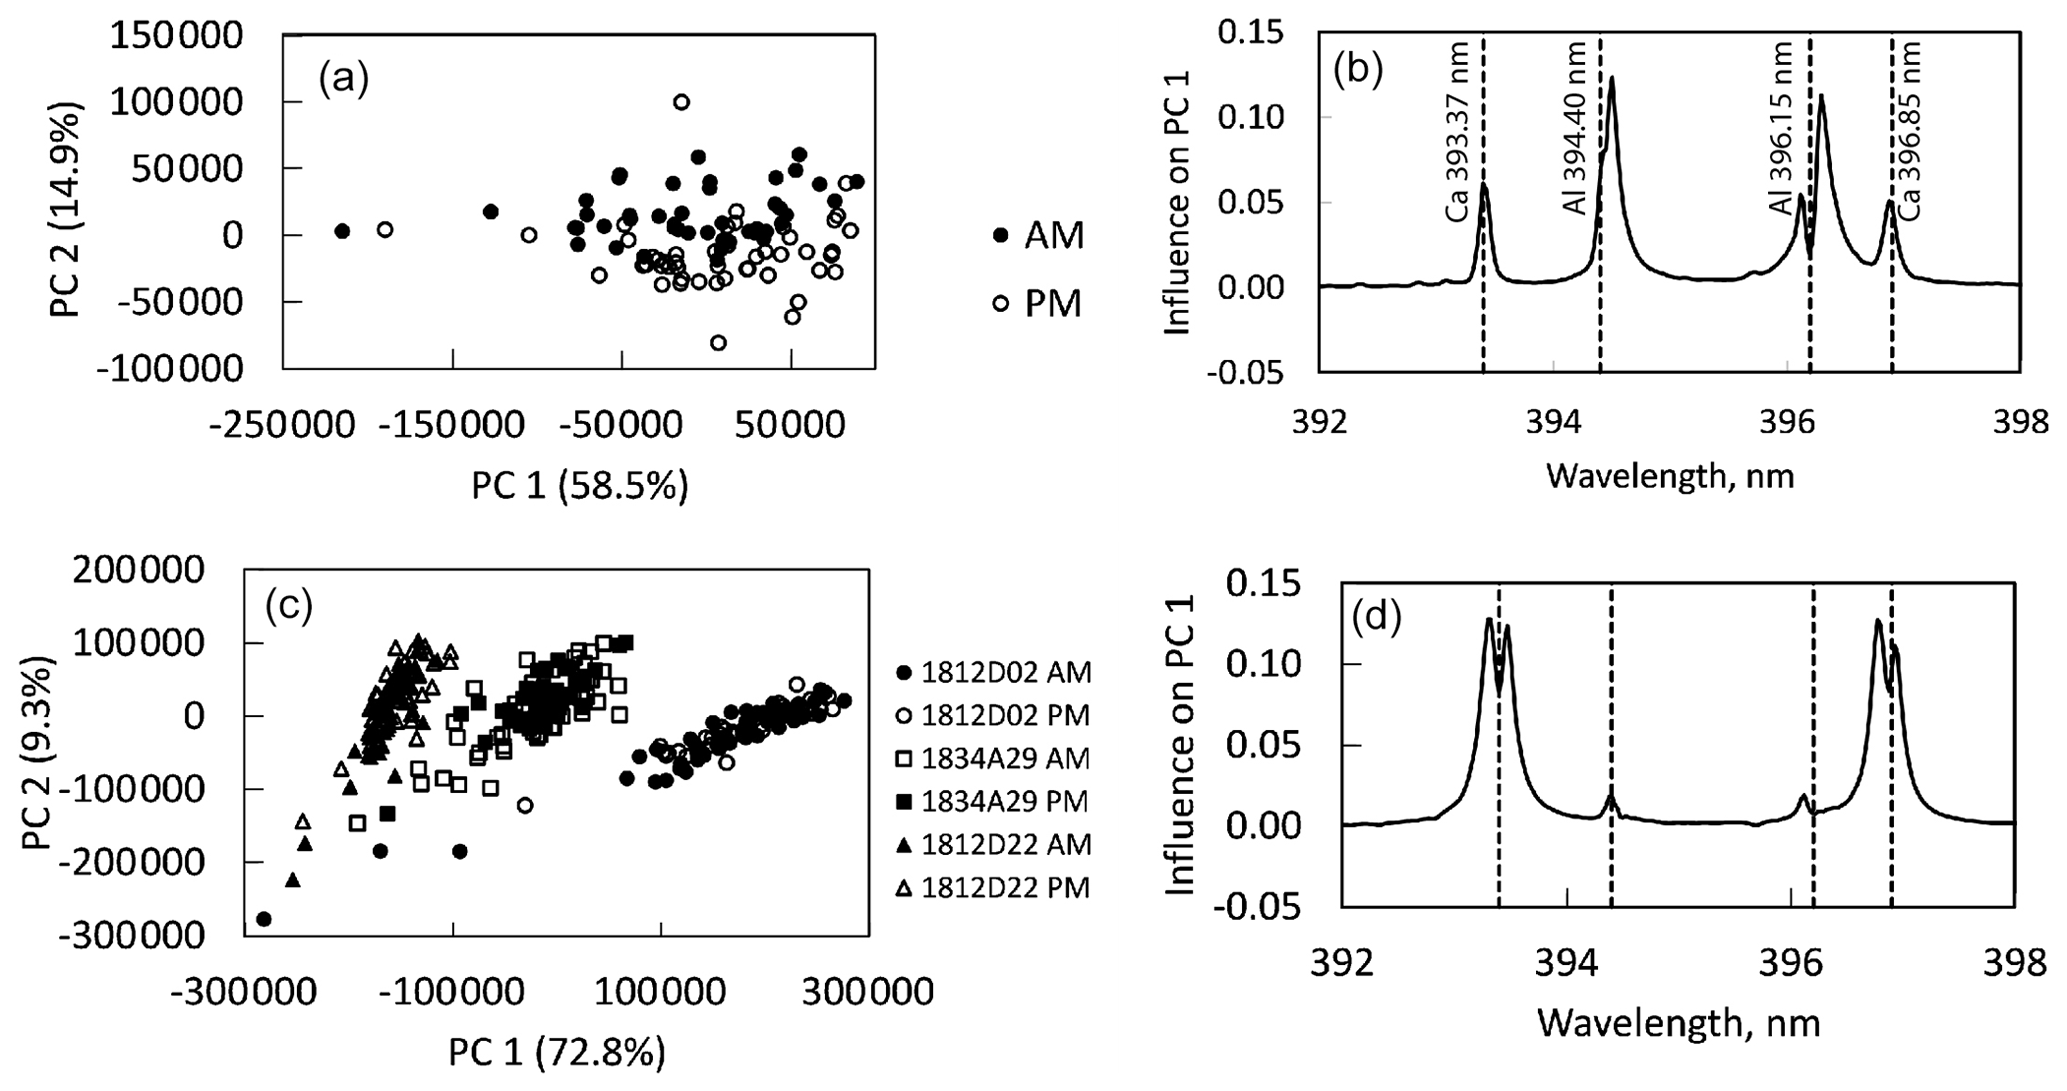
Figure 6Effect of drift correction on PCA score plots and loading plots. (a, b) Score plot and loading plot for the single tourmaline drift sample shown in Fig. 5a and b using drift-corrected spectra. Note that the specific spectra now plot in a single cluster. (c, d) Score plot and loading plot for three tourmaline drift standards shown in Fig. 5c using drift-corrected spectra. These data plot per tourmaline sample rather than in AM and PM clusters.
The loading plot peak notch observed in Fig. 5b is related to the self-absorption (Cremers and Radziemski, 2013) of the Ca peaks in spectra of the tourmaline standards. Self-absorption happens when Ca photons encounter and are absorbed by cool Ca atoms in the outer part of the plasma. Self-absorption occurs when the element has high concentration in the sample. It is interesting that Ca peak intensities in spectra acquired by the new grid spacing that avoids ablation of the recast layer are significantly lower than those acquired on the drift standards; split loading peaks are not observed in PCA models using spectra with the new grid spacing.
Because all the tourmalines analyzed contain Ca, drift correction was performed by placing the Ca II peak at 393.34 nm in the 393.398 bin, the most frequent location of the highest intensity of this Ca II peak. This repositioning was accomplished simply by adding or deleting cells at the beginning of the spectra to align the Ca II peaks in all spectra. This technique is similar to that used in NASA's ChemCam LIBS system (Wiens et al., 2013), in which Ti peak positions are used as a wavelength-channel map that correlates peak position to bin number.
Wiens et al. (2013) note that the intensities in each bin are related, in part, to bin width; resampling of the intensities is accomplished by using a spline fit to all peaks in ChemCam spectra. Our use of drift-corrected data in multivariate PCA models found that the simple shift in the data resolved many of the drift-related issues. Figure 6a and b are PCA score and loading plots using drift-corrected spectra for the same tourmaline drift sample. The non-corrected score plot is shown in Fig. 4a; the corresponding loading plot is in Fig. 5a. The drift-corrected AM and PM spectra plot in areas that nearly completely overlap in the score plot, and the peaks in the loading plot are no longer split. Similarly, the score plot for all three tourmaline drift samples now has three groups (one for each sample, Fig. 6c), although the loading plot peaks still have the small splits. It is likely that this approach works to remove drift needed by modeling because shifting the spectra is similar to the physical shift that occurs when the diffraction grating expands during heating; essentially, photons are recorded on a different pixel as the grating expands.
In an effort to overcome the bin width problem, linearization of the spectra was explored. This technique recalculates the spectra so that all the bins have the same width. The spectra from one tourmaline drift standard were linearized using proprietary software KestrelSpec™ from Catalina Scientific. The spectra were then shifted to align the Ca II 393.34 peak. The results of this process were very similar to shifting the non-linearized data. Linearization was not chosen for all the spectra in the larger study because the drift correction results for linearized spectra were similar to those using non-linearized spectra, the linearization process is time-consuming, and minimizing the number of changes to the spectra avoids the introduction of unintended correlations in the data set.
Overcoming each of these analytical issues results in robust analyses of tourmaline “hand” samples using LIBS (Dutrow et al., 2024). Consequently, the spectra obtained from tourmaline can be used for a variety of scientific applications in future studies.
LIBS analysis of Earth materials for geochemical research remains in its early stages as researchers explore the use of off-the-shelf LIBS instruments. Thus, the development of analytical protocols for different mineral-group analysis is important for using LIBS as an analytical technique. Identifying and solving these analytical issues provides confidence to expand to use of LIBS to other geomaterials and advancing the use of comparing entire spectra as proxies for the chemical signature of materials more widely.
Several important outcomes of this work include that the recast diameter was ∼ 800 µm, much larger than 100 µm (twice the laser spot diameter). The recast-contaminated quartz inclusions in tourmaline made it impossible to mathematically screen for non-tourmaline data and eliminate their spectra from the database. Because of the wide distribution of recast, no cleaning shots were collected. The wide spacing between shot locations necessitated moving from analysis in 8×8 1 mm2 grids to many 2×2 1 mm2 grids, which vastly increased the time involved in analysis, mainly in scanning for suitable surfaces and in saving the increased number of data files. Principal component analysis of spectra with an increasingly larger number of spectra showed that compositions changed significantly when 4–8 spectra were averaged but that compositions changed much less when 60–64 spectra were averaged. Thus, optimal acquisition of data was for 16 2×2 grids, a total of 64 shots, for each sample whenever possible.
Spectrometer drift from thermal expansion of the diffraction grating during the analytical day significantly affected PCA score and loading plots. On score plots, spectra of tourmaline drift standards plotted as pre-analysis and post-analysis groups rather than as a single group. Peaks in loading plots reflected wavelength drift with split peaks, where the lower-wavelength part of the peak had a positive influence on the direction of the principal component and the higher-wavelength part of the peak had a negative influence. Interestingly, the drift during any one analytical day was greater than the drift over the 2 years during which spectra for the project were collected. Drift correction was accomplished by shifting the spectra so that the most intense part of the Ca II 393.34 nm peak was located in the 393.398 bin. This procedure caused pre-analysis and post-analysis spectra of drift tourmaline standards to plot in the same field in a PCA score plot and minimized the problem of split peaks in loading plots. These solutions can be applied to multivariate analysis such as PCA of LIBS spectra acquired from other materials.
Spectra were modeled using PCA in the Unscrambler X software by CAMO software. PCA can also be performed in MATLAB and R.
NJM and BLD designed, conducted, and interpreted the experiments. NJM wrote the manuscript with contributions and edits from BLD.
The contact author has declared that neither of the authors has any competing interests.
Publisher’s note: Copernicus Publications remains neutral with regard to jurisdictional claims made in the text, published maps, institutional affiliations, or any other geographical representation in this paper. While Copernicus Publications makes every effort to include appropriate place names, the final responsibility lies with the authors.
This article is part of the special issue “Probing the Earth: spectroscopic methods applied to mineralogy”. It is not associated with a conference.
Many thanks to the organizers of the special spectroscopy session at the 2022 IMA session and for their willingness to undertake editing this special issue. The analytical help of Jenelle Hansen, Shoshauna Farnsworth-Pinkerton, and Marie Gibson is greatly appreciated. LIBS data were collected at Materialytics Technology Corp; support from their staff is gratefully acknowledged. The authors appreciate the input from the reviewers (Gioacchino Tempesta and a reviewer who wishes to remain anonymous), as well as the editors of this special issue.
This research has been supported by NSF-EAR-IF (grant no. 1551415 to Nancy J. McMillan and grant no. 1551434 to Barbara L. Dutrow and Darrell J. Henry).
This paper was edited by Giovanni B. Andreozzi and reviewed by Gioacchino Tempesta and one anonymous referee.
Alvey, D. C., Morton, K., Harmon, R. S., Gottfried, J. L., Remus, J. J., Collins, L. M., and Wise, M. A.: Laser-induced breakdown spectroscopy-based geochemical fingerprinting for the rapid analysis and discrimination of minerals: the example of garnet, Appl. Opt., 49, C168–C180, https://doi.org/10.1364/AO.49.00C168, 2010.
Bruder, R., L'Hermite, D., Semerok, A., Salmon, L., and Detalle, V.: Near-crater discoloration of a white lead in wall paintings during laser induced breakdown spectroscopy analysis, Spectrochim. Acta B, 62, 1590–1596, 2007.
Colao, F., Fantoni, R., Lazic, V., Paolini, A., Fabbri, F., Ori, G. G., Marinangeli, L., and Baliva, A.: Investigation of LIBS feasibility for in situ planetary exploration: An analysis on Martian rock analogues, Planet. Space Sci., 52, 117–123, 2004.
Cremers, D. A. and Radziemski, L. J.: Handbook of Laser-Induced Breakdown Spectroscopy, John Wiley & Sons Ltd. Chichester UK, 283 pp., https://doi.org/10.1002/9781118567371, 2013.
Díaz Pace, D. M., Gabriele, N. A., Garcimuño, M., D'Angelo, C. A., Bertuccelli, G., and Bertucelli, D.: Analysis of minerals and rocks by laser-induced breakdown spectroscopy, Spectrosc. Lett., 44, 399–411, 2011.
Dutrow, B. L. and Henry, D. J., Tourmaline: A geologic DVD, Elements, 7, 301–306, 2011.
Dutrow, B. L., Henry, D. J., and Sun, Z.: Origin of corundum-tourmaline-phlogopite rocks from Badakhshan, northeastern Afghanistan; a new type of metasomatism associated with sapphire formation, Europ. J. Mineral., 31, 739–753, 2019.
Dutrow, B. L., McMillan, N. J., and Henry, D. J.: A multivariate statistical approach for mineral geographic provenance determination using laser-induced breakdown spectroscopy and electron microprobe chemical data: A case study of copper-bearing tourmalines, American Mineralogist, 47 pp., in press, https://doi.org/10.2138/am-2023-9164, 2024.
Fabre, C., Maurice, S. Cousin, A., Wiens, R. C., Forni, O., Sautter, V., and Guillame, D.: Onboard calibration igneous targets for the Mars Science Laboratory Curiosity rover and the Chemistry Camera laser induced breakdown spectroscopy instrument, Spectrochim. Acta B, 66, 280–289, 2011.
Fabre, C., Devismes, D., Moncayo, S., Pelascini, F., Trichard, F., Lecomte, A., Bousquet, B., Cauzid, J., and Motto-Ros, V.: Elemental imaging by laser-induced breakdown spectroscopy for the geologic characterization of minerals, J. Anal. At. Spectrom., 33, 11345–1353, 2018.
Farnsworth-Pinkerton, S., McMillan, N. J., Dutrow, B. L., and Henry, D. J.: Provenance of detrital tourmalines from Proterozoic metasedimentary rocks in the Picuris Mountains, New Mexico, using laser-induced breakdown spectroscopy, J. Geosci., 63, 193–198, https://doi.org/10.3190/jgeosci.261, 2018.
Hark, R. R., Remus, J. J., East, L. J., Harmon, R. S., Wise, M. A., Tansi, B. M., Shughrue, K. M., Dunsin, K. S., and Liu, C.: Geographical analysis of “conflict minerals” utilizing laser-induced breakdown spectroscopy, Spectrochim. Acta B, 74/75, 131–136, 2012.
Harmon, R. S., DeLucia, F. C., McManus, C. E., McMillan, N. J., Jenkins, T. F., Walsh, M. E., and Miziolek, A.: Laser-induced breakdown spectroscopy – An emerging chemical sensor technology for real-time field-portable, geochemical, mineralogical, and environmental applications, Appl. Geochem., 21, 730–747, 2006.
Harmon, R. S., Remus, J., McMillan, N. J., McManus, C. E., Collins, L., Gottfried Jr., J. L., DeLucia, F. C., and Miziolek, A. W.: LIBS analysis of geomaterials: Geochemical fingerprinting for the rapid analysis and discrimination of minerals, Appl. Geochem., 24, 1125–1141, 2009.
Henry, D. J. and Guidotti, C. V.: Tourmaline as a petrogenetic indicator mineral: an example from the staurolite-grade metapelites of NW Maine, Am. Mineral., 70, 1–15, 1985.
Jolivet, L., Leprince, M., Moncayo, S., Sorbier, L., Lienemann, C.-P., and Motto-Ros, V.: Review of the recent advances and applications of LIBS-based imaging, Spectrochim. Acta B, 151, 41–53, 2019.
McManus, C. E. and McMillan, N. J.: Full-Spectrum Multivariate Analysis of LIBS Data, in: Laser Induced Breakdown Spectroscopy (LIBS): Concepts, Instrumentation, Data Analysis, and Applications, edited by: Singh, V. K., Tripathi, D. K., Deguchi, Y., and Wang, Z., 1, 213–227, Wiley & Sons, ISBN: 978-1-119-75842-6, 2023.
McMillan, N. J., Curry, J., Dutrow, B. L., and Henry, D. J.: Identification of the host lithology of tourmaline using laser-induced breakdown spectroscopy for application in sediment provenance and mineral exploration, Can. Mineral., 56, 39–410, 2018.
Merk, V., Berkh, K., Rammlmair, D., and Pfeifer, L.: Chemical and mineralogical analysis of samples using combined LIBS, Raman spectroscopy, and μ-EDXRF, Minerals, 13, 729, https://doi.org/10.3390/min13060729, 2023.
Moncayo, S., Duponchel, L., Mousavipak, N., Panczer, G., Trichard, F., Bousquet, B., Palascini, F., and Motto-Ros, V.: Exploration of metapixel hyperspectral LIBS images using principal component analysis, J. Anal. At. Spectrom., 33, 210–220, 2018.
Mount, M. C.: Laser-Induced Breakdown Spectroscopy (LIBS) analysis of detrital tourmaline as an indicator of sediment provenance, Ross Orogen, Antarctica, MS Thesis, New Mexico State University, 244 pp., 2018.
Nardecchia, A., de Juan, A., Motto-Ros, V., Gaft, M., and Duponchel, L.: Data fusion of LIBS and PIL hyperspectral imaging: understanding the luminescence phenomenon of a complex mineral sample, Anal. Chim. Acta, 1192, 339–368, 2021.
Nardecchia, A., de Juan, A., Motto-Ros, V., Fabre, C., and Duponchel, L.: LIBS and Raman image fusion: an original approach based on the use of chemometric methodologies, Spectrochim. Acta B, 198, 106571, https://doi.org/10.1016/j.sab.2022.106571, 2022.
Noll, R.: Laser-Induced Breakdown Spectroscopy, Fundamentals and Applications, Springer Berlin, Heidelberg, 543 pp., https://doi.org/10.1007/978-3-642-20668-9, 2012.
Ollila, A. M., Lasue, J., Newson, H. E., Multari, R. A., Wiens, R. C., and Clegg, S. M.: Comparison of two partial least squares-discriminant analysis algorithms for identifying geological samples with the ChemCam laser-induced breakdown spectroscopy instrument, Appl. Opt., 51, B130–B142, 2012.
Romppanen, S., Häkkänen, H., and Kaski, S.: Singular value decomposition approach to the yttrium occurrence in mineral maps of rare earth element ores using laser-induced breakdown spectroscopy, Spectrochim. Acta B, 134, 69–74, 2017.
Russo, R. E., Mao, X. L., Yoo, J. H., and Gonzalez, J. J.: Laser Ablation, in: Laser-Induced Breakdown Spectroscopy, edited by: Singh, J. P. and Thakur, S. N., Elsevier, Amsterdam, 49–82, ISBN: 9780444517340, 2007.
Russo, R. E., Bol'shakov, A. A., Mao, X., McKay, C. P., Perry, D. L., and Sorkhabi, O.: Laser Ablation Molecular Isotopic Spectrometry, Spectrochim. Acta B, 66, 99–104, 2011.
Russo, R. E., Mao, X., Gonzalez, J. J., Zorba, V., and Yoo, J.: Laser Ablation in Analytical Chemistry, Anal. Chem., 85, 6162–6177, 2013.
Serrano, J., Moros, J., and Laserna, J. J.: Exploring the formation routes of diatomic hydrogenated radicals using femtosecond laser-induced breakdown spectroscopy of deuterated molecular solids, J. Anal. At. Spectrom., 30, 2343–2352, 2015a.
Serrano, J., Moros, J., and Laserna, J. J.: Sensing signatures mediated by chemical structure of molecular solids in laser-induced plasmas, Anal. Chem., 87, 2794–2801, 2015b.
Syvalay, D., Guexenoc, J., and Bousquet, B.: Guideline for increasing the analysis quality in laser-induced breakdown spectroscopy, Spectrochim. Acta B, 161, 1–6, 2019.
Tucker, J. M., Dyar, M. D., Schaefer, M. W., Clegg, S. M., and Wiens, R. C.: Optimization of laser-induced breakdown spectroscopy for rapid geochemical analysis, Chem. Geol., 277, 137–148, 2010.
Wang, Q. Q., He, L. A., Zhao, Y., Peng, A., and Liu, L.: Study of cluster analysis used in explosives classification with laser-induced breakdown spectroscopy, Laser Phys., 26, 1–8, 2016.
Wang, X. Y., Ng, G. K. L., Liu, Z., Li, L., and Bradley, L.: EPMA microanalysis of recast layers produced during laser drilling of type 305 stainless steel, Thin Solid Films, 453/454, 84–88, 2004.
Wiens, R. C., Maurice, S., Lasue, J., Forni, O., Anderson, R. B., Clegg, S., Bender, S., Blaney, D., Barraclough, B. L., Cousin, A., Deflores, L., Delapp, D., Dyar, M. D., Fabre, C., Gasnault, O., Lanze, N., Maxoyer, J., Melikechi, N., Meslin, P.-Y., Newsom, H., Ollila, A., Perez, R., Tokar, R. L., and Vaniman, D.: Pre-flight calibration and initial data processing for the ChemCam laser-induced breakdown spectroscopy instrument on Mars Science Laboratory rover, Spectrochim. Acta B, 82, 1–27, 2013.