the Creative Commons Attribution 4.0 License.
the Creative Commons Attribution 4.0 License.
 | 08 Jan 2024
Thermodynamics of vivianite-group arsenates M3(AsO4)2 ⋅ 8H2O (M is Ni, Co, Mg, Zn, Cu) and chemical variability in the natural arsenates of this group
Anna Reichstein
Patrick Haase
Martin Števko
Jiří Sejkora
Edgar Dachs
In this work, we investigated the M3(AsO4)2⋅ 8H2O end members annabergite (M is Ni), erythrite (M is Co), and hörnesite (M is Mg) and their solid solutions. Acid-solution calorimetry and relaxation calorimetry were used to determine the solubility products (log Ksp) for annabergite (−33.7), erythrite (−32.1), and hörnesite (−22.3). Solubility products for other end members of this group were extracted from the literature and critically evaluated. The enthalpies of mixing are complex, related to subsystems M(1)3(AsO4)2⋅ 8H2O–M(1)M(2)2(AsO4)2⋅ 8H2O and M(1)M(2)2(AsO4)2⋅ 8H2O–M(2)3(AsO4)2⋅ 8H2O. They are small and positive for the annabergite–erythrite solid solution and small and negative for the annabergite–hörnesite solid solution. Autocorrelation analysis of Fourier-transform infrared (FTIR) spectra shows correlation of strain decrease in the structure with the negative enthalpies of mixing in the annabergite–hörnesite solid solution. A set of more than 600 electron microprobe analyses of the M3(AsO4)2⋅ 8H2O minerals documents the variability and complexity in this group. Most common compositions are those dominated by Ni, Co, or Ni–Co. The analytical results were used to calculate the maximal configurational entropies which could be a factor that compensates for the small enthalpies of mixing in the annabergite–erythrite solid solution. The data presented here can be used to model sites polluted with metals and arsenic and to enhance our understanding of complex solid solutions.
- Article
(7914 KB) - Full-text XML
-
Supplement
(1991 KB) - BibTeX
- EndNote


Most minerals, including secondary minerals in oxidation zones of ore deposits, occur as solid solutions and not as pure end members. Therefore, for modeling of the processes operating in oxidation zones and in mining waste, the thermodynamic parameters describing such solid solutions are necessary. New arsenate minerals are being described (e.g., Pekov et al., 2022; Karpenko et al., 2023), being defined as potential end members of solid-solution series. Given that the thermodynamics of many end-member compositions is still not known or not known well, it is illusory to expect the data for the many solid solutions to appear soon.
Glynn (2000) noted that “miscibility gaps, as determined from mineral compositions observed in the field, can be used to estimate thermodynamic mixing parameters in the absence of more accurate laboratory data”. He also noted that “this approach suffers from several problems” that could lead to overestimation or underestimation of the excess free energy (Gex) of a solid solution. A more precise description of a solid solution can be generated not only by calorimetric (e.g., Majzlan et al., 2023) or solubility investigations of the solutions, but also by experimental determination of the miscibility gap or spinodal gap (Glynn, 2000). Once the mixing parameters are known, Lippmann diagrams (Lippmann, 1980) can be constructed to graphically relate the activities of the aqueous ions and the coexisting composition of the solid solution (e.g., Tommaseo and Kersten, 2002; Zhu et al., 2016; Wang et al., 2017).
In this work, we investigated a large suite of natural and synthetic samples of vivianite-group arsenates. Analogs of the end members and of the solid solutions between the Ni, Co, and Mg end members were synthesized. The products were characterized by powder X-ray diffraction and Fourier-transform infrared spectroscopy, followed by autocorrelation analysis of the spectra. The enthalpies of dissolution in 5 N HCl were measured for all samples and used to calculate enthalpies of formation of the end members and the excess enthalpies in the solid-solution series. For the end members, low-temperature heat capacity was measured by relaxation calorimetry and used to determine their standard third-law entropy. Thermodynamic properties of the end members are summarized and presented graphically in phase diagrams, showing the relationship between phases in the appropriate systems. Furthermore, we present and discuss more than 600 electron microprobe analyses of natural vivianite-group arsenates, the population of the cationic sites with metals, and the frequency of individual metals in these minerals. Maximal configurational entropy in these minerals was calculated and considered one of the ways to stabilize some of the compositions.
1.1 Structure and crystal chemistry of the vivianite-group minerals
The common vivianite-group arsenates, especially annabergite and erythrite, were mentioned early in the mineralogical compendia (after excellent summaries by Thomas Witzke, http://tw.strahlen.org/typloc/annabergit.html and http://tw.strahlen.org/typloc/erythrin.html, last access: 9 November 2022). Their relationship to vivianite was not obvious in these early times. The crystal forms of erythrite had already been described by Romé de l'Isle (1773), but its monoclinic symmetry was first suspected by Breithaupt (1817) and later confirmed by Mohs (1824). Kersten (1843) analyzed erythrite samples and concluded that their stoichiometry is equivalent to that of Blaueisenerz, that is, vivianite. Dana (1850) believed that annabergite is triclinic, but Brooke and Miller (1852) assumed that the mineral is isotypic with erythrite and vivianite and therefore monoclinic. The monoclinic symmetry and isotypism of annabergite with vivianite were confirmed first by the measurement of crystal forms by Sachs (1906) on material from Laurion in Greece.
The monoclinic crystal structure of vivianite, a mineral with nominal composition Fe3(PO4)2⋅ 8H2O, was solved and investigated by Mori and Ito (1950), Fejdi et al. (1980), Bartl (1989), and Dormann et al. (1982). The structure of vivianite consists of heteropolyhedral sheets that are built by phosphate tetrahedra, FeO2(OH2)4 octahedral monomers, and Fe2O6(OH2)4 octahedral dimers (Fig. 1). Hence, there are two crystallographically distinct positions for the cations of divalent metals. Because of the different multiplicities of the cation sites, the ratio between them is 2 : 1, and a general formula of the vivianite-group minerals is AB2(TO4)2⋅ 8H2O, where A is the cation occupying the octahedral monomers and B the cations in the octahedral dimers. T are the tetrahedral cations, either As5+ or P5+. Crystal structures of the arsenates of the vivianite group were studied by Koritnig and Süsse (1966), Capitelli et al. (2007), and Yoshiasa et al. (2016). They determined no deviation from the parent structure of vivianite.
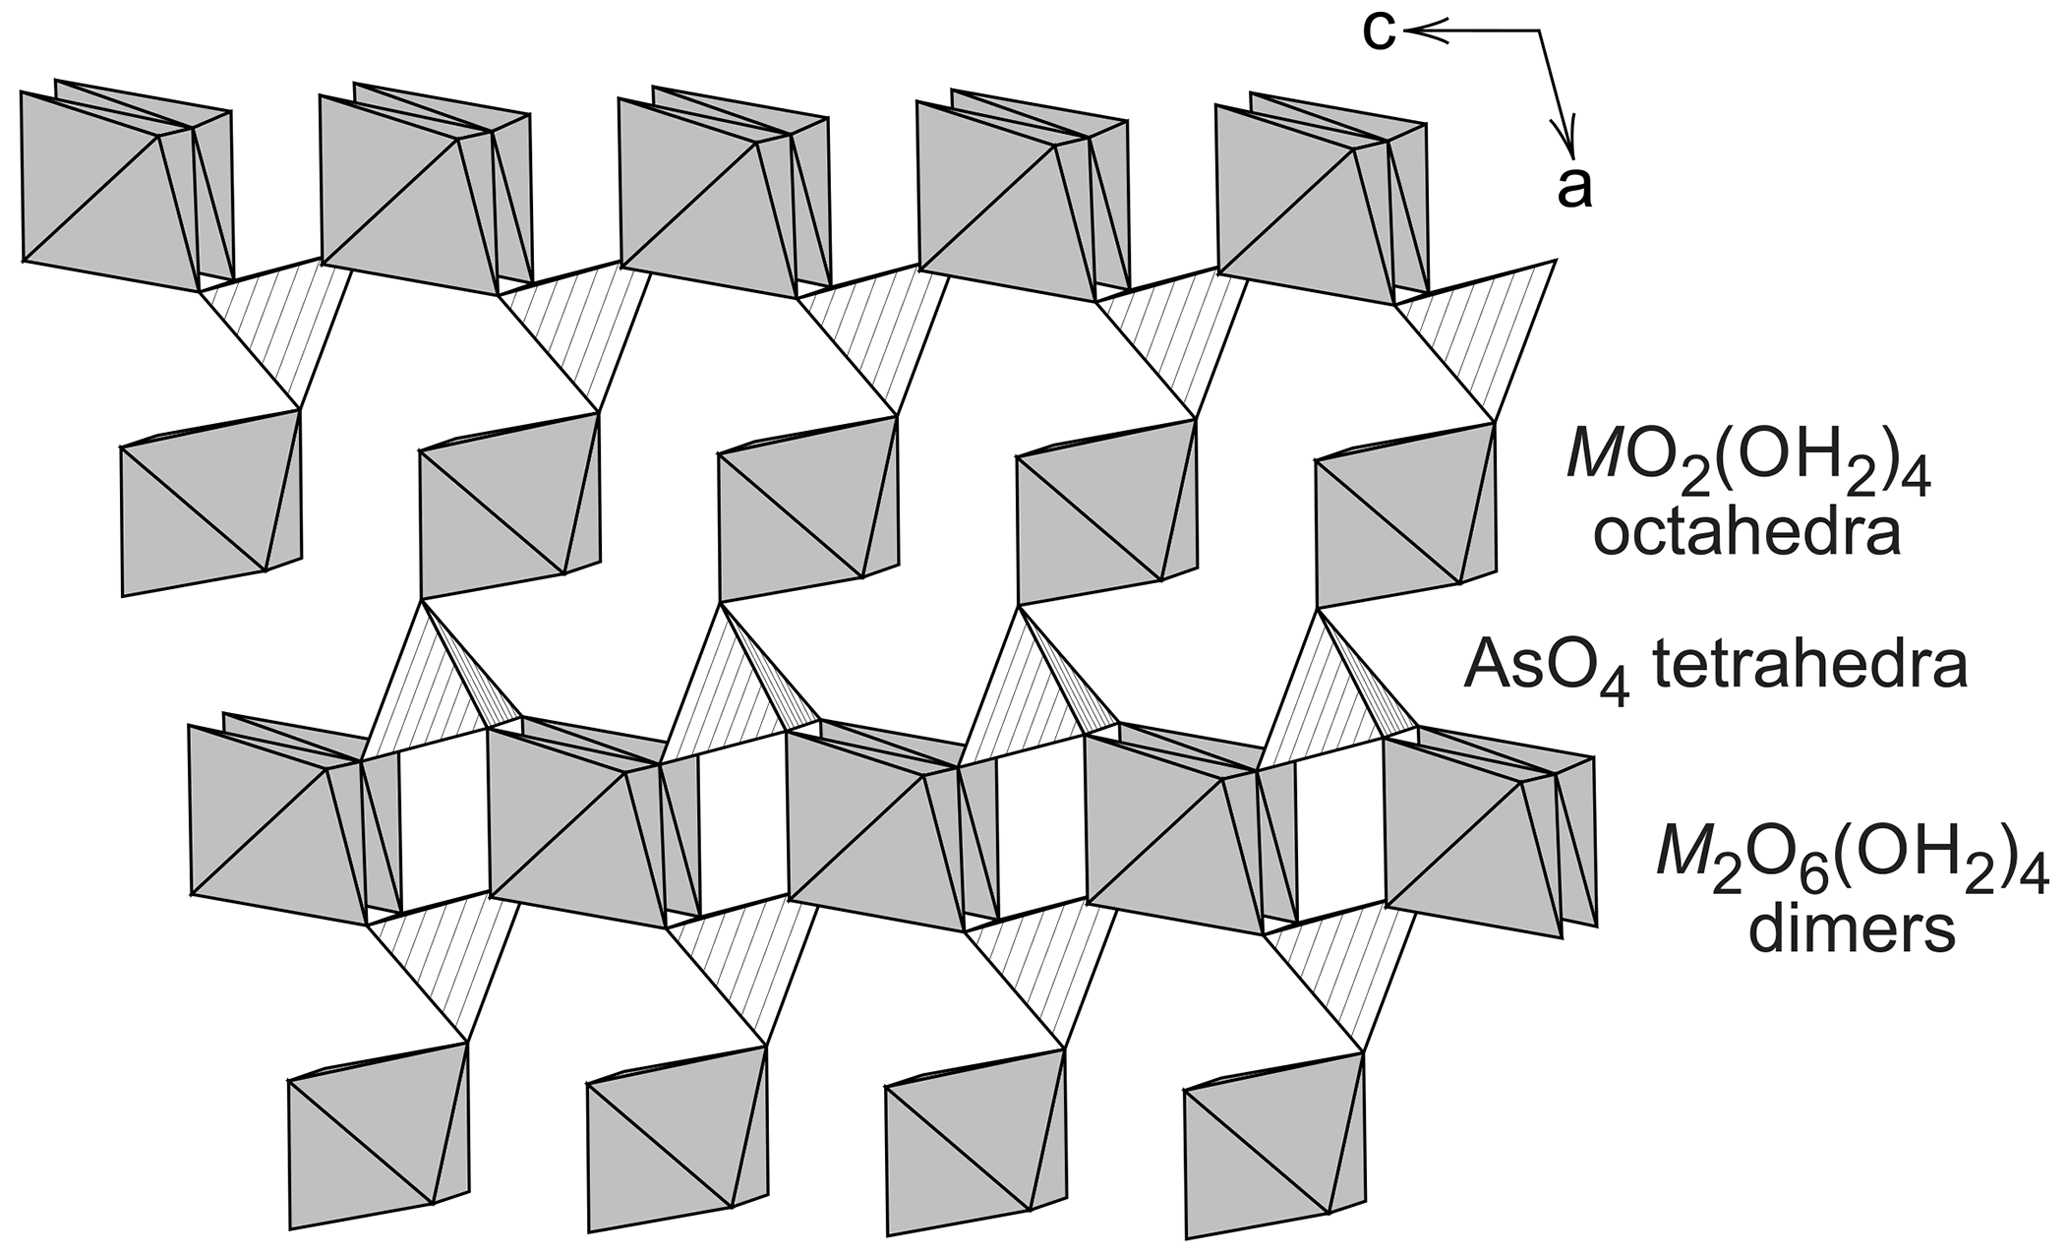
Figure 1A fragment of the crystal structure of the vivianite-group arsenates, projected onto 010.
Table 1Arsenate members of the vivianite group. The composition given relates to the formula M3(AsO4)2⋅ 8H2O.
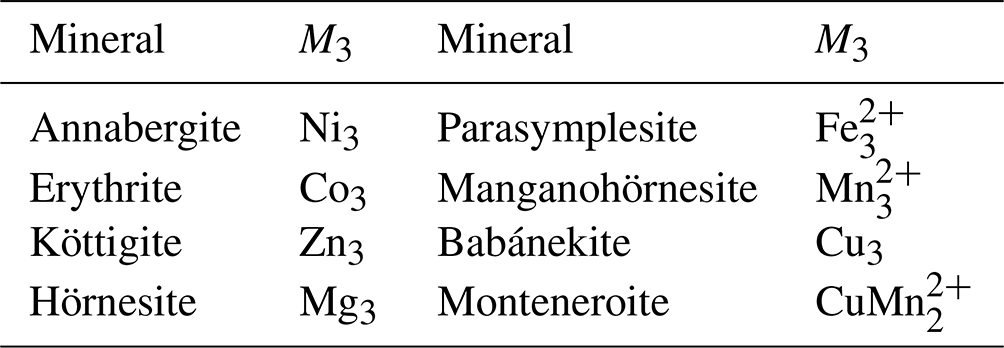
A number of arsenates (Table 1) adopt the vivianite structure and thus are said to belong to the vivianite group. There is evidence of a certain degree of cation ordering over the two available metal sites in some other vivianite-group minerals (Giuseppetti and Tadini, 1982; Rojo et al., 1996; Wildner et al., 1996; Yakubovich et al., 2001). The ordering means preferential assignment of a cation of an element to one of the structural sites and the assignment of the other cation(s) to the other site. The first mineral of this structure type with experimentally confirmed ordering on the octahedral sites was the phosphate barićite, nominally Fe2+Mg2(PO4)2⋅ 8H2O (Yakubovich et al., 2001). Another, recently described mineral with this type of ordering is monteneroite, CuMn2(AsO4)2⋅ 8H2O (Kampf et al., 2020). A number of vivianite-group arsenate samples, mostly belonging to annabergite and with possible cation ordering, were recently described by Lecca et al. (2022). Such ordering is missing, though, where it would be expected, for example in Cu-rich compositions (Plášil et al., 2017). The Cu-rich compositions, in particular, could be expected to order cations because of the different bonding environments of Cu2+, owing to the Jahn–Teller distortion.
In monteneroite, CuMn2(AsO4)2⋅ 8H2O (Kampf et al., 2020), the ordering is pronounced; Cu2+ occupies the M(1) site and Mn2+ the M(2) site. In the natural babánekite (nominally Cu3(AsO4)2⋅ 8H2O) samples (Plášil et al., 2017), Cu2+ dominates among the divalent cations and must be present on both M(1) and M(2) sites. Plášil et al. (2017) hypothesized that Cu2+ in babánekite preferentially occupies the M(1) site before entering the M(2) site.
The different cations able to enter the crystal structure of the vivianite-group arsenates may have preference for a type of the octahedral sites. It has previously been suggested that the cations may partition between the M(1)O2(OH2)4 monomers and the M(2)2O6(OH2)4 dimers. Wildner et al. (1996) used spectroscopic methods on natural samples to determine that Mg2+ and Fe2+ prefer the M(2) sites. Preference of Mg2+ for M(2) was found also by Rojo et al. (1996). Ordering between Ni2+ and Mg2+ was suggested by Giuseppetti and Tadini (1982), who studied natural samples of Mg-rich annabergite. Martens et al. (2005) deduced that Ni2+ prefers the M(1) sites, whereas Co2+ prefers the M(2) site in the synthetic Ni–Co solid-solution series. Antao and Dhaliwal (2017) determined the preference of (Co,Ni,Zn) for M(1) and the preference of Fe2+ for M(2) in the samples they studied.
Besides the monoclinic members of the vivianite group, there are triclinic polymorphs dominated by Zn (metaköttigite) and Fe (symplesite). There is some confusion regarding the names and symmetries of symplesite and parasymplesite. In this work, we will use the mineral name parasymplesite to denote the monoclinic Fe2+ end member of the vivianite group.
There is also some degree of variability at the tetrahedral site. Natural arsenate members of the vivianite group commonly contain a small amount of phosphate. The natural vivianite-group phosphates tend to be free of arsenic, but this fact is likely caused by geochemical factors (e.g., lack of arsenic in the uncontaminated sediments where vivianite crystallizes) rather than the crystal chemical factors. A full solid solution between the arsenate and phosphate end members is not known, however. Equally, no vanadate members of the vivianite group are known from nature, although Antao and Dhaliwal (2017) assumed that they could be synthesized.
Thermodynamic measurements of the vivianite-group arsenates were made mostly by solubility determinations (Chukhlantsev, 1956; Charykova et al., 2013; Wei et al., 2013; Zhu et al., 2013). Many of these studies suffered from incongruent dissolution of the studied solids. Wei et al. (2013) wrote that “the release of cobalt or nickel into the bulk solution was always less when compared with release of arsenate”. On the other hand, Charykova et al. (2013) wrote that the “As content is systematically underestimated with regard to cobalt and nickel in all analyzed solutions”. Equilibration times also vary. Charykova et al. (2013) took the aqueous samples after 14 d without analyses at intermediate times. Wei et al. (2013) documented the evolution of the aqueous phase for 125 d, but the arsenate concentrations did not stabilize even after this time (see their Fig. 4). There were also some attempts to estimate the thermodynamic properties of these phases (Essington, 1988), but they are likely too imprecise. The thermodynamic properties of the annabergite–erythrite solid solution were investigated by Wei et al. (2013), who determined that this solid solution deviates slightly from ideality, with negative Gibbs free energies of mixing. The minimum Gex determined in this study was −1.2 kJ mol−1. The existence of miscibility gaps in the binary Ni–Co, Mg–Co, and Ni–Mg solid solutions was postulated by Yakhontova et al. (1981), but only on the basis of 45 analyses of natural samples. Jambor and Dutrizac (1995), on the other hand, determined by their syntheses that the solid solutions show no miscibility gaps.
1.2 Terminology and sample labeling
The compositional variability of the natural or synthetic samples can be expressed by a full formula, for example (Ni0.7Co0.3)3(AsO4)2⋅ 8H2O or (Ni2.1Co0.9)(AsO4)2⋅ 8H2O. A shorthand for this notation is the occupancy of the metal sites, normalized to 100 at. %. For the example given in this section, this notation would be Ni70Co30. This notation is used throughout this paper and always refers to atomic percent. The same notation can be used to describe the atomic ratios of the metals in the parental solutions used in the syntheses.
In this work, we may refer to synthetic samples with their mineral names for simplicity. A synthetic sample Ni100 can be referred to as annabergite or a synthetic sample Co80Mg20 as a member of the erythrite–hörnesite solid solution.
2.1 Synthetic samples
The end members of annabergite and erythrite and their solid solution were synthesized from aqueous solutions, closely following the procedure of Jambor and Dutrizac (1995). Two starting solutions were prepared separately. One solution consisted of Ni(NO3)2 and Co(NO3)2, mixed in the desired ratio, so that the total Ni+Co concentration reached 0.014 M in total. The other solution was made by dissolving Na2HAsO4⋅ 7H2O in deionized water to reach the concentration of 0.02 M As. The pH of both solutions was adjusted to 6 with 0.1 M NaOH or HNO3. Both solutions were heated on a heating plate to 80 ∘C. The arsenate solution (250 mL) was pumped into 750 mL of the solution at 2 mL min−1 under vigorous stirring with a magnetic Teflon-coated bar. Once the mixing was completed, the suspensions were filtered, washed with deionized water, and resuspended in 250 mL of deionized water. The suspensions were transferred into glass bottles, sealed tightly, and stored in a heating cabinet at 80 ∘C for 1 year. Thereafter, the products were filtered, washed with deionized water, and dried at room temperature. Additional later syntheses showed that the aging time at 80 ∘C can be reduced to 1 month without much difference in the crystallinity of the samples.
The Ni–Mg and Mg–Co solid solutions were synthesized with modifications of the procedure outlined by Martens et al. (2005). In this case, 333 mL of 0.02 M Na2HAsO4 solution was slowly dripped into 666 mL of Ni–Co–Mg solution. The latter solution was prepared from sulfates (NiSO4⋅6H2O, CoSO4⋅ 7H2O, MgSO4⋅ 7H2O) with a total sulfate molarity of 0.014 M. The metal sulfate solution was brought on a heating plate to 80 ∘C. The arsenate solution was filled into a burette and allowed to drip slowly into the hot metal sulfate solution. The total amount (333 mL) was dripped over 2.5 h under vigorous stirring. Once the mixing was completed, the precipitate was filtered, washed with deionized water, and dried for 24 h at room temperature. Afterwards, the solid was resuspended in 80 mL deionized water, transferred into a borosilicate bottle, and closed tightly. The bottles were stored for 30 d at 80 ∘C in heating cabinets. The final product was filtered, washed with deionized water, and dried at room temperature.
During the syntheses, it turned out that an increasing amount of Mg leads progressively to worse results, either no precipitate or an amorphous product. Numerous trials indicated that pH has to be controlled to obtain the desired pure and crystalline products. During the syntheses with an Mg molar fraction over 0.5, pH was continuously monitored, adjusted manually with dilute NaOH or H2SO4 solutions, and kept at values between 5.5 and 6.0. Furthermore, for syntheses with an Mg molar fraction over 0.5, the addition of the arsenate solution was slower and took 3 h.
Attempts to prepare similar solid-solution series with mixing of Ni–Cu and Ni–Zn failed. The products were always contaminated by olivenite (Cu2(AsO4)OH) or adamite (Zn2(AsO4)OH), respectively. The samples were always fine-grained mixtures of the phases, and it was not possible to separate the impurities mechanically from the rest of the sample.
2.2 Natural samples
An extensive sample set was amassed by the authors over years of sampling of oxidation zones, mostly at sites in the Czech Republic and Slovakia (Fig. 2). Some observations, related to specific localities or minerals, have been published previously (Sejkora et al., 2014; Plášil et al., 2017; Vrtiška et al., 2017). A few samples originated from localities in Austria, and other sets of analyses were extracted from Polish localities from publications or kindly provided by colleagues (Ciesielczuk et al., 2018; Siuda and Macioch, 2018). One data set refers to minerals from Bou Azzer in Morocco (Dumańska-Słowik et al., 2018).
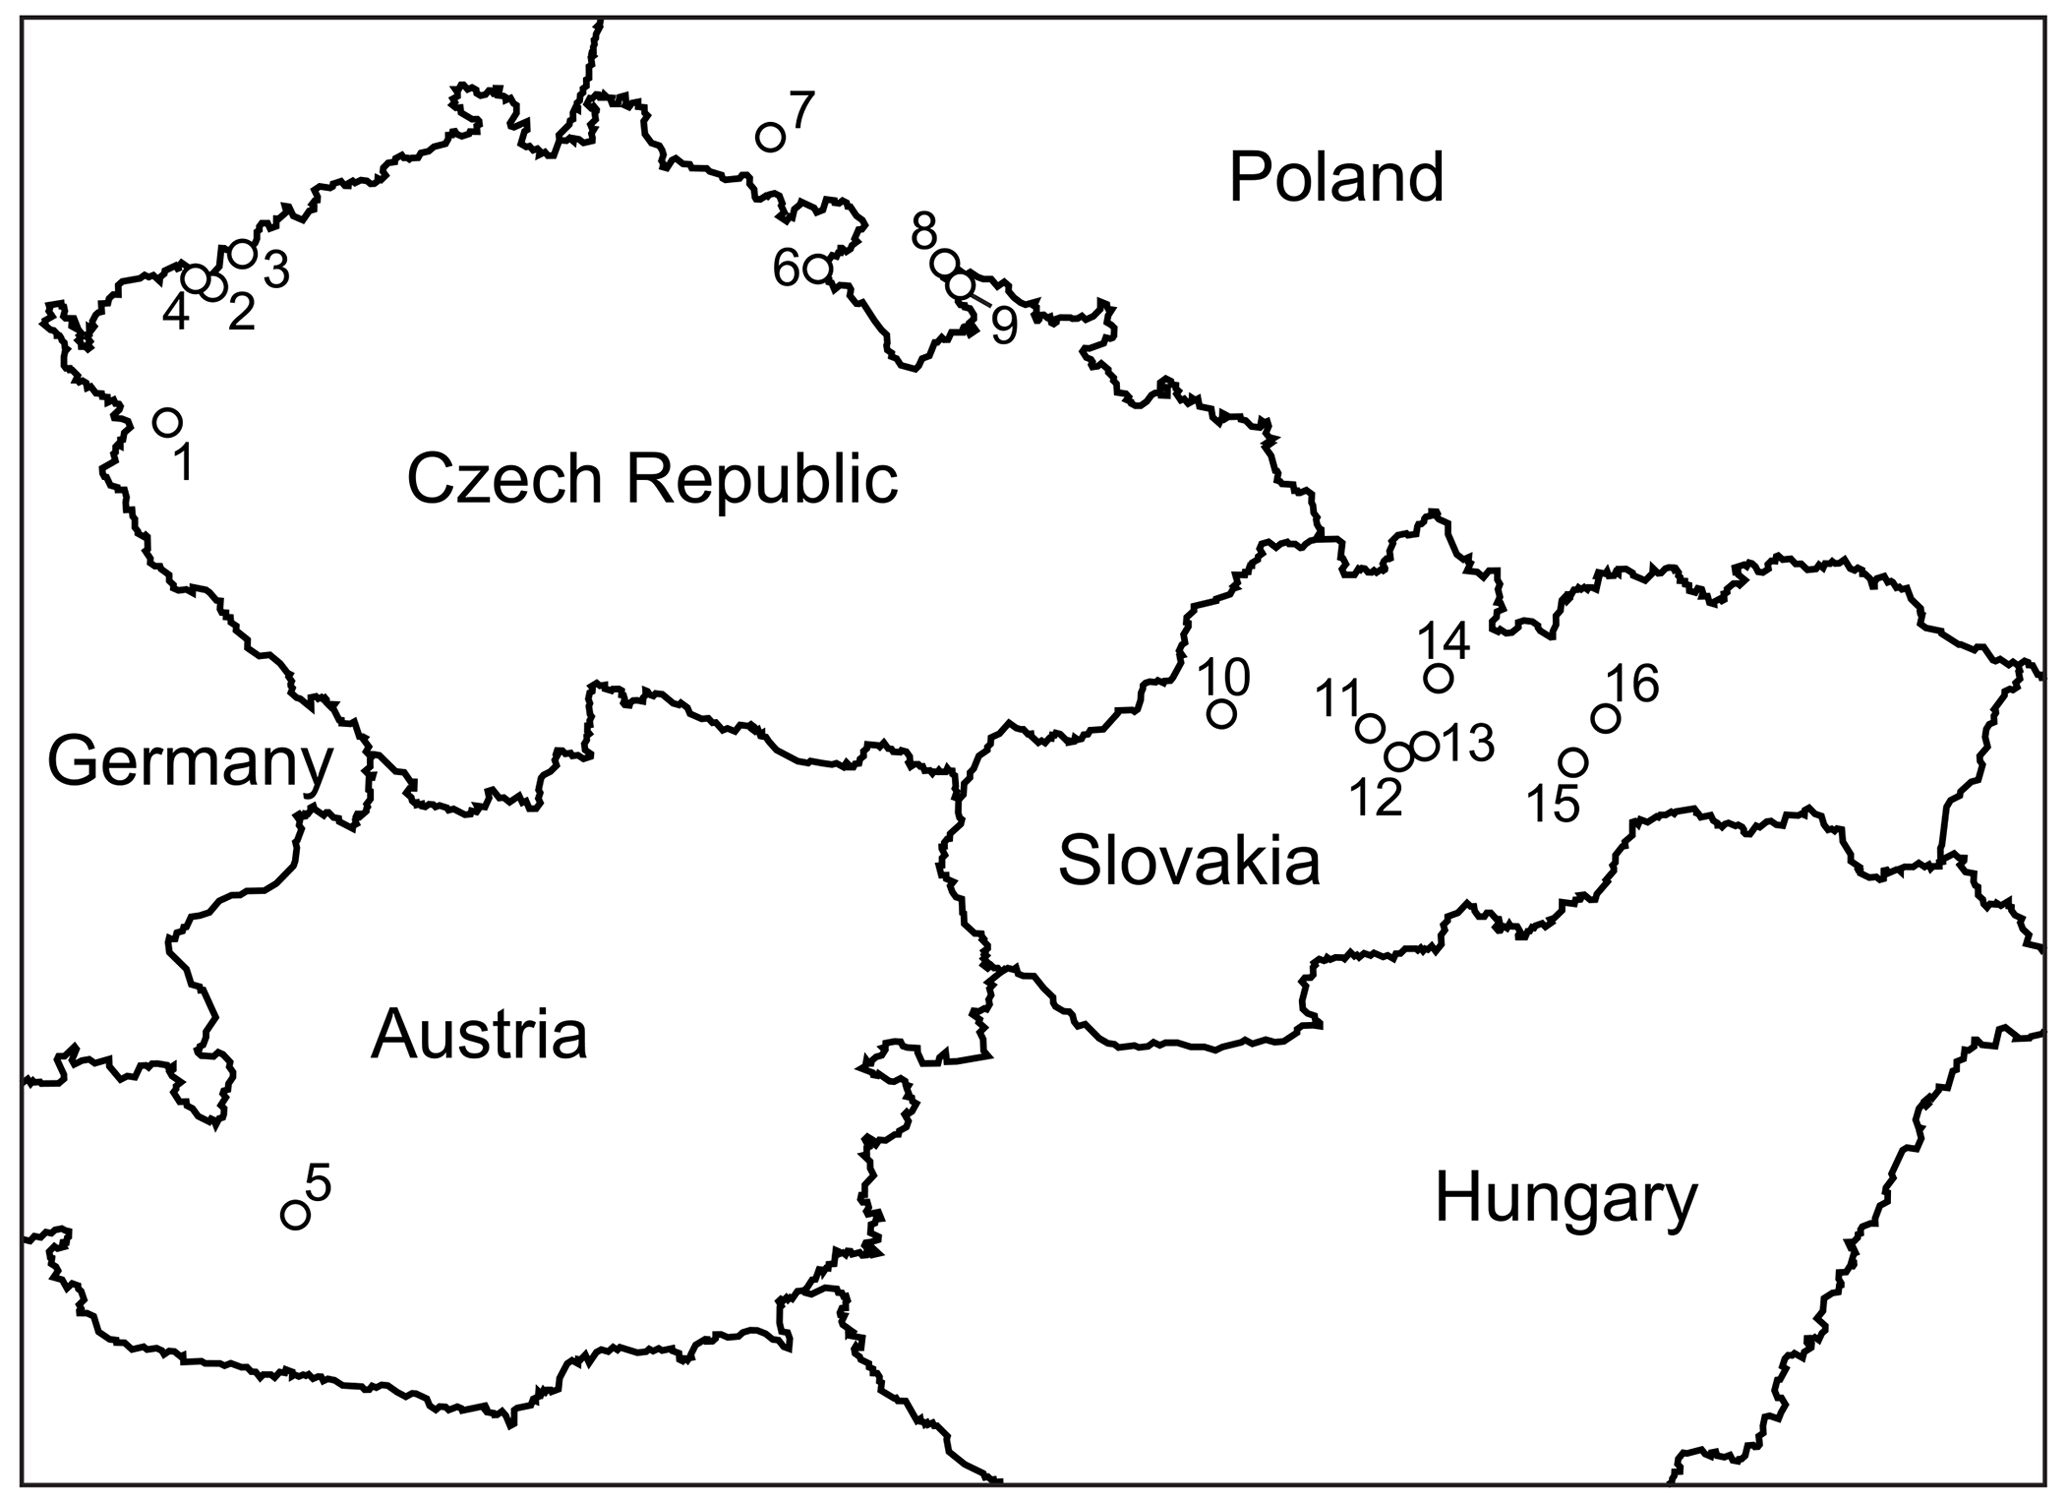
Figure 2Localities of vivianite-group arsenates in central Europe whose analyses were acquired or used in this study: 1 – Michalovy Hory; 2 – Plavno; 3 – Přísečnice; 4 – Jáchymov (multiple localities in the Jáchymov mining district); 5 – Rotgülden; 6 – Běloves; 7 – Miedzianka (Ciesielczuk et al., 2018); 8 – Złoty Stok (Siuda and Macioch, 2018); 9 – Zálesí; 10 – Čierna Lehota; 11 – Špania Dolina, Ludovika shaft; 12 – Drienok, Poniky; 13 – Svätodušná, Ľubietová; 14 – Dúbrava, Jozef vein; 15 – Herichová, Chyžné; 16 – Zemberg, Dobšiná.
All synthetic samples were screened by powder X-ray diffraction (pXRD). The data were collected with a Bruker D8 ADVANCE with DAVINCI design, and with Cu Kα radiation, an Ni filter, and a Lynxeye 1D detector. The data were collected in the angular range of 5–90∘ 2θ, with a step size of 0.02∘ 2θ, and with a 0.25 s time per step. Lattice parameters were refined using the Jana2006 program (Petříček et al., 2014).
The elemental composition of the synthetic samples was analyzed with a simultaneous radial inductively coupled plasma optical emission spectrometer (ICP-OES) 725-ES (Agilent, Germany) with CCD detector and an ASX-520 autosampler (Teledyne CETAC, Omaha, Nebraska, USA). Each sample (≈ 10 mg) was dissolved in 15 mL of 0.5 M HCl. Some of the samples, especially those rich in Ni, had to be heated to 70 ∘C for 10 min to speed up the dissolution.
Fourier-transform infrared (FTIR) transmission spectra were recorded using a Nicolet iS10 spectrometer (Thermo Fisher Scientific, Germany). The powdered samples (1–2 mg) were mixed with KBr (FTIR spectroscopy grade, Merck), gently ground, and pressed to pellets. The pellets were measured in the wavenumber range from 4000 to 400 cm−1 with 64 scans per spectrum at a resolution of 4 cm−1. The spectra were normalized to maximum intensity.
Thermogravimetric (TG) and differential thermal analysis (DTA) were performed with a SETARAM TGA 92 instrument. The sample, loaded in an alumina crucible, was heated from room temperature up to 900 ∘C with a rate of 10 ∘C min−1 in a flow of argon.
All natural samples were inspected visually and under a binocular microscope for associated primary and secondary minerals. Minerals of the vivianite group, when recognized, were picked up from the specimens, embedded in epoxy, and polished for further analyses.
The entire analytical work on the natural samples, either in this study or in the studies cited, was done by an electron microprobe. In this work, a Cameca SX100 electron microprobe (Masaryk University in Brno, Czech Republic) was used for most of the samples (WDS mode, 15 kV, 5 nA, and 10 µm beam diameter), with the following standards and X-ray lines: albite (Na Kα), sanidine (K Kα, Al Kα, Si Kα), Mg2SiO4 (Mg Kα), fluorapatite (P Kα, Ca Kα), vanadinite (Pb Mα, Cl Kα), almandine (Fe Kα), spessartine (Mn Kα), Ni2SiO4 (Ni Kα), Co (Co Kα), lammerite (Cu Lα, As Lα), gahnite (Zn Kα), ScVO4 (V Kα), Sb (Sb Lβ), Bi (Bi Mβ), SrSO4 (S Kα), and topaz (F Kα). For only the samples from Rotgülden, a JEOL JXA-8230 electron microprobe (University of Jena, Germany) was used (WDS mode, 15 kV, 15 nA, and 10 µm beam diameter), with the following standards and X-ray lines: orthoclase (K Kα), corundum (Al Kα), wollastonite (Ca Kα, Si Kα), FeS (S Kα), apatite (P Kα), InAs (As Lα), galena (Pb Mα), periclase (Mg Kα), Cu (Cu Lα), V (V Kα), hematite (Fe Kα), rhodochrosite (Mn Kα), sphalerite (Zn Kα), Ni (Ni Kα), and Co (Co Kα).
Acid-solution calorimetry was performed with an IMC-4400 (Calorimetry Sciences Corporation) (Majzlan, 2017). A water reservoir with a constant temperature of 298.15 K maintained the temperature of the isothermal block with sample and reference wells. After stabilization of the calorimeter overnight, the sample pellet with ≈ 10 mg weight was dropped into the solvent (25 g of 5 N HCl) held in a polyetheretherketone container. The samples dissolved rapidly in the acid solution, and the heat flow was measured to calculate the enthalpies of dissolution.
Heat capacity (Cp) was measured by relaxation calorimetry using the commercial Physical Property Measurement System (PPMS, from Quantum Design, San Diego, California, USA). With due care, the accuracy can be within 1 % from 5 to 300 K, and 5 % from 0.7 to 5 K. Powdered samples were wrapped in thin Al foil and compressed to produce a ≈0.5 mm thick pellet which was then placed onto the sample platform of the calorimeter for measurement. The heat capacity was measured in the PPMS in a 2-to-300 K temperature interval at 60 logarithmically spaced temperature set points, repeating each measurement three times.
4.1 Properties, chemical composition, and crystal structures of the synthetic samples
All synthetic samples used in this study are powdery, with variable colors (Fig. 3). Cobalt imparts a distinct pink color, present throughout the Mg–Co solid solution. In the Ni–Co solid solution, only Ni100 (analog of annabergite) has the typical apple-green color. Even small amounts of cobalt change the color of the product; Ni83.7Co16.3 is already yellowish-pink. Hence, the visual distinction between annabergite and erythrite in the field is misleading. The apple-green color in the Ni–Mg solid solution persists for all intermediate compositions. Only Mg100 (analog of hörnesite) is white, thus making the field distinction between annabergite and hörnesite very difficult.
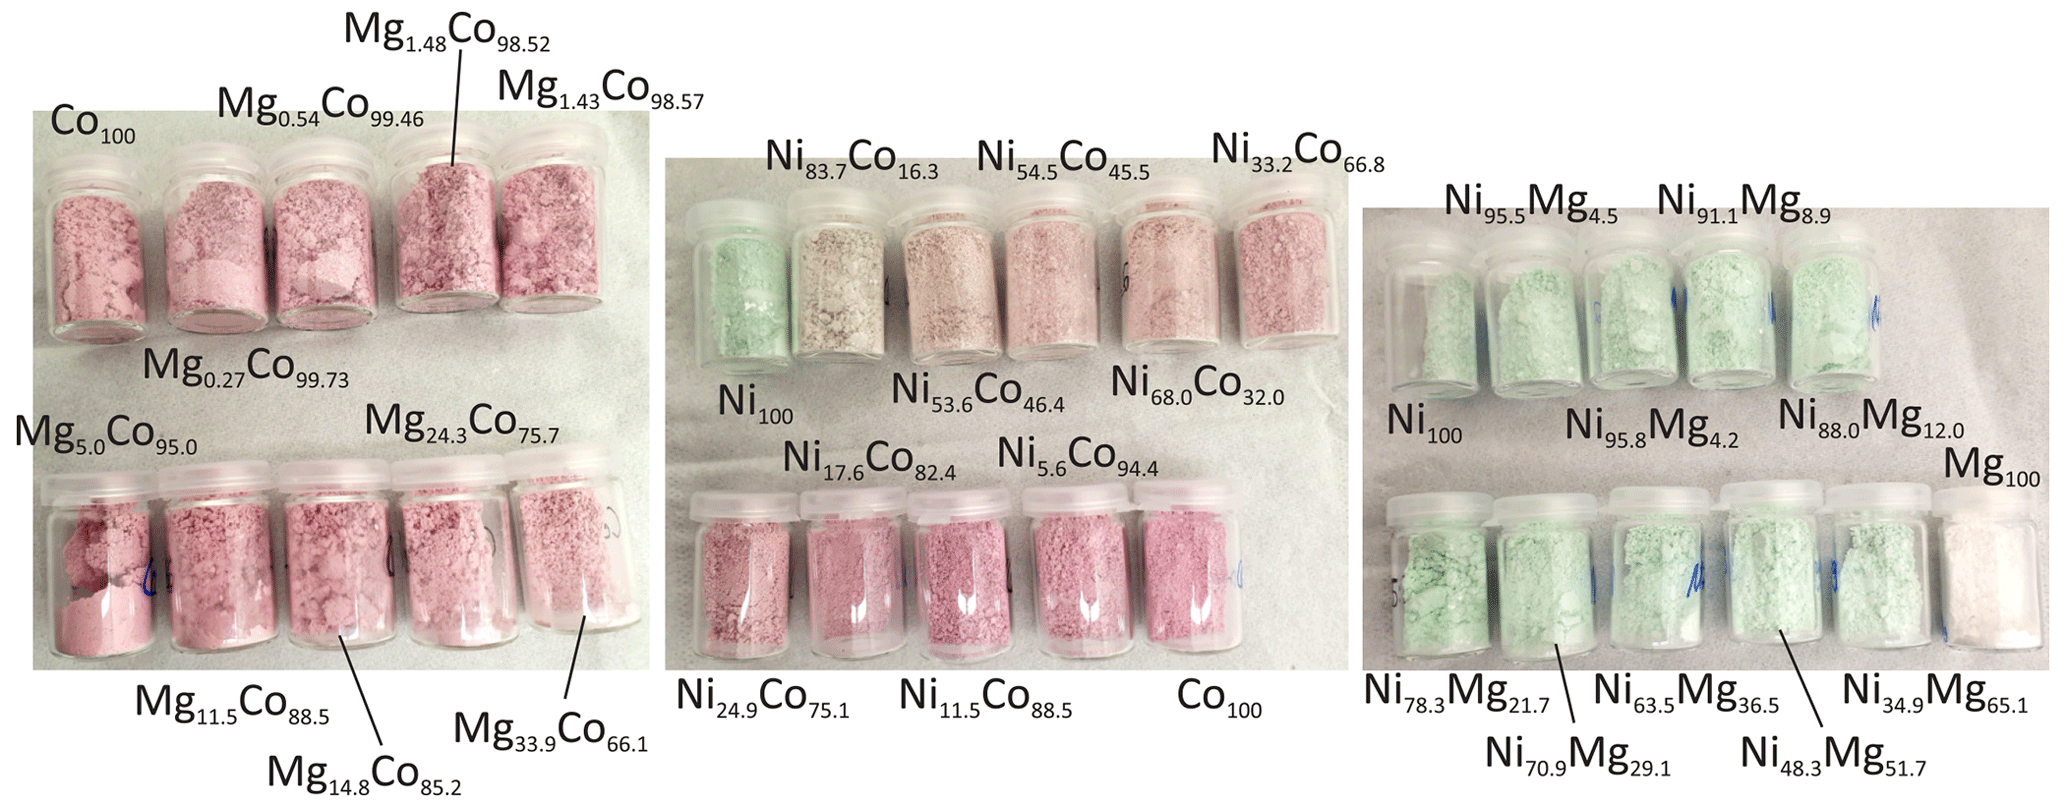
Figure 3Colors of the synthetic samples, labeled according to the molar fractions of the metals.
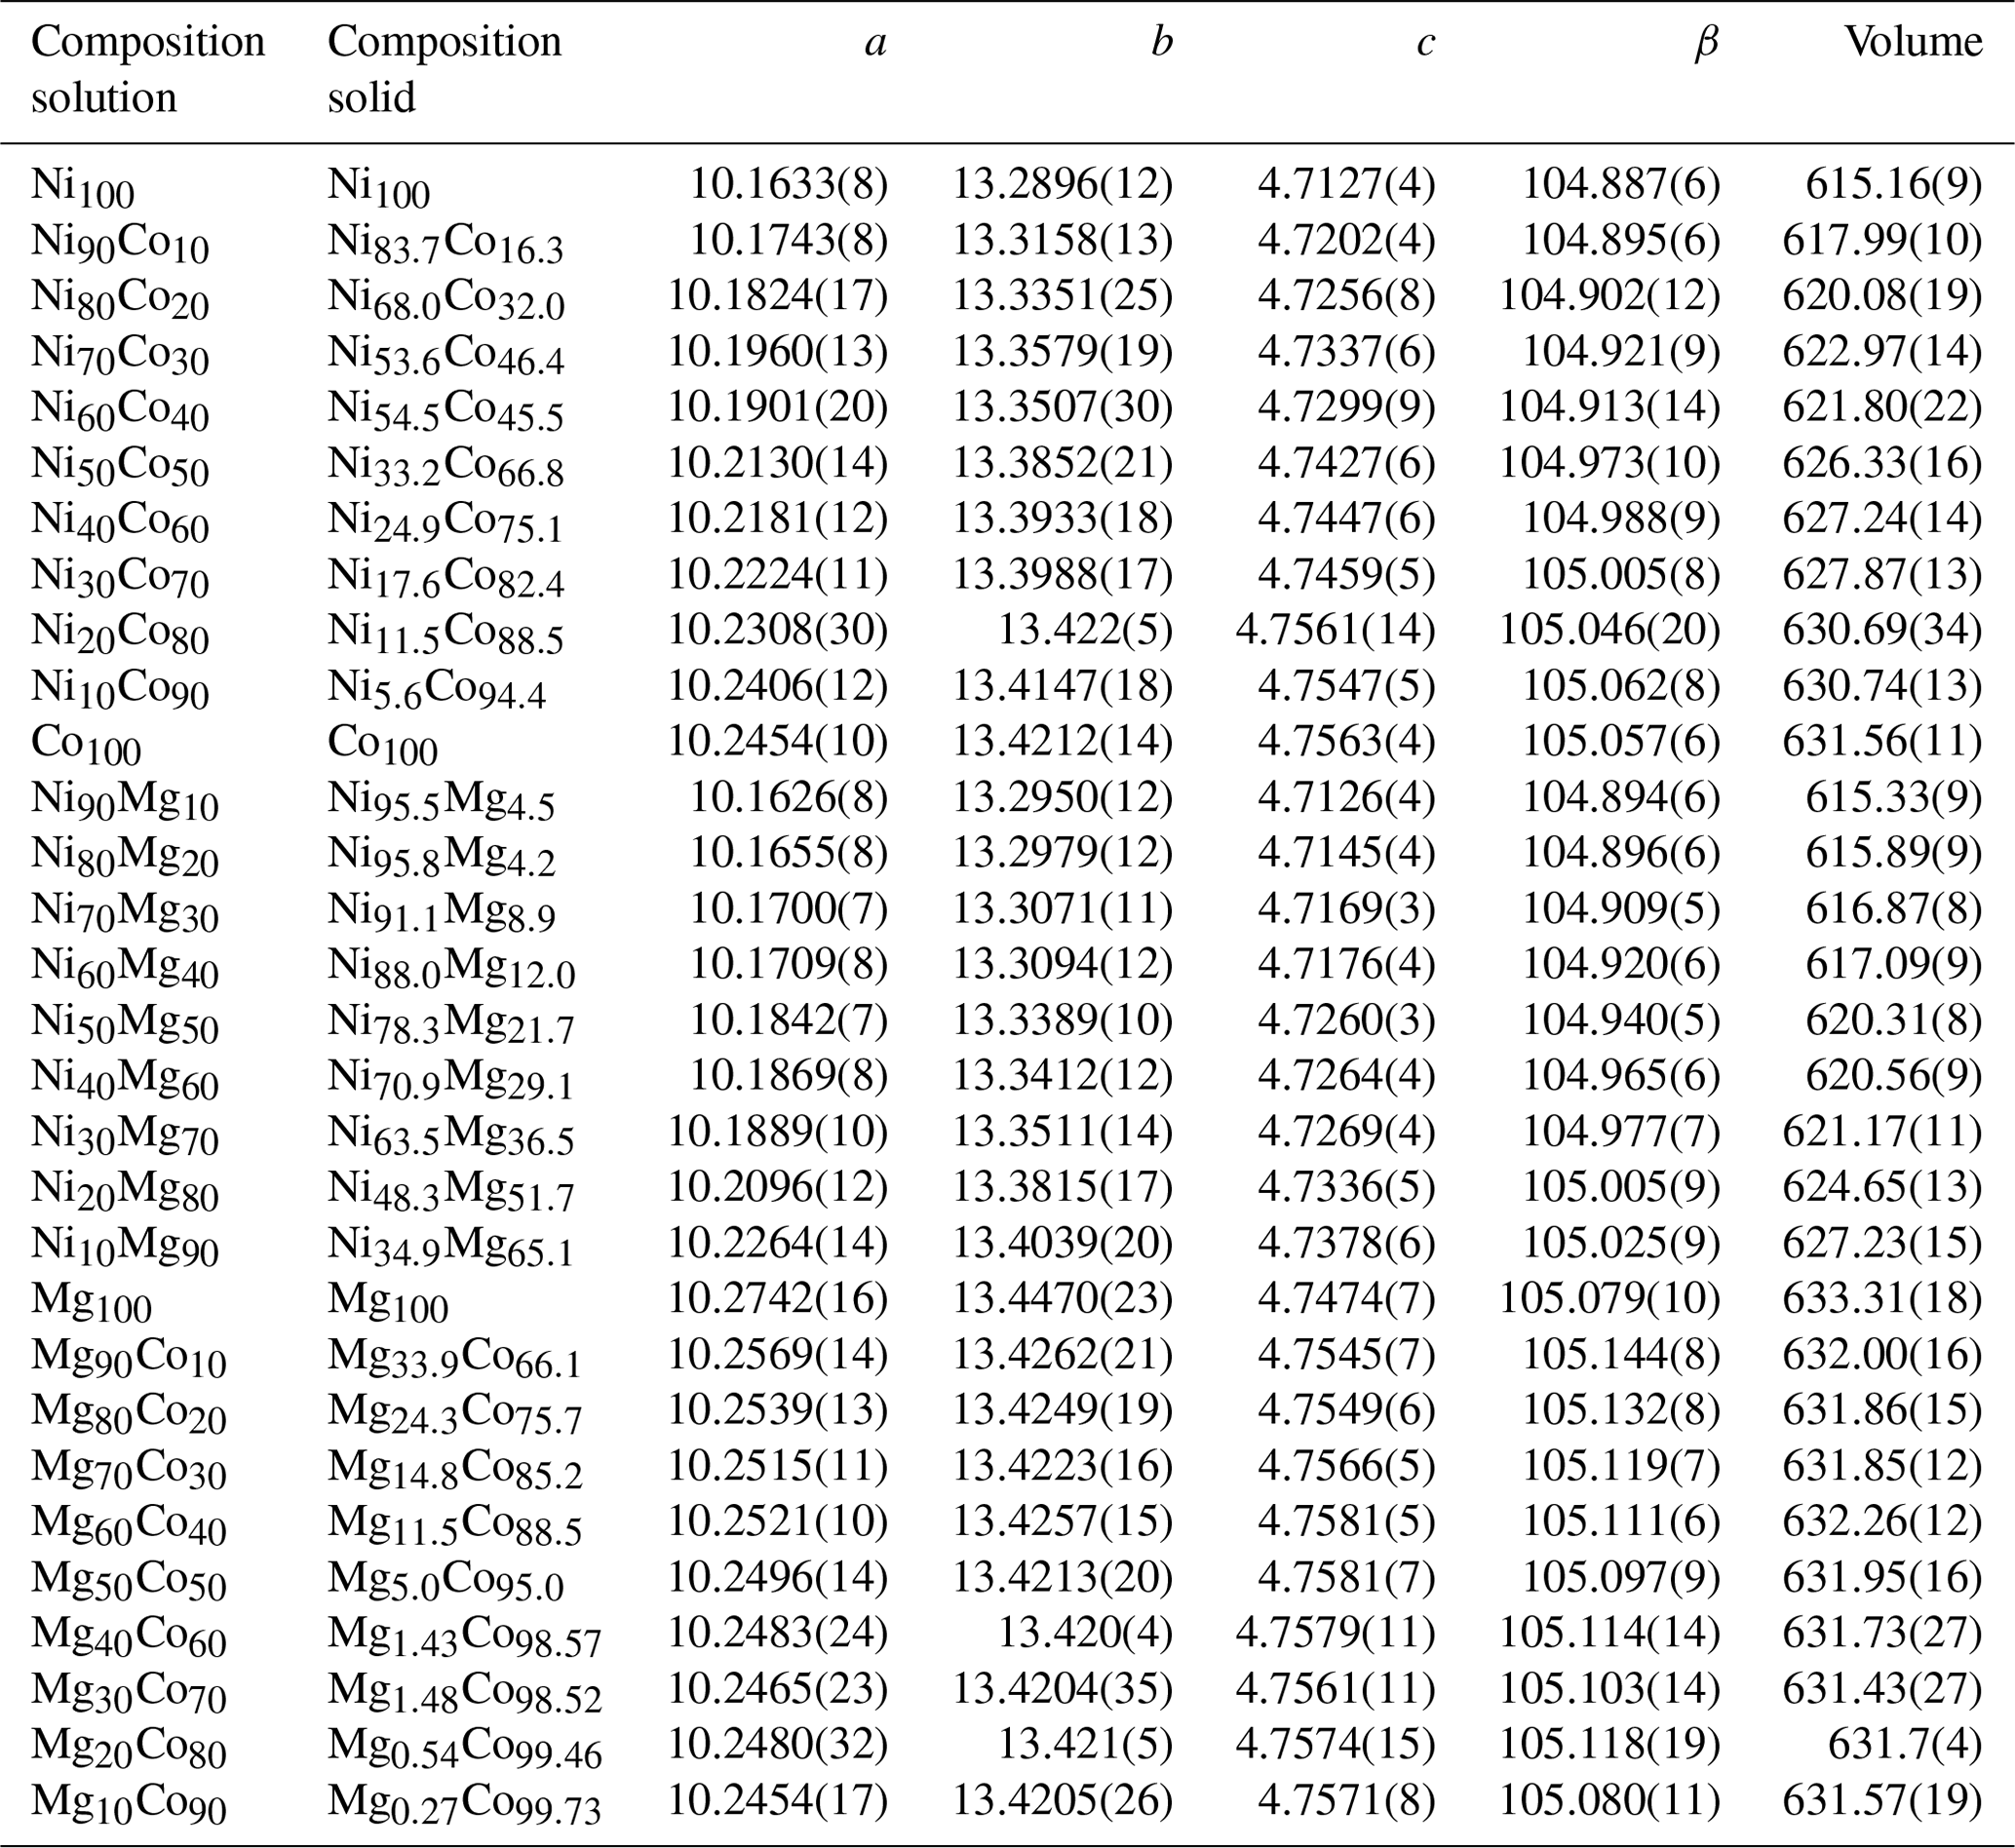
The members of the Ni–Co, Ni–Mg, and Mg–Co solid-solution series, including the end members, were analyzed for their chemical composition. In the Ni–Co series, the products are slightly, but consistently, enriched in Co relative to the starting composition of the parental solutions (Table 2, Fig. 4). In the Ni–Mg and Mg–Co solid solutions, the depletion in Mg is substantial (Fig. 4). This effect is particularly strong in the Mg–Co series, where the Mg-richest parental solution Mg90Co10 produced a solid with composition Mg33.9Co66.1.
The members of the Ni–Co, Ni–Mg, and Mg–Co solid-solution series, including the end members, were crystalline and phase pure. No indications that their structures deviate from that of vivianite were found. The lattice parameters, obtained by full-profile fits of the powder X-ray diffraction patterns, are listed in Table 2. Variations in all lattice parameters, unit-cell volume, and excess volume (Vex) for all three solid-solution series are shown graphically in Figs. S1–S3 in the Supplement. In all three series, Vex values are essentially zero, with the data scattering in positive and negative directions. Very slight positive Vex values can be discerned only for two Co-rich samples in the Mg–Co series. There are some variations in the lattice parameters a, b, c, and β, but they seem to compensate for each other to produce zero Vex.
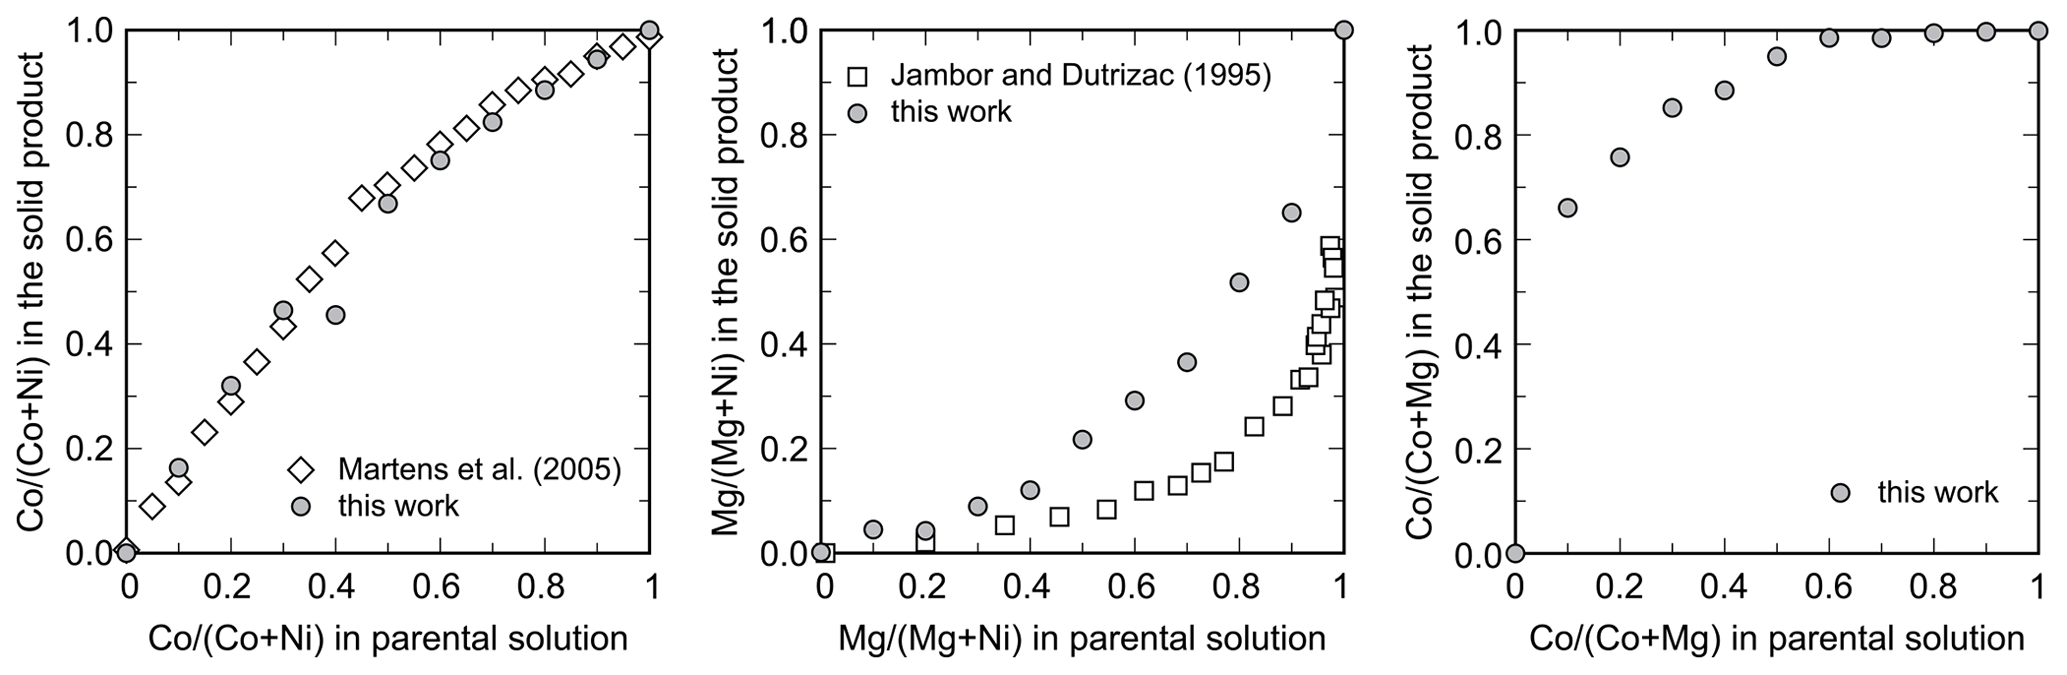
Figure 4Partitioning of the metals during crystallization of the arsenates from the parental solutions. All data shown are molar ratios. Data from this work are compared to those of Martens et al. (2005) for the Ni–Co series and to those of Jambor and Dutrizac (1995) for the Ni–Mg series.
Table 2Metal fractions in the parental solution (labeled composition solution) and metal fractions in the resulting crystalline vivianite-group arsenates (labeled composition solid), together with the lattice parameters for all solids. Space group , starting model for the full-profile fit from Wildner et al. (1996).
In general, the changes in the unit cell take place within the heteropolyhedral sheets, i.e., in the lattice parameters a, β, and to a lesser extent c. The distance between the sheets is affected much less. The solid solutions accommodate the substitutions mostly by changes in the tilt of the polyhedra in the sheets and associated changes in the β parameter. In the Ni–Co series, β deviates negatively from the ideal behavior (Vegard's law). The deviation is positive in the Ni–Mg series and positive and very pronounced in the Mg–Co series. In the Ni–Co series, the deviations of both a and β are negative; in the Mg–Co series, they are both positive. In the Ni–Mg series, though, a deviates negatively but β positively. Precise understanding of the structural modifications of the sheets would require a refinement of a complete structure model, including atomic positions and occupancies. Such refinement is, however, not possible from the available powder X-ray diffraction data and must await further measurements.
The Fourier-transform infrared (FTIR) spectra for all synthetic samples are shown in Figs. S4–S6. The absorption bands visible in these spectra correspond to those described by Martens et al. (2005). The spectra show that the samples belong to the vivianite-group arsenates and they contain no impurities. Fitting of the positions of the bands was not the focus of this paper. We performed this fitting for the Co–Ni (erythrite–annabergite) series in the spectral region 780 to 950 cm−1, and the results are shown in Fig. S7. It can be seen that the band positions vary approximately in a linear fashion between the end members, similarly to the lattice parameters or thermodynamic properties.
In the OH stretching region, Martens et al. (2005) recognized vibrations at 3020, 3175, and 3429 cm−1 for the end member erythrite. They correspond to vibrations of hydrogen bonds and shift slightly with substitution. The bands at 777 and 810 cm−1 (for erythrite) correspond to the ν3 stretching vibrations of the arsenate groups and the remaining bands (560, 692, 879 cm−1) to librational H2O modes (Martens et al., 2005). The ν1 vibration of the arsenate groups is not visible. The spectrum region between 500–1200 cm−1 is complex, with numerous overlaps of the bands. For this region, instead of fitting individual functions to each band, an autocorrelation function was used to discern variations in the spectra. These variations can be then assigned to strain at a certain length scale in the solid-solution series.
The autocorrelation function was defined by Salje et al. (2000). A selected region of the experimental spectrum is offset by ω′ (as defined by Eq. 41 in Salje et al., 2000). In this way, an autocorrelation function was calculated for each FTIR spectrum between the wavenumbers of 650 and 1200 cm−1. This region was selected because it represents length scales of 5–15 Å (Boffa-Ballaran et al., 1999). The calculated autocorrelation functions are then fit with Gaussian functions (Eq. 42 in Salje et al., 2000) with a progressively narrower data range of . The width of the central peak of the autocorrelation spectrum, k2, is obtained by extrapolation of the Gaussian parameters toward . In agreement with Salje et al. (2000, their Fig. 3), we found that at very small ranges of , the fit results (width of the Gaussian function) behave anomalously. If left unattended, they would lead to false extrapolation. Therefore, each fit was checked manually. To treat the data uniformly, the same range of (ω′ = ±5) was excluded from the final extrapolation. The results of these fits are shown in Fig. 5.
The results of the TG analysis and DTA of the synthetic end members are presented in Figs. S8 and S9, respectively. The curves show mass loss between 200 and 300 ∘C due to dehydration of the samples. Constant mass was achieved at ≈ 600 ∘C, and the mass loss corresponds well to the theoretical H2O content of the samples. For annabergite and hörnesite, the mass loss occurred in a single event, as seen in both TG and DTA curves. For erythrite, mass loss occurred in two separate temperature intervals, resulting in a distinct splitting of the peaks in the DTA curve. There are additional exothermic signals for erythrite (at 650 ∘C) and hörnesite (at 740 ∘C) but no such feature in the data set for annabergite. The nature of this thermal event is not clear.
4.2 Acid-solution calorimetry – enthalpies
All samples dissolved rapidly and reproducibly in the calorimetric solvent, 5 N HCl. The measured dissolution enthalpies are reported in Table 3. They can be used to calculate the enthalpies of mixing, ΔmixH, that relate to the reactions
Table 3Dissolution enthalpies for all end members and solid-solution members synthesized in this work. The experimental solvent was 5 N HCl at 25 ∘C. All enthalpy data are in kJ mol−1.
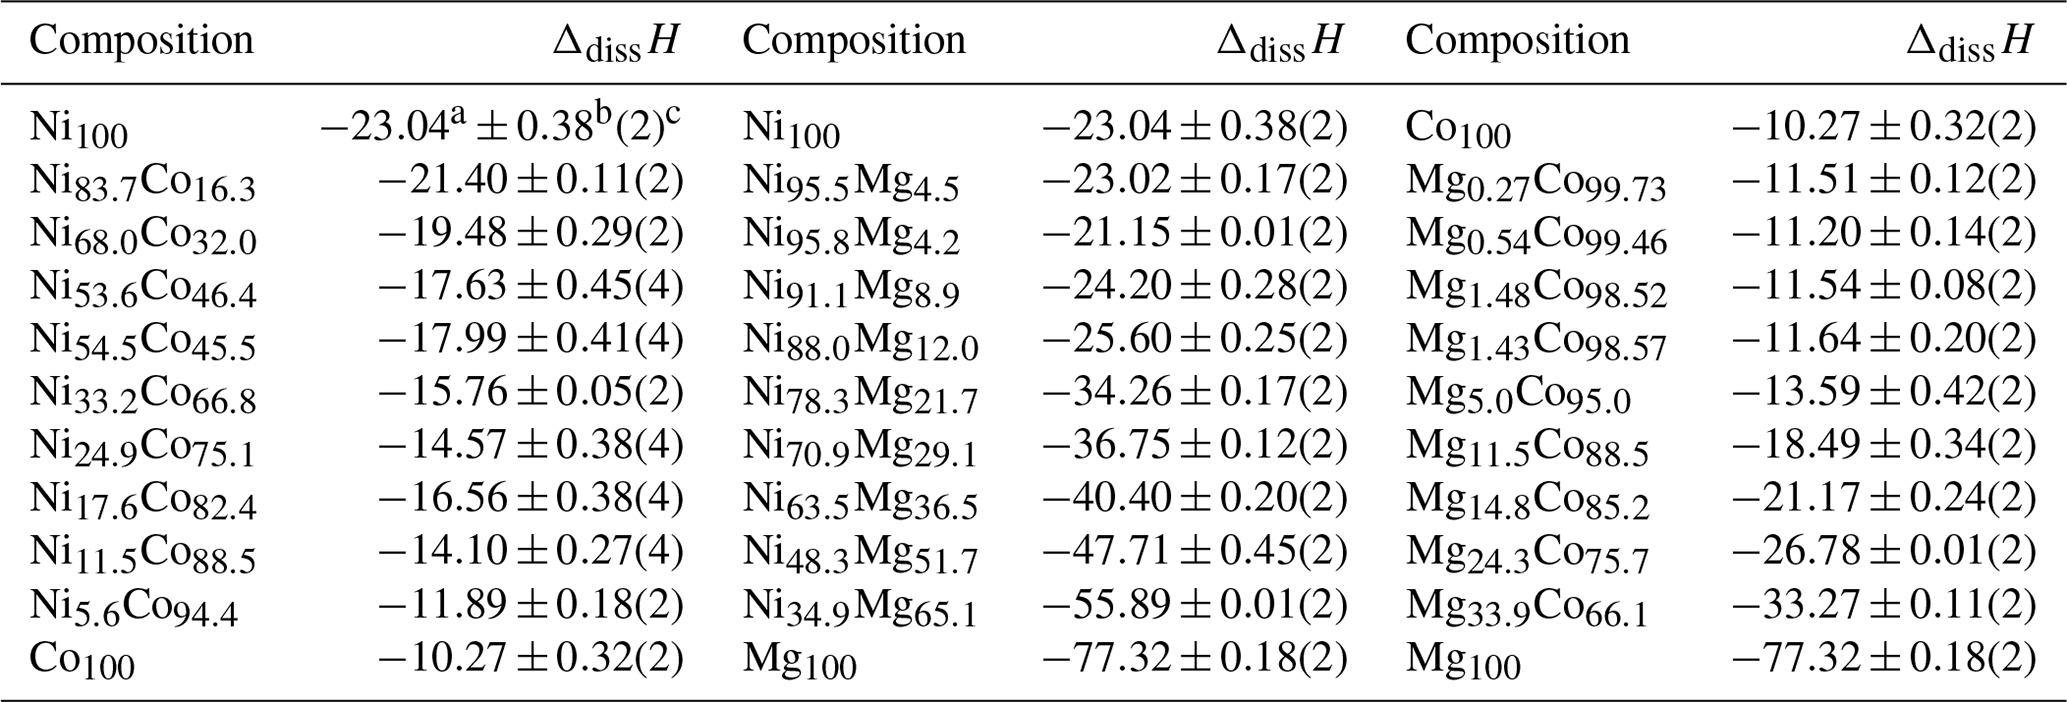
a Mean. b 2 standard deviations of the mean. c Number of measurements.
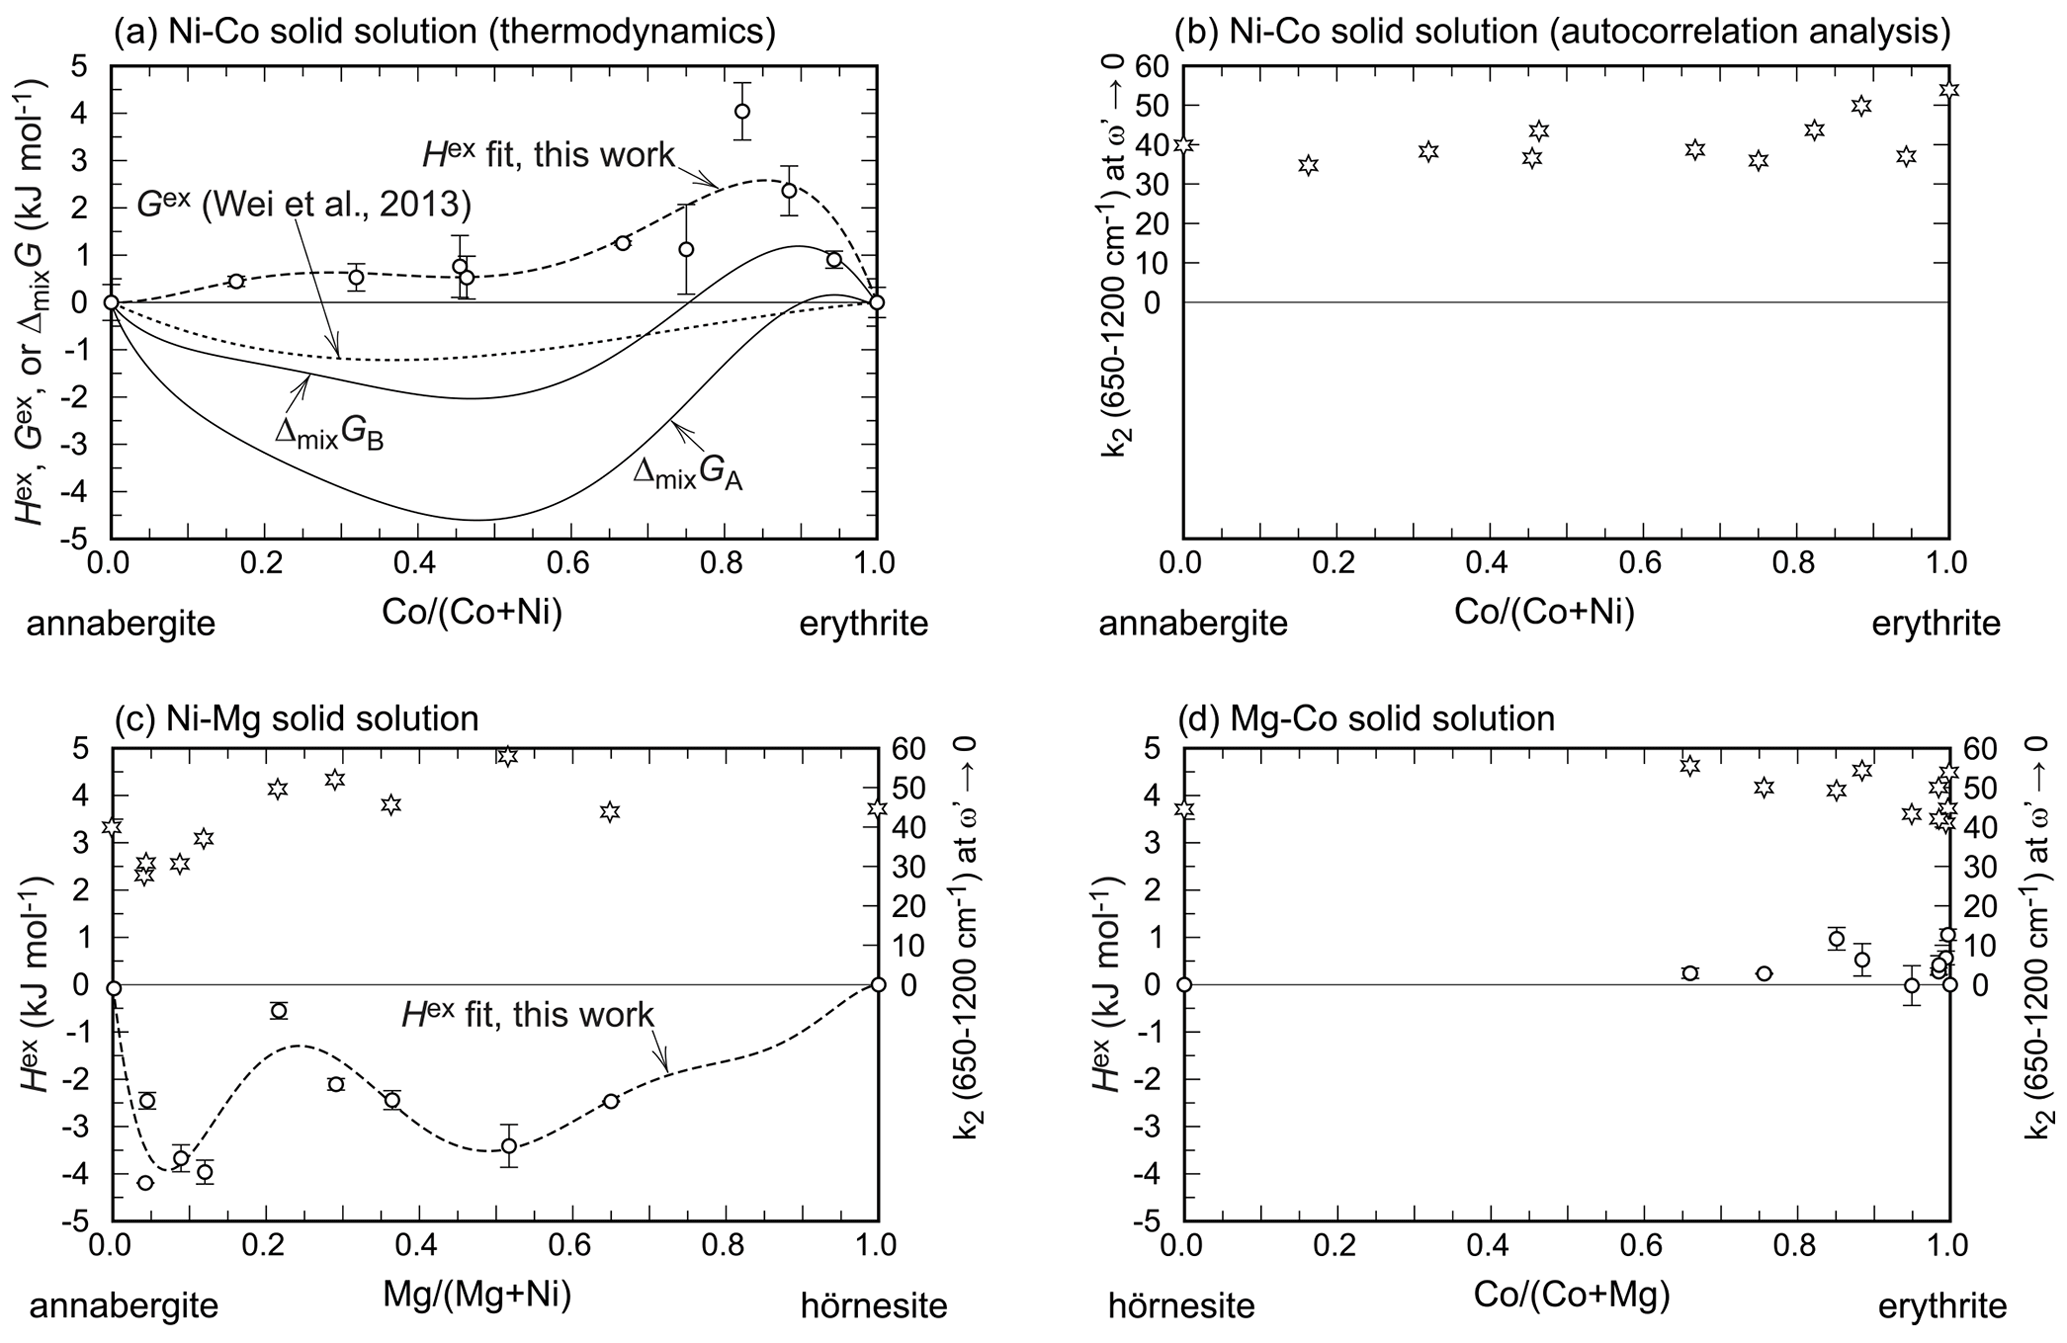
Figure 5Excess enthalpies (circles) and width of the central peak of the autocorrelation function (k2 at ω→0, stars) in all three solid solutions studied in this work. All elemental ratios in this figure are molar ratios. The dashed curves marked as Hex fit show the fits with the Redlich–Kister formalism (see main text). The free energy (G) curves in (a) are explained in the text. For easier comparison, all figures are plotted on the same scale, despite leaving empty space in some of the figures. The error bars are always 2 standard deviations of the mean.
Table 4Thermochemical cycle for the calculation of the enthalpies of formation of the end members annabergite, erythrite, and hörnesite. All enthalpy data are in kJ mol−1.
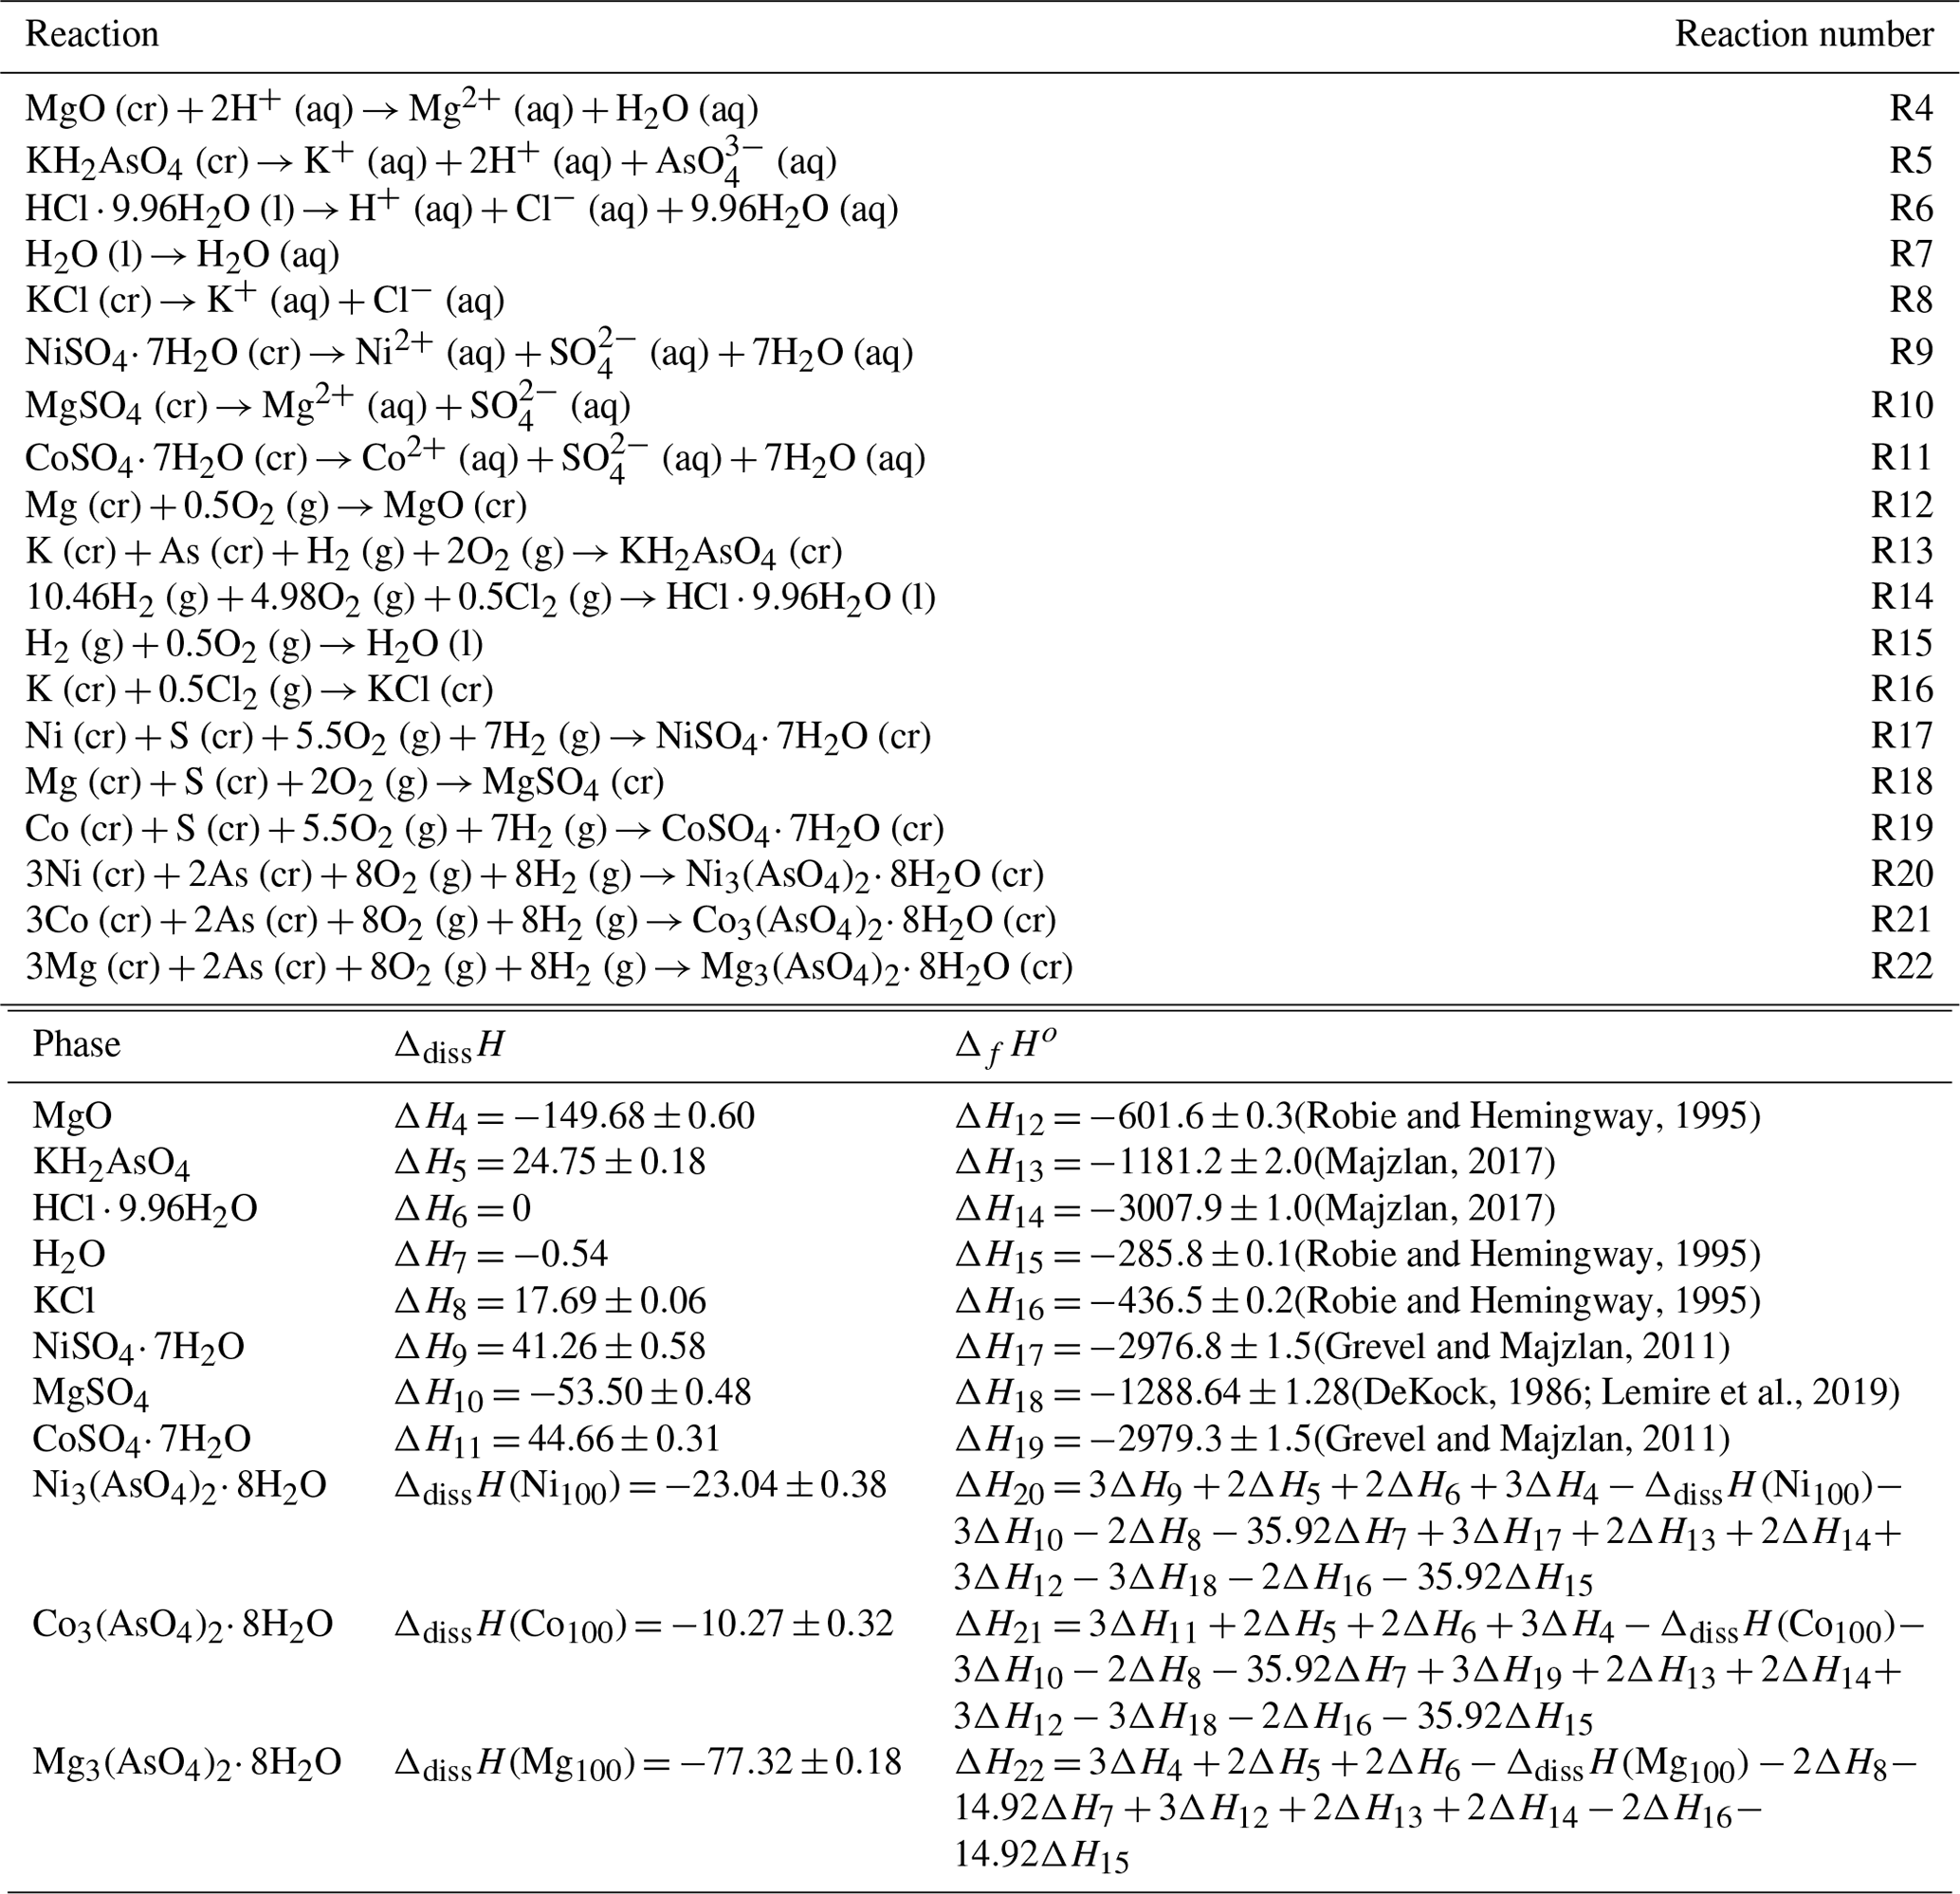
Table 5Summary of the thermodynamic data obtained in this work for synthetic annabergite, erythrite, and hörnesite.
* These log K values refer to the reaction M3(AsO4)2⋅ 8H2O → 3M2+ + 2AsO + 8H2O.
The enthalpies of mixing for all three solid-solution series are shown in Fig. 5. They are related to excess enthalpies, Hex, as ΔmixH = Hid+Hex, where Hid denotes the enthalpies of mixing in an ideal solid solution. Hid values are always equal to 0 kJ mol−1. The distinction is useful, however, for discussion of Gex values, presented below and also shown in Fig. 5.
The Hex values are positive for the Ni–Co and Mg–Co series and negative for the Ni–Mg series. All enthalpies of mixing are less than 5 kJ mol−1 in their magnitude for the composition (Ni,Co,Mg)3(AsO4)2⋅ 8H2O or less than 2 kJ mol−1 in their magnitude when the composition is normalized to one metal cation.
Using appropriate thermochemical cycles and enthalpies of dissolution for reference compounds, the enthalpies of formation of the end members were calculated (Table 4). For consistency, we adopted the ΔfHo values for NiSO4⋅ 7H2O and CoSO4⋅ 7H2O from Grevel and Majzlan (2011). The selected value of (ΔfHo, NiSO4⋅ 7H2O) from the critical NEA review (Gamsjäger et al., 2005) is kJ mol−1 and compares well to our value of kJ mol−1. DeKock (1982) adopted −2976.5 kJ mol−1 as her selection for ΔfHo (NiSO4⋅ 7H2O). The critical NEA series has not yet covered cobalt substances, and there is no such selection available for CoSO4⋅ 7H2O. DeKock (1982) adopted −2979.4 kJ mol−1 as her selection for ΔfHo (CoSO4⋅ 7H2O), compared to our value of kJ mol−1. Attempts to close the cycle with ΔdissH for NiO and CoO failed because these oxides dissolve too slowly in our calorimetric solvent. The calculated enthalpies of formation are summarized in Table 5.
4.3 Relaxation calorimetry – heat capacities and entropies
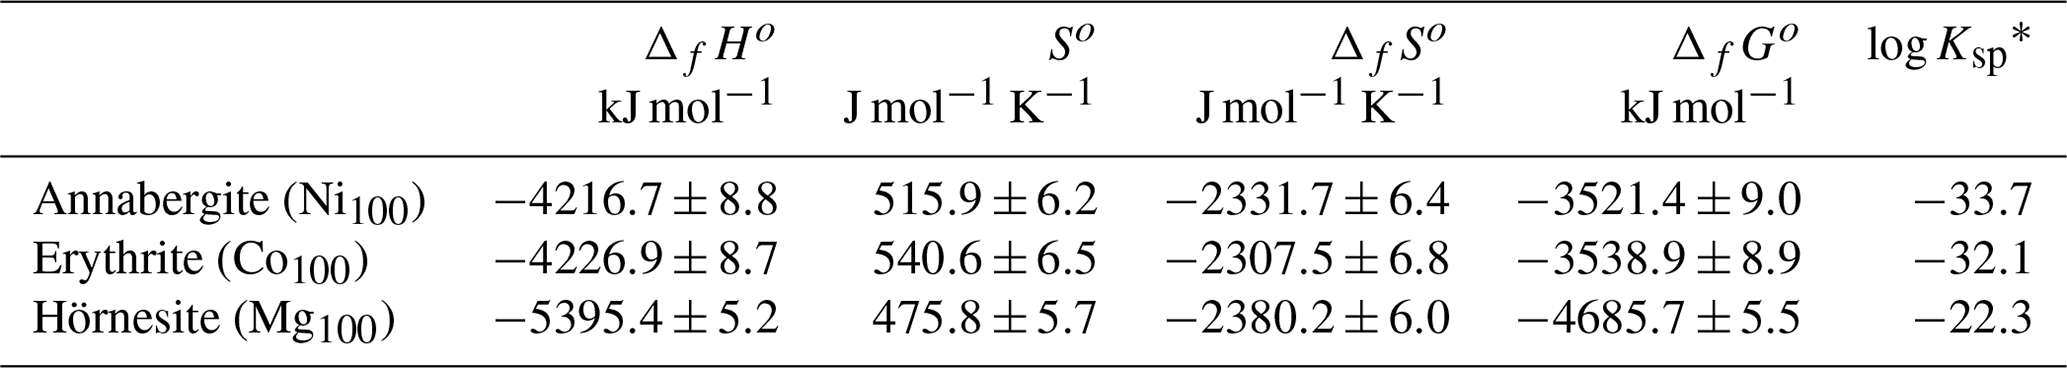
Heat capacity of the synthetic end members was measured in the range 2–310 K by relaxation calorimetry. The data are shown in Fig. 6 and listed in Tables S1–S3.
The data for the Mg100 (hörnesite) sample show no anomalies in the measured temperature range. The data for the Ni100 (annabergite) and Co100 (erythrite) samples include low-temperature anomalies, with maxima at T = 8.0 K and T = 7.0 K, respectively. These anomalies are related to the magnetic properties of the Ni2+ and Co2+ ions. A separation of low-temperature Cp into magnetic and lattice contributions is, however, beyond the scope of this work and was not attempted.
The functions were integrated between 0 and 298.15 K to obtain the third-law entropies of the end-member arsenates. The results are listed in Table 5.
4.4 Macroscopic properties and associations of minerals
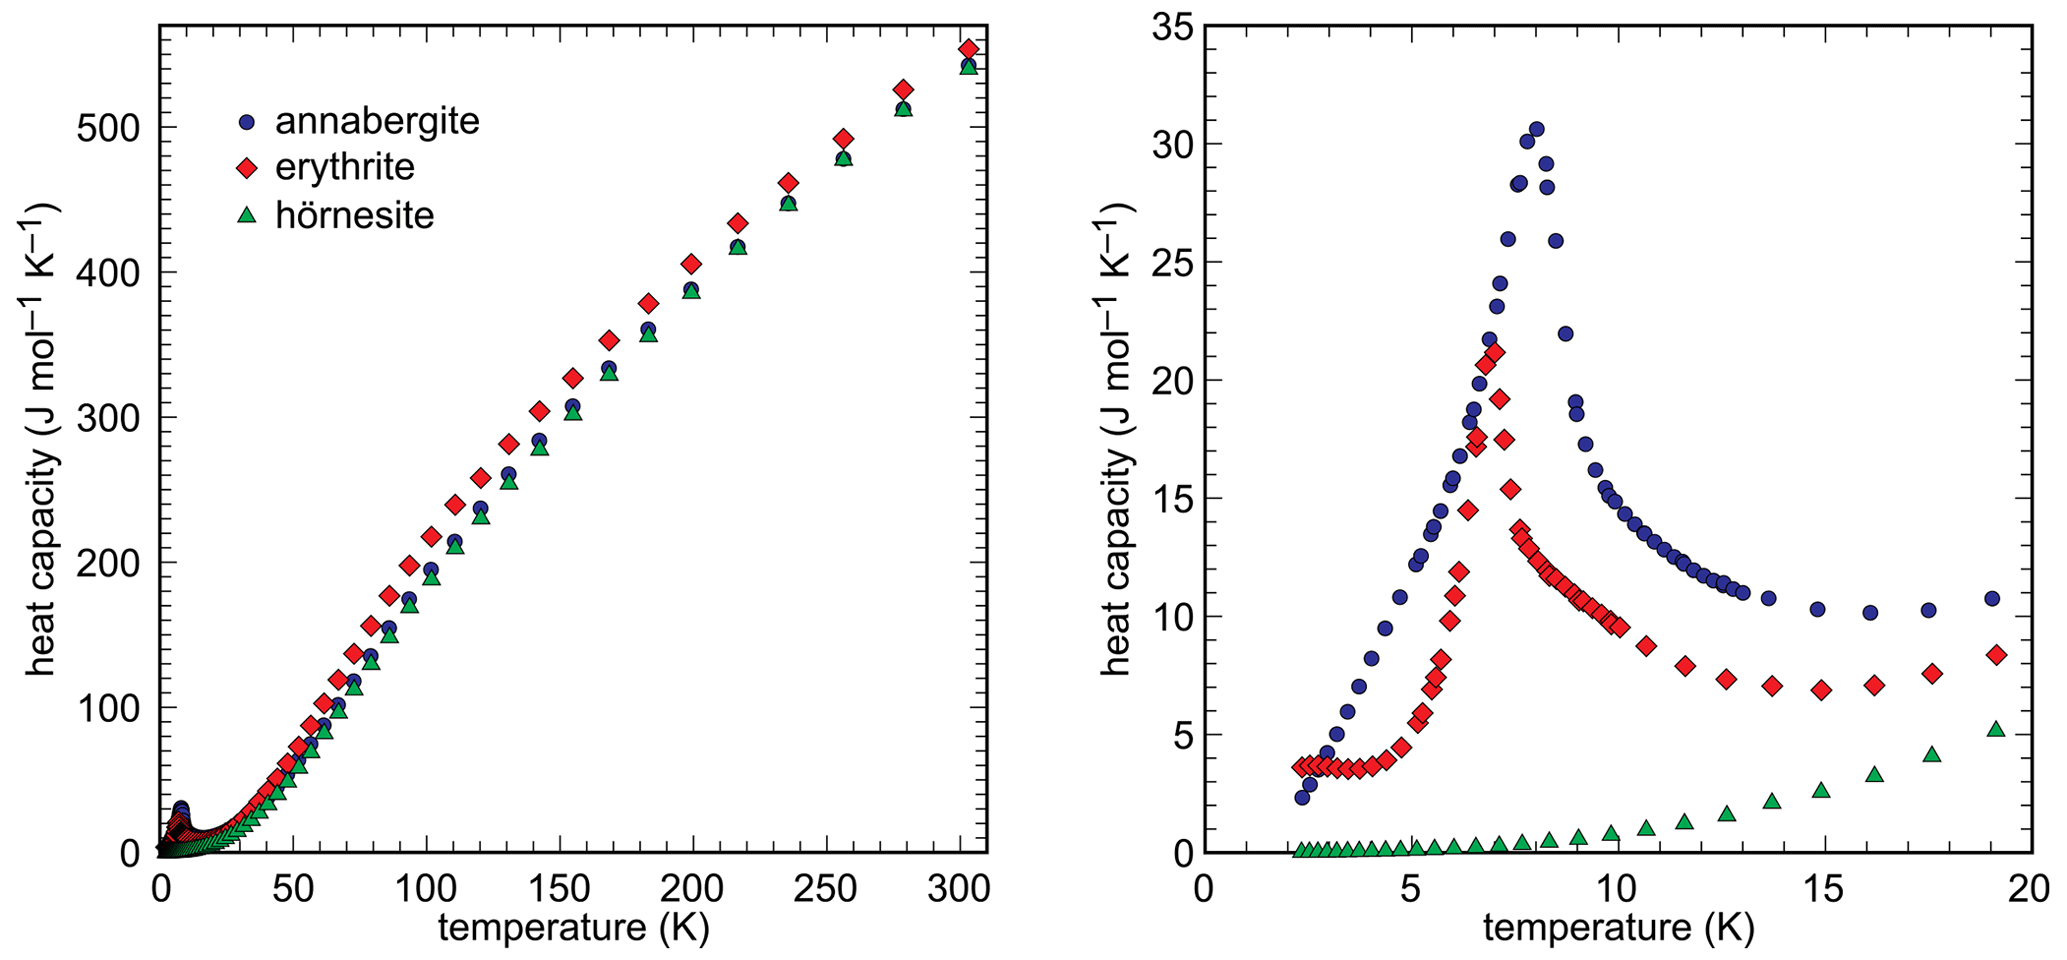
The natural vivianite-group arsenates occur most commonly as acicular or tabular crystals, dominated by the {010} pinacoidal faces (Fig. 7). In some old mines, the initial stages of formation of these minerals can be directly observed. The primary minerals are covered by a wet paste made of fine-grained crystallites of these minerals. There is no flowing water there, the moisture seems to come exclusively from the humid air inside the mine. The paste can be easily removed with a finger and seems to ripen over time very slowly into larger well-developed crystals.
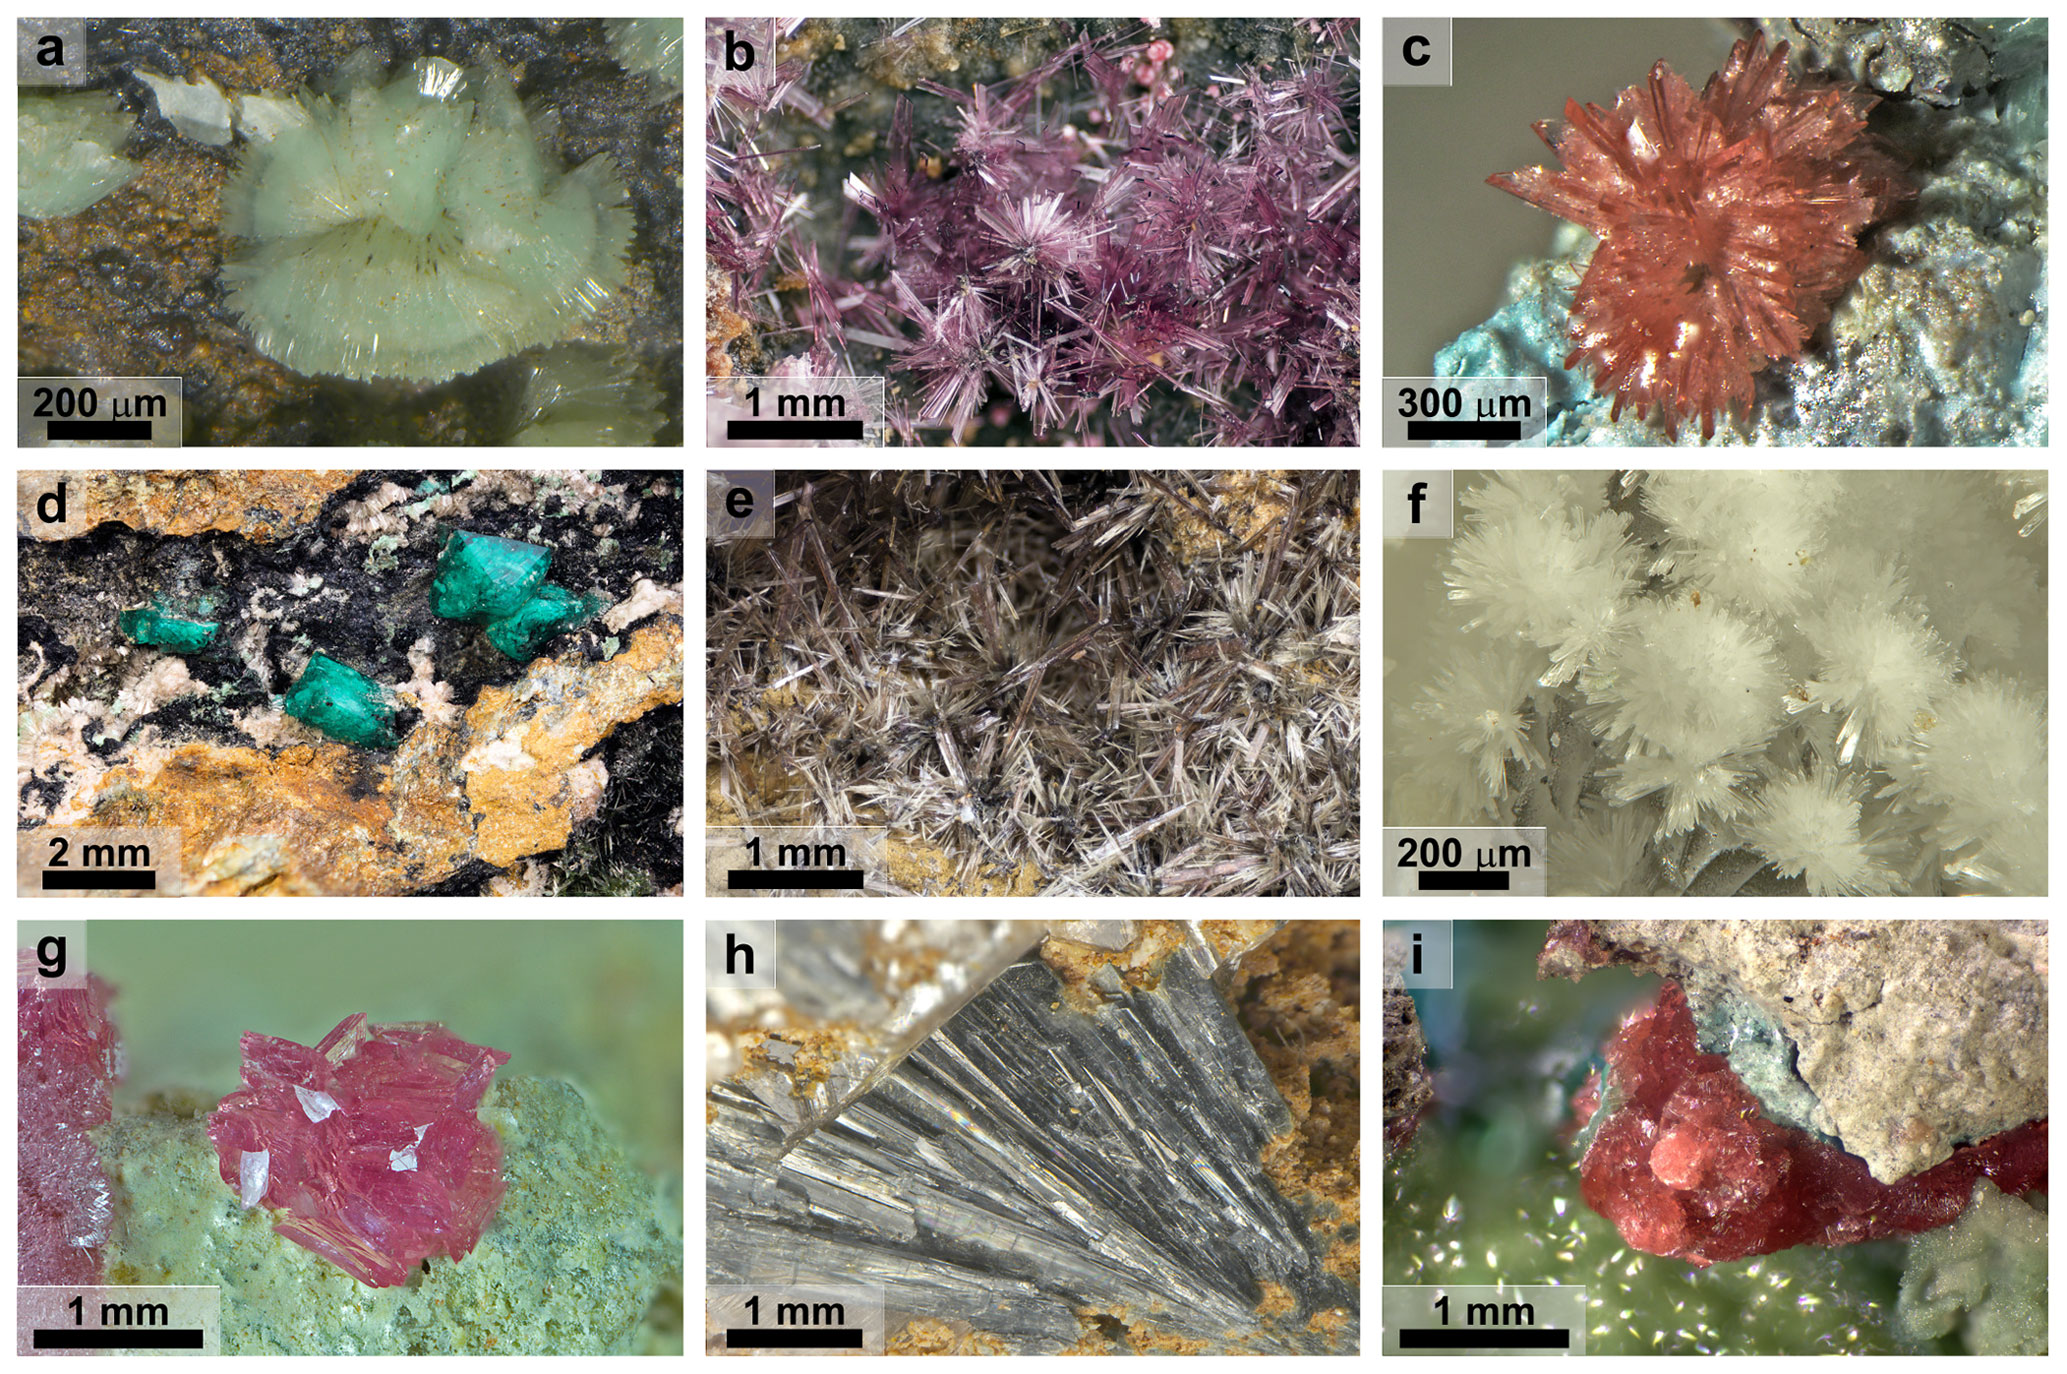
Figure 7Photographs of the vivianite-group arsenates: (a) annabergite–hörnesite, Svätodušná, Ľubietová (Slovakia); (b) erythrite, Dobšiná (Slovakia); (c) babánekite, Jáchymov (Czech Republic); (d) erythrite–babánekite (pinkish-white needles) with euchroite (green crystals); Svätodušná, Ľubietová (Slovakia); (e) erythrite–parasymplesite, Dobšiná (Slovakia); (f) hörnesite, Jáchymov (Czech Republic); (g) köttigite, Jáchymov (Czech Republic); (h) köttigite, Ojuela Mine, Mapimí (Mexico); (i) köttigite, Drienok, Poniky (Slovakia).
The color of the vivianite-group arsenates is determined by the presence and abundance of the various transition metals but cannot be fully correlated with the concentrations of metals. Near-end-member annabergite has its typical pale-green (apple green, Fig. 7a) color but only a few weight percent of Co changes the color to pinkish (see Fig. 3). Hence, many specimens visually identified as erythrite in the past could actually belong to annabergite. Members dominated by cobalt are pink to purple-red (Fig. 7b). The crystals of babánekite from Jáchymov were reported as pinkish to peach-colored (Fig. 7c; Plášil et al., 2017), a color unusual for a copper arsenate. Yet these crystals contain an appreciable amount of Co, Ni, and Zn, and the former element seems to impose its coloration effect. The babánekite–erythrite solid solution from Ľubietová (Fig. 7d) is light pinkish, and the erythrite–köttigite solid solution from Bou Azzer is purple (Dumańska-Słowik et al., 2018). Köttigite from Jáchymov (Fig. 7g; Sejkora et al., 2014) is also pink to purple and contains appreciable amount of Mn, Mg, and Co. Köttigite from Drienok is pink and contains an appreciable amount of Co and Cu. The pink color can be related to Co. Pure hörnesite from Jáchymov (Fig. 7f), Rotgülden, and Złoty Stok (Siuda and Macioch, 2018) is off-white, as expected. A mineral identified as köttigite from Sterling Hill and from Mapimí is blue to dark blue (Fig. 7h). On samples from Mapimí, Sturman (1976) showed that they belong to the parasymplesite–köttigite solid solution, and their color saturation could be perhaps correlated with their Fe content. The samples available to Sturman (1976) contained more Fe than Zn and belonged to parasymplesite. A few similar samples available to us were analyzed by an energy-dispersive system and were found to contain more Zn than Fe, hence belonging to köttigite.
4.5 Chemical composition of the natural samples
The data set considered in this study contains 615 spot analyses of vivianite-group arsenates from geochemically variable occurrences. We believe that this set represents, to a large extent, the variability in the vivianite-group arsenates in nature. When doing analytical work, more attention is usually given to regions that are zoned or heterogeneous (Fig. 8a, b, d–f), rather than those that appear chemically monotonous (Fig. 8c). This tendency is helpful when describing the chemical variability in a mineral group, as in this work. This work is not, on the other hand, an assessment of the volumetric proportions of monotonous and heterogeneous crystals. The material considered here is mostly heterogeneous on a scale of micrometers or tens of micrometers, with the consequence that the determination of lattice parameters or other structural properties is very difficult or impossible. Therefore, no structural data for the natural samples are presented in this work.
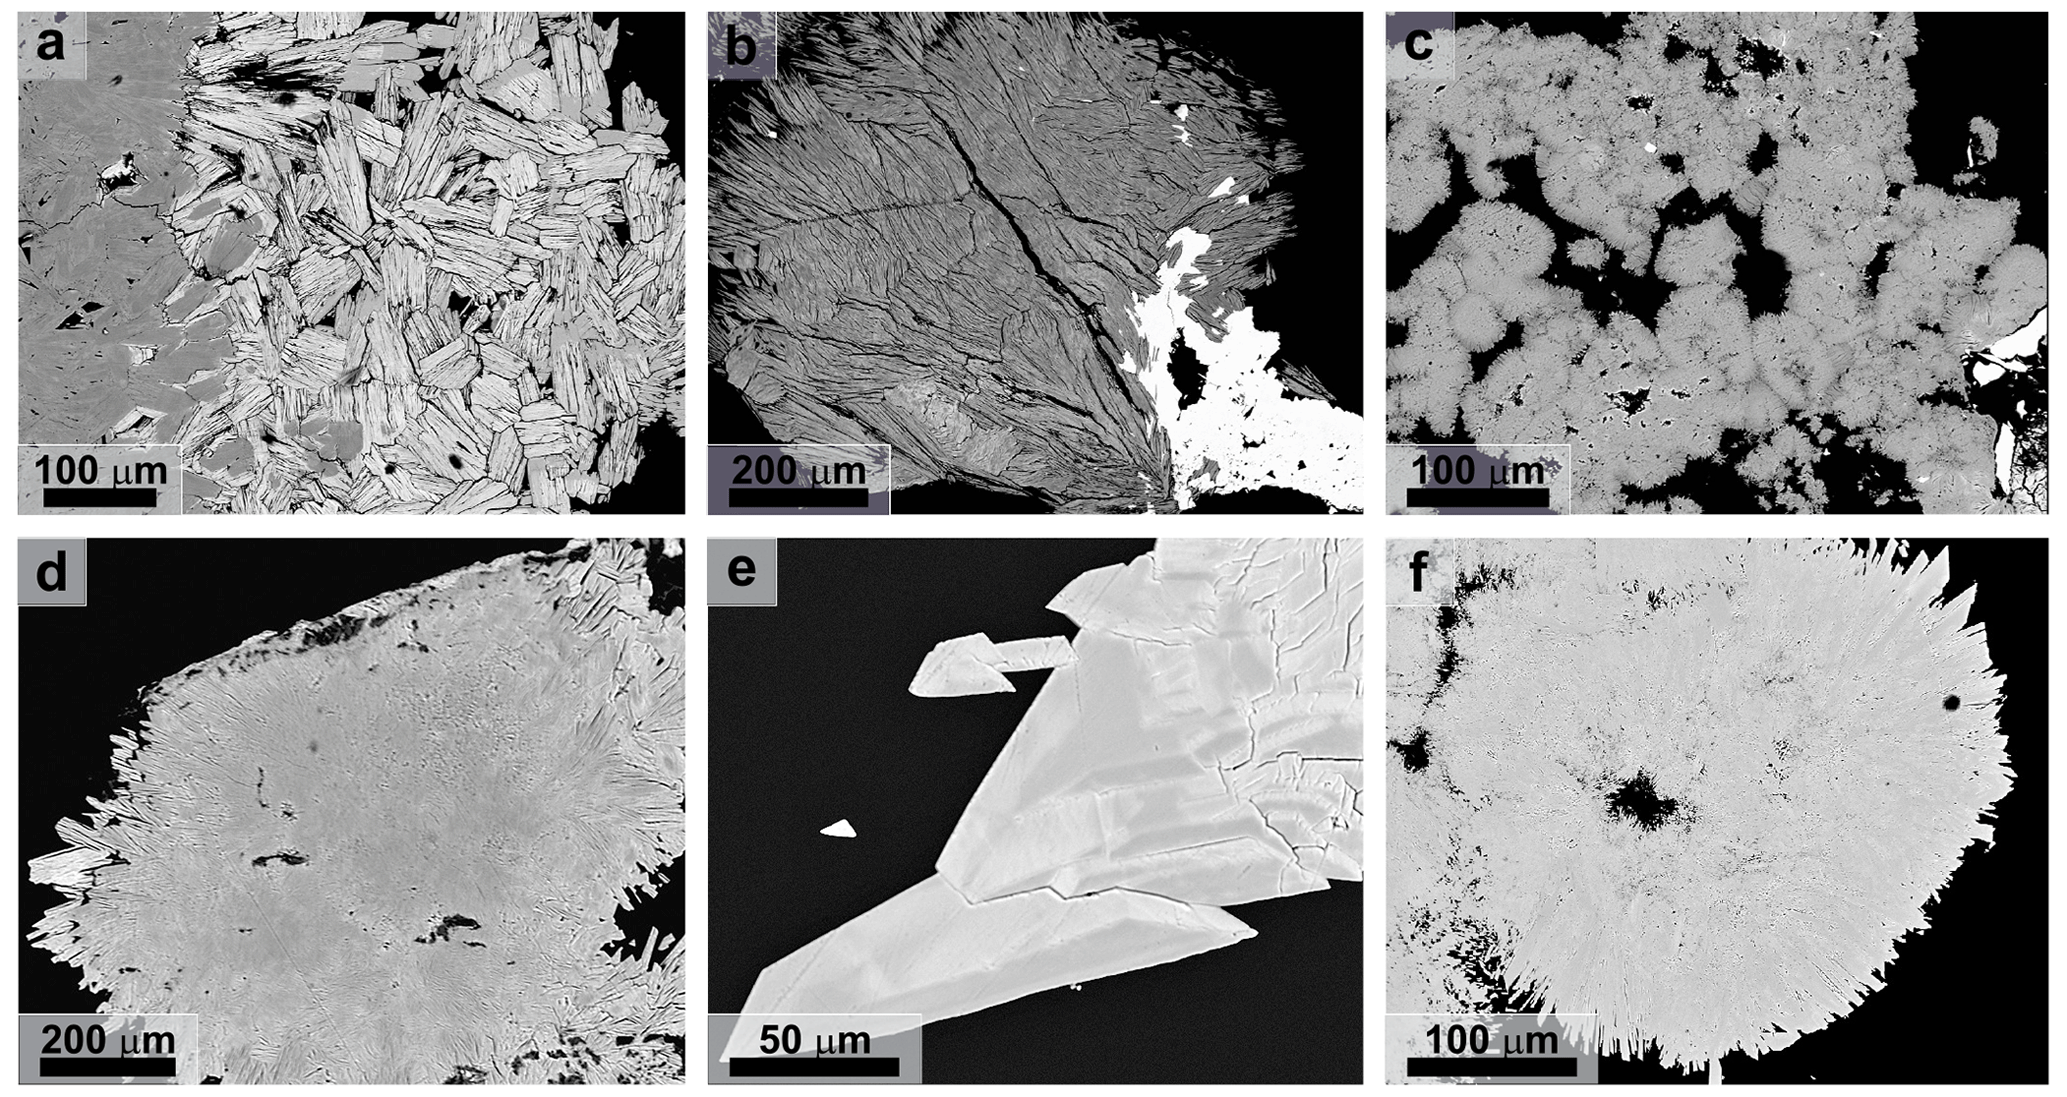
Figure 8Back-scattered electron images of (a) chemically inhomogeneous aggregates of the babánekite–erythrite solid solution (Svätodušná, Ľubietová; lighter zones are richer in Cu), (b) chemically inhomogeneous aggregate of köttigite (Drienok, Poniky; lighter zones are richer in Cu, and the white phase is olivenite), (c) homogeneous aggregates of annabergite (Dúbrava-Predpekelná), (d) chemically inhomogeneous (owing to variable Cu and Ni content) aggregates of erythrite (Jáchymov-Rovnost), (e) chemically inhomogeneous (owing to variable Co and Ni content) crystals of babánekite (Jáchymov-Rovnost) and (f) babánekite crystals on chemically inhomogeneous (owing to variable Cu and Ni content) aggregate of erythrite (Zálesí).
The number of atoms per formula unit (apfu) for the different divalent cations varies considerably (Fig. 9). For Ni and Co, the distribution spans almost the entire range from 0 to 3 apfu. For Zn, the distribution also extends essentially across the entire compositional range, but the compositions with > 1.5 Zn apfu are rare. The distributions for Mg and Cu reach up to ≈ 2 apfu. For Mg, however, there are several analyses of almost pure end members, whereas no end-member compositions are observed for Cu.
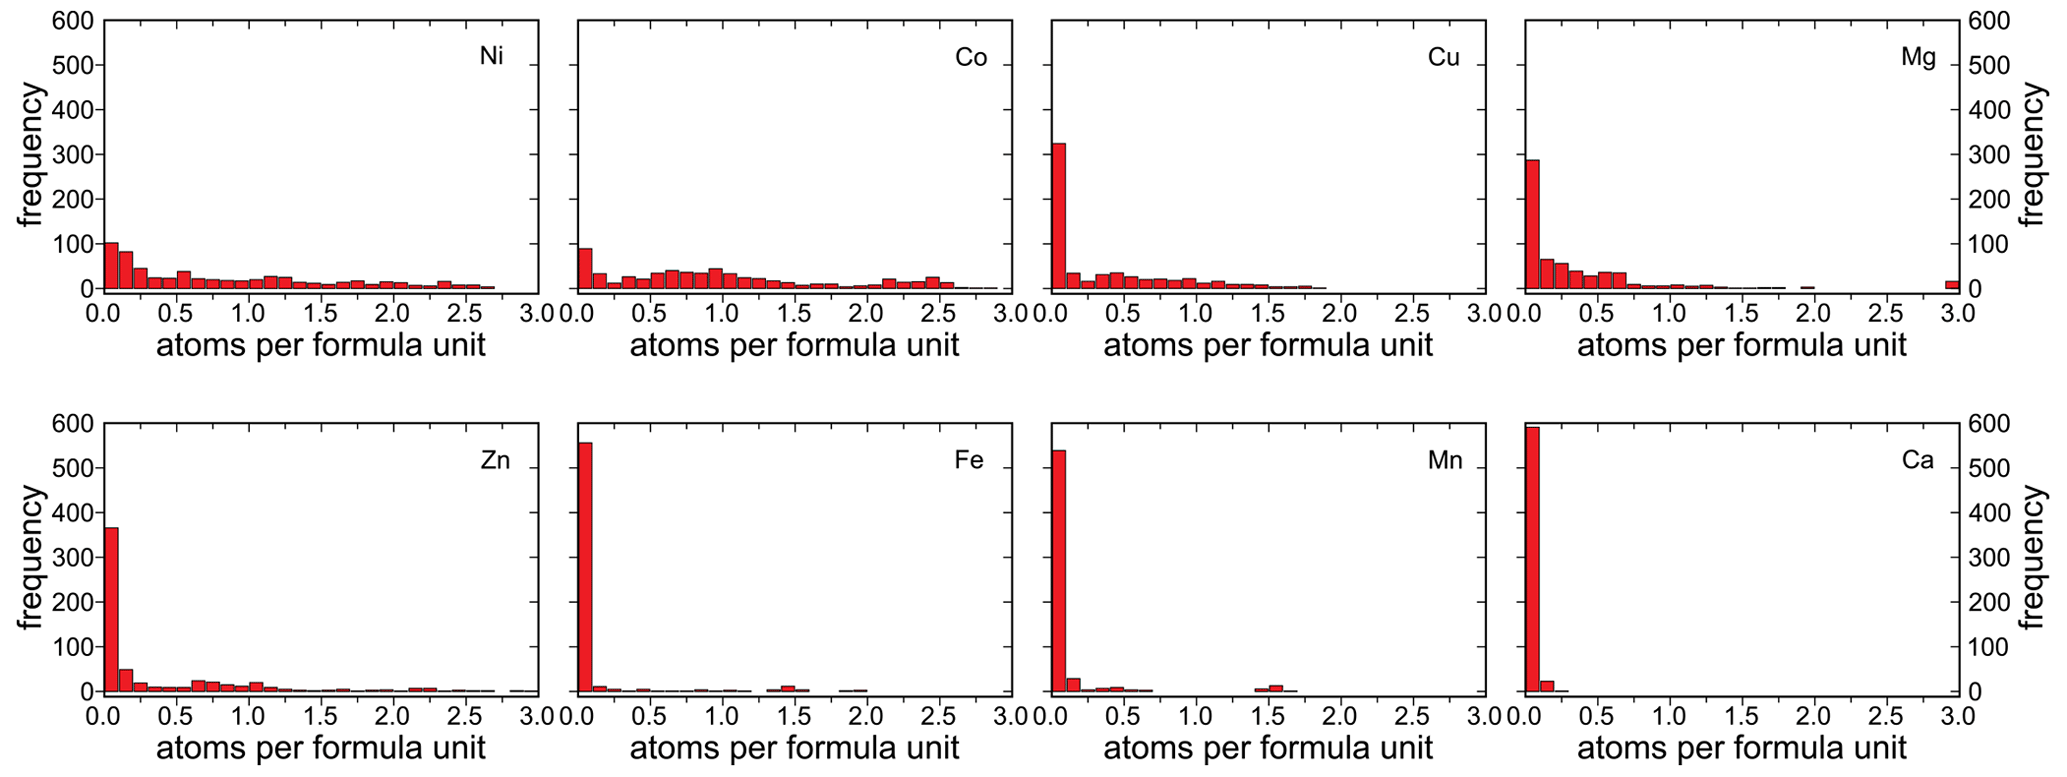
For the elements Fe and Mn, the distribution is significantly skewed toward compositions that are almost devoid of these elements. The compositions with ≈ 1.5 Mn apfu and ≈ 1.5 Fe apfu were found at Herichová, Chyžné, a locality with abundant primary rhodochrosite, hübnerite, pyrite, arsenopyrite, and pyrrhotite. The Fe-richest compositions, with up to 2 Fe apfu, were found at Přísečnice (Sejkora et al., 2019) in association with Fe arsenates (scorodite, bariopharmacosiderite).
Calcium enters the structure of the vivianite-group arsenates only rarely and in small amounts. The only appreciable Ca concentrations were detected in hörnesite from Rotgülden, where this mineral grows on the host dolomite marbles together with gypsum.
4.6 Compositions dominated by one or two cations
Inspection of the data set showed that there is a pronounced tendency of mixing at the cation sites, most likely controlled primarily by mineralogical factors (composition of the primary ore and gangue minerals). There are compositions dominated by a single cation (Fig. 10a), where the dominance is defined for the purposes of this work as > 75 % of a single cation in the structure (i.e., 3 × 0.75 = 2.25 apfu). Most frequently, this dominance was found for Co and Ni; a few such compositions exist also for Zn and Mg. No Cu-, Fe-, or Mn-dominated compositions were found.
The association of elements is also of interest. Figure 10b shows the abundance of the compositions dominated by two metals, such as their sum is > 2.25 apfu. Compositions dominated by a single cation are excluded. The most common association is Ni+Co, covering almost 20 % of our data set. The pairs Co+Zn, Co+Mg, Ni+Mg, and Ni+Cu are also fairly common. The pairs Cu+Mg, Cu+Fe, Cu+Mn, and Fe+Mg do not occur at all as the dominating associated elements.
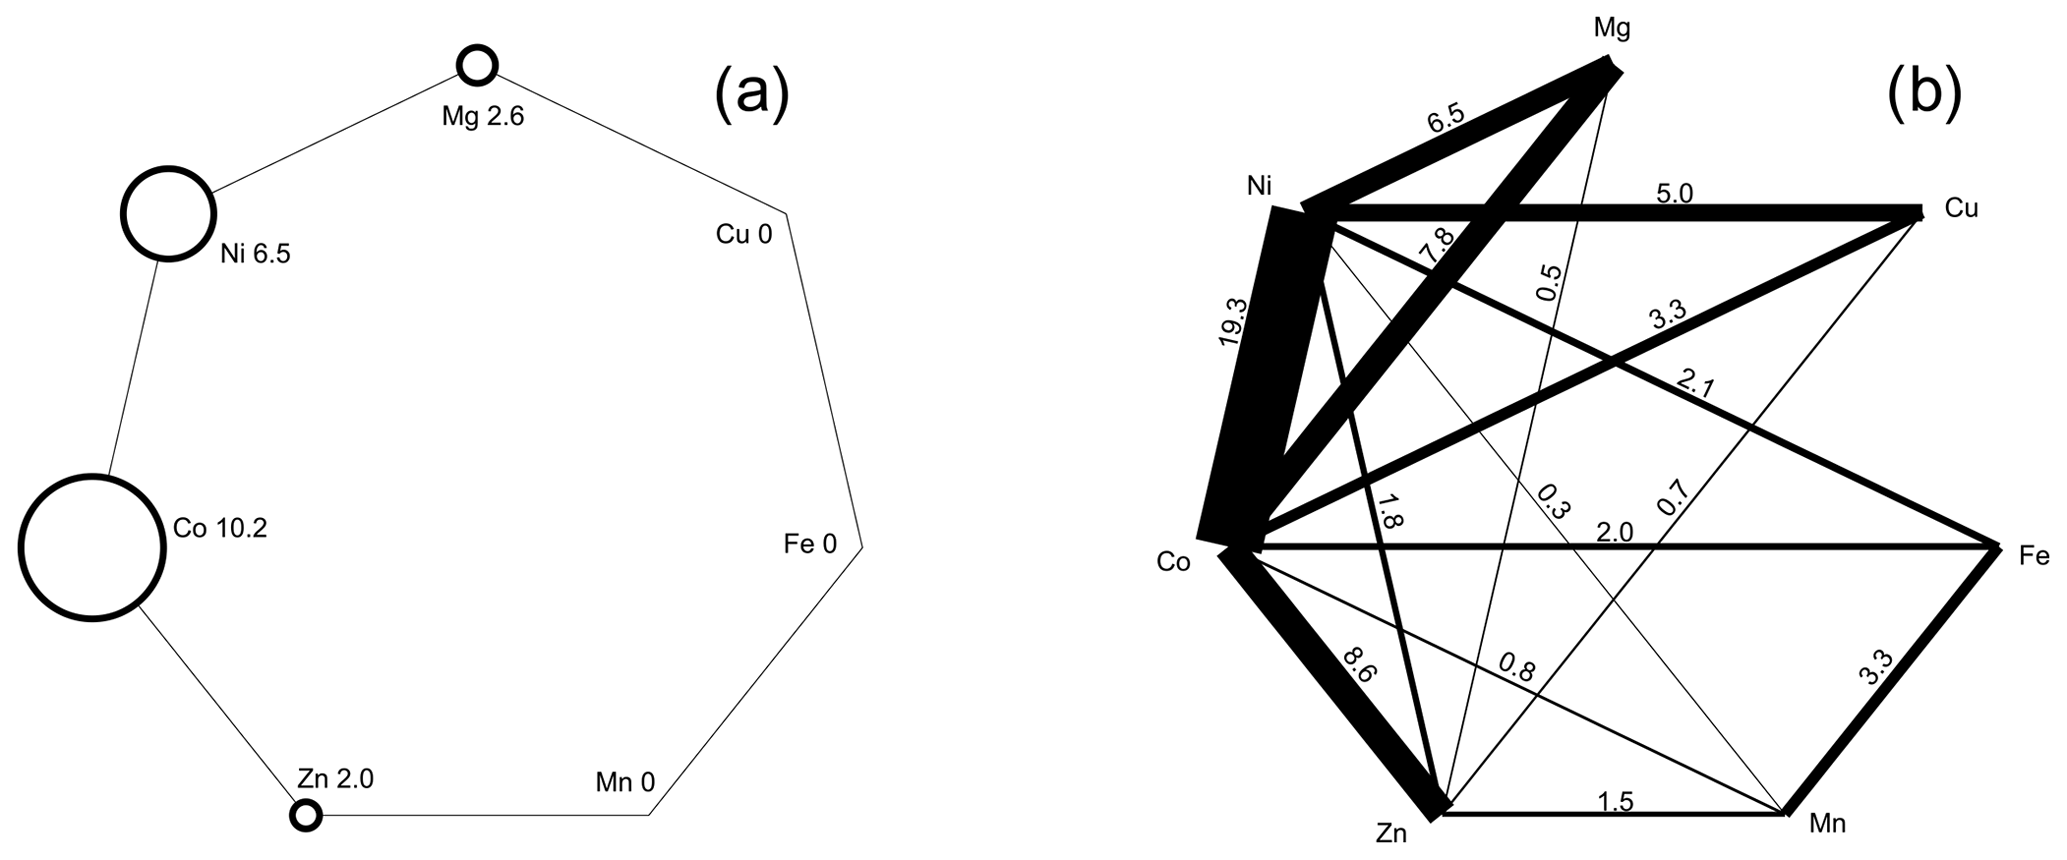
Figure 10(a) Abundance of compositions among the vivianite-group arsenates dominated by a single cation. Dominance here is defined as > 75 % (> 2.25 apfu) of a single metal in the structure. The numbers next to chemical symbols of elements are the percentages of the compositions dominated by that metal in our analytical data set. (b) Abundance of compositions among the vivianite-group arsenates dominated by two cations. Dominance is defined as > 75 % (> 2.25 apfu) of these two cations in the structure. Compositions dominated by a single cation are excluded. Thickness of the line segments shows relative abundance of compositions dominated by two cations connected by that line; the numbers at those line segments are the percentages of such compositions in our analytical data set.
5.1 Syntheses and characterization
The metal ratio in the synthetic products always deviated from the metal ratio in the parental solutions. For the Ni–Co solid solution, the products were slightly enriched in Co (Fig. 4), consistently with the observations of Martens et al. (2005). The results match very well, even though the samples in our work were synthesized with metal–nitrate solutions, whereas those of Martens et al. (2005) were with metal–sulfate solutions. Our results and those of Martens et al. (2005), however, are not in agreement with the synthesis of Wei et al. (2013), who reported that the Ni (Ni+Co) ratios in the initial solutions and solid products were essentially identical.
For the Ni–Mg solid solution, the solids have a strong preference for Ni. Qualitatively, this conclusion is consistent with the findings of Jambor and Dutrizac (1995). There are differences, though, in the Ni (Ni+Mg) ratios in the solids among these two studies (Fig. 4). In our work, the solid samples took up less Ni when compared to the samples of Jambor and Dutrizac (1995). We used metal–sulfate solutions, and Jambor and Dutrizac (1995) used metal–nitrate solutions. Minor differences between the two types of solution could be expected because of the complexation of Co and Ni with the anions present in the solutions.
There are clear indications that the formation of the vivianite-group arsenates in the syntheses described in the literature is driven primarily by kinetic factors. Rapid mixing of the solutions leads to a gelatinous substance (Jambor and Dutrizac, 1995) that does not convert to a crystalline phase. Not only is the structure not assembled, but also the gels do not re-crystallize to a crystalline phase. The tendency to form gels is also encountered in other metal–arsenate (e.g., Deiss, 1914; Buckley et al., 1990) or metal–sulfate systems (e.g., Finch, 1914; Henry et al., 1996), not only in the laboratory but also in nature (Majzlan, 2020). The precipitation rate must be slowed down as much as is reasonable in laboratory experiments, most likely to facilitate the ordered assembly of the octahedral monomers and dimers.
The metal uptake can be controlled by the preference of the metals for octahedral monomers or dimers in the crystal structure, i.e., by thermodynamic arguments, as discussed by Martens et al. (2005). Such a mechanism assumes, however, that the growing crystals are able to selectively uptake the species (M(1)O2(OH2)4 or M(2)2O6(OH2)4) which have the preferred site occupancies. This idea is in conflict with the notion that the crystals are assembled rapidly, even at the slow laboratory rates of mixing. It could be viable, though, under natural conditions where the crystal growth may take much longer times.
We assume that the chemical composition of the solid product is controlled by an interplay of aqueous speciation and kinetics of assembly of the structure. The equilibrium constants for the destruction of aqueous metal–anion complexes are listed in Table 6. They show a substantial difference between the complexation behavior of Co2+ on the one hand and Ni2+ and Mg2+ on the other hand. They mean that at a given equal molality of metal and sulfate or arsenate, the molalities of Co–SO4 or Co–AsO4 complexes will be much smaller than the molalities of Ni–SO4 Ni–AsO4 and Mg–SO4 Mg–AsO4 complexes. It also means that there will be more of the free Co2+ ions that can hydrolyze into octahedral dimers. Alternatively, such dimers may be present in the aqueous solution but the equilibrium constant for the formation of such dimers is not known. Hence, upon crystal growth that is non-selective, cobalt will be preferentially taken up. This situation is observed for the Ni–Co series, where the log Ksp values (see below) would actually predict preferential uptake of Ni.
Table 6Equilibrium constants of the destruction of metal–sulfate and metal–arsenate complexes.
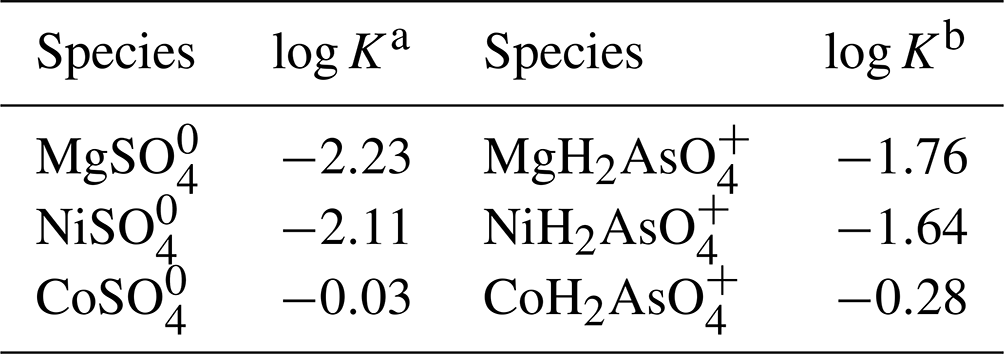
a Database of The Geochemist's Workbench (Bethke and Yeakel, 2016). b Marini and Accornero (2007).
Thermodynamic arguments can prevail only when the solubilities of the end members differ substantially, such as for the Ni–Mg or Mg–Co series. In this case, the solubility of the Mg end member hörnesite is so high that Mg preferentially remains in the solution.
5.2 Available thermodynamic data for annabergite and erythrite
Even though most available thermodynamic data on vivianite-group arsenates can be tracked back to solubility studies, there have also been determinations of the formation enthalpy. Artamonova and Kasenov (1989) measured the heat of precipitation of “annabergite” upon adding solid Na3AsO4 to aqueous NiCl2 solutions. They arrived at kJ mol−1, almost 150 kJ mol−1 more than the value derived in this work. Given the results of this work and those of Jambor and Dutrizac (1995) and Martens et al. (2005), it is very doubtful that such rapid precipitation produced crystalline annabergite well. This value can certainly be discarded. Another value was determined by Omarova and Sharipov (1980), who used acid-solution calorimetry, with an approach very similar to that in this work. Their value is kJ mol−1.
The solubility of annabergite and erythrite was investigated in a number of studies. The early work of Chukhlantsev (1956) is only of historical interest as the materials under study were not properly characterized and the calculated solubility products differ from all later determinations. The works of Charles-Messance et al. (1960, 1964) and Makhmetov and Gorokhova (1988) focused on the construction of phase diagrams and do not contain sufficient information to calculate solubility products. Yuan et al. (2005) specifically paid attention to arsenic leachability from annabergite and did not pay so much attention to its equilibrium solubility. Charykova et al. (2013) determined the solubility of synthetic annabergite and erythrite. They noted that incongruent dissolution explained this problem by spectral interferences in the inductively coupled plasma mass spectrometry (ICP-MS) analysis and corrected it in a manner that was not specified in detail. Zhu et al. (2013) also reported incongruent dissolution, but unlike in Charykova et al. (2013), their solutions were deficient in Ni or Co. Wei et al. (2013) used the same methodology as Zhu et al. (2013) and also detected incongruent dissolution. Wei et al. (2013) reported the same log Ksp values for annabergite and erythrite as Zhu et al. (2013) (the two studies were done by the same group), but for the construction of Lippmann diagrams, Wei et al. (2013) suddenly opted for different log Ksp values, without explanation. Some data on the solubility of annabergite and erythrite were alluded to in Martens et al. (2005).
The most careful analysis of the available solubility data for annabergite was carried out by Langmuir et al. (1999). In their model, they also included the equilibrium constant for the formation of the NiHAsO complex and calculated a log Ksp value of −28.38. The NEA critical evaluation (Gamsjäger et al., 2005) opted for a log Ksp value of −28.1, based on the work of Nishimura et al. (1988), who measured the solubility of annabergite at 25 ∘C at pH values between 4 and 8.
Some studies use data of others and report the solubility, but on the basis of anhydrous compositions such as Ni3(AsO4)2 or Co3(AsO4)2. This unfortunate practice comes perhaps from the fact that the formal addition of H2O, either to the solid (that is, writing Co3(AsO4)2⋅ 8H2O instead of Co3(AsO4)2) or as a product of the dissolution reaction, does not change the numerical value of the log K of the dissolution reaction. Kumok et al. (1983) reported such data, numerically identical with the results of Chukhlantsev (1956). Sadiq (1997) also gave solubility products for anhydrous compositions, without references. The value for Ni3(AsO4)2, if recalculated using auxiliary data in the same paper, yields a log Ksp that is similar, but not identical, to the earlier work. Johnston and Singer (2007), after stating explicitly the formula for symplesite, list its thermodynamic properties on an anhydrous basis in their Table 3.
A striking observation is that the reported log Ksp values for erythrite and annabergite consistently decrease with the year of the study (see Table 7), perhaps caused by improved synthesis protocols (especially with respect to amorphous impurities or nanocrystalline fraction) and inclusion of more sophisticated complexation models (equilibrium constants for metal–arsenate and other complexes). The latest values for erythrite converge at . For annabergite, the situation is worse, as the latest values (Zhu et al., 2013; Charykova et al., 2013) deviate very much.
Chukhlantsev (1956)Lee and Nriagu (2007)Wei et al. (2013)Zhu et al. (2013)Charykova et al. (2013)Chukhlantsev (1956)Sadiq (1997)Nishimura et al. (1988)Langmuir et al. (1999)Wei et al. (2013)Zhu et al. (2013)Charykova et al. (2013)Khoe et al. (1991)Johnston and Singer (2007)Charykova et al. (2010)Johnston and Singer (2007)Lee and Nriagu (2007)Raposo et al. (2004)Lide (2005, p. 1362)Lide (2005, p. 1362)Table 7Solubility products (log Ksp) of the vivianite-type arsenates. All values relate to the reaction M3(AsO4)2⋅ 8H2O → 3M2+ + 2AsO + 8H2O, where M is Co, Ni, Zn, Fe2+, Mn2+, and Mg. Values determined in this work or values recommended in this study are shown in bold. For details, see the text.
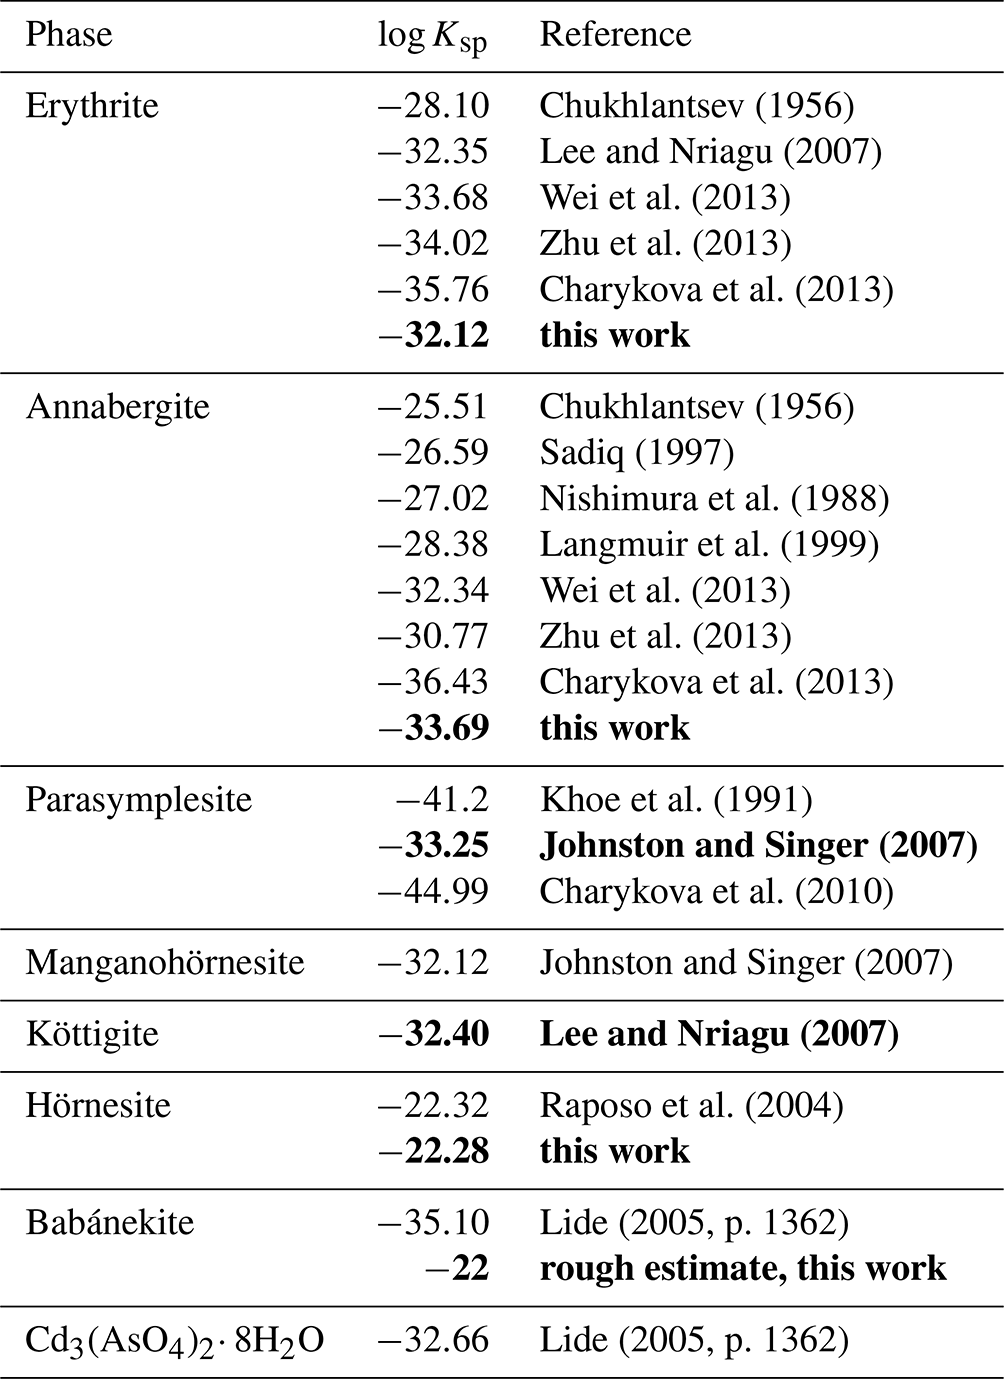
Two remarks are necessary when considering which value is closest to the “absolute truth”. First, unless the problems with incongruent dissolution are addressed and resolved, analysis or re-analysis of the existing solubility data will not bring improvement. For this reason, even though the analysis presented in Langmuir et al. (1999) is excellent, we regard their result as compromised by systematic errors in the solubility data.
The second remark relates to both annabergite and erythrite. The log Ksp,erythrite values, with the exception of the bad data of Chukhlantsev (1956), cluster around −33. If we accept the value of log Ksp,annabergite of approximately −28 (Nishimura et al., 1988; Langmuir et al., 1999; Gamsjäger et al., 2005), then we reconcile the difference of 5 orders of magnitude in solubility with observations in nature. When viewing the (Ni+Co)–Mg join in Fig. 11b, it is striking that the data points concentrate near the Ni+Co apex and thin out gradually toward the Mg apex. This pattern is the result of the large solubility difference among annabergite (or erythrite) and hörnesite. There is no such pattern discernible along the Ni–Co join (Fig. 11a), with the data distribution skewed neither toward the Ni nor toward the Co apex. These observations indicate that there is no substantial difference between the solubilities of annabergite and erythrite.
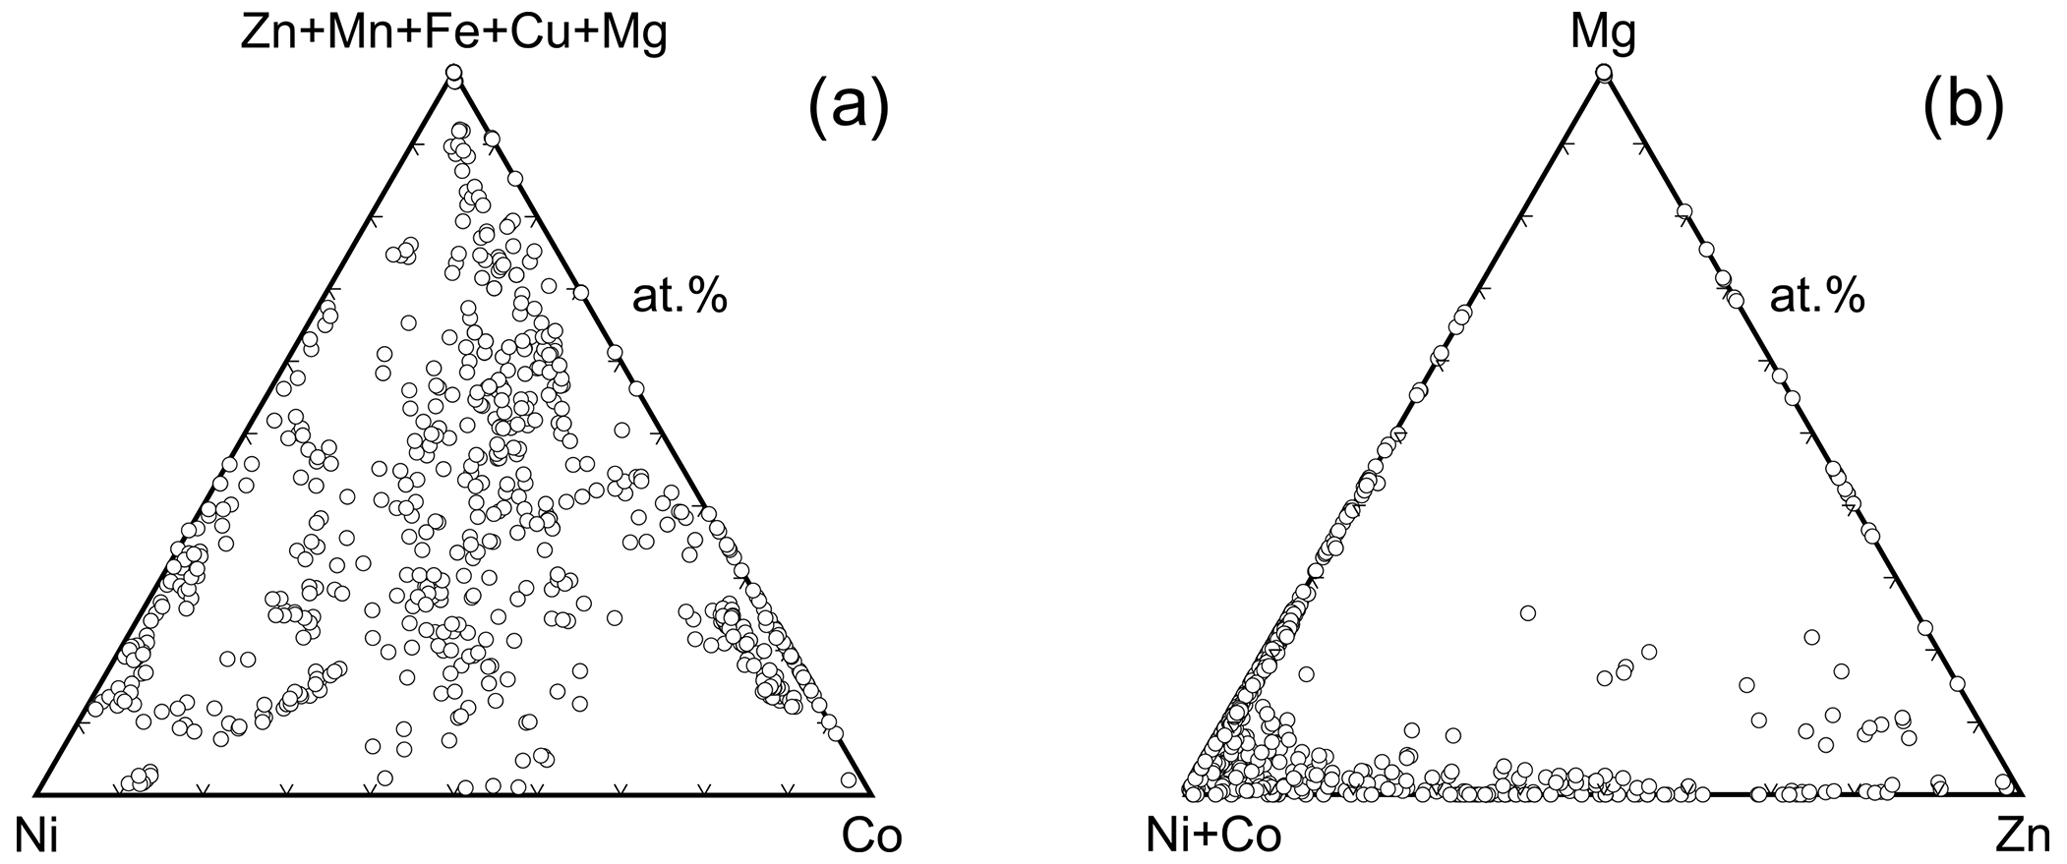
Figure 11Triangular diagrams of elemental ratios in the vivianite-group arsenates. Each point corresponds to a spot electron microprobe analysis.
5.3 Available thermodynamic data for other vivianite-group arsenates
There are not so many data for the other vivianite-group arsenates. Solubility of Mg3(AsO4)2⋅xH2O was investigated by Raposo et al. (2004). A careful reduction of the solubility data gave log Ksp of . Unfortunately, the composition Mg3(AsO4)2⋅ 8H2O, analogous to that of the mineral hörnesite, was only assumed.
The solubility product of köttigite was reported by Lee and Nriagu (2007). It deviates much from the value presented in Charykova et al. (2010), who refer to Magalhães et al. (1988), who, in turn, refer back to Chukhlantsev (1956). Not surprisingly, the value derived from the data in Chukhlantsev (1956) indicates much higher solubility of köttigite and should be disregarded.
The solubility of parasymplesite was measured and discussed by Johnston and Singer (2007). Solubility that is more than 10 orders of magnitude lower is indicated by Charykova et al. (2010); their data were derived from other literature data (citation not listed in the references). The value of Khoe et al. (1991) is also more negative than that of Johnston and Singer (2007). The observations from natural systems, also presented in this paper, give no justification for and no indication as to why parasymplesite should be so much less soluble than the other vivianite-group arsenates. If it were, then all occurrences of annabergite–erythrite that grow on hydrothermal Fe carbonates (a common situation) should be markedly enriched in iron. This is, however, not the case. In addition, the solubility product of vivianite, Fe3(PO4)2⋅ 8H2O, is −33.06 (Johnston and Singer, 2007), and there is no reason why the arsenate should be so much more insoluble than the isostructural phosphate. Actually, the data show that arsenates of transition metals are usually slightly more soluble than the phosphates of the same metals, hence supporting the datum of Johnston and Singer (2007).
Johnston and Singer (2007) also listed log Ksp values for Cu and Cd end members of the vivianite-group arsenates, taken from Lide (2005). Lide (2005) refers to anhydrous compositions Cd3(AsO4)2 and Cu3(AsO4)2, and their relevance to the vivianite-group arsenates is not clear. Johnston and Singer (2007) attempted to correlate the solubility products of the vivianite-group arsenates and phosphates and concluded that “no clear relationship is evident”.
The solubility products for the vivianite-group arsenates vary mostly between −32 and −35. The exception is the log Ksp for hörnesite and the estimate for babánekite, both significantly higher. Values selected in this study are marked in bold in Table 7.
5.4 Stability relationships in the systems NiO–As2O5–H2O and CoO–As2O5–H2O
These two systems are similar in that there are no nickel and cobalt arsenates more stable than annabergite and erythrite. When considering the thermodynamic stability at relatively low levels of total arsenate activity and CO2 partial pressure in the air (Fig. 12), the only intervening phases are carbonates under high-pH conditions. Solubility minima for both annabergite and erythrite are encountered in a slightly basic region, corresponding well to the observations that these minerals form on Ni–Co arsenides that weather in the presence of carbonate minerals.
The absence of an olivenite-like Co2AsO4(OH) phase in natural settings is surprising. Among the copper and zinc arsenates, olivenite and adamite (also with olivenite structure), respectively, are the stable phases with expansive stability fields (see below). The cobalt analog of olivenite is known as a synthetic phase (Keller, 1971) and is a minor solid-solution component in many olivenite samples from Tsumeb (e.g., Southwood et al., 2020).
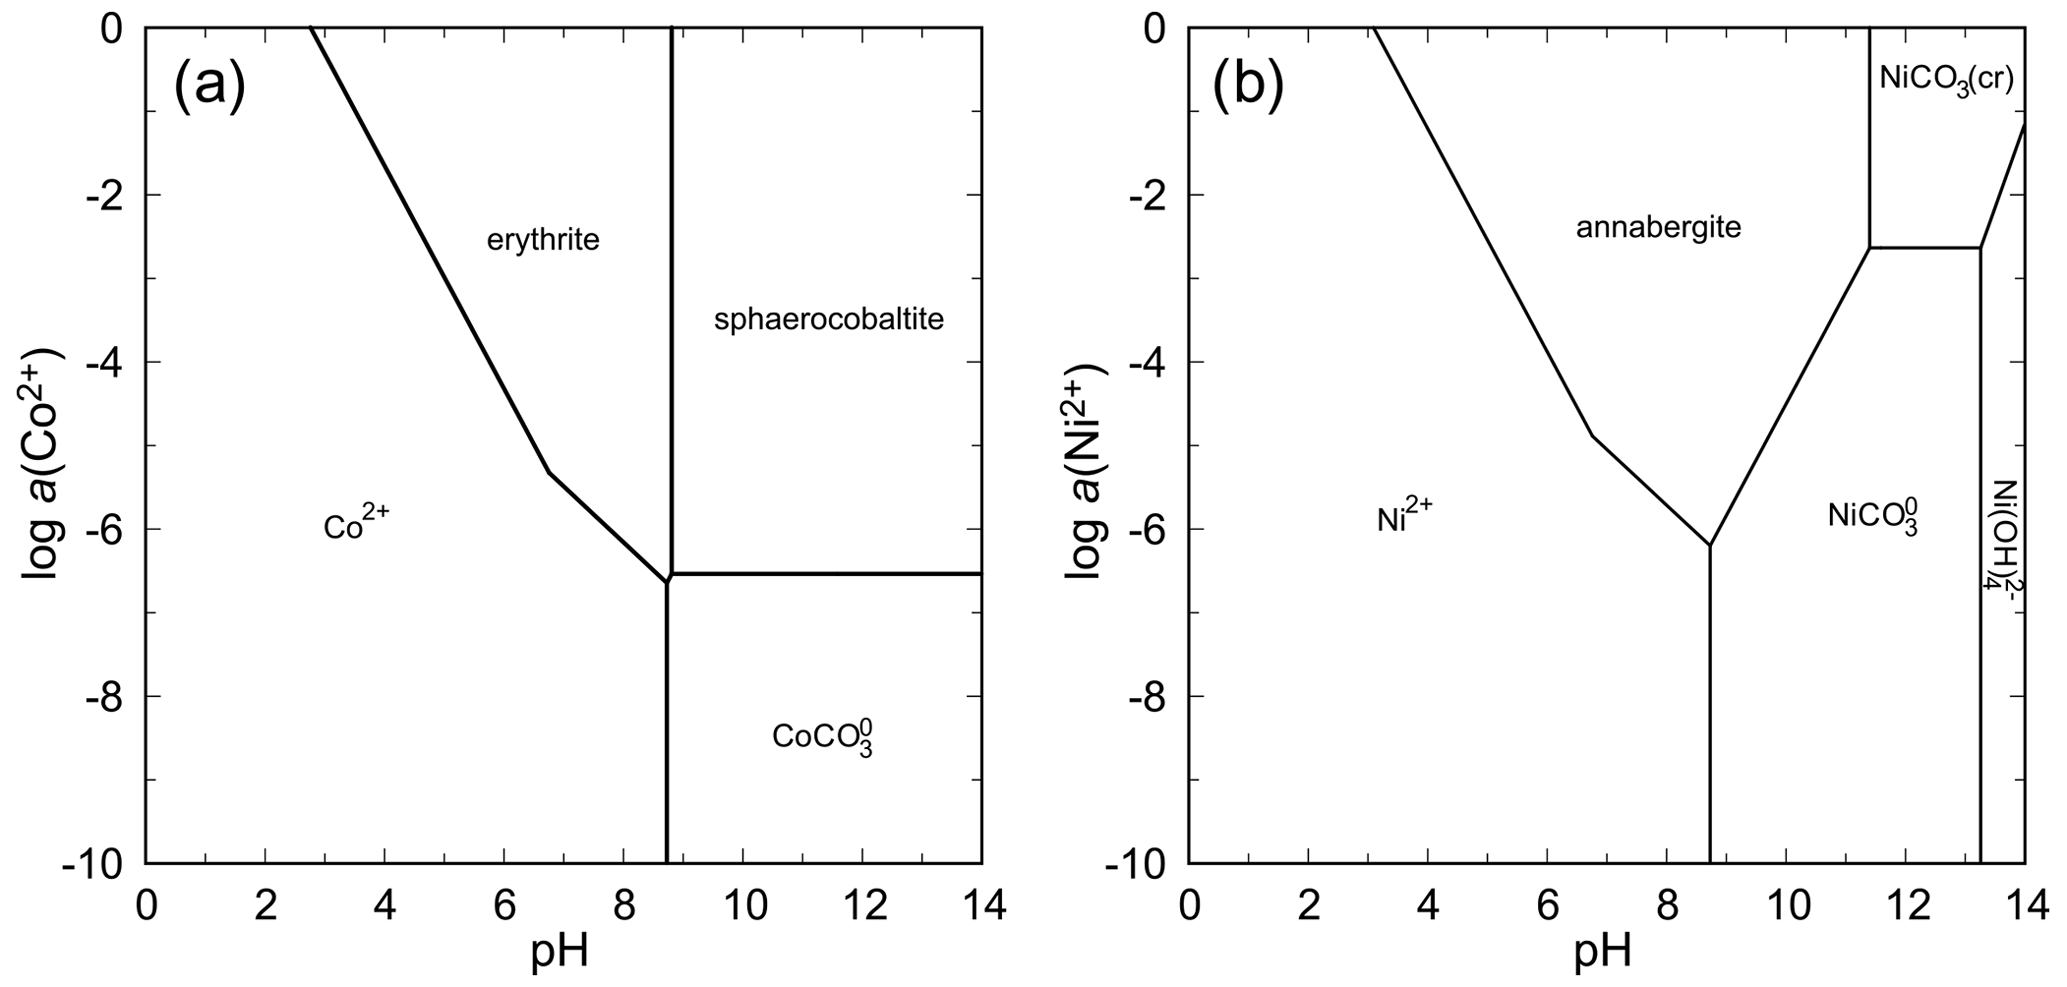
Figure 12pH–metal activity diagrams for the system CoO–As2O5–H2O (a) and NiO–As2O5–H2O (b), with log a(As(V)) = −4, log p(CO2,g) = −3.5, T = 298.15 K, and P = 105 Pa. Calculated with The Geochemist's Workbench (Bethke and Yeakel, 2016). For data for annabergite and erythrite, see Table 7.
5.5 Stability relationships in the systems FeO–, MgO–, and MnO–As2O5–H2O
The system FeO–As2O5–H2O is seemingly similar to the systems with NiO and CoO because parasymplesite is, indeed, the only stable ferrous arsenate phase that appears on the phase diagram (Fig. 13). Precipitation of parasymplesite in equilibrium is, however, limited to a narrow range of pH–Eh conditions under which the species of Fe(II) and As(V) predominate. Oxidation of Fe(II) leads to the formation of scorodite or arsenical ferrihydrite, among many other ferric arsenates (e.g., Drahota and Filippi, 2009). Disequilibrium states can also produce ferric arsenite tooeleite. Thus, formation of parasymplesite is significantly hampered by the redox behavior of iron, especially when one considers that the inorganic rate of Fe(II) oxidation in near-neutral conditions, when the minimum solubility for parasymplesite is reached, is very high (e.g., Nordstrom, 1982).
Hörnesite is more soluble than parasymplesite, annabergite, or erythrite. The higher solubility is manifested by the shift of the stability field toward higher activities of Mg(II) in the solution (Fig. 13). At pH > 8 and contact with atmospheric pH, magnesite is predicted to be more stable than hörnesite.
There are too few data to evaluate the stabilities for the manganese arsenates. One could guess that the relationships in this system are similar to those in the system with FeO. The tendency of Mn to reach oxidation states higher than +2 under usual weathering conditions will present a significant obstacle for the formation of abundant manganohörnesite.
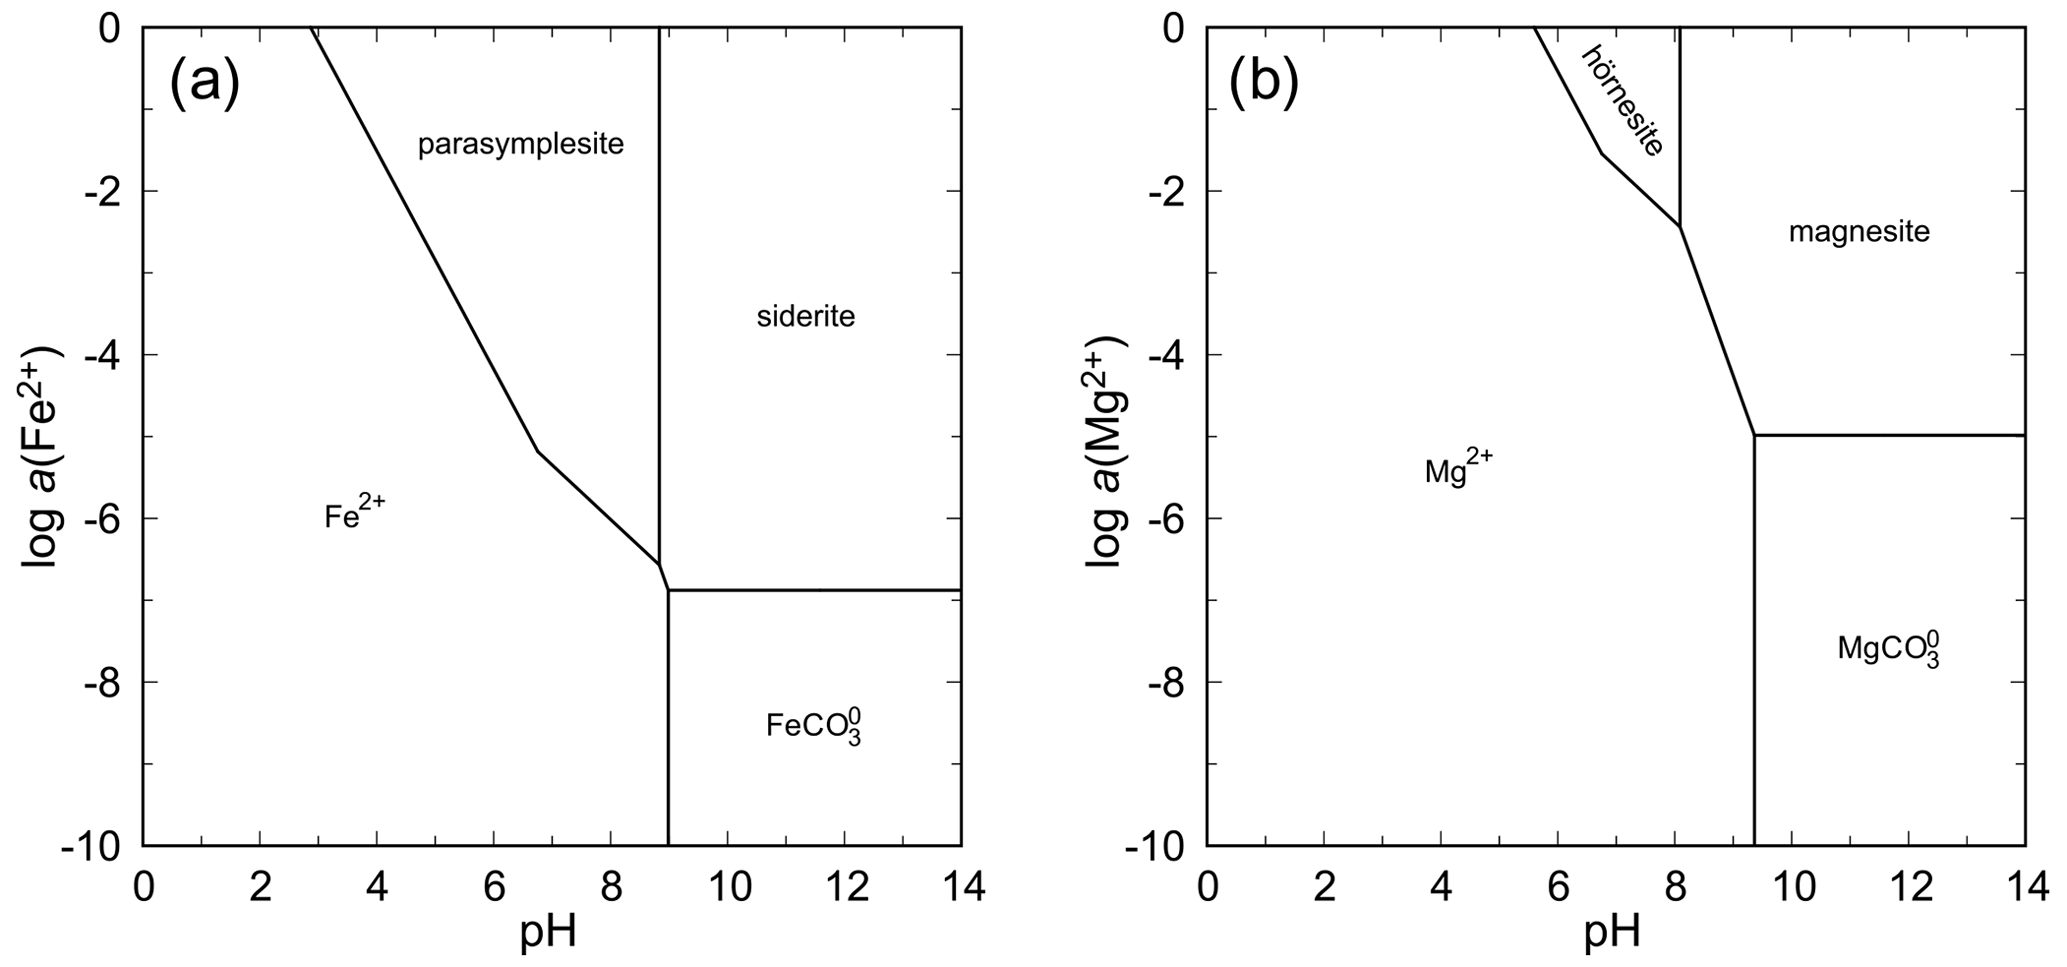
Figure 13pH–metal activity diagrams for the system FeO–As2O5–H2O (a) and MgO–As2O5–H2O (b), with log a(As(V)) = −4, log p(CO2,g) = −3.5, T = 298.15 K, and P = 105 Pa. Calculated with The Geochemist's Workbench (Bethke and Yeakel, 2016). For data for parasymplesite and hörnesite, see Table 7.
5.6 Stability relationships in the systems ZnO–As2O5–H2O and CuO–As2O5–H2O
In both these systems, arsenates with olivenite structure (olivenite, adamite) are the most stable phases under the conditions considered (Figs. 14, 15). In the system with ZnO, köttigite has a small stability field at very high aqueous concentrations of Zn2+ and low pH (Fig. 14). Such conditions, hardly attainable in nature, are most likely not the conditions of formation of this mineral. At pH = 8, the ΔrG of the reaction
is +10.2 kJ mol−1 for log a(As(V)) = −4 and log a(Zn) corresponding to the equilibrium between köttigite and aqueous phase (−5.736). An increase in either a(As(V)) or a(Zn) will diminish the ΔrG.
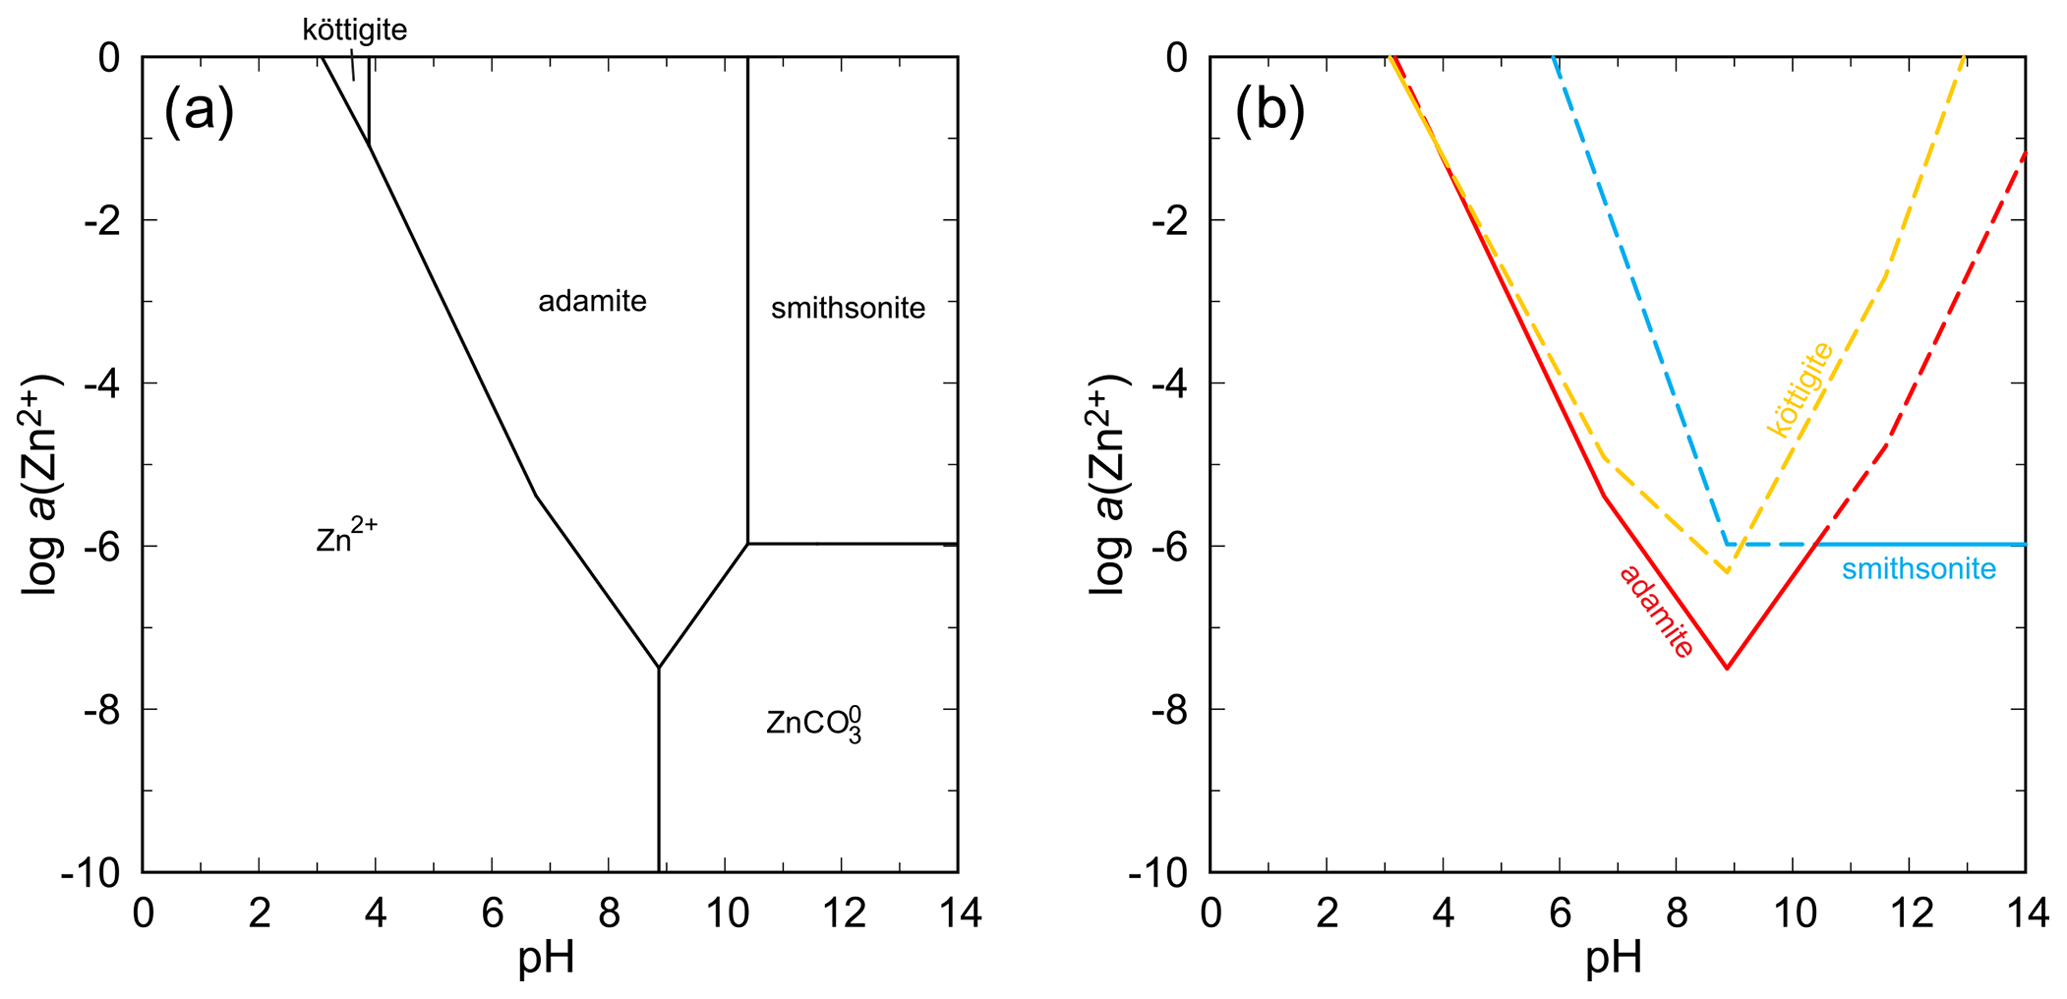
Figure 14pH–metal activity diagram for the system ZnO–As2O5–H2O, showing the stability fields of zinc arsenates adamite and köttigite and the zinc carbonate smithsonite, with log a(As(V)) = −4, log p(CO2,g) = −3.5, T = 298.15 K, and P = 105 Pa. Calculated with The Geochemist's Workbench (Bethke and Yeakel, 2016). Data for zinc arsenates are from Lee and Nriagu (2007) and Magalhães et al. (1988). (b) Solubility curves for the zinc minerals under the same conditions as in (a).
The situation in the system CuO–As2O5–H2O is much more complex because of a number of intervening phases. Stable arsenates are olivenite and clinoclase (Fig. 15). Calculation of the solubility curves (Fig. 15) shows that olivenite, clinoclase, cornwallite–cornubite, and euchroite are, especially in the mildly acidic region, closely spaced in terms of their solubilities and stabilities. Geminite and pushcharovskite are much less stable. If judged by its rarity, babánekite should be one of the least stable phases. Assuming log Ksp of −22 for this phase, the solubility curve of babánekite plots in the upper portion of the diagram, near the solubility curve of pushcharovskite. The scarcity of both minerals justifies such position of the solubility curves. Selecting the log Ksp value from Lide (2005, referenced in Table 7 in this work) makes babánekite much more stable, comparable in stability to clinoclase or cornubite. Such a relationship is, in our opinion, unrealistic in the view of the natural occurrences of the copper arsenates. Clinoclase and cornubite occur commonly, but babánekite is very rare. The log Ksp of −22 for babánekite could be used, if desired or necessary, for approximate geochemical modeling involving this phase. At pH = 8 and log a(As(V)) = −4, the ΔrG for this reaction
is +70.6 kJ mol−1, significantly more than for the adamite–köttigite pair.
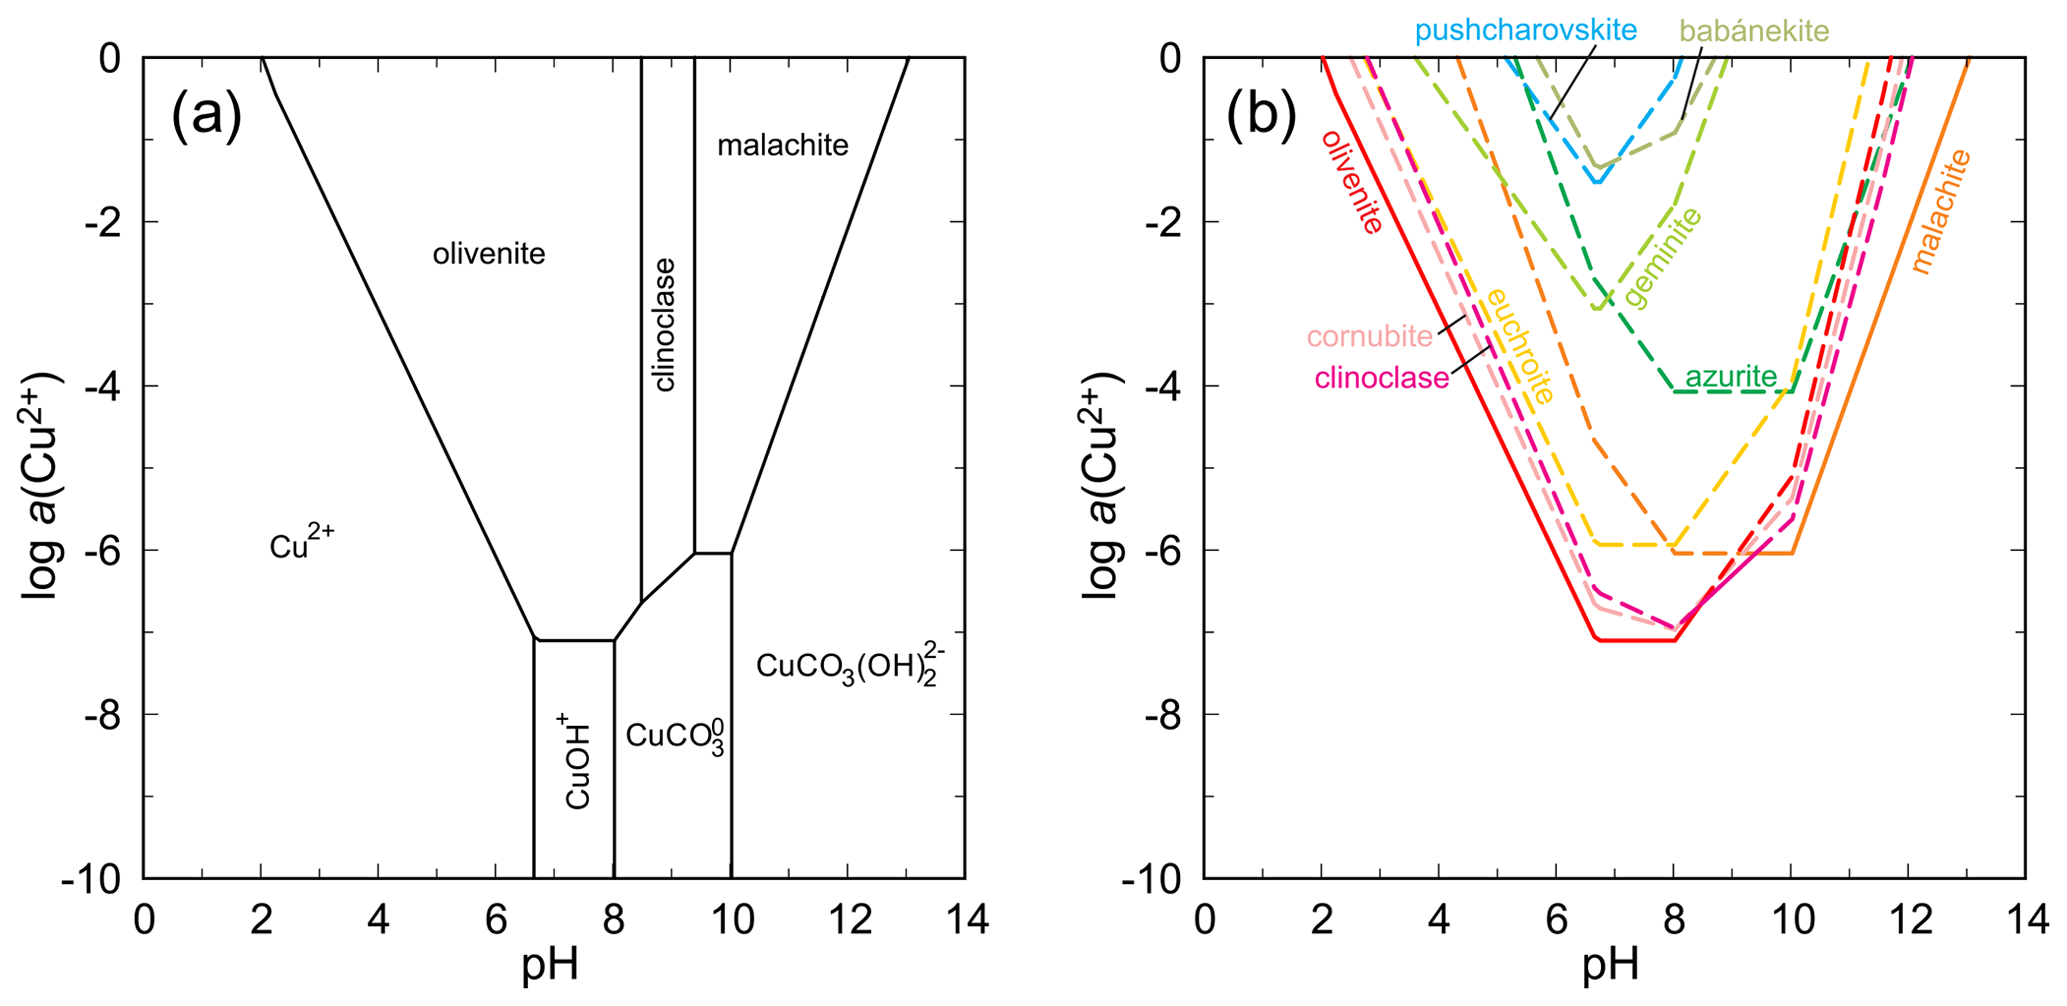
Figure 15(a) pH–metal activity diagram for the system CuO–As2O5–H2O, showing the stability fields of copper arsenates olivenite and clinoclase and the copper carbonate malachite, with log a(As(V)) = −4, log p(CO2,g) = −3.5, T = 298.15 K, and P = 105 Pa. Calculated with The Geochemist's Workbench (Bethke and Yeakel, 2016). Data for copper arsenates are from Magalhães et al. (1988) and Majzlan et al. (2015) and unpublished data. For babánekite, a log Ksp of −22 was assumed. For details of this assumption, see the main text. (b) Solubility curves for the copper minerals under the same conditions as in (a).
5.7 Thermodynamics of the solid solutions
The enthalpies of mixing (Fig. 5) in the investigated solid solutions show unusual complexity. This is related to cation ordering on the available structural sites, i.e., in the octahedral monomers and dimers in the structure (see a few paragraphs below). When looking at the Ni–Co solid solution in detail (Fig. 5a), we notice that the enthalpies of mixing rise steeply from erythrite (Co100) but drop significantly near Co67Ni33. Afterwards, they remain small in magnitude and vary much less.
In the Ni–Mg solid solution (Fig. 5c), the enthalpies of mixing drop steeply from annabergite (Ni100) but then approach zero again, with a minimum around the composition Ni80Mg20. Afterwards, they drop again to a broader minimum.
The simplest is the Mg–Co (erythrite–hörnesite) solid solution (Fig. 5d). Given the small magnitude of ΔmixH and the range of the available data, this solid solution can be modeled for practical purposes as an ideal solution, with ΔmixH = Hex = 0.
The difficulty lies in the fact that these solid-solution series are made of at least two subsystems. The two subsystems are defined by the occupancies of the M(1)O2(OH2)4 monomers or the M(2)2O6(OH2)4 dimers, with an M(1) : M(2) ratio of 1 : 2. If there is pronounced preference of one of the cations for a certain M(1) or M(2) site, the entire solid solution will be split into a subsystem approximately between M(1)0 − M(1)33M(2)67 and a subsystem approximately between M(1)33M(2)67 − M(1)100. In the subsystem M(1)0 − M(1)33M(2)67, the cation with the preference for the M(1) site occupies that site. Past this composition, the cation with the preference for the M(1) site is forced to also enter the M(2) site.
We must note, however, that the boundary between the two subsystems need not lie at M(1)33M(2)67. In fact, this boundary is certainly not a sharp line but rather a fuzzy, broad interface between the two subsystems. The exact location of the center of this boundary is given by the intensity of preference for a certain site. This conclusion is in contrast with the approach of Martens et al. (2005), who were seeking boundaries exactly at M(1)33M(2)67 and split the Ni–Co solid solution into segments in which the observed parameters varied linearly. We refrain from such an approach as the properties of these solid solutions vary continuously, without sudden breaks. This type of splitting would be reasonable if there were a line compound (at least at room temperature) with the composition NiCo2(AsO4)2⋅ 8H2O.
Another possibility for the division of the studied solid solutions in subsystems was mentioned by Martens et al. (2005). In that case, the structure may have a tendency to occupy the M(2) sites consistently by two different cations. They likened this situation to the aluminum-avoidance rule in the crystal structures of silicate minerals.
Most commonly, the ΔmixH data are mathematically described by a simple symmetric one-parameter Margules model. In this case, however, such a model is insufficient. For asymmetric mixing curves, the Redlich–Kister polynomial can be used (e.g., Fels et al., 2019):
where xA and xB are the mole fractions of the end members. The coefficients Ln can be obtained by fitting to the available data. Setting xB = x and xA = 1−x, we get (e.g., Boyne and Williamson, 1967)
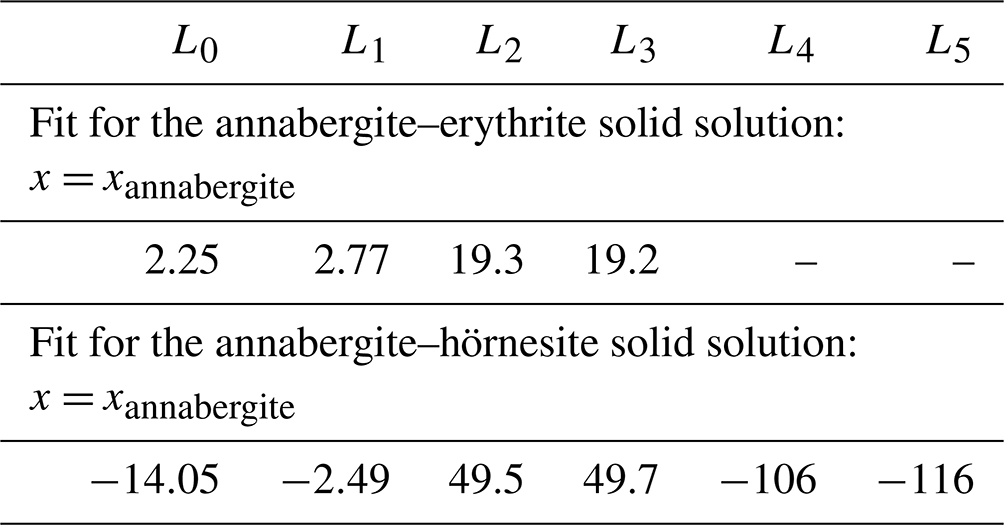
Equation (2) was used to fit ΔmixH data for the annabergite–erythrite and annabergite–hörnesite solid-solution series. The results are shown as dashed lines in Fig. 5a and c, and the fit coefficients Ln are listed in Table 8. The number of the coefficients Ln was increased to minimize the goodness of the fit. Increasing the number of the coefficients beyond that in Table 8 improves the goodness of the fit but also leads to spurious extrema and unreasonable variations between the data points.
Table 8Fit parameters (in kJ mol−1, 3 M-site mixing) of the Redlich–Kister polynomial (Eq. 2) for the solid solutions studied in this work.
Even with this number of fit parameters, the fits are not able to describe some features in the data sets. Especially the extrema (maxima in the Ni–Co and Ni–Mg series) are not captured properly. The kink in the Ni–Mg series at the hörnesite side is an artifact resulting from a high degree of the fit polynomial. We note that this kink could not be remediated by additional data in this region. Inserting dummy data points in this region (between Ni33Mg67 and Mg100) does not fix the problem, rather the contrary.
The fits with the coefficients in Table 8 allow for modeling the enthalpies of mixing in the studied solid solutions. Their combination with entropies of mixing and the consequences for the behavior of these solid solutions are discussed below.
5.8 Autocorrelation analysis and strain in the solid solutions
The results of the autocorrelation analysis are plotted in Fig. 5 for a direct comparison with the excess enthalpies. In the Ni–Co and Mg–Co solid-solution series, there is much scatter and no clear trends for the k2 values. It appears that the substitutions do not cause or release strain but probably cause a slight re-arrangement of the heteropolyhedral sheets (adjustments in the lattice parameters a and β; see Results).
Only for the Ni–Mg solid solution is there a clear correlation between excess enthalpies and k2 values (Fig. 5c) in the Ni-rich region of this solid solution. Here, the excess enthalpies show a minimum near Xannabergite ≈ 0.1. The k2 values behave in a similar way, suggesting that substitution of Mg into annabergite relieves some of the strain accumulated in the end member annabergite. This observation could explain why the natural Ni–Co-dominated arsenates of the vivianite group almost always contain a small amount (≈ 10 at. %) of other cations such as Mg, Zn, or Fe (Fig. 11a). Incorporating these can relieve the strain in the structure and stabilize it, not only by increasing the configurational entropy, but also by decreasing the enthalpy of mixing.
5.9 Configurational entropy
Chemical variations in the natural vivianite-group arsenates are extensive. A measure of mixing at the cation sites is the ideal configurational entropy of mixing (see Ulbrich and Waldbaum, 1976):
where Xi,j is the fractional occupancy of the ith atom/group of atoms on the jth site and mj is the ratio of multiplicity of this site divided by Z. For the vivianite-type arsenates,
where Xi is the mole fraction of the metal i on the cation sites and
This Sconf can be reached only if the cations are fully disordered over all available metal sites (M(1) and two M(2) sites). For an n-component system with mixing on three sites (just as for the vivianite-type arsenates), such maximal configurational entropy is given by
The calculated Sconf,max for all analyses of the natural samples is plotted in Fig. 16 against the number of Co apfu. Cobalt was chosen only because it spans the entire range of apfu from 0 to 3. The highest calculated Sconf,max value for the natural samples is 40.8 J mol−1 K−1, compared to the theoretical maximum of = 48.5 J mol−1 K−1.
The maximal configurational entropy can be translated into Gibbs free energy of mixing and the corresponding stabilization of a solid solution by the term. For the maximum entropy attained here, such stabilization is 12.2 kJ mol−1 (at T = 298.15 K). Figure 16 shows that the maximal configurational entropy reaches 30 J mol−1 K−1 for many compositions analyzed in this work, meaning stabilization of ≈ 9 kJ mol−1. This energy alone could approximately offset the difference between adamite and köttigite but certainly not the difference between olivenite and babánekite.
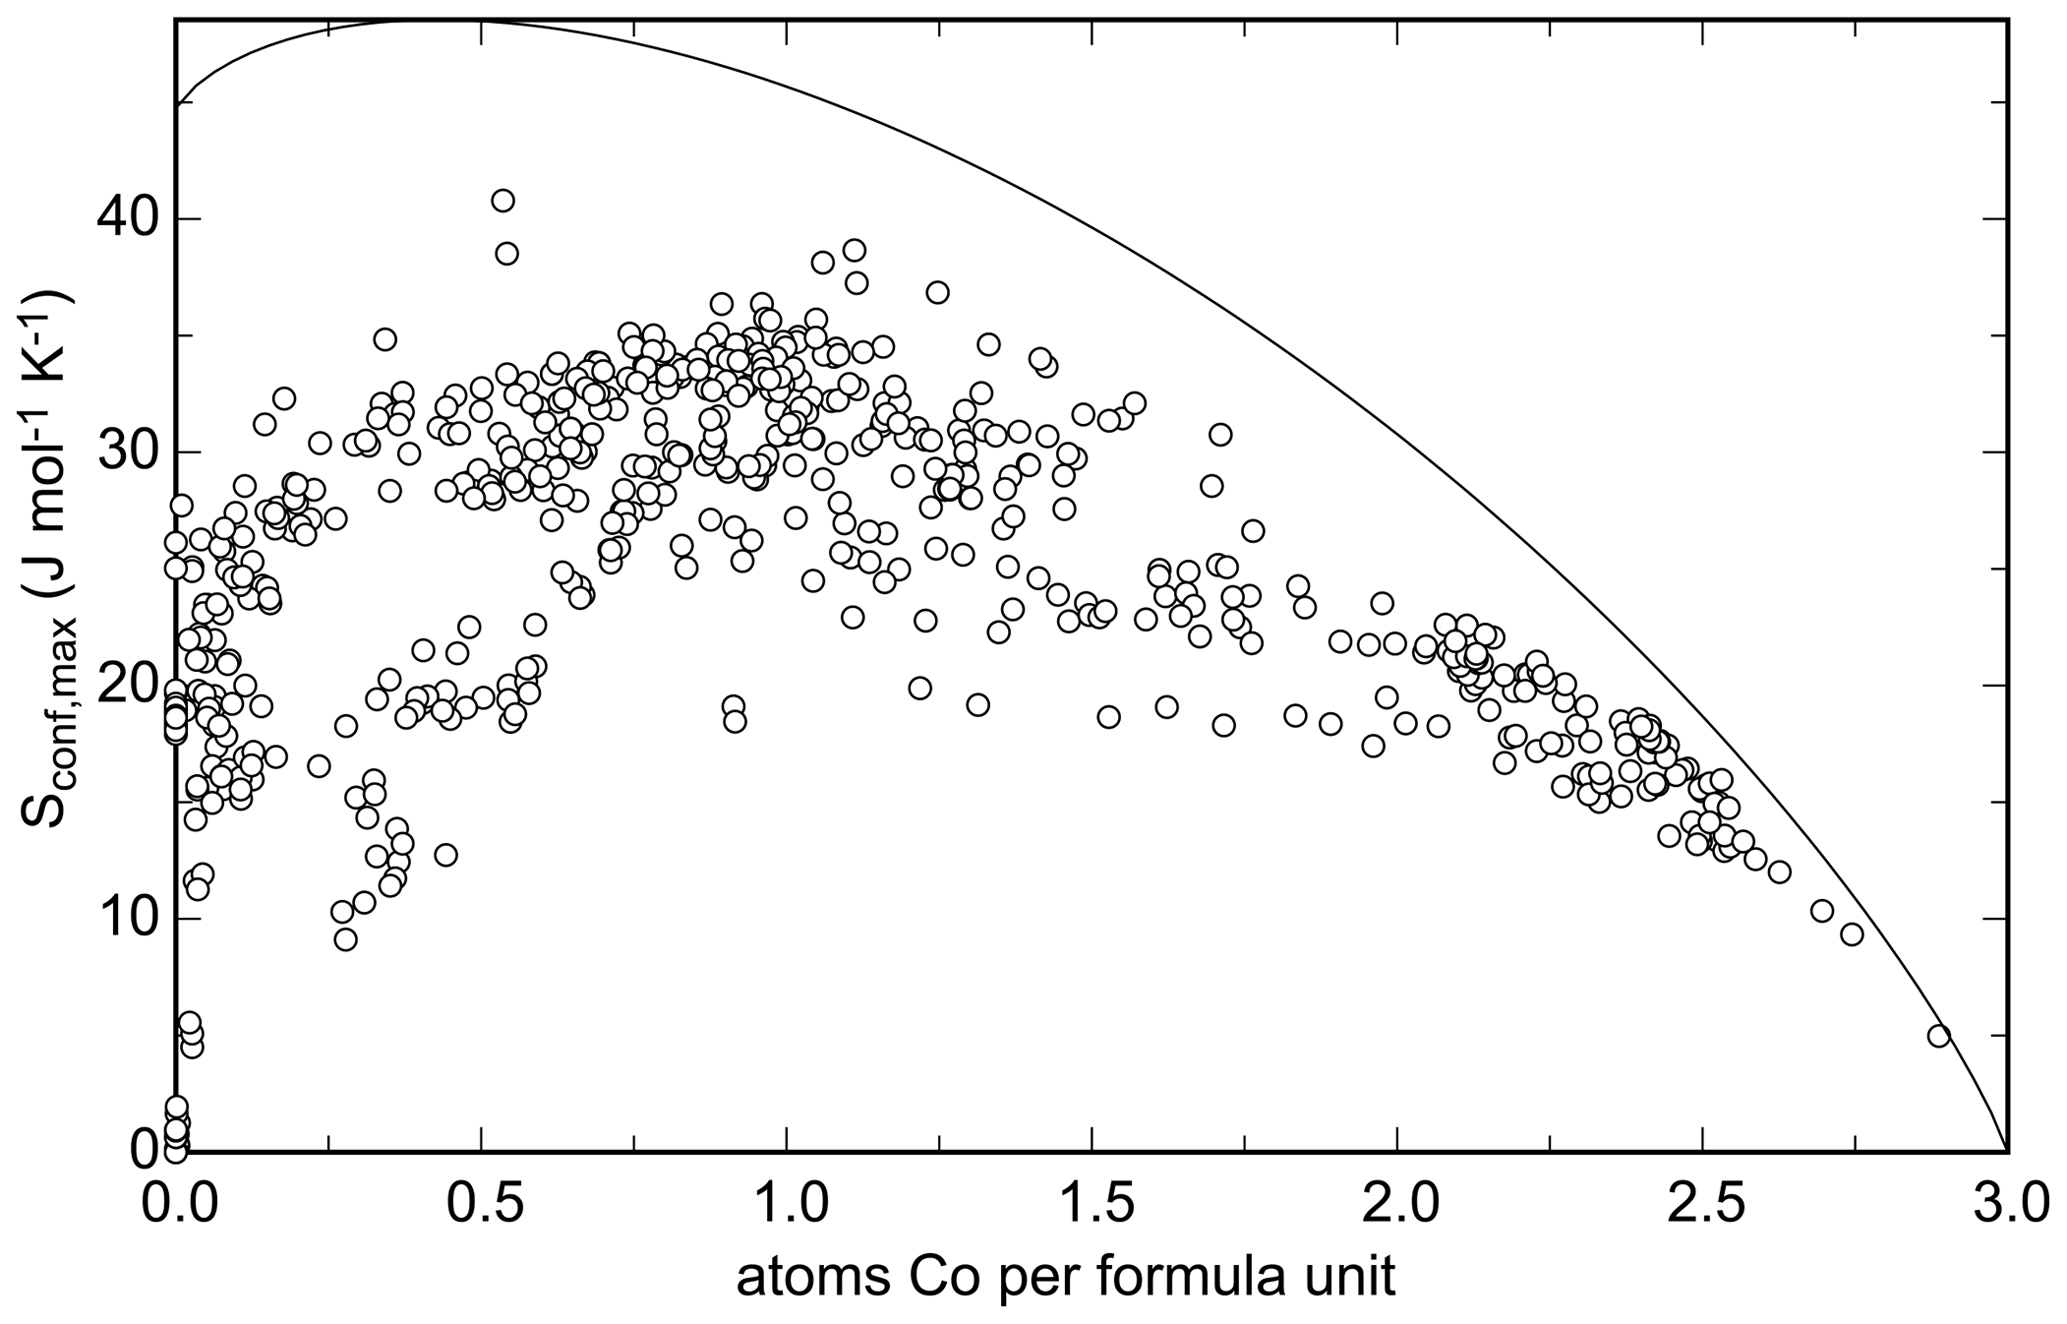
Figure 16Configurational entropy calculated from each electron microprobe analysis performed in this work plotted against the number of Co atoms per formula unit. Cobalt was chosen only because it spans the entire range of 0–3 apfu. The solid curve shows the maximal achievable configurational entropy at a given Co content, assuming that the cations are fully disordered over all available sites.
5.10 Gibbs free energies of mixing and the formation of solid solutions
The Gibbs free energies of mixing are negative throughout the Mg–Co and Ni–Mg solid solutions. Only in the Ni–Co solid solution do the available data suggest that there may be a small region with positive ΔmixG. This conclusion is in contrast with the data of Wei et al. (2013), who determined that Gex is negative for the entire solid solution (Fig. 5a). Our data suggest that the model of Wei et al. (2013) does not capture the full complexity of the Ni–Co solid solution for the vivianite-group arsenates. This statement refers particularly to the notion of two subsystems in the solid solutions, discussed in this work and in the work of Martens et al. (2005).
For the Ni–Co solid solution, we can calculate . The result is plotted in Fig. 5a and shows a small region near the erythrite end-member composition with positive ΔmixGA values. This calculation assumes that the maximal available configurational entropy was achieved; i.e., the cations are fully disordered. This will, however, not be the case, because the above-discussed site preferences document ordering phenomena in the various solid solutions that will lower Sconf. In Fig. 5a, we therefore also plotted a curve for ΔmixGB, where Sconf =. The situation remains unchanged except the region of positive ΔmixG is larger than previously. In this case, the maximum ΔmixGB is slightly larger than 1 kJ mol−1, larger than the calorimetric uncertainties (see Table 3). A small Sex value, on the order of 3 J mol−1 K−1, would be sufficient to lower ΔmixG below 0 kJ mol−1. Another possibility is to include other cations in the structure and increase the configurational entropy. Such a possibility is viable when inspecting the data from natural minerals (Fig. 11). Even though the Ni–Co solid solution is populated by many compositions, only a few of them lie directly on or very near the Ni–Co binary join. In most of these compositions, additional cations (Zn, Fe, Mn, Cu, Mg) are present and their presence increases the configurational entropy.
Given that the natural assemblages provide no indications of a miscibility gap and the calculated positive ΔmixG values could be easily offset by a small entropy contribution, we cautiously suggest that the Ni–Co solid solution is continuous.
The data generated in this work can be used to model natural systems that contain vivianite-group arsenates. Recently, we have sampled aqueous solutions in contact with annabergite and erythrite in the underground spaces of the historical Jáchymov deposit (Majzlan et al., 2020). The solution in contact with erythrite would give a log Ksp of −33.92, in rough agreement with most data for this mineral (see Table 7). This log Ksp was calculated from solution no. 3 in Table 3 in Majzlan et al. (2020), using the program PHREEQC (Parkhurst and Appelo, 1999). The solution in contact with annabergite would return a log Ksp of −29.04, much less than the value found in this work and closer to the value in Langmuir et al. (1999, referenced in Table 7 in this work). We noted, though, that the water in contact with the annabergite aggregate was dripping much faster than at other sites in the mine and possibly was not in equilibrium with annabergite. More fieldwork and experimental work need to be done to resolve this issue. There is no obvious reason, however, to discard our log Ksp datum for annabergite if the data for erythrite and hörnesite are accepted. All of them were determined by the same methodology. We also note that to obtain a log Ksp of −29 for annabergite from our calorimetric data, the measured enthalpy of dissolution would have to shift from −23 to kJ mol−1. Such a shift would imply a systematic error of 27 kJ mol−1, about 100 times larger than the usual uncertainties in the measurements, which appears to be unreasonable.
If the log Ksp values from this work are accepted, they would indicate lower solubility of common vivianite-group arsenates (annabergite, erythrite) than that assumed by Langmuir et al. (1999). The consequence thereof would be lowering of the predicted As solubility well below the 2 mg L−1 in tailings rich in Ni and As. Using our data and assuming congruent dissolution, the equilibrium solubility would be about 0.9 mg As L−1 at pH = 7. In the long term, arsenic in such tailings could be fixed in annabergite under circumneutral conditions. If such a remediation strategy were to be attempted, magnesium should not be present in high concentrations because of the much higher solubility of hörnesite (Table 7).
The vivianite-group arsenates are highly soluble under acidic conditions. At pH = 4, the calculated, equilibrium, and congruent solubility of annabergite would be predicted as 192 mg As L−1. Annabergite and erythrite would dissolve and cannot buffer the arsenic concentrations at low levels under such conditions. In the case of hörnesite, it is also dissolved but replaced by rösslerite or brassite in low-pH, Mg- and As-rich solutions (Majzlan et al., 2020). Hence, these phases will play no role in acid mine drainage. If they already exist and are exposed to acidic conditions, they will supply an ample amount of arsenic to the aqueous phase.
Data are available as follows: variations in lattice parameters for Ni–Co, Co–Mg, and Ni–Mg solid-solution series (Figs. S1–S9 in the Supplement); Fourier-transform infrared spectra for all three solid-solution series (Figs. S1–S9; raw data, CSV in the Supplement); electron microprobe analyses of the natural samples (XLSX in the Supplement); heat capacity data for the end members annabergite, erythrite, and hörnesite (XLSX); and thermogravimetric (TG) and differential thermal analysis (DTA) data for the end members annabergite, erythrite, and hörnesite (Figs. S1–S9; raw data, TXT in the Supplement).
The supplement related to this article is available online at: https://doi.org/10.5194/ejm-36-31-2024-supplement.
JM: conception of the project, acid-solution calorimetry, reduction of data, calculation of thermodynamic quantities and models, writing of the paper. AR: syntheses and characterization of the samples. PH: acid-solution calorimetry. MŠ, JS: fieldwork, characterization of natural samples, discussion of natural assemblages. ED: relaxation calorimetry.
The contact author has declared that none of the authors has any competing interests.
Publisher’s note: Copernicus Publications remains neutral with regard to jurisdictional claims made in the text, published maps, institutional affiliations, or any other geographical representation in this paper. While Copernicus Publications makes every effort to include appropriate place names, the final responsibility lies with the authors.
We appreciate financial support of all funding agencies (see below). We thank Birgit Kreher-Hartmann for the DTA and TG measurements, Kevin Kretschmer for the assistance with the syntheses, Dennis Köhler for the FTIR measurements, and Pavel Škácha for some of the microphotographs of the studied minerals. We are thankful to Magdalena Dumańska-Słowik and Justyna Ciesielczuk for providing their analytical results for this work.
This work was financially supported by the Deutsche Forschungsgemeinschaft (grant no. MA 3927/42-1), by the Grantová Agentura České Republiky (grant no. 17-09161S), by the Ministry of Culture of the Czech Republic (long-term project DKRVO 2019-2023/1.II.e; National Museum, 00023272) for Jiří Sejkora, and by the Slovak Research and Development Agency (APVV-22-0041) for Martin Števko.
This paper was edited by Elena Belluso and reviewed by Bartosz Puzio and Marco Ernesto Ciriotti.
Antao, S. M. and Dhaliwal, I.: Growth oscillatory zoning in erythrite, ideally Co3(AsO4)2⋅ 8H2O, Minerals, 7, 136, https://doi.org/10.3390/min7080136, 2017. a, b
Artamonova, E. A. and Kasenov, B. K. Thermochemistry of nickel orthoarsenate octahydrate, Izv. Vyss. Uchebn. Zaved., Tsvetn. Metall., 2, 112–113, 1989. a
Bartl, H.: Water of crystallization and its hydrogen-bonded crosslinking in vivianite Fe3(PO4)2⋅ 8H2O; a neutron diffraction investigation, Fresenius' Z. Anal. Chem., 333, 401–403, 1989. a
Bethke, C. M. and Yeakel, S.: The Geochemist's Workbench® , Release 11: GWB Essentials. Guide. Aqueous Solutions LLC, Champaign, Illinois, 151 pp., 2016. a, b, c, d, e
Boffa-Ballaran, T., Carpenter, M. A., Geiger, C. A., and Koziol, A. M.: Local structural heterogeneity in garnet solid solutions, Phys. Chem. Miner., 26, 554–569, 1999. a
Boyne, J. A. and Williamson, A. G.: Enthalpies of mixing of ethanol and water at 25 ∘C, J. Chem. Eng. Data, 12, 318, 1967. a
Breithaupt, A.: C.A.S. Hoffmanns Handbuch der Mineralogie, Vierter Band, 1. Abtheilung, Freiberg, 203–206, 1817. a
Brooke, H. J. and Miller, W. H.: Elementary introduction to Mineralogy, Gilbert & Rivington, London, 503–504, 1852. a
Buckley, A. M., Bramwell, S. T., and Day, P.: Intercalation reactions of krautite, HMnAsO4⋅ H2O, Am. Mineral., 75, 1140–1146, 1990. a
Capitelli, F., Elaatmani, M., Lalaoui, M. D., Piniella, J. F.: Crystal structure of a vivianite-type mineral: Mg-rich erythrite, (Co2.16Ni0.24Mg0.60)(AsO4)2⋅ 8H2O, Z. Kristallogr., 222, 676–679, 2007. a
Charles-Messance, B., Duc Mauge, C., and Guerin, H.: Sur les arseniates de cobalt, C.R. Acad. Sci., 250, 2216–2217, 1960. a
Charles-Messance, B., Duc Mauge, C., Bastick, M., and Guerin, H.: Sur le systeme As2O5-NiO-H2O, Bulletin Societe Chimique, 2, 35–38, 1964. a
Charykova, M. V., Krivovichev, V. G., Yakovenko, O. S., and Depmeier, W.: Thermodynamics of arsenates, selenites and sulphates in the oxidizing zone of sulfide ore deposits. III. Eh-pH diagrams of the Me-As-H2O systems (Me = Co, Ni, Fe, Cu, Zn, Pb) at 25 ∘C, Zapiski RMO, 139, 1–14, 2010 (in Russian). a, b, c
Charykova, M. V., Krivovichev, V. G., Yakovenko, O. S., Semenova, V. V., Semenov, K. N., and Depmeier, W.: Thermodynamics of arsenates, selenites, and sulfates in the oxidation zone of sulfide ores: Part VII. Solubility of synthetic analogs of erythrite and annabergite at 25 ∘C, Geol. Ore Deposit., 55, 525–531, 2013. a, b, c, d, e, f, g, h
Chukhlantsev, V. G.: The solubility products of a number of arsenates, J. Anal. Chem.-USSR, 11, 565–571, 1956. a, b, c, d, e, f, g, h
Ciesielczuk, J., Janeczek, J., and Szełęg, E.: Erythrite-köttigite extended solid solution, IMA conference volume of abstracts, August 2018, Melbourne, p. 189, 2018. a, b
Dana, J. D.: A System of Mineralogy, comprising the most recent discoveries, New York and London, 3rd edn., 478 pp., 1850. a
Deiss, E.: Ueber Herstellung und Eigenschaften der Manganoarsenatgallerte, Kolloid-Z., 14, 139–146, 1914. a
DeKock, C. W.: Thermodynamic properties of selected transition metal sulfates and their hydrates, U.S. Bureau of Mines Information Circular, 8910, 50 pp., 1982. a, b
DeKock, C. W.: Thermodynamic properties of selected metal sulfates and their hydrates. U.S. Bureau of Mines Information Circular, 9081, 59 pp., 1986. a
Dormann, J.-L., Gaspérin, M., and Poullen, J.-F.: Étude structurale de la séquence d'oxydation de la vivianite Fe3(PO4)2⋅ 8H2O, B. Minéral., 105, 147–160, 1982. a
Drahota, P. and Filippi, M.: Secondary arsenic minerals in the environment: a review, Environ. Int., 35, 1243–1255, 2009. a
Dumańska-Słowik, M., Pieczka, A., Natkaniec-Nowak, L., Kunecki, P., Gaweł, A., Heflik, W., Smoliński, W., and Kozub-Budzyń, G.: Mg-enriched erythrite from Bou Azzer, Anti-Atlas Mountains, Morocco: geochemical and spectroscopic characteristics, Mineral. Petrol., 112, 381–392, 2018. a, b
Essington, M. E.: Estimation of the standard free energy of formation of metal arsenates, selenates and selenites, Soil Sci. Soc. Am. J., 52, 1574–1579, 1988. a
Fejdi, P., Poullen, J.-F., and Gaspérin, M.: Affinement de la structure de la vivianite Fe3(PO4)2⋅ 8H2O, B. Minéral., 103, 135–138, 1980. a
Fels, J., Berger, P., Reichmann, T. L., Seifert, H. J., and Flandorfer, H.: Calorimetric studies of mixing enthalpy in the liquid system Ga-Li, and Ga-Li-Sn, J. Mol. Liq., 295, 111578, https://doi.org/10.1016/j.molliq.2019.111578, 2019. a
Finch, L. S.: Cupric oxide jellies, J. Phys. Chem., 18, 26–33, 1914. a
Gamsjäger, H., Bugajski, J., Lemire, R. J., Gajda, T., and Preis, W.: Chemical Thermodynamics of Nickel, Nuclear Energy Agency of OECD, 645 pp., 2005. a, b, c
Giuseppetti, G. and Tadini, C.: The crystal structure of cabrerite, (Ni,Mg)3(AsO4)2⋅ 8H2O, a variety of annabergite, B. Minéral., 105, 333–337, 1982. a, b
Glynn, P.: Solid solution solubilities and thermodynamics: Sulfates, carbonates and halides, Rev. Mineral. Geochem., 40, 481–511, 2000. a, b
Grevel, K.-D. and Majzlan, J.: Thermodynamics of divalent metal sulfates, Chem. Geol., 286, 301–306, 2011. a, b, c
Henry, M., Bonhomme, C., and Livage, J.: Synthesis and characterisation of copper(II) hydroxide gels, J. Sol-Gel Sci. Techn., 6, 155–167, 1996. a
Jambor, J. L. and Dutrizac, J. E.: Solid solutions in the annabergite-erythrite-hörnesite synthetic system, Can. Mineral., 33, 1063–1071, 1995. a, b, c, d, e, f, g, h
Johnston, R. B. and Singer, P. C.: Solubility of symplesite (ferrous arsenate): implications for reduced groundwaters and other geochemical environments, Soil Sci. Soc. Am. J., 71, 101–107, 2007. a, b, c, d, e, f, g, h, i
Kampf, A., Plášil, J., Nash, B., Ciriotti, M., Castellaro, F., and Chiappino, L.: Monteneroite, CuMn2(AsO4)2⋅ 8H2O, a new vivianite-structure mineral with ordered cations from the Monte Nero mine, Liguria, Italy, Mineral. Mag., 84, 881–887, 2020. a, b
Karpenko, V., Pautov, L., Siidra, O., Mirakov, M., Zaitsev, A., Plechov, P., and Makhmadsharif, S.: Ermakovite (NH4)(As2O3)2Br, a new exhalative arsenite bromide mineral from the Fan-Yagnob coal deposit, Tajikistan, Mineral. Mag., 87, 69–78, 2023. a
Keller, P.: Darstellung und Eigenschaften von Co2[OH|AsO4], Neues Jb. Miner. Monat., 560–564, 1971. a
Kersten, C.: Ueber die chemische Zusammensetzung der Producte der freiwilligen Zersetzung der Kobalt- und Nickelerze, Poggendorfs Annalen der Physik und Chemie, 136, 251–271, 1843. a
Khoe, G. H., Huang, J. C. Y., and Robins R. G.: Precipitation chemistry of the aqueous ferrous arsenate system, in: EPD Congress '91, edited by: Faskell, D. R., TMS, Warrendale PA, 103–105, 1991. a, b
Koritnig, S. and Süsse, P.: Gitterkonstanten und Raumgruppe des Hörnesit, Mg3(AsO4)2⋅ 8H2O, Neues Jb. Mineral. Monat., 349–351, 1966. a
Kumok, V. N., Kuleshova, O. M., and Karabin, L. A.: Solubility products, Nauka, Novosibirsk, 1983. a
Langmuir, D., Mahoney, J., MacDonald, A., and Rowson, J.: Predicting arsenic concentrations in the porewaters of buried uranium mill tailings, Geochim. Cosmochim. Ac., 63, 3379–3394, 1999. a, b, c, d, e, f
Lecca, G. C., Ambu, S., Marengo, A., Bittarello, E., Brizio, P., and Ciriotti M. E.: Nuovi ritrovamenti alla miniera San Pietro, Monte Tamara, Nuxis, Sardegna Sud-Occidentale, Micro, 20, 146–176, 2022. a
Lee, J. S. and Nriagu, J. O.: Stability constants for metal arsenates, Environ. Chem., 4, 123–133, 2007. a, b, c, d
Lemire, R. J., Palmer, D. A., Schlenz, H., and Taylor, P.: Chemical Thermodynamics of Iron, Part 2. Nuclear Energy Agency of OECD, 921 pp., 2019. a
Lide, D. R. (Ed.): Handbook of chemistry and physics, 85th Edn., CRC Press, Boca Raton, 2005. a, b, c, d, e
Lippmann, F.: Phase diagrams depicting aqueous solubility of binary mineral systems, Neues Jb. Miner. Abh., 139, 1–25, 1980. a
Magalhães, M. C. F., de Jesus, J. D. P., and Williams, P. A.: The chemistry of formation of some secondary arsenate minerals of Cu(II), Zn(II) and Pb(II), Mineral. Mag., 52, 679–690, 1988. a, b, c
Majzlan, J.: Solution calorimetry on minerals related to acid mine drainage – methodology, checks, and balances, Acta Geologica Slovaca, 9, 171–183, 2017. a, b, c
Majzlan, J.: Processes of metastable-mineral formation in oxidation zones and mine wastes, Mineral. Mag., 84, 367–375, 2020. a
Majzlan, J., Zittlau, A., Grevel, K.-D., Schliesser, J., Woodfield, B. F., Dachs, E., Števko, M., Plášil, J., and Milovská, S.: Thermodynamic properties and phase equilibria of the secondary copper minerals libethenite, olivenite, pseudomalachite, kröhnkite, cyanochroite, and devilline, Can. Mineral., 53, 937–960, 2015. a
Majzlan, J., Plášil, J., Dachs, E., Benisek, A., Mangold, S., Škoda, R., and Abrosimova, N.: Prediction and observation of formation of Ca-Mg arsenates in acidic and alkaline fluids: Thermodynamic properties and mineral assemblages in Jáchymov, Czech Republic and Rotgülden, Austria, Chem. Geol., 559, 119922, https://doi.org/10.1016/j.chemgeo.2020.119922, 2020. a, b, c
Majzlan, J., Plumhoff, A., Števko, M., Steciuk, G., Plášil, J., Dachs, E., and Benisek, A.: Thermodynamic and structural variations along the olivenite–libethenite solid solution, Eur. J. Mineral., 35, 157–169, https://doi.org/10.5194/ejm-35-157-2023, 2023. a
Makhmetov, M. Z. and Gorokhova, L. G.: Thermal stability and solubility of arsenates, Nauka, Alma Ata, 1988. a
Marini, L. and Accornero, M.: Prediction of the thermodynamic properties of metal-arsenate and metal-arsenite aqueous complexes to high temperatures and pressures and some geological consequences, Environ. Geol., 52, 1343–1363, 2007. a
Martens, W. N., Kloprogge, J. T., Frost, R. L., and Rintoul, L.: Site occupancy of Co and Ni in erythrite-annabergite solid solutions deduced by vibrational spectroscopy, Can. Mineral., 43, 1065–1075, 2005. a, b, c, d, e, f, g, h, i, j, k, l, m, n, o
Mohs, F.: Grundriß der Mineralogie. Zweiter Theil, Physiographie, Dresden, 208–212, 1824. a
Mori, H. and Ito, T.: The structure of vivianite and symplesite, Acta Crystallogr., 3, 1–6, 1950. a
Nishimura, T., Itoh, C. T., and Tozawa, K.: Stabilities and solubilities of metal arsenites and arsenates in water and the effect of sulfate and carbonate ions on their solubilities, Arsenic metallurgy fundamental and applications, edited by: Reddy, R. G., Hendrix, J. L., and Queneau, P. B., Metallurgical Society of AIME, 77–92, 1988. a, b, c
Nordstrom, D. K.: Aqueous pyrite oxidation and the consequent formation of secondary iron minerals, in: Acid Sulfate Weathering, edited by: Kittrick, J. A., Fanning, D. S., and Hosner, L. R., Soil Science Society of America, Madison, Wisconsin, 37–56, 1982. a
Omarova, F. M. and Sharipov, M. S.: Determination of the standard heat of formation of nickel orthoarsenate octahydrate, VINITI, Report 5859-80, 1980. a
Parkhurst, D. L. and Appelo, C. A. J.: User's guide to PHREEQC (Version 2): a computer program for speciation, batch-reaction, one-dimensional transport, and inverse geochemical calculations, Water-Research Investigation Report 99, 312 pp., https://pubs.usgs.gov/publication/wri994259 (last access: 3 January 2024), 1999. a
Pekov, I., Koshlyakova, N., Belakovskiy, D., Vigasina, M., Zubkova, N., Agakhanov, A., Britvin, S. N., Sidorov, E. G., and Pushcharovsky, D.: New arsenate minerals from the Arsenatnaya fumarole, Tolbachik volcano, Kamchatka, Russia. XVIII. Khrenovite, Na3Fe(AsO4)3, the member with the highest sodium in the alluaudite supergroup, Mineral. Mag., 86, 897–902, 2022. a
Petříček, V., Dušek, M., and Palatinus, L.: Crystallographic Computing System Jana 2006: general features, Z. Kristallogr., 229, 345–352, 2014. a
Plášil, J., Škácha, P., Sejkora, J., Škoda, R., Novák, M., Veselovský, F., and Hloušek, J.: Babánekite, Cu3(AsO4)2⋅ 8H2O, from Jáchymov, Czech Republic – a new member of the vivianite group, J. Geosci., 62, 261–270, 2017. a, b, c, d, e
Raposo, J. C., Zuloaga, O., Olazabal, M. A., and Madariaga, J. M.: Study of the precipitation equilibria of arsenate anion with calcium and magnesium in sodium perchlorate at 25 ∘C, Appl. Geochem., 19, 855–862, 2004. a, b
Robie, R. A. and Hemingway, B. S.: Thermodynamic properties of minerals and related substances at 298.15 K and 1 bar (105 pascals) and at higher temperatures, US Geological Survey Bulletin, 2131, 461 pp., https://pubs.usgs.gov/publication/b2131 (last access: 3 January 2024), 1995. a, b, c
Rojo, J. M., Mesa, J. L., Pizarro, J. L., Lezama, L., Arriortua, M. I., and Rojo, T.: Spectroscopic and magnetic study of the (Mg,M)3(AsO4)2⋅ 8H2O (M = Ni2+, Co2+) arsenates, Mater. Res. Bull., 31, 925–934, 1996. a, b
Romé de l'Isle, J. B. L.: Essai de Cristallographie, ou description des figures géométriques, Propres à differens Corps du Regne Minéral, connus vulgairement sous le nom de Cristaux, Paris, chez Didot jeune, Knapen & Delaguette, 336 pp., 1773. a
Sachs, A.: Die Kristallform der Nickelblüte, Centralblatt für Mineralogie, Geologie und Paläontologie, 198–200, 1906. a
Sadiq, M.: Arsenic chemistry in soils: An overview of thermodynamic predictions and field observations, Water Air Soil Poll., 93, 117–136, 1997. a, b
Salje, E. K. H., Carpenter, M. A., Malcherek, T., and Boffa Ballaran, T.: Autocorrelation analysis of infrared spectra from minerals, Eur. J. Mineral., 12, 503–519, https://doi.org/10.1127/0935-1221/2000/0012-0503, 2000. a, b, c, d
Sejkora, J., Bureš, B., and Hykš, J.: An occurrence of Mn-rich köttigite at the area of Marie and Geyer veins, Svornost, Jáchymov (Czech Republic), Bulletin Mineralogie Petrologie, 22, 233–239, 2014. a, b
Sejkora, J., Pauliš, P., Gramblička, R., Malíková, R., Pour, O., Dolníček, Z., Ulmanová, J., and Vrtiška, L.: The recently found Bi-Co-Ni-As-U-V mineralization of the Přísečnice ore district, Krušné hory Mountains (Czech Republic), Bulletin Mineralogie Petrologie, 27, 1–37, 2019. a
Siuda, R. and Macioch, A.: Secondary arsenic minerals from the Złoty Stok As-Au abandoned mine (SW Poland), Geol. Q., 62, 925–940, 2018. a, b, c
Southwood, M., Števko, M., and Carr, P.: Tsumeb: Zincolivenite and the adamite-olivenite series, Rocks & Minerals, 95, 210–232, 2020. a
Sturman, B. D.: New data for köttigite and parasymplesite, Can. Mineral., 14, 437–441, 1976. a, b
Tommaseo, C. E. and Kersten, M.: Aqueous solubility diagrams for cementitious waste stabilization systems. 3. Mechanism of zinc immobilization by calcium silicate hydrate, Environ. Sci. Technol., 36, 2919–2925, 2002. a
Ulbrich, H. H. and Waldbaum, D. R.: Structural and other contributions to the third-law entropies of silicates, Geochim. Cosmochim. Ac., 40, 1–24, 1976. a
Vrtiška, L., Pauliš, P., Gramblička, R., Sejkora, J., Malíková, R., and Pour, O.: Supergene mineralization of the Michalovy Hory ore district (Czech Republic), Bulletin Mineralogie Petrologie, 25, 228–244, 2017 (in Czech). a
Wang, W. X., Shao, Y., Hou, H. B., and Zhou, M.: Synthesis and thermodynamic properties of arsenate and sulfate-arsenate ettringite structure phases, PLOS ONE, 12, e0182160, https://doi.org/10.1371/journal.pone.0182160, 2017. a
Wei, C., Zhu, Y., Zhang, X., Wang, X., and Liu, J.: Dissolution and solubility of the erythrite/annabergite solid solution [(CoxNi1−x)3(AsO4)2⋅ 8H2O] at 25 ∘C, Asian J. Chem., 25, 7687–7696, 2013. a, b, c, d, e, f, g, h, i, j, k, l
Wildner, M., Giester, G., Lengauer, C. L., and McCammon, C. A.: Structure and crystal chemistry of vivianite-type compounds: Crystal structures of erythrite and annabergite with a Mössbauer study of erythrite, Eur. J. Mineral., 8, 187–192, 1996. a, b, c
Yakhontova, L. K., Grudev, A. P., and Petrova, A. A.: Composition and nomenclature in the erythrine-annabergite series, Int. Geol. Rev., 23, 1291–1296, 1981. a
Yakubovich, O. V., Massa, W., Liferovich, R. P., and Mccammon, C. A.: The crystal structure of barićite, (Mg1.70Fe1.30)(PO4)2⋅ 8H2O, the magnesium-dominant member of the vivianite group, Can. Mineral., 39, 1317–1324, 2001. a, b
Yoshiasa, A., Miyano, Y., Isobe, H., Sugiyama, K., Arima, H., Nakatsuka, A., Momma, K., and Miyawaki, R.: Structural refinement of köttigite-parasymplesite solid solution: Unique cation site occupancy and chemical bonding with water molecules, J. Miner. Petrol. Sci., 111, 363–369, 2016. a
Yuan, T. C., Jia, Y. F., and Demopoulos, G. P.: Synthesis and solubility of crystalline annabergite (Ni3(AsO4)2⋅ 8H2O), Can. Metall. Quart., 44, 449–456, 2005. a
Zhu, Y. N., Zhang, X. H., Chen, Y. D., Zeng, H. H., Liu, J., Liu, H. L., and Wang, M.: Characterisation, dissolution and solubility of synthetic erythrite [Co3(AsO4)2⋅ 8H2O] and annabergite [Ni3(AsO4)2⋅ 8H2O] at 25 ∘C, Can. Metall. Quart., 52, 7–17, 2013. a, b, c, d, e, f, g
Zhu, Y. N., Huang, B., Zhu, Z. Q., Liu, H. L., Huang, Y. H., Zhao, X., and Liang, M. N.: Characterization, dissolution and solubility of the hydroxypyromorphite-hydroxyapatite solid solution [(PbxCa1−x)5(PO4)3OH] at 25 ∘C and pH 2–9, Geochem. T., 17, 2, https://doi.org/10.1186/s12932-016-0034-8, 2016. a