the Creative Commons Attribution 4.0 License.
the Creative Commons Attribution 4.0 License.
 | 06 Feb 2024
The effect of oxygen fugacity on the evaporation of boron from aluminoborosilicate melt
Stamatis Flemetakis
Christian J. Renggli
Paul Pangritz
Jasper Berndt
Stephan Klemme
We present the results of B2O3 evaporation experiments from Ca- and Mg-bearing aluminoborosilicate melts. Our experiments were conducted at 1245 to 1249 ∘C and 1350 to 1361 ∘C for different run times (60–1020 min), and at oxygen fugacities (logfO2) relative to the fayalite–magnetite–quartz (FMQ) buffer of FMQ−6 to FMQ+1.5, and in air. Our results show that with increasing fO2, evaporation of B from the melt increases by a factor of 5 compared to reducing conditions. Using Gibbs free energy minimization calculations, we suggest two possible evaporation reactions for B2O3 which constrain its speciation in the gas phase to be either 3+ or 4+ (B2O3(g) and BO2(g)). The measured B2O3 contents of the B evaporated residual glasses were used to calculate evaporation rate constants (ki) for B2O3 in oxidizing conditions (air, cm min−1 at 1350 ∘C) and reducing conditions (FMQ−4, cm min−1 at 1350 ∘C). The absence of diffusion profiles in the experimental glasses suggests that the evaporation rates are slower than B2O3 diffusion rates and therefore the rate-limiting process. Overall, the rate of B evaporation in air is approximately a factor of 5 higher compared to reducing conditions at FMQ−4.
- Article
(2822 KB) - Full-text XML
-
Supplement
(697 KB) - BibTeX
- EndNote


Boron is an integral component in many industrial glasses because of its enhancing effect on the thermal, mechanical, and optical glass properties. Borosilicate glasses find wide applications in cook- and labware, fiberglass, displays, and optical components because of their high thermal shock resistance and chemical inertness (Hubert and Faber, 2014). The usage of B benefits the glass-making process in several ways, for example by lowering the melting/liquidus temperature and viscosity of the melt or allowing the dissolution of refractory oxides (for a review refer to Huber and Faber, 2014; Smith, 1986; Shelby, 2015). The reduction in the liquidus temperature by the addition of B has also proven useful in petrological experimental studies and enabled the synthesis of large quantities of volatile-bearing glasses at atmospheric pressures (e.g., Pangritz et al., 2022; Renggli et al., 2022).
Boron is considered a network former in both silicate and aluminosilicate glasses (Uhlmann and Kreidl, 1983; Hannon et al., 1988, 1995; Micoulaut et al., 1995; Shivachev et al., 2004). Additionally, B is classified as a volatile species in both the glass-manufacturing industry and cosmochemistry (classified as a volatile lithophile element, with a 50 % condensation temperature (T50) from a solar nebula gas at 10−4 bar, at 635 ∘C, Lodders, 2003, and 467 ∘C, Wood et al., 2019). The most abundant B species in glasses and melts are 3-fold-coordinated and 4-fold-coordinated by O2−. In borosilicate glasses, speciation of B changes mostly as a function of the composition (e.g., SiO2 and alkali element content; Hubert and Faber, 2014; Lenoir et al., 2008; van Limpt, 2007, 2011, and references therein), and it controls the molecular structure of the glass/melt and the interconnectivity of B2O3 and SiO2 networks. The arrangement of this network will in turn govern the extent of B degassing from the melt. But fO2 is known to affect the speciation of elements in melts, which raises the following questions: to what degree is B lost to a gas phase from a borosilicate melt at high temperatures (such as during glass synthesis), and what is the effect of fO2 on the evaporation process?
Here, we present a novel dataset on the evaporation behavior of B from B-, Ca-, and Mg-bearing aluminosilicate melt at 1245 to 1249 ∘C and 1350 to 1361 ∘C, over 60, 120, 240, and 1020 min, in air and at logfO2 relative to the fayalite–magnetite–quartz (FMQ) buffer, of ΔFMQ = +1.5 (hereafter written as FMQ+1.5), FMQ, FMQ−2, FMQ−4, and FMQ−6.
2.1 Starting material
Evaporation experiments were performed using a CaO–MgO–SiO2–Al2O3–B2O3 glass as the starting material. The composition was at the anorthite (CaAl2Si2O8)–diopside (CaMg2Si2O6) eutectic at An36Di64 (in mol %), to which ∼ 10 wt % B2O3 was added. The starting material was prepared using analytical-grade oxides (MgO, SiO2, Al2O3; Sigma-Aldrich GmbH, Germany) and carbonate (CaCO3; Alfa Aesar GmbH, Germany), while B was added as boric acid (H3BO3; abcr GmbH, Germany). To release any adsorbed water or hydroxides, MgO was fired at 1000 ∘C for more than 12 h and subsequently stored at 110 ∘C in a drying cabinet. The starting material mixture was then fired at 1000 ∘C for 3 h to decarbonate the CaCO3 and to convert the H3BO3 to B2O3 (Huber et al., 2020). The resulting mixture was reground under ethanol, vitrified at 1200 ∘C in a Pt–Au crucible for 30 min in air, and quenched in cold water. For the vitrification we used a Linn High Therm VMK1800 (Linn GmbH, Germany) box furnace. A detailed description of the starting material glass synthesis is given in Pangritz et al. (2022).
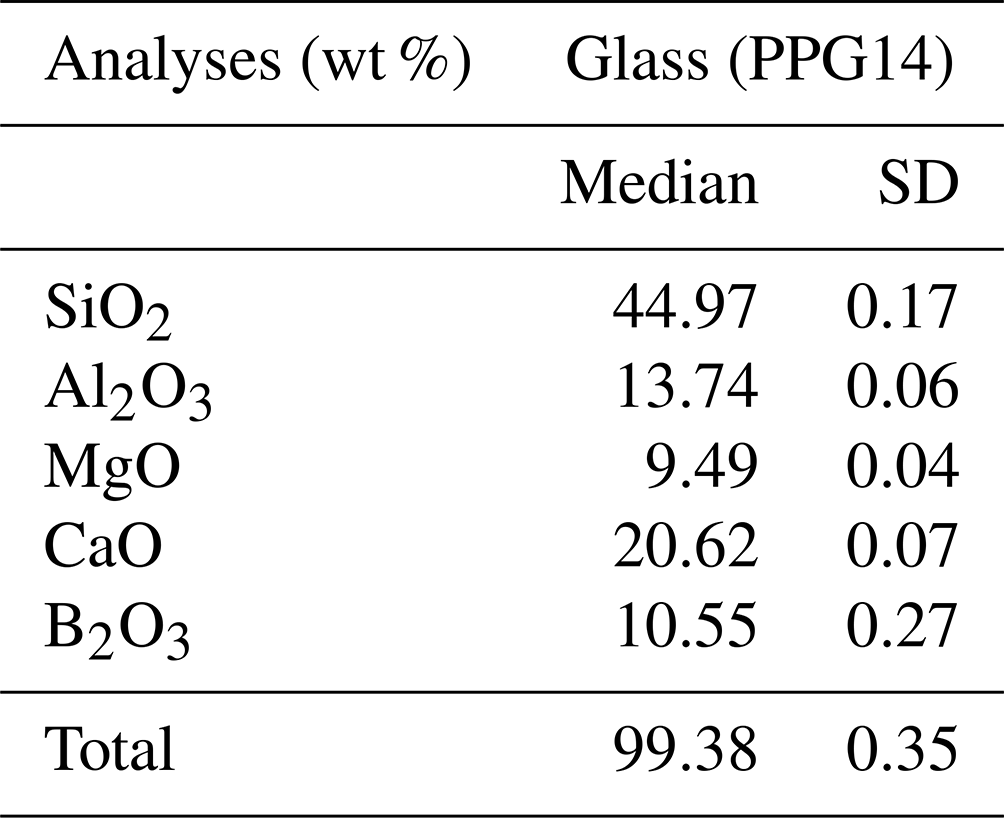
The resulting glass (PPG14) was crushed into shards in an agate mortar and was investigated texturally using a JEOL scanning electron microscope (SEM) (Pangritz et al., 2022). The chemical composition and homogeneity of the glass were confirmed by electron microprobe analysis (EMPA) profile analyses across random shards (Fig. 1). A sum of 20 analyses (n=20) testify to the homogeneity of the starting glass (Supplement, Table S1). We determined an initial B2O3 concentration of 10.55±0.27 wt % (SD). The median composition of the synthesized glass is given in Table 1.
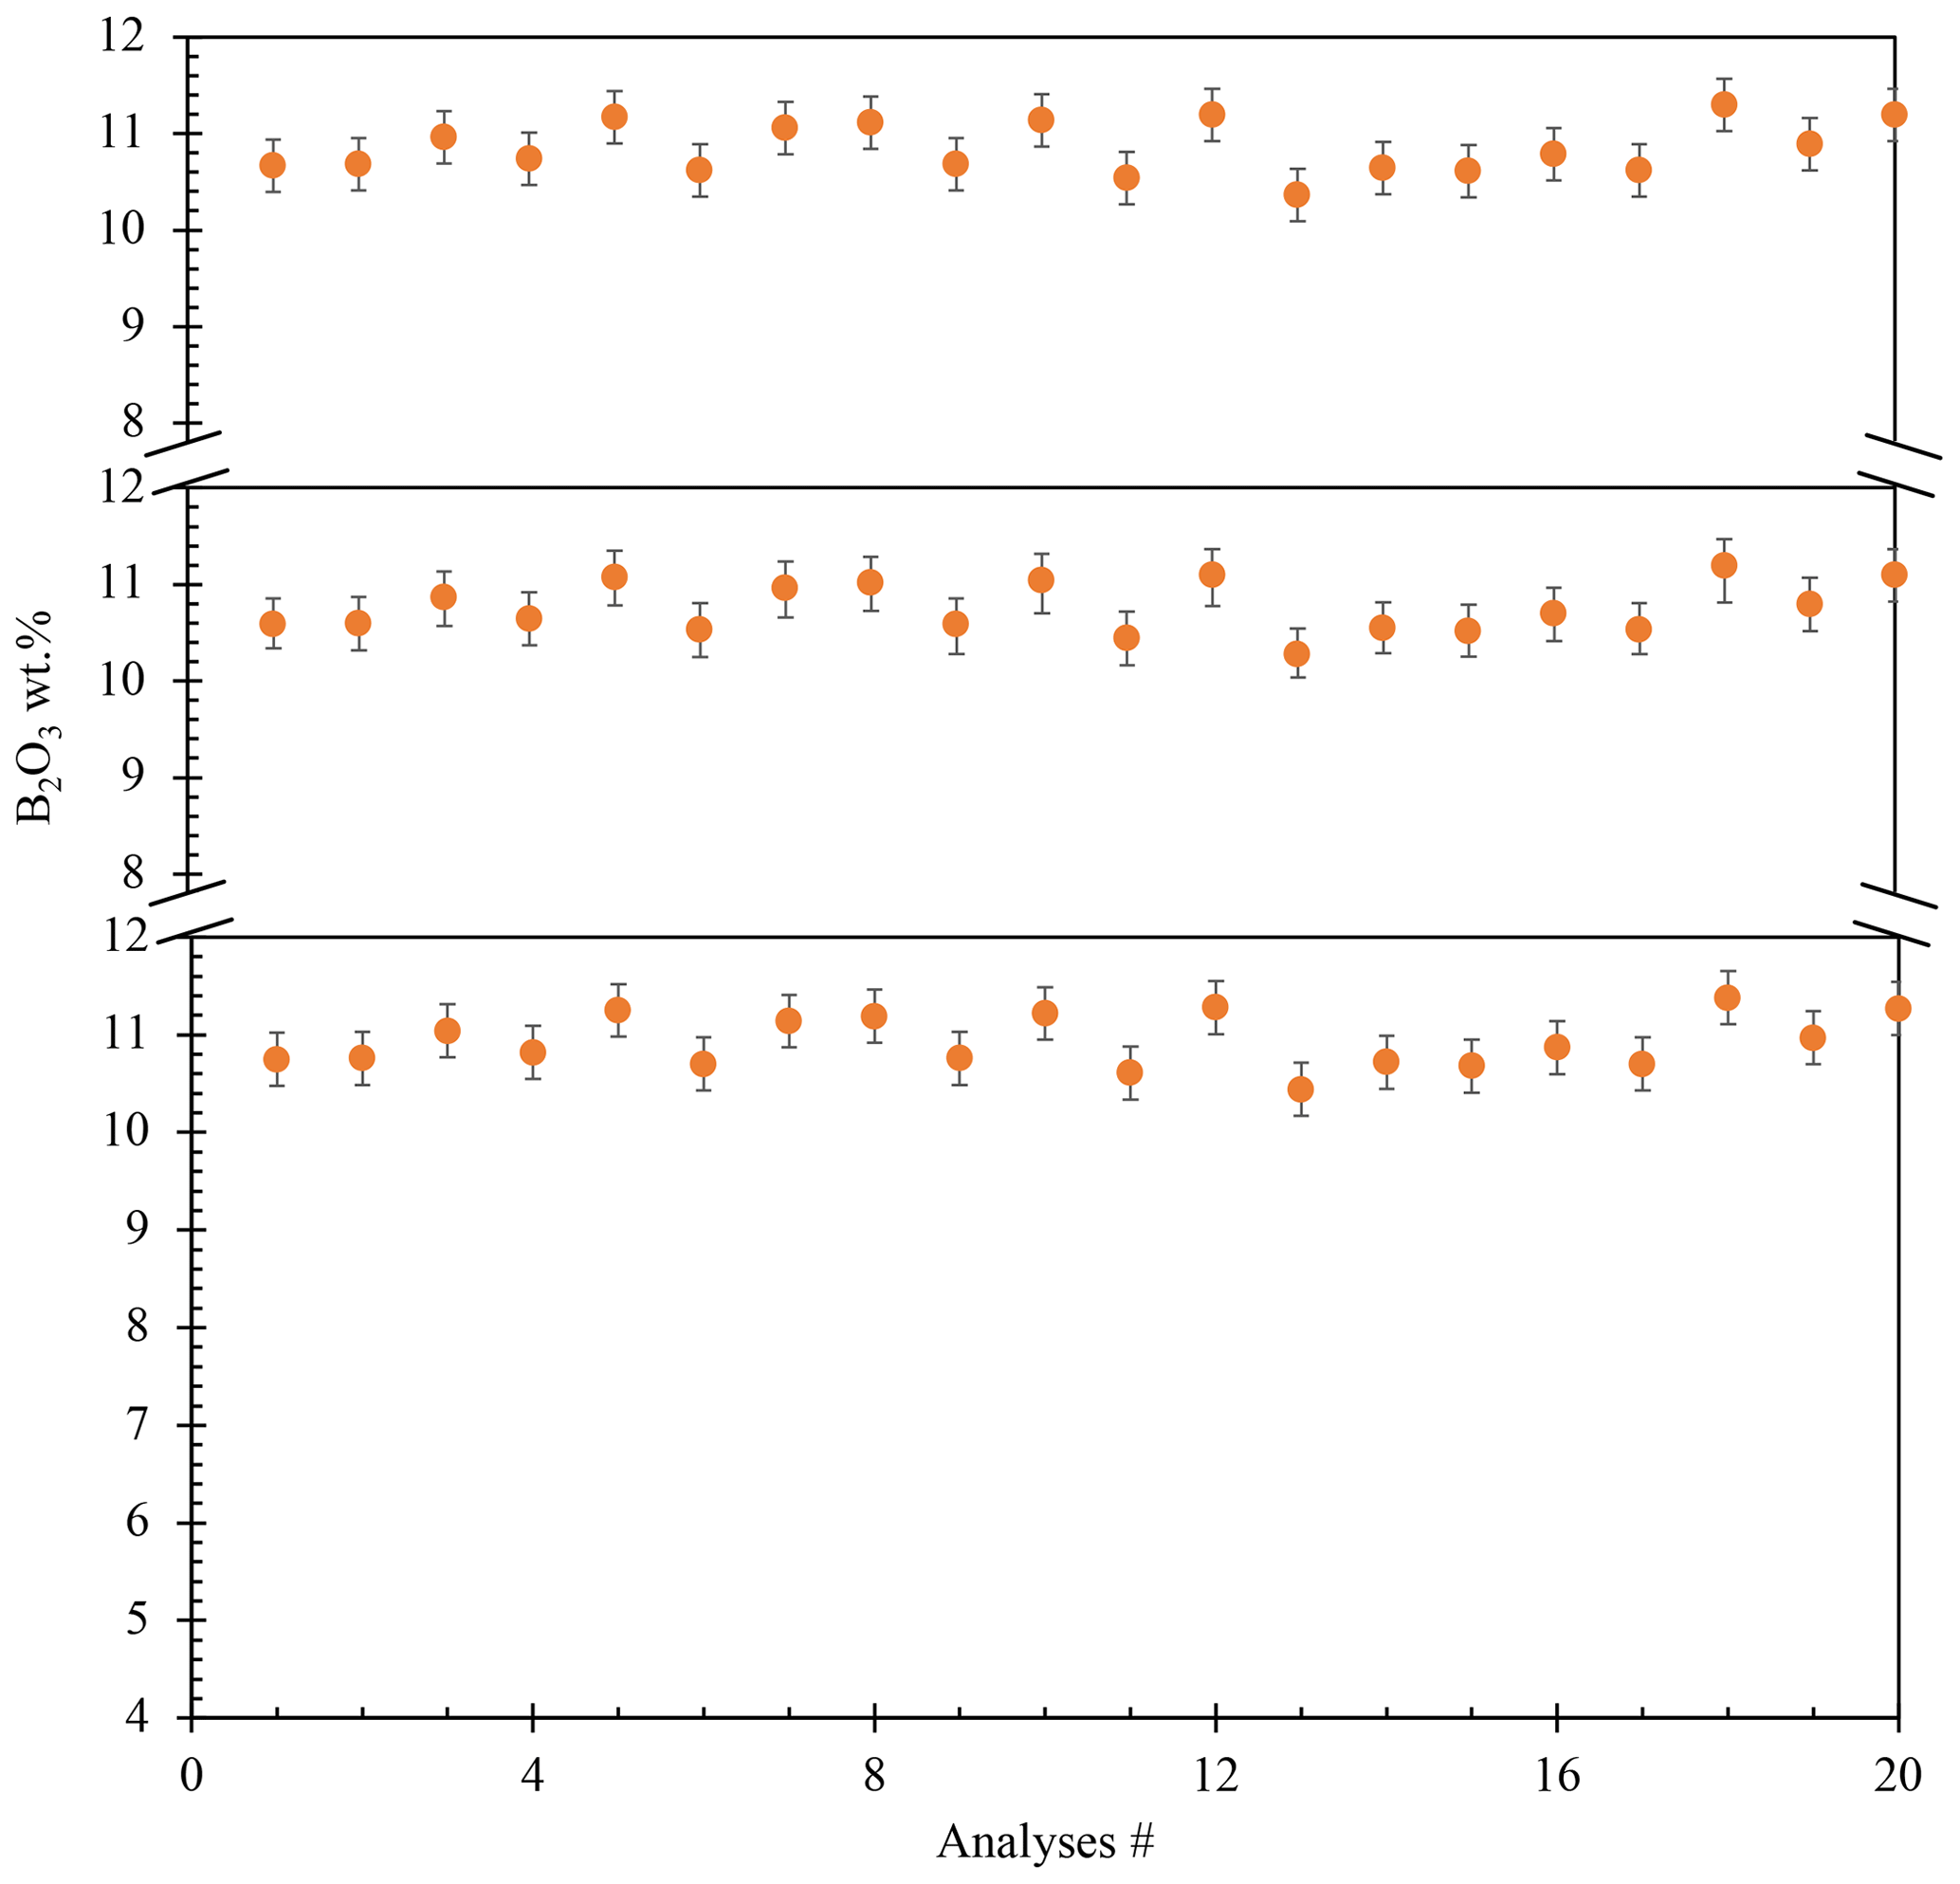
Figure 1Homogeneity of the starting material verified by EPMA profile analyses of different shards. Three profile analyses were made, from center to rim, in three random glass shards. All these profiles show no diffusional zonation (20 analyses).
Table 1Chemical composition of the starting glass measured by EPMA. Errors reported as standard deviation (SD).
2.2 Experimental techniques
Glass shards with diameters of ∼ 2 mm and a mass of ∼ 40 mg were singled out for the experiments. The shards were hooked on Pt-wire loops with a diameter of 0.1 mm. For each experimental condition, the sample was suspended on a Pt chandelier on an alumina rod. The experiments were conducted in a vertical gas-mixing tube furnace (GERO GmbH, Germany), and oxygen fugacity was controlled by mixing CO and CO2 gases using a Tylan mass flow controller with a typical flow of 100 sccm. Temperatures within the furnace were monitored and controlled by a Pt70Rh30–Pt94Rh6 (type B) thermocouple connected to a Eurotherm 2416 (Schneider Electric, Germany) controller. The furnace was pre-heated to the given temperature at least 30 min before the experiments to ensure that it was thermally equilibrated and that temperature variations within the furnace's hot zone were negligible. Gases were introduced at the top of the tube furnace with an outflow at the lower end of the furnace. Oxygen fugacity varied between air and −13.3 logfO2 units relative to the fayalite–magnetite–quartz (FMQ) buffer system (Table 2). The samples were initially placed in the cold zone of the furnace to allow the CO–CO2 gas mixture to equilibrate for ∼ 2 min. The samples were then lowered into the hot zone of the furnace, where they degassed for different time durations (60–1020 min, Table 2). The run time of each experiment was considered from the time of introducing the sample into the hot zone of the furnace. During the experiments, temperature was monitored and controlled by an external type B thermocouple connected to a Eurotherm controller. During the run, temperature variations were less than ± 1 ∘C. Experiments were stopped by turning off the gas flow ∼ 40 s before opening the furnace lid and quenching the sample in a cold-water bath. Each sample was then used for characterization by scanning electron microscopy, EMPA, and LA-ICP-MS (laser ablation inductively coupled mass spectrometry).
Table 2Experimental run conditions and B2O3 concentrations measured in weight percent (wt %).
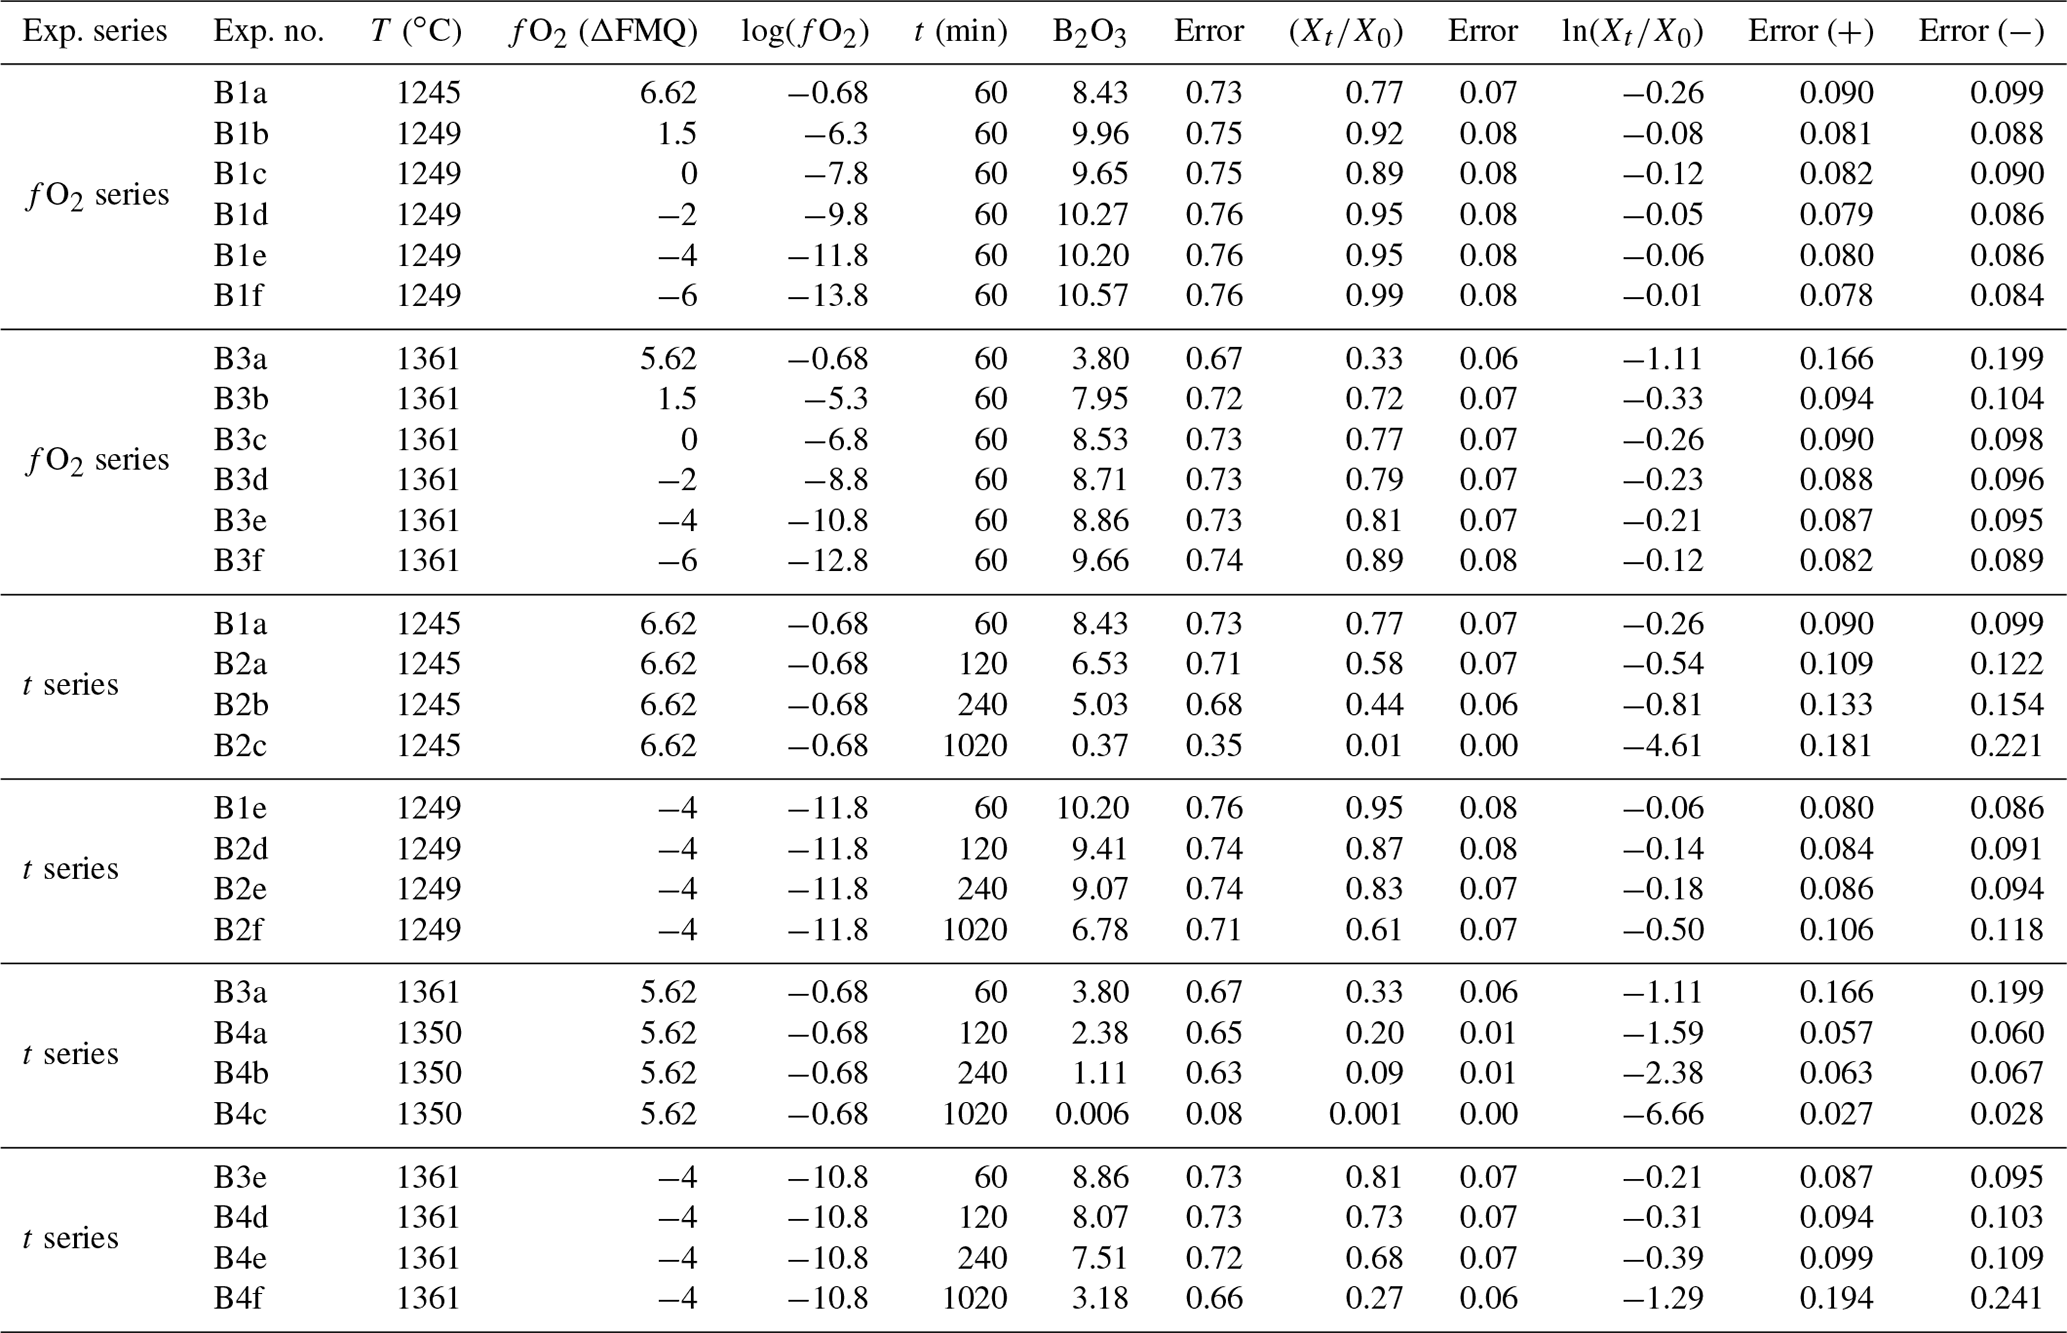
Two types of experimental series have been conducted at 1245 and 1361 ∘C, namely the “fO2 series” and “t series”. The fO2 series were performed at two temperatures – 1245 and 1361 ∘C between air and FMQ−6 (oxidizing to reducing conditions) for both temperatures – and for a constant duration (60 min). There were four time series performed: two in air (oxidizing conditions) at 1245 and 1350 ∘C and two at FMQ−4 (reducing conditions) at 1245 and 1361 ∘C. Each time series was comprised of four run durations: 60, 120, 240, and 1020 min. This approach allows us to examine the effects of both fO2 and time on the evaporation of B. Importantly, these experiments are run in an open system with a constant flow of CO and CO2 gas, allowing efficient evaporative loss of B from the melt.
2.3 Analytical methods
For each experimental run, one sample was characterized in cross-section with a JEOL 6510 LA scanning electron microscope (SEM), and the chemical homogeneity was investigated with a five-spectrometer JEOL JXA-8530F electron microprobe analyzer and laser ablation inductively coupled plasma mass spectrometry (LA-ICP-MS) at the Institut für Mineralogie, Universität Münster. The SEM backscattered electron images were taken at an acceleration voltage of 20 kV and a working distance of 10 mm.
The EMPA measurements were made at an acceleration voltage of 15 kV, a 60 nA beam current, and a 10 µm beam size. Boron was measured for 120 s on the peak and 60 s on the background. Astimex BN was used as a standard for the EMPA measurements. The other elements (Ca, Mg, Si, Al) were measured for 20 s on the peak and 10 s on the background.
For the LA-ICP-MS measurements, the polished samples were ablated in a dual-volume Helex cell (He gas flux of 1 L min−1 in the large cell and 0.33 L min−1 in the small cell). We used a Photon Machines Analyte G2 193 nm ArF excimer laser system at a pulse rate of 10 Hz and a spot size of 50 µm. The ablated material was analyzed in a Thermo Fisher Element 2, measuring 20 s background and 40 s sample counting time. The isotopes measured were 29Si and 11B, where 29Si was used as the internal standard. The primary standards analyzed were NIST610 (350 ± 7 ppm B, Jochum et al., 2005) and NIST612 (34.6 ± 0.78 ppm B; Kusano et al., 2017).
All our experimental run conditions and results are given in Table 2. Boron data were obtained using EMPA and LA-ICP-MS profiles (step size and profile lengths in the Supplement, Table S2) on the cross-sectioned samples of all experiments. Previous studies have reported the relative loss of trace elements as and/or ln(), where Xt is the content of the element in the final glass and X0 the elemental content in the starting material (Sossi et al., 2019; Klemme et al., 2022; Renggli et al., 2022). In our study, the glasses were doped with ∼ 10 wt % B2O3, making it a major element in our starting material; hence true B loss cannot be simply described from as it can for trace elements. To circumvent this problem, we normalized to the concentration of aluminum, which is known not to evaporate over the experimental run conditions, and the loss of B () was calculated using
Before assessing the role of fO2, T, and run time in our experiments, we need to consider whether the changing B contents of the glasses were controlled by the evaporation reaction or by convection from the melt interior to the evaporation surface. To that end, we measured concentration profiles in both the fO2-series and the t-series (Fig. 2) experiments. In all experimental conditions, the investigated samples showed no indication of zoning, and concentrations are constant within error for all the samples.
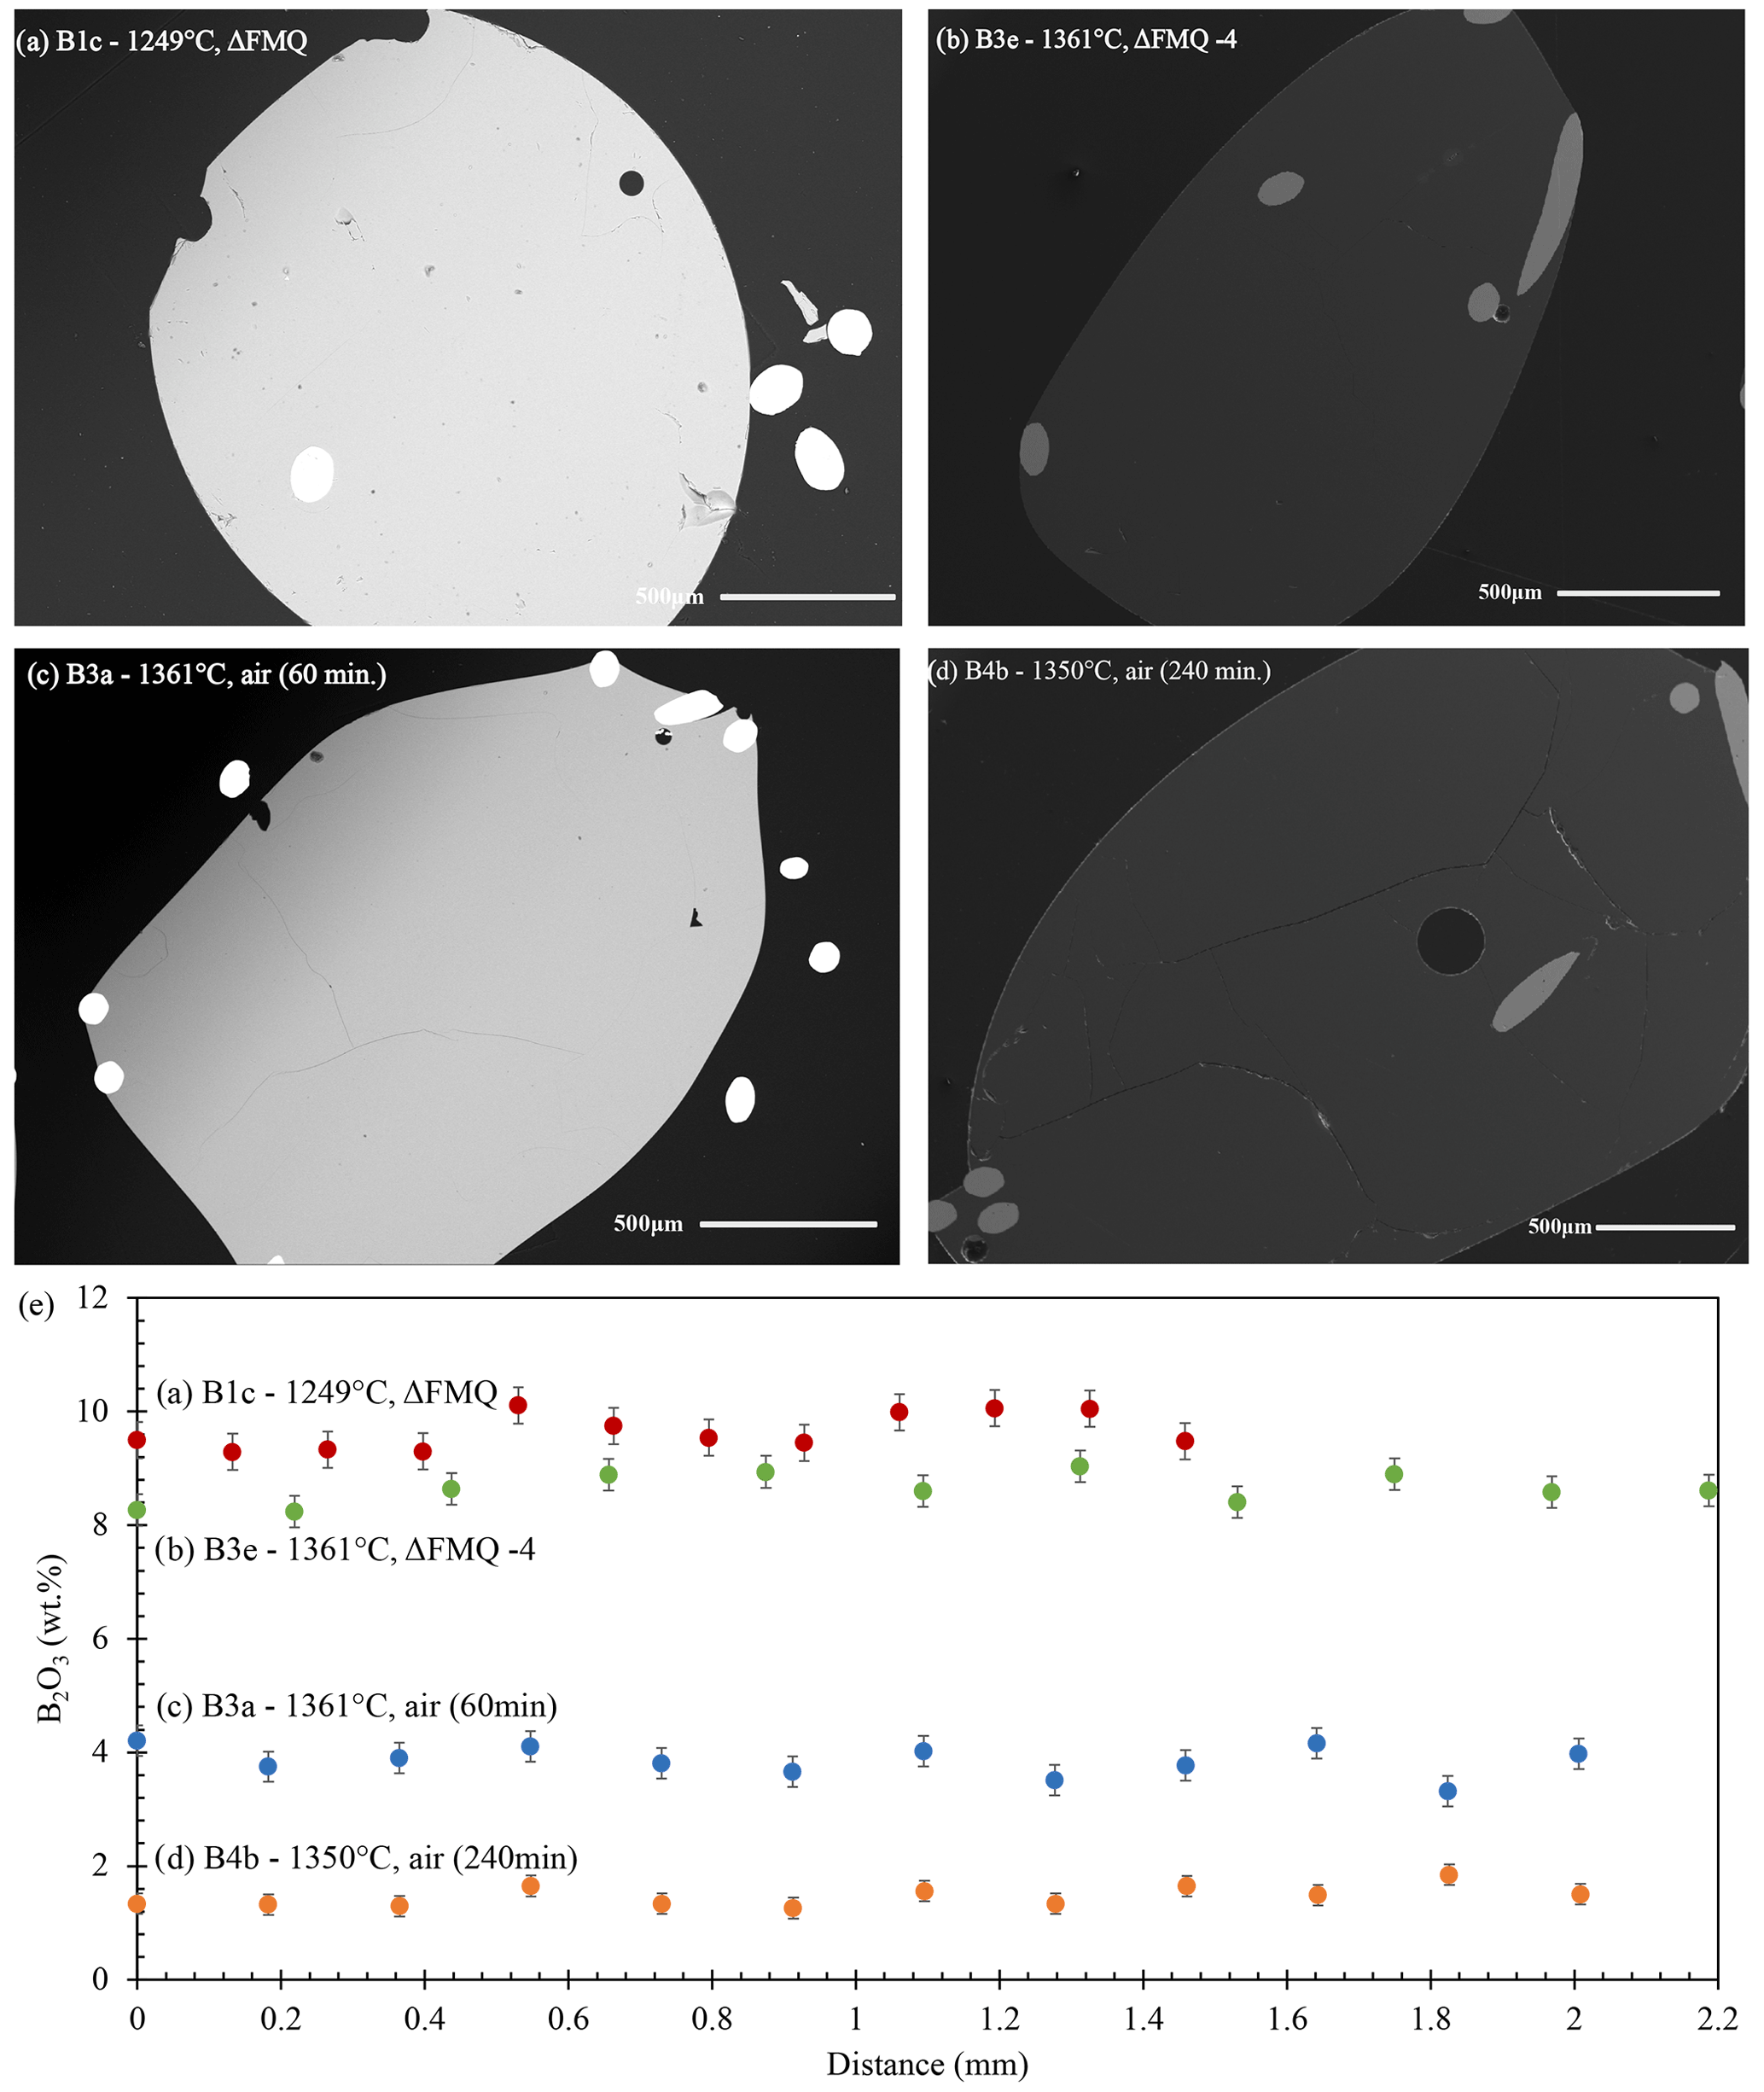
Figure 2Secondary electron (SE) and backscattered electron (BSE) images (a–d) and profile analyses of the fO2-series and t-series experiments. Panels (a) and (b) show SE images of glass shards from the fO2-series experiments at 1249 ∘C in FMQ and 1361 ∘C at FMQ−4, respectively. The time duration of both the experimental runs was 60 min. (c) BSE image and (d) SE image of runs from the t-series experiments in air at 1350 and 1361 ∘C, respectively. The time duration of these experimental runs varied from 60 to 1020 min (here the 60 and 240 min runs). (e) EPMA and LA-ICP-MS measurement profiles from the center of the experimental beads. The profiles show no diffusional zonation from the center to the rim (14 analyses).
The absence of concentration gradients in these types of silicate melt evaporation experiments is conventionally taken as evidence for the lack of diffusion of the evaporating elements to the surface (e.g., Sossi et al., 2019). Here, we additionally consider if melt convection played a role in the experimental beads, leading to the absence of concentration gradients. To that end, we consider the ratio of advection to the rate of diffusion, expressed by the dimensionless Péclet number (Pe). When Pe tends to 0, advection is negligible and diffusion dominates the mass transport, and when Pe →∞ diffusion is negligible and mass transport occurs via advection. Accordingly, when Pe = 1, advection and diffusion equally contribute to mass transport. The detailed determination of the Péclet numbers is given in the Supplement. In summary, our results indicate that diffusion dominates over advection in all the experiments (e.g., Pe ≪ 1, Table 3), and extreme melt flow speeds of more than 0.1 m s−1 would be required for advection to become dominant. Hence, neither diffusion nor advection is a rate-limiting factor of B evaporation at high temperatures (1245–1361 ∘C). Instead, the evaporation reaction at the melt surface is rate limiting.
Table 3Calculated evaporation rate constants, kt, calculated from t-series experiments. Experiment B3a* was performed at 1361 ∘C.
The experimental results in the fO2-series runs are presented in Fig. 3. These experiments show that B degassing increases with increasing fO2 (from FMQ−6 to air) and with increasing temperatures (from 1249 to 1361 ∘C).
At 1249 ∘C and from highly reducing to slightly oxidizing conditions (FMQ−6 to ∼ FMQ+1.5), B is degassed up to ∼ 0.6 wt % (0.02 % to 0.04 % is the relative loss). In the same temperature and oxidizing conditions (in air), B degasses to about ∼ 2 wt % (20 % relative loss), bringing the final B concentration of the sample down to ∼ 8.4 wt %.
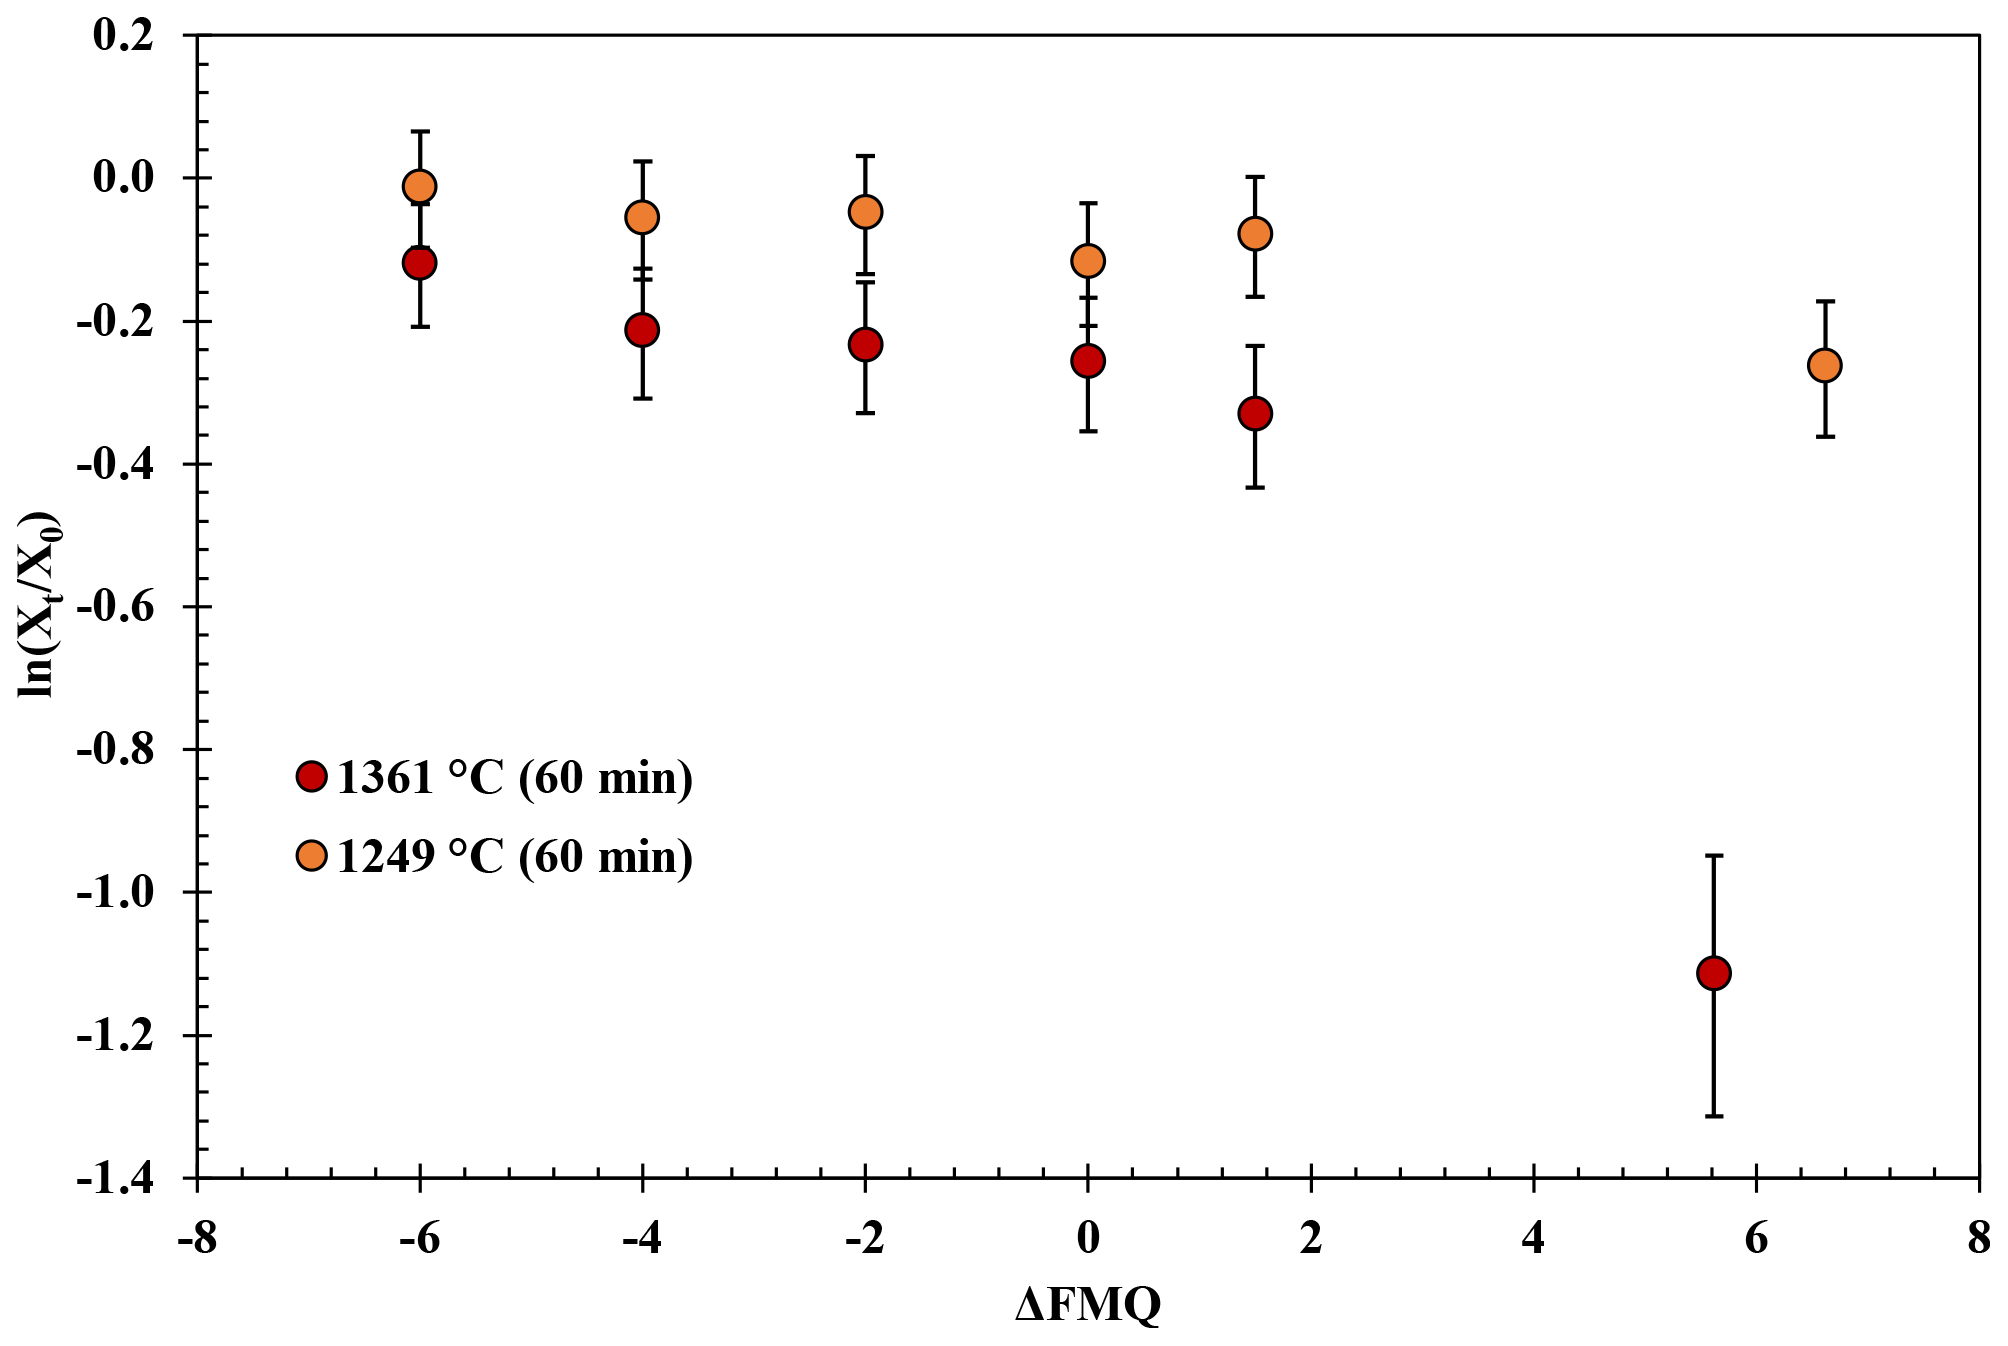
Figure 3Experimental results of the fO2-series runs. The natural logarithm of the final (Xt) versus the initial (Xo) B2O3 concentration of the glasses normalized to the concentration of aluminum (Eq. 1) is plotted against the fO2 (relative to the FMQ buffer) of the runs.
At 1361 ∘C and from FMQ−6 to ∼ FMQ+1.5, around 2.5 wt % of the initial B content is lost (∼ 20 % relative loss) as the samples show a content of ∼ 7.95 wt %. At the same temperature in air, the B loss has increased by almost an order of magnitude, resulting in a loss of around 7 wt %, which accounts for ∼ 65 % of the initial B content, leaving the final glass with ∼ 3.8 wt % B.
The experimental results from the t-series runs (Fig. 4) show that B degassing increases with longer run times (60 to 1020 min), higher temperatures (1245 to 1361 ∘C), and increasing fO2 (from air to FMQ−4). The extent of degassing varies between the different run durations, temperatures, and fO2 conditions.
At 1249 ∘C and in reducing conditions (FMQ−4) and run durations between 60 and 240 min, ∼ 1.5 wt % B is lost due to degassing or ∼ 14 % compared to its initial concentration. In the 1020 min experiment (the same T and fO2 conditions), the amount of degassed B has increased to an absolute value of ∼ 3.5 wt % or ∼ 36 % relative loss. At the same temperature (1245 ∘C) but in oxidizing conditions (i.e., air), B degasses more strongly with an absolute loss of ∼ 2 wt % (20 % relative loss) after 60 min, ∼ 4 wt % (∼ 40 % relative loss) after 120 min, and ∼ 5 wt % (50 % relative loss) after 240 min. The 1020 min run shows an almost complete loss of the initial B content, i.e., from ∼ 10 wt % down to 0.37 wt % (∼ 96 % relative loss).
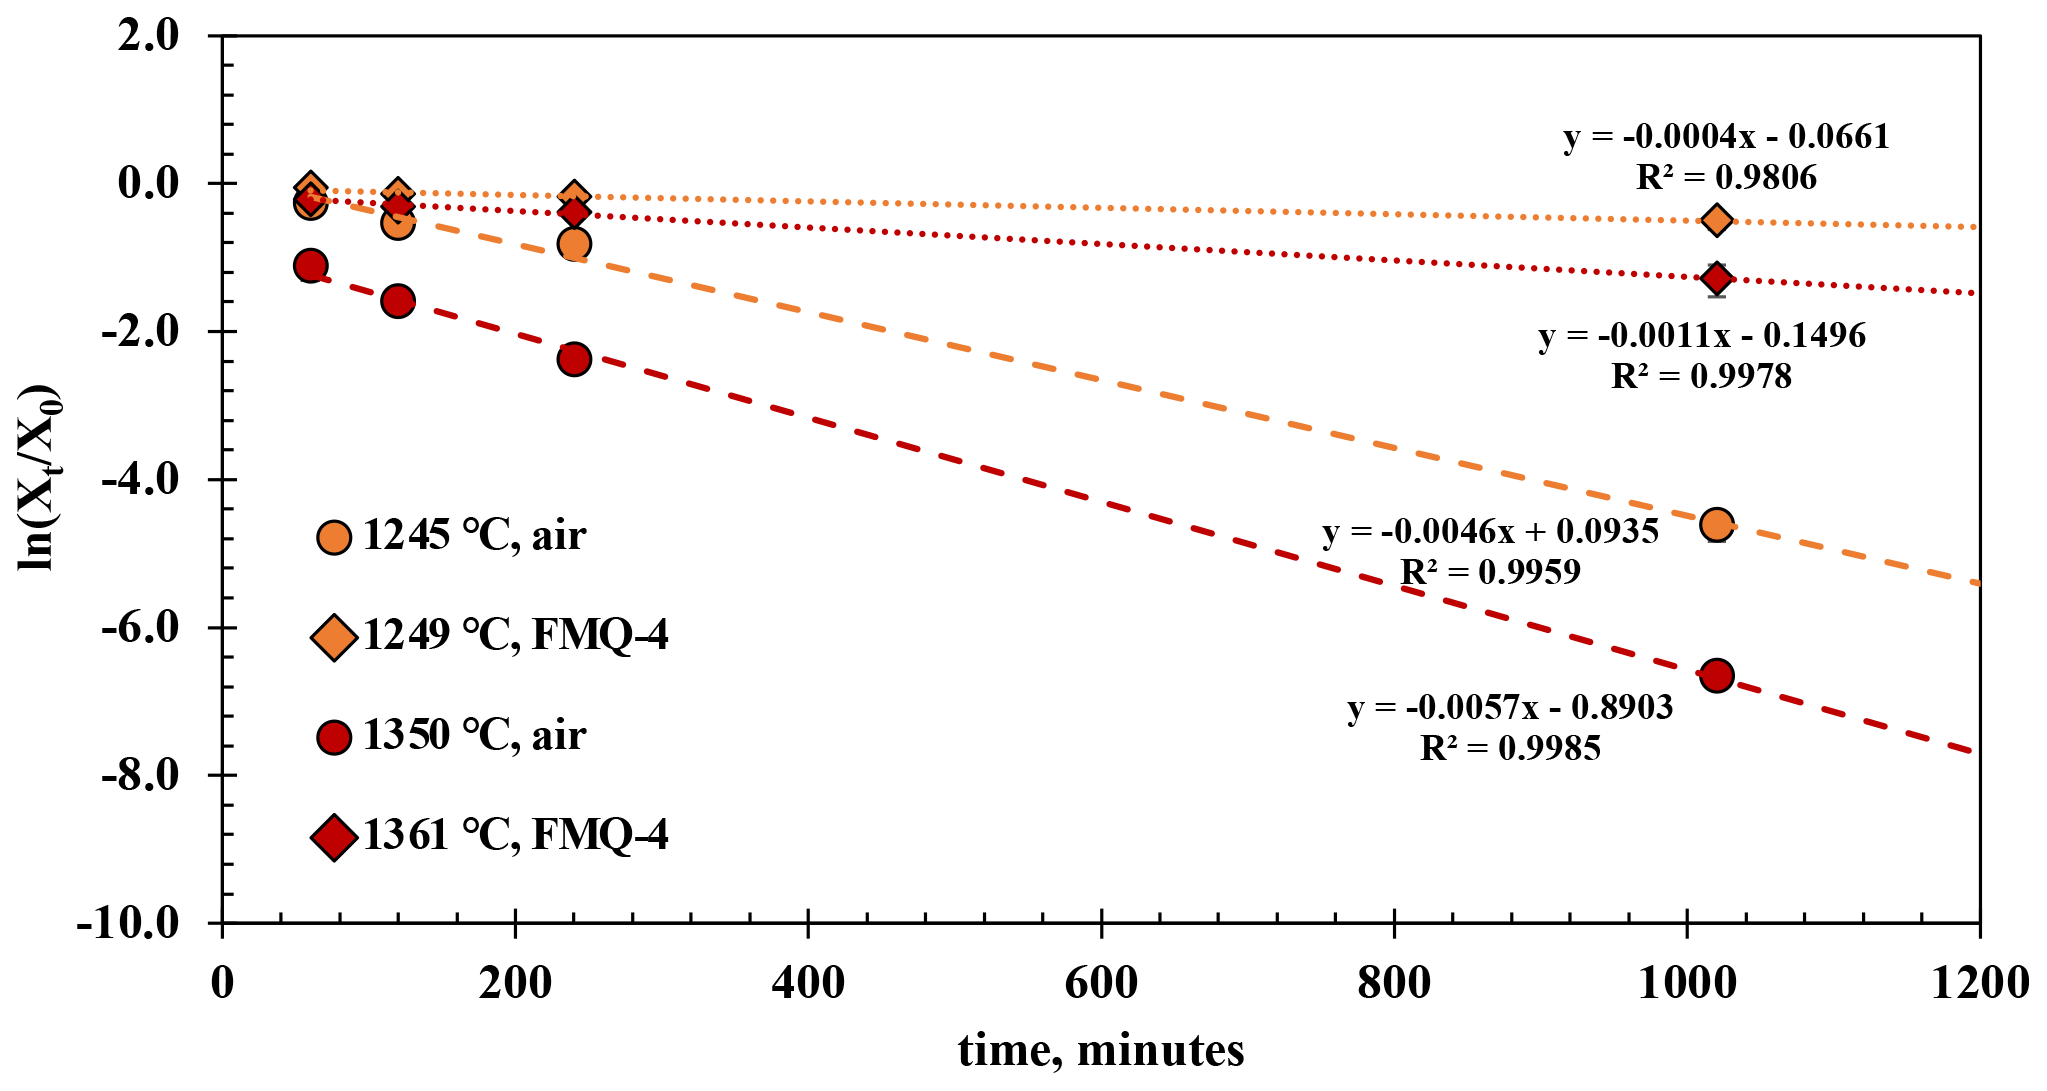
Figure 4The results of the t-series runs. The natural logarithm of the final (Xt) versus the initial (Xo) B2O3 concentration of the glasses normalized to the concentration of aluminum (Eq. 1) is plotted against different run durations. The error bars are only plotted when larger than the symbols.
At 1361 ∘C and in reducing conditions (FMQ−4) and for run durations between 60 and 240 min, the B content of the degassed glass has decreased by ∼ 3 wt %, or 29 % relative loss. In the same conditions in the 1020 min experiment, the sample has lost more than half of its initial B concentration, ∼ 7.4 wt % (∼ 70 % relative loss). At 1350 ∘C in air, B degassing is extensive, resulting in a loss of ∼ 7 wt % (64 % relative loss) in the 60 min run, ∼ 8 wt % in the 120 min run, and ∼ 9 wt % in the 240 min run. In the 1020 min run, B is almost completely lost from the glass, with ∼ 10.55 wt % (∼ 99.9 % relative loss) leaving but only 0.006 wt % B in the final glass.
4.1 Evaporation rate constant
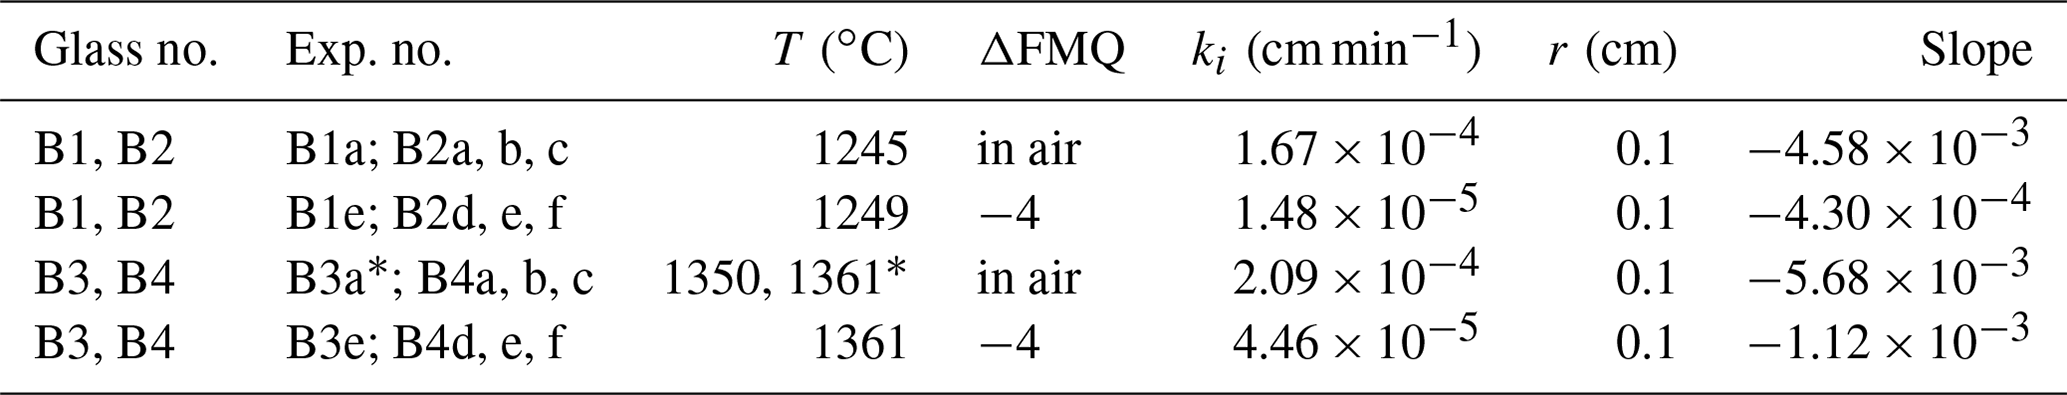
To assess the effect of temperature and fO2 on the evaporation of B, we calculated the evaporation rate constants ki from the time series experiments using the equation of Tsuchiyama et al. (1981) as used by Cohen et al. (2004):
For these calculations we treat each sample as a liquid sphere with an average radius of 0.1 cm and assume that the activity coefficient of B2O3 in each experiment remains constant. Xt and X0 are the ratios of B2O3 Al2O3 in the final and starting glass, respectively; ki is the evaporation rate constant; t is the time of the run; and r is the radius of the liquid sphere. Table 3 shows the evaporation rate constants of B2O3 from the t-series runs, which were calculated by linear regression from the slopes (−3) of the trend lines in Fig. 4. The calculated evaporation rate constants demonstrate that oxygen fugacity, ranging from air (logfO2 = −0.68) to FMQ−4, plays a key role in B evaporation. The difference in the evaporation rate constant of an order of magnitude between very oxidizing (in air) and very reducing (FMQ−4) conditions requires a mechanistic explanation. In the next section we discuss how the speciation of B in the gas phase and the respective evaporation reactions differ in the two experimentally investigated redox conditions.
4.2 Evaporation reactions
Boron shows a redox-sensitive behavior as its loss is more pronounced in highly oxidizing conditions (Figs. 3, 4). The evaporation mechanism and rate depend on the stoichiometry of the evaporation reactions, which in turn are dictated by the speciation and valence state of the element in the melt and in the gas phase (e.g., Sossi et al., 2019). To constrain the B gas-phase speciation, we conducted Gibbs free energy minimization calculations using the software package HSC Chemistry 9 (Metso Outotec) (Fig. 5). The thermodynamic database of HSC is largely based on NIST-JANAF data (Chase, 1998). We conducted calculations at 1250 and 1350 ∘C, including the gas species CO2, CO, O2, O3, B, B2, BC, BC2, B2C, BCO, BO, BO2, B2O, B2O2, and B2O3. The oxygen fugacity was varied by adding O2 to CO stepwise and ranges from logfO2 = −26 to logfO2 = −0.5. The detailed results of the calculations are provided in the Supplement, Table S4. The dominant B gas species in logfO2 > −18 conditions relevant for all our experiments is B2O3. In even more reducing conditions, the primary gas species becomes B2O2, with minor abundances of BO, B2O, BC2, and B2C. In increasingly oxidized conditions, BO2 becomes an important minor gas species, and it is most relevant in highly oxidizing conditions, such as in our experiment in air. If we then assume that B occurs only as B2O3 in the melt phase, we can write the following two evaporation reactions for the two most abundant gas species B2O3 and BO2:
In Reaction (3) B is in a trivalent state (B3+) in both the melt and the gas phase. This evaporation reaction is independent of the fO2 and predominates in all our experiments. The independence of Reaction (3 ) from fO2 is evident in Fig. 3, where the data show almost flat trends as fO2 varies from FMQ−6 to FMQ+1.5. However, a minor increase in the volatility of B with increasing fO2 can be observed in the data. We attribute this increase, as well as the high rate of B evaporation in air (Fig. 3), to the increasing stability of BO2 at high fO2 towards air. Reaction (4) thus describes the fO2-dependent evaporation of B in the oxidized tetravalent (B4+) state. BO2 is observed in high-temperature B combustion experiments, but it is not as stable as a solid (Dreizin et al., 1999).
In conclusion, in relatively reducing conditions (FMQ−4 to ∼ FMQ+1), one species of B predominates (B2O3). On the other hand, in highly oxidizing conditions (above FMQ+1.5 to air), two species of B are important in the gas phase, i.e., B2O3 and BO2, indicating the presence of two different valence states (B B+4).
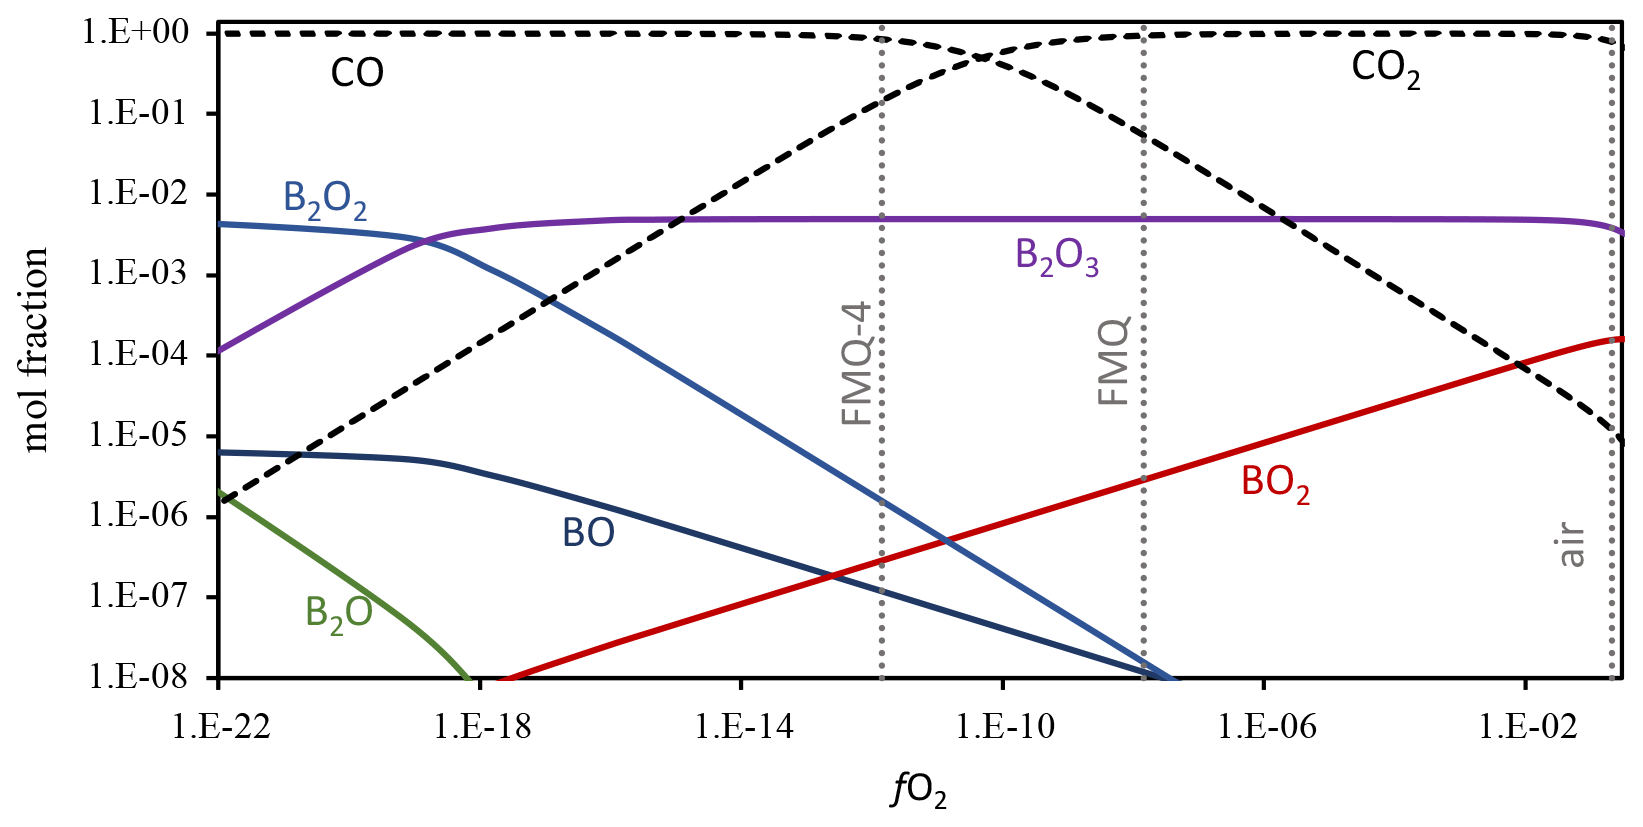
Figure 5Boron gas-phase speciation at 1250 ∘C as a function of fO2. Gibbs free energy minimization calculation results are shown as mole fractions. The dotted vertical lines show the fO2 of air, FMQ, and FMQ−4. Stippled lines show the mole fractions of CO and CO2, the gases that were used to control fO2 in the evaporation experiments. The mole fractions of the different B gas species are shown as solid lines. In the presented range of mole fractions and fO2, the stable gas species are B2O3, BO2, B2O2, BO, and B2O. The full calculation results are included in the Supplement, Table S3. Boron was added as a minor species to the CO–CO2 gas mixture, at a concentration of 0.01 mol fractions. The speciation and relative abundance of the B gas species do not change at lower B mole fractions, and the relative abundance of B2O3 over BO2 is not affected by the abundance of B in the calculated system.
4.3 Implications for evaporative B loss from experimental melts and large industrial volumes of melt
By conducting time series evaporation experiments, we derived the kinetic evaporation rates of B from aluminoborosilicate melts at ∼ 1250 and 1350 ∘C for two different redox states, in FMQ−4 and in air (Table 3). Our experiments further demonstrate that the evaporation is not rate limited by B diffusion in the melt. This observation provides a lower limit on B diffusion estimates. At 1200 ∘C we estimate that for a melt volume of 1 m3, a melt flow velocity of more than 10−4 m s−1 would be required for the Péclet number to exceed 1 and advection to become dominant over diffusion. At 1350 ∘C even higher melt flow velocities would be required, with > 10−2 m s−1 for Pe > 1 (see derivations of Pe in the Supplement).
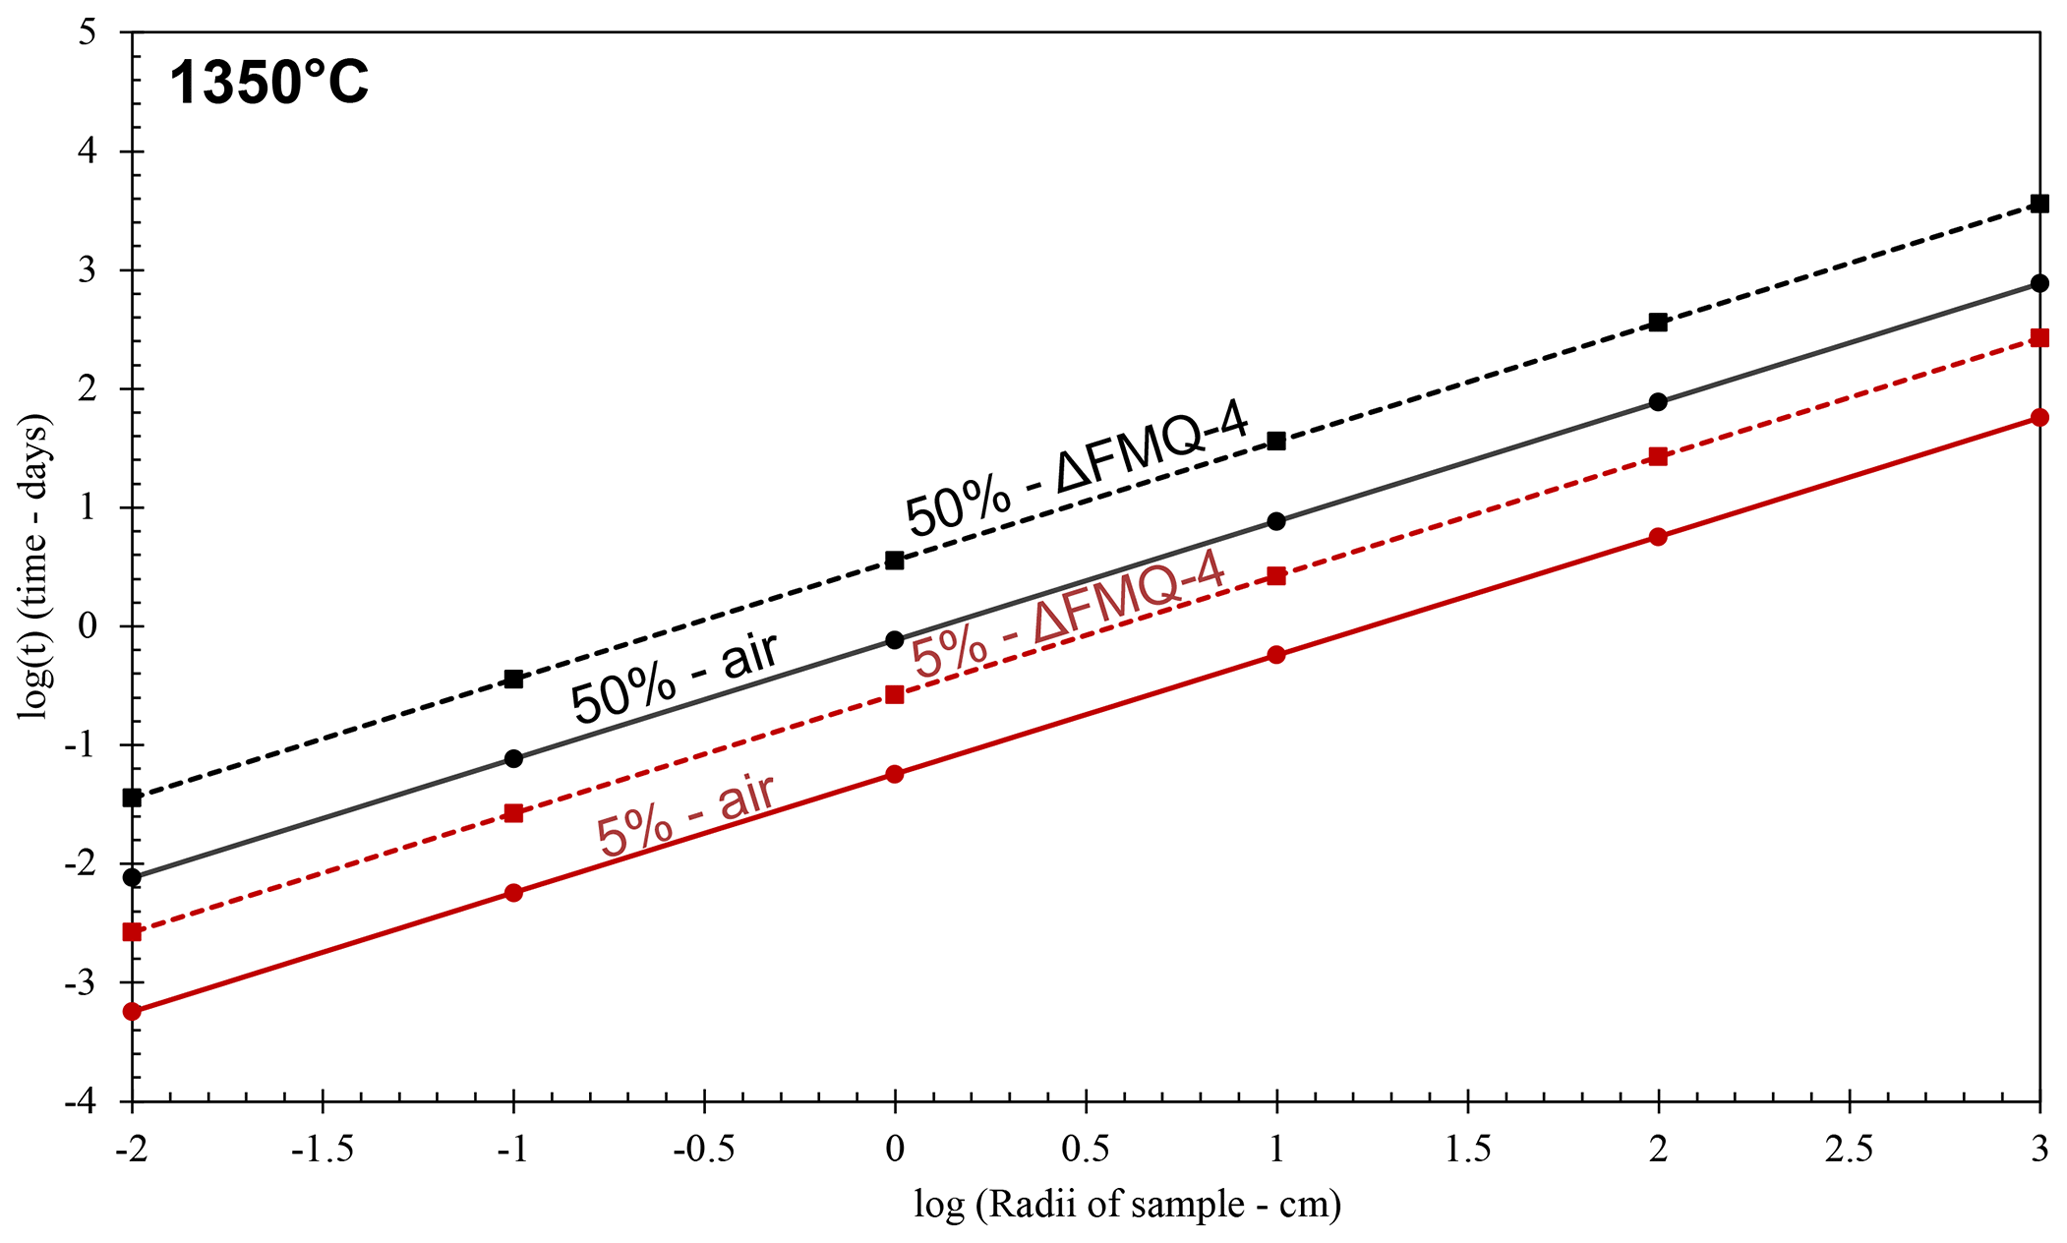
Figure 6Evaporation rate models of aluminoborosilicate glasses with different radii at 1350 ∘C for oxidizing and reducing fO2 conditions (in air and FMQ−4, respectively). Continuous lines represent the evaporation rate models for the experimental runs in oxidizing conditions (air). Dashed lines represent the evaporation rate models for the experimental runs in reducing conditions (FMQ−4). Red lines show the time it will take, depending on the sample radii, for the melt to lose 5 % of its initial B2O3 content due to degassing, while black lines represent the 50 % loss of the initial B2O3 content of the sample.
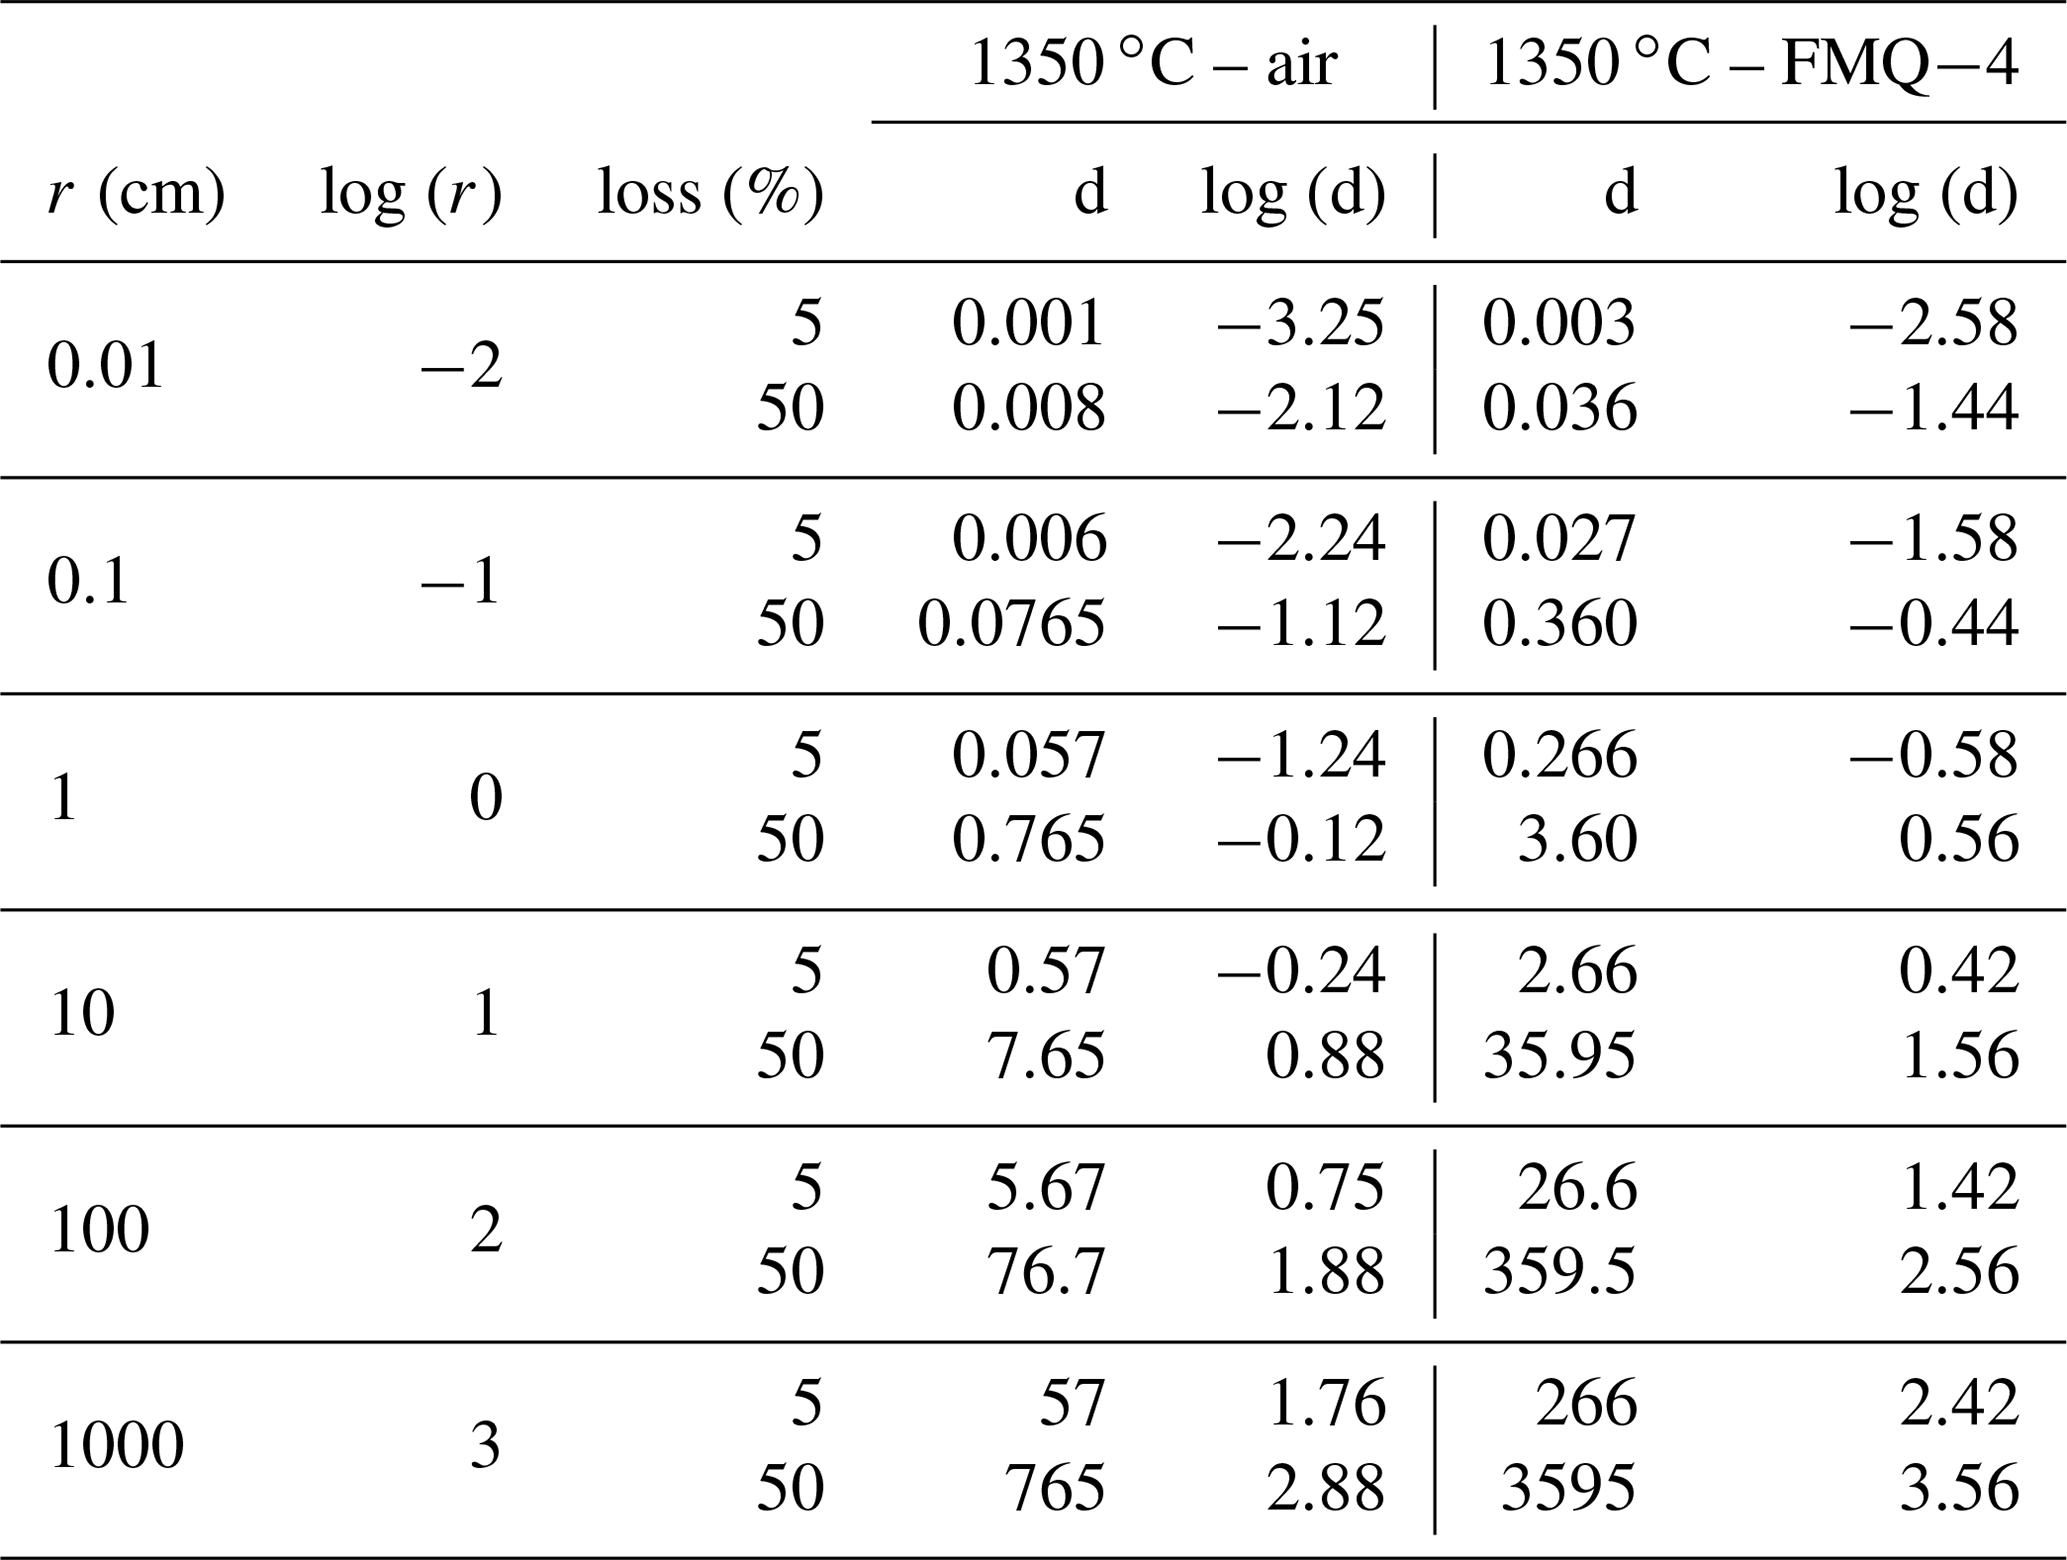
To assess the extent to which B is lost at an industrial scale, we use the determined evaporation rate constants and apply them to a simple model (Fig. 6). In this model we assume spherical samples with radii ranging from 0.01 to 1000 cm. We use the evaporation rate constants (Table 3) from the “1350 ∘C – in air” and “1350 ∘C – FMQ−4” experiments, i.e., and (cm min−1) and different sample radii, in Eq. (2), to calculate degassing times (Table 4). In this way, we determine the time needed for each sample, depending on its radius, to lose 5 % and 50 % of its initial B2O3 content by evaporation of B2O3(g) and BO2(g) (Fig. 6).
Table 4Evaporation rates of B2O3 from samples with different radii in oxidizing conditions in air and in reducing conditions at FMQ−4.
Even though evaporative B loss is significant at the small sample scale of our experiments, the determined rate constants are very low. In small-volume samples like in the present study (i.e., r=0.1 cm), exposure at 1350 ∘C and oxidizing conditions (in air) will result in a loss of 5 % of B2O3 in only 8 min. In the same conditions, the threshold of the 50 % loss will be reached in 100 min. In reducing conditions (FMQ−4), for the same sample size (r=0.1 cm) and temperature, the time needed to lose 5 % and 50 % of the initial B content is 39 and 518 min. What we observe here is a 5-fold increase in the exposure times between oxidizing and reducing fO2 conditions to reach the same amount of B loss. The evaporative loss of B can also be affected by the total pressure of the experimental setup. We conducted our experiments at atmospheric pressure i.e., 1 bar. At this pressure the ratio of the equilibrium partial pressure of the species (pi) to the actual pressure of the boundary layer of the evaporating surface (pi,sat) is ∼ 0.993 (Sossi et al., 2020), which augments the evaporation of B. Therefore, at higher pressures than 1 bar, evaporation will be inhibited, while at lower pressures, it will be enhanced. At industrial volumes of melt on the order of cubic meters (in our model represented by the 100 and 1000 cm sample radii), extensive exposure at 1350 ∘C and in oxidizing conditions of ∼ 5 d to ∼ 2 years (Fig. 6; Table 5) would be necessary to result in B loss of 5 % to 50 % of the initial content, respectively. Importantly, our experiments are conducted in an open system where the evaporated gas phase is efficiently transported away from the melt. In a closed large-volume furnace typically used in industrial processes, this condition is not met. Our calculated rates of B loss are therefore upper-limit estimates.
In summary, our study indicates that at high temperatures of 1350 ∘C and in very oxidizing conditions in air, the aluminoborosilicate melt entirely loses its B content by evaporation within 1020 min. Evaporation rate constants along with the sample size can be used to determine the rate and amount of B loss. Small-scale samples are more prone to evaporation losses. Large-scale samples may generate local degassing surfaces that can affect locally the composition and structure and thereby the properties of the final glass.
-
Under oxidizing conditions B2O3 degassing will increase by a factor of 5.
-
In large-volume samples used in industrial glass making, these losses are not so extensive, but they might generate smaller degassing surfaces, which in turn might create local deviations from the intended glass composition and consequently its expected properties.
-
During the synthesis of aluminoborosilicate glasses, these losses might have important implications for the melt composition and, hence, the structure and properties of the final glass.
Software package HSC Chemistry 9 (Metso Outotec) is publicly available software. Input data are provided within the text, and the output files can be found in the Supplement.
All our data are provided within the text and the Supplement, which are both open-access.
The supplement related to this article is available online at: https://doi.org/10.5194/ejm-36-173-2024-supplement.
SF: methodology, formal analysis, investigation, writing (original draft), visualization. CJR: conceptualization, methodology, formal analysis, investigation, software, writing (review and editing), funding acquisition. PP: formal analysis, investigation. JB: investigation, resources, writing (review and editing). SK: supervision, funding acquisition, review and editing.
The contact author has declared that none of the authors has any competing interests.
Publisher’s note: Copernicus Publications remains neutral with regard to jurisdictional claims made in the text, published maps, institutional affiliations, or any other geographical representation in this paper. While Copernicus Publications makes every effort to include appropriate place names, the final responsibility lies with the authors.
We acknowledge funding by the Deutsche Forschungsgemeinschaft (DFG, German Research Foundation – SFB-TRR 170). Christian J. Renggli is funded by the DFG – project 442083018. Our thanks go to Michael Feldhaus, Jonas Kemmann, Maik Trogisch, Beatte Schmitte, and Peter Weitkamp for excellent sample preparation and maintenance and repairs of the experimental and analytical facilities at the Institut für Mineralogie at Universität Münster. This is SFB-TRR 170 publication no. 184.
This research has been supported by the Deutsche Forschungsgemeinschaft (grant no. SFB-TRR 170 and project no. 442083018).
This open-access publication was funded by University of Münster.
This paper was edited by Didier Laporte and reviewed by Paolo Sossi and Mathieu Roskosz.
Chase, M. W.: NIST-JANAF Thermochemical Tables, Phys. Chem. Ref. Data, JANAF Thermochemical Tables, Phys. Chem. Ref. Data, American Chemical Society Society, National Institute of Standards and Technology, Vol. 2, ISBN: 1563968312, 9781563968310, 1998.
Cohen, B. A., Hewins, R. H., and Alexander, C. M. O.: The formation of chondrules by open-system melting of nebular condensates, Geochim. Cosmochim. Ac., 68, 1661–1675, https://doi.org/10.1016/j.gca.2003.09.009, 2004.
Dreizin, E. L., Keil, D. G., Felder, W., and Vicenzi, E. P.: Phase changes in boron ignition and combustion, Comb. Flame, 119, 272–290, 1999.
Hannon, A. C., Sinclair, R. N., Blackman, J. A., Wright, A. C., and Galeener, F. L.: Phonon spectra of vitreous B2O3, J. Non-Cryst., 106, 116–119, https://doi.org/10.1016/0022-3093(88)90242-6, 1988.
Hannon, A. C., Wright, A. C., Blackman, J. A., and Sinclair, R. N.: The vibrational modes of vitreous B2O3: inelastic neutron scattering and modelling studies, J. Non-Cryst. Solids, 182, 78–89, https://doi.org/10.1016/0022-3093(95)00577-3, 1995.
Huber, C., Jahromy, S. S., Birkelbach, F., Weber, J., Jordan, C., Schreiner, M., Harasek, M., and Winter, F.: The multistep decomposition of boric acid, Energy Sci. Eng., 8, 1650–1666, https://doi.org/10.1002/ese3.622, 2020.
Hubert, M. and Faber, A. J.: On the structural role of boron in borosilicate glasses, Phys. Chem. Glas., 55, 136–158, 2014.
Jochum, K.P., Nohl, U., Herwig, K., Lammel, E., Stoll, B., and Hofmann, A. W.: GeoReM: A New Geochemical Database for Reference Materials and Isotopic Standards, Geostand. Geoanal. Res., 29, 333–338, https://doi.org/10.1111/j.1751-908X.2005.tb00904.x, 2005.
Klemme, S., Genske, F., Sossi, P. A., Berndt, J., Renggli, C. J., and Stracke, A.: Cr stable isotope fractionation by evaporation from silicate melts, Chem. Geol., 610, 121096, https://doi.org/10.1016/j.chemgeo.2022.121096, 2022.
Kusano, Y., Umino, S., Shinjo, R., Ikei, A., Adachi, Y., Miyashita, S., and Arai, S.: Contribution of slab-derived fluid and sedimentary melt in the incipient arc magmas with development of the paleo-arc in the Oman Ophiolite, Chem. Geol., 449, 206–225, https://doi.org/10.1016/j.chemgeo.2016.12.012, 2017.
Lenoir, M., Grandjean, A., Linard, Y., Cochain, B., and Neuville, D. R.: The influence of Si,B substitution and of the nature of network-modifying cations on the properties and structure of borosilicate glasses and melts, Chem. Geol., 256, 316–325 https://doi.org/10.1016/j.chemgeo.2008.07.002, 2008.
Lodders, K.: Solar System Abundances and Condensation Temperatures of the Elements, Astrophys. J., 591, 1220, https://doi.org/10.1086/375492, 2003.
Micoulaut, M., Kerner, R., and dos Santos-Loff, D. M.: Statistical modelling of structural and thermodynamical properties of vitreous B2O3, J. Phys.-Condens. Matter., 7, 8035, https://doi.org/10.1088/0953-8984/7/42/002, 1995.
Pangritz, P., Renggli, C. J., Berndt, J., Rohrbach, A., and Klemme, S.: Synthesis of Large Amounts of Volatile Element-Bearing Silicate Glasses Using a Two-Stage Melting Process, ACS Earth Space Chem. 6, 1108–1114, https://doi.org/10.1021/acsearthspacechem.2c00020, 2022.
Renggli, C. J., Hellmann, J. L., Burkhardt, C., Klemme, S., Berndt, J., Pangritz, P., and Kleine, T.: Tellurium isotope fractionation during evaporation from silicate melts, Geochim. Cosmochim. Ac., 339, 35–45, https://doi.org/10.1016/j.gca.2022.10.032, 2022.
Shelby, J. E.: Introduction to Glass Science and Technology, Roy. Soc. Ch., 308 pp., https://doi.org/10.1039/9781847551160 2015.
Shivachev, B. L., Mincov, I. P., Kashchieva, E. P., Dimitriev, Y. B., Smith, R., and Troev, T.: Positron lifetime spectroscopy of vitreous B2O3, J. Non-Cryst., 345/346, 108–111, https://doi.org/10.1016/j.jnoncrysol.2004.08.004, 2004.
Smith, R. A.: Boron in Glass and Glass Making, J. Non-Cryst., 84, 421–432, 1986.
Sossi, P. A., Klemme, S., O'Neill, H. S. C., Berndt, J., and Moynier, F.: Evaporation of moderately volatile elements from silicate melts: experiments and theory, Geochim. Cosmochim. Ac., 260, 204–231, 2019.
Sossi, P. A., Moynier, F., Treilles, R., Mokhtari, M., Wang, X., and Siebert, J.: An experimentally-determined general formalism for evaporation and isotope fractionation of Cu and Zn from silicate melts between 1300 and 1500 ∘C and 1 bar, Geochim. Cosmochim. Ac., 288, 316–340, 2020.
Tsuchiyama A., Nagahara, H., and Kushiro, I.: Volatilization of sodium from silicate melt spheres and its application to the formation of chondrules, Geochim. Cosmochim. Ac., 45, 1357–1367, 1981.
Uhlmann D. R. and Kreidl, N. J.: Glass Forming Systems, Glass Science and Technology, edited by: Academic Press, New York, USA, Vol. 1, 465, ISBN: 978-0-12-706701-8, 1983.
van Limpt, J. A. C., Beerkens, B., Cook, S., O'Connor, R., and Simon, J.: Modelling the evaporation of boron species, Part 1. Alkali-free borosilicate glass melts, Glass Tech., 52, 11, 77–87, 2011.
van Limpt, J. A. C.: Modeling of evaporation processes in glass melting furnaces, PhD Thesis, Technische Universiteit Eindhoven, https://doi.org/10.6100/IR630685, 2007.
Wood, B. J., Smythe, D. J., and Harrison, T.: The condensation temperatures of the elements: A reappraisal, Am. Mineral., 104, 844–856, https://doi.org/10.2138/am-2019-6852CCBY, 2019.