the Creative Commons Attribution 4.0 License.
the Creative Commons Attribution 4.0 License.
 | 22 Sep 2023
A revised model for activity–composition relations in solid and molten FePt alloys and a preliminary model for characterization of oxygen fugacity in high-pressure experiments
Hongluo L. Zhang
We present new models for the activity of iron (γFe) in solid face-centered cubic (fcc) and liquid FePt alloy at high temperature and pressure to facilitate their use as sliding buffer redox sensors under extreme conditions. Numerous experimental studies of γFe in FePt alloy at 100 kPa have produced a wide spread of values. By favoring high-temperature studies that are more likely to have produced equilibrium measurement and excluding experiments for compositions and temperatures that probably encountered ordered or unmixed low-temperature phases, we regress an asymmetric Margules activity–composition model with parameters kJ mol−1 and kJ mol−1. These values are close to the widely used model of Kessel et al. (2001), but for Pt-rich compositions they predict larger Fe activities and correspondingly more reduced oxygen fugacities. Activity–composition relations in liquid FePt are calibrated from direct measurements of activities and, most sensitively, from the trace of the Fe–Pt liquidus. Together, these yield asymmetric Margules parameters of kJ mol−1 and kJ mol−1. The effects of pressure on both fcc and liquid FePt alloy are considered from excess-volume relations. Both solid and liquid alloy display significant positive excess volumes of mixing. Extraction of the excess volume of mixing for fcc FePt alloy requires filtering data for ordered low-temperature phases and corrections for the effects of magnetostriction on Fe-rich compositions which exhibit “Invar” behavior. Applied at high temperatures and pressures, both solid and liquid FePt alloys have strongly negative deviations from ideality at low pressure, which become closer to ideal at high pressure. These models provide a provisional basis for the calculation of aFe in high-temperature, high-pressure experiments that, when combined with estimates of aFeO, allow characterization of under conditions relevant to magma oceans, core formation, and differentiation processes in the lower mantle of Earth or on other terrestrial planets. Improvements in these models require new constraints on the equation of state of FePt fcc alloy and documentation of the high-pressure melting relations in the system Fe–Pt.
- Article
(5072 KB) - Full-text XML
-
Supplement
(549 KB) - BibTeX
- EndNote


Precious metal-iron alloys such as FePt are widely used as sliding redox sensors in experimental petrology and geochemistry (Grove, 1981; Taylor et al., 1992; Woodland and O'Neill, 1997; Kessel et al., 2001). Given high interest in redox in deeper planetary interiors and in magma oceans (Frost and McCammon, 2008; Hirschmann, 2012; Lichtenberg, 2021), application of redox sensors in the higher-pressure experimental environments provided by multi-anvil and diamond anvil devices is of interest. This requires attention to the effects of pressure on the properties of such alloys. Also, experimental conditions relevant to magma oceans and core formation on Earth and other planets can exceed the melting temperature of precious metal-Fe alloy compositions (Fig. 1). Under these conditions, liquid alloys may also be used as redox sensors (Zhang et al., 2019), but experimental constraints and models for the calculation of Fe activities in liquid Fe–Pt alloy remain scarce. Here we describe a preliminary high-pressure, high-temperature thermodynamic model for solid and liquid FePt alloy, which allows prediction of Fe activities and oxygen fugacities, , that are of use to large-volume and diamond anvil experimental conditions. We also highlight the need for new experimental data that could improve such models in the future.
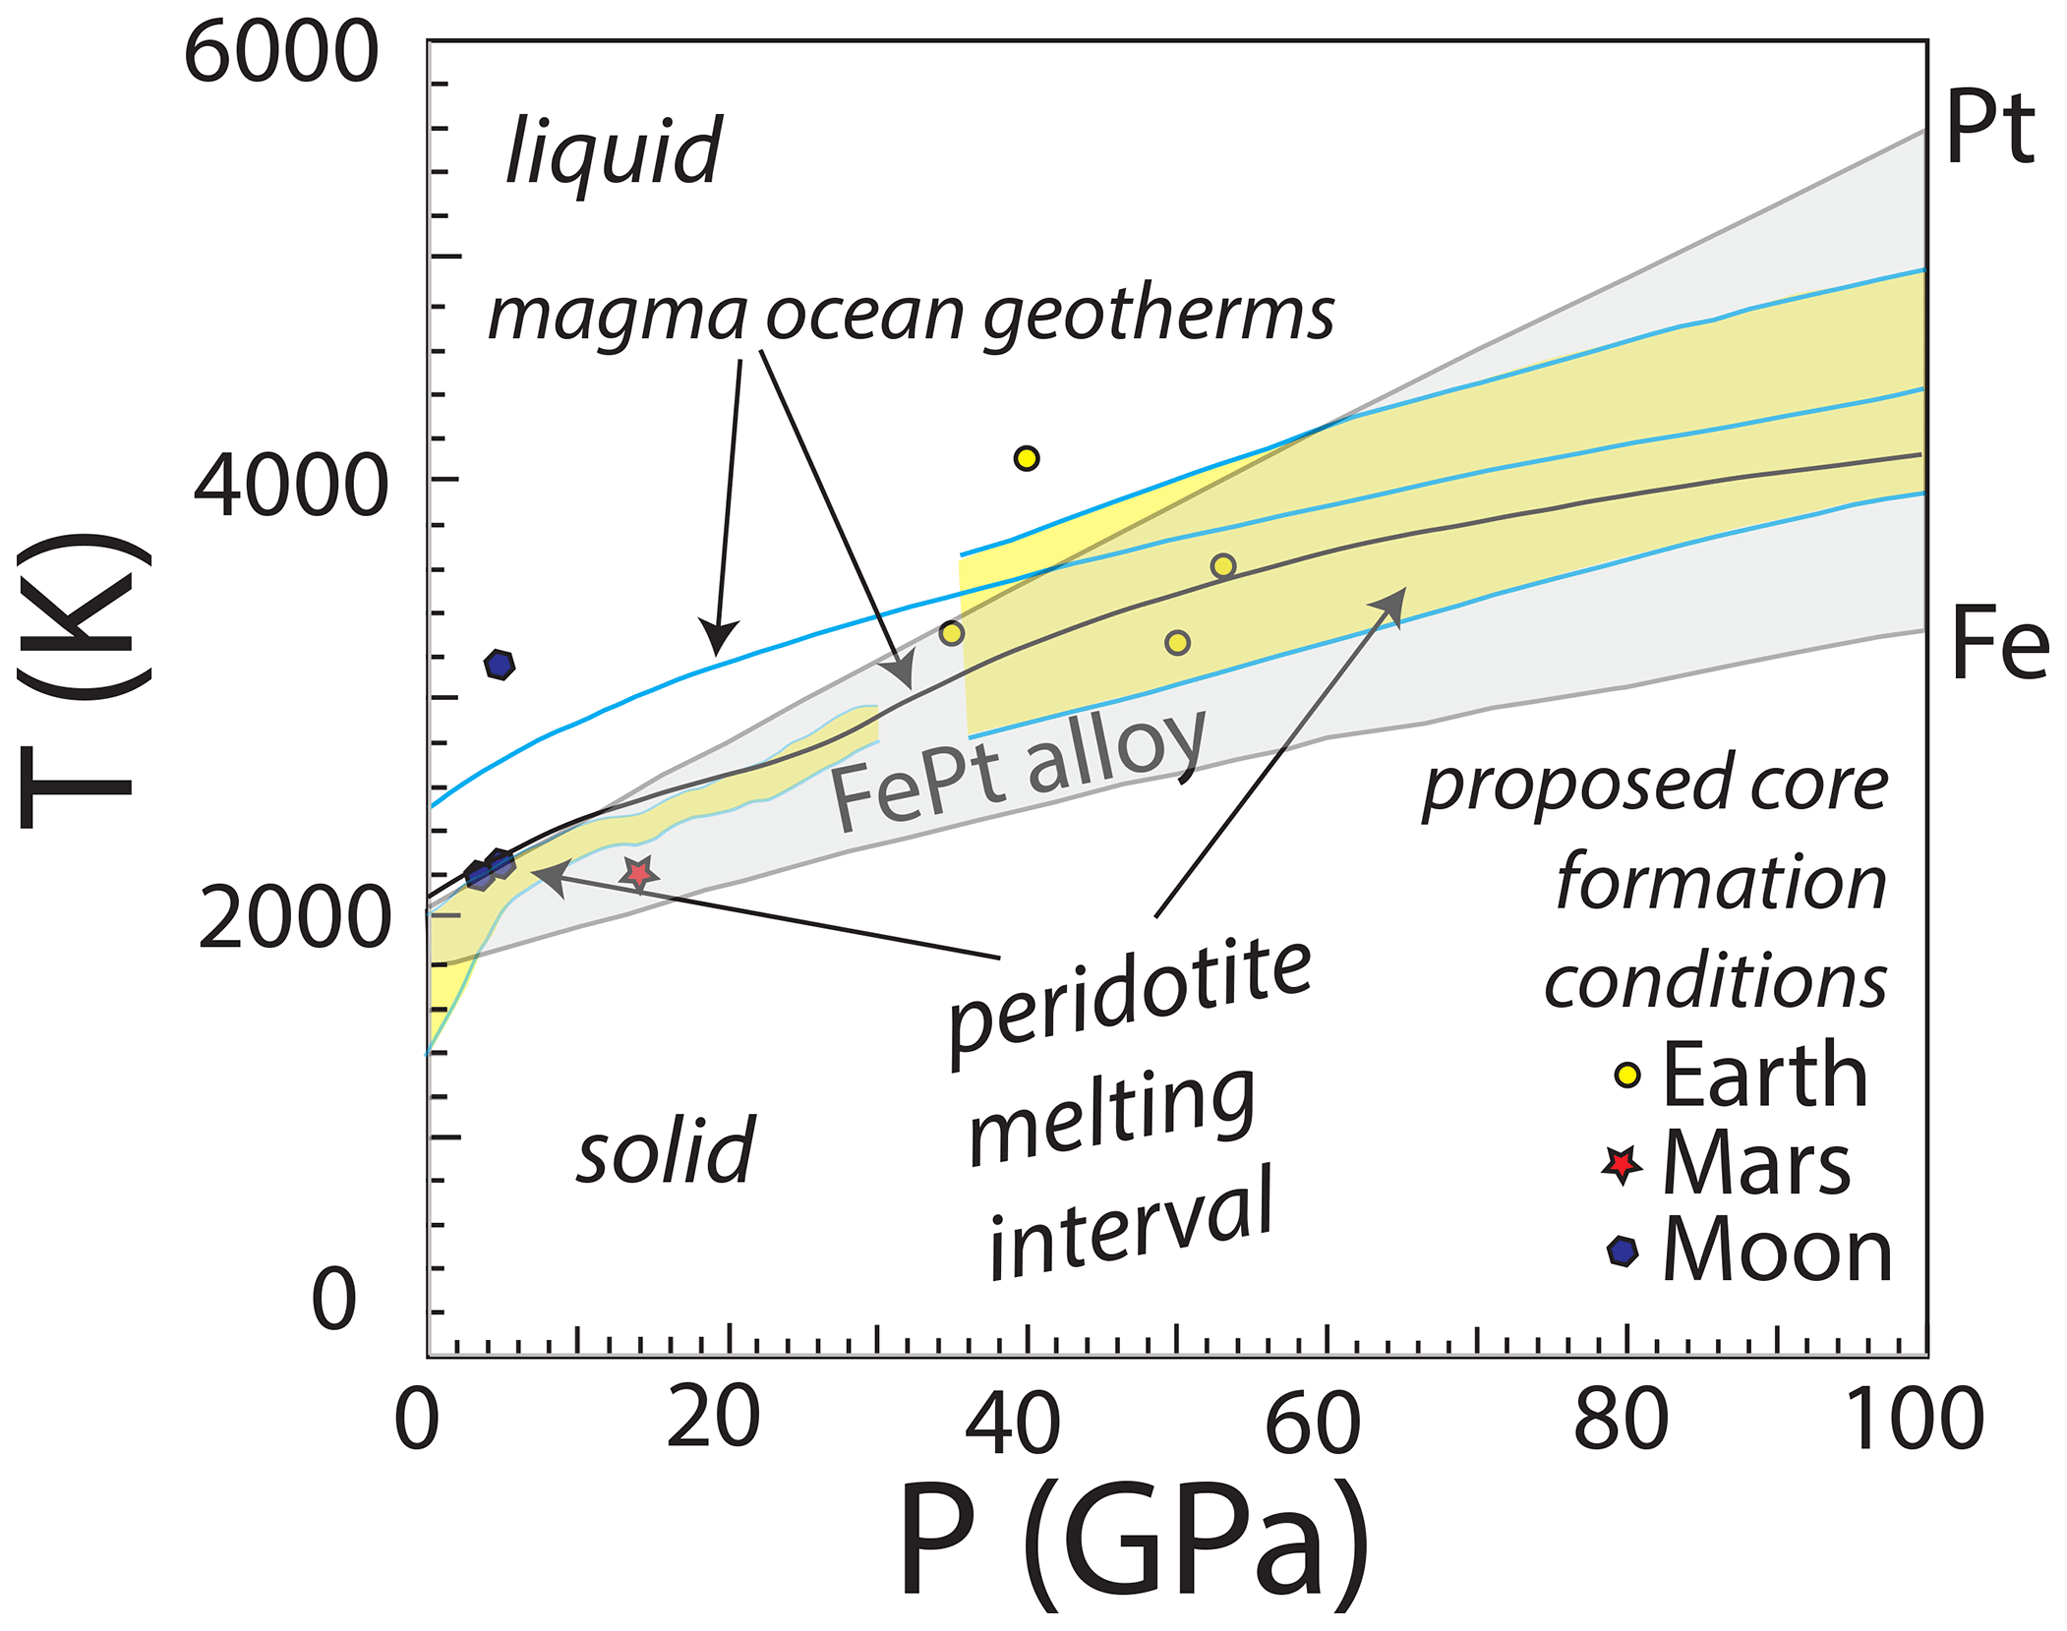
Figure 1Comparison of the melting interval of FePt alloy to conditions relevant in magma oceans, core formation, and other processes potentially applicable to hot, deep planetary interiors. Approximate bounds of the FePt melting interval are from the melting curve of Fe (Komabayashi and Fei, 2010) up to the fusion temperature of Pt (Anzellini et al., 2019). Also shown are example magma ocean geotherms (Stixrude et al., 2009), proposed mean conditions of core formation for Earth and Mars from the compilation of Hirschmann (2022) and for the Moon (Righter and Drake, 1996; Steenstra et al., 2017), and intervals of peridotite partial melting at below 30 GPa (Herzberg and Zhang, 1996) and above 40 GPa (Fiquet et al., 2010). Many of these conditions exceed the melting temperature of FePt alloy, particularly for Fe-rich alloys that are stable under comparatively reduced conditions, making solid FePt alloy unsuitable as an experimental oxygen fugacity sensor.
Characterization of the oxygen fugacity prevailing in high-temperature, high-pressure apparatuses can be of great importance to experimental studies of phase equilibria, element partitioning, volatile solubilities, and transport properties (Cline et al., 2018; Otsuka et al., 2013; Yoshino et al., 2020). However, direct control of in experimental assemblies, for example through the coexistence of well-defined buffers, is not always feasible. An alternative strategy is to design experiments so that the can be determined afterwards, based on the compositions of “sliding buffers” (Taylor et al., 1992) incorporating solid solutions with components that participate in buffer reactions. These sliding buffers include alloys between a base metal (Fe, Ni, Co), which participates in the buffer reaction, and one or more noble metals (Pt, Pd, Ir, Au) (Balta et al., 2011; Grove, 1981; Taylor et al., 1992; Woodland and O'Neill, 1997). One of the most common of these is FePt alloy, which through coexistence with assemblages with known activity of FeO, aFeO, monitors by the reaction
for which the is given by
(Grove, 1981; Medard et al., 2008; Gudmundsson and Holloway, 1993; Kessel et al., 2001) and where ΔG0 is the free energy difference between the pure reactants at the temperature and pressure of interest.
The activity of FeO in Eq. (2) may be characterized from activity coefficients of FeO in silicate melts (Kessel et al., 2001; Doyle, 1988; O'Neill and Eggins, 2002; Holzheid and Grove, 2005; Hirschmann, 2022) or by coexistence of FeO-bearing minerals such as olivine and orthopyroxene (Jamieson et al., 1992; Stanley et al., 2014). Medard et al. (2008) presented an empirical calibration, applicable to modest pressure conditions, in which they combined the non-ideal effects of FeO and the value of ΔG0.
The activity of Fe in FePt alloy, aFe, is given by
where XFe and γFe are the mole fraction and the activity coefficient of Fe. As the thermodynamic mixing properties of FePt alloy are highly non-ideal, γFe can be ≪ 1, particularly for Pt-rich alloy compositions (Larson and Chipman, 1954; Gudmundsson and Holloway, 1993; Kessel et al., 2001).
The activity coefficient, γFe, is given by
where GXS is the excess free energy of the solution, describing mixing effects in addition to ideal contributions from the configurational entropy:
Previous treatments of solid and liquid FePt alloys have found GXS to be well-described by a power expansion to third order, in either Redlich–Kister (Fredriksson and Sundman, 2001; Heald, 1967; Gudmundsson and Holloway, 1993) or Margules (Kessel et al., 2001) formulations. Here we adopt the Margules approach:
Calculations of γFe at high pressure may require incorporation of the effects of pressure on non-ideal mixing. The pressure effect is given by the excess volume of mixing, VXS, as
and so
Values of VXS are non-zero if the volume of the FePt alloy, VFePt, is not a linear combination of the volumes of the pure endmembers, VFe and VPt, i.e., if
Similarly to GXS, VXS can be modeled with a Margules-like function:
If VXS is not a function of pressure, then
We will examine this assumption in the Discussion. Combining Eqs. (6), (11), and (12), the coefficients for the calculation of activity coefficients at the pressure of interest then become
As described below, numerous studies have characterized γFe in solid FePt alloy at 100 kPa, and these have been used to characterize at modest pressure in piston cylinder or multi-anvil devices. With a few exceptions (Rubie et al., 1993; Stagno et al., 2015; Davis and Cottrell, 2021), such pressure corrections are seldom applied. Neglecting pressure effects for experiments at modest pressure, for example those in piston cylinder devices at 1–3 GPa, may be justified. Gudmundsson and Holloway (1993) determined activities of Fe in FePt alloy at 2 GPa and found general agreement with results from their 100 kPa experiments. On the other hand, the actual differences from 100 kPa values at this modest pressure may have been too small to overcome potential inaccuracies in arising from comparison between buffering in gas mixing and solid media experiments. Similarly, based on excess-volume estimates, Kessel et al. (2001) recommended that the effects of pressure may not be consequential below 4 GPa. However, the magnitude of effects at moderate pressure should be better quantified, and for application to higher-pressure conditions, non-ideal volume effects on activities of Fe in FePt alloys are likely to be important and need evaluation.
In experiments at high temperature, FePt alloy may be molten, requiring adjustment for differences in properties between solid and liquid alloy. The minimum melting temperature of FePt alloy is approximated by the fusion temperature of pure Fe, and at high temperature, the bound is fusion of pure Pt (Fig. 1). Experiments at more reduced conditions produce more Fe-rich alloys, and therefore the transition to molten alloys occurs at higher temperature, closer to the fusion temperature of pure Pt, for more oxidized conditions.
Constraints on the thermodynamic properties of molten FePt alloys include Knudsen cell measurements of Fe activities (Alcock and Kubik, 1968) and those that can be inferred from the properties of solid FePt alloy by matching Fe–Pt melting relations (Buckley and Hume-Rothery, 1959; Fredriksson, 2004; Isaac and Tammann, 1907). We are aware of two previous thermodynamic models for the thermodynamic mixing properties of molten FePt alloy, those of Fredriksson and Sundman (2001) and Odusote (2008), but each has some unsatisfactory features. The Odusote (2008) model is, unfortunately, calibrated only from data on FePt solid at 1123 K and therefore is not necessarily applicable to liquid solutions. Fredriksson and Sundman (2001) calibrated a Redlich–Kister model based on both the Knudsen cell and melting-loop data. However, their model, calibrated from data over a relatively modest temperature interval (1775–1950 K), adopts a strong temperature dependence on the mixing properties. As a consequence, extrapolation to high temperature predicts increasing values for the activity coefficient of Fe that are not based on experimental constraints and are unexpected based on usual thermodynamic theory. For example, for alloy with XFe=0.1, Fredriksson and Sundman (2001) predict γFe values at 2000, 3000, and 4000 K of 0.004, 0.28, and 2.23, respectively.
3.1 Activity–composition relations in FePt alloy at 100 kPa
Activities of Fe in solid FePt alloy have been investigated at 100 kPa by EMF, Knudsen cell mass spectrometry, and equilibration with an Fe oxide at known oxygen fugacity (Table 1). We also consider experiments at 2 GPa in which alloy was equilibrated with pairs of coexisting Fe oxides, which thereby fixed the activity of Fe (Gudmundsson and Holloway, 1993). For these experiments, we adjusted observed values of RTln γ down to 100 kPa equivalents using the volume interaction parameters described in the next section.
Table 1Summary of experimental determinations of Fe activities in FePt alloy compiled from the literature.
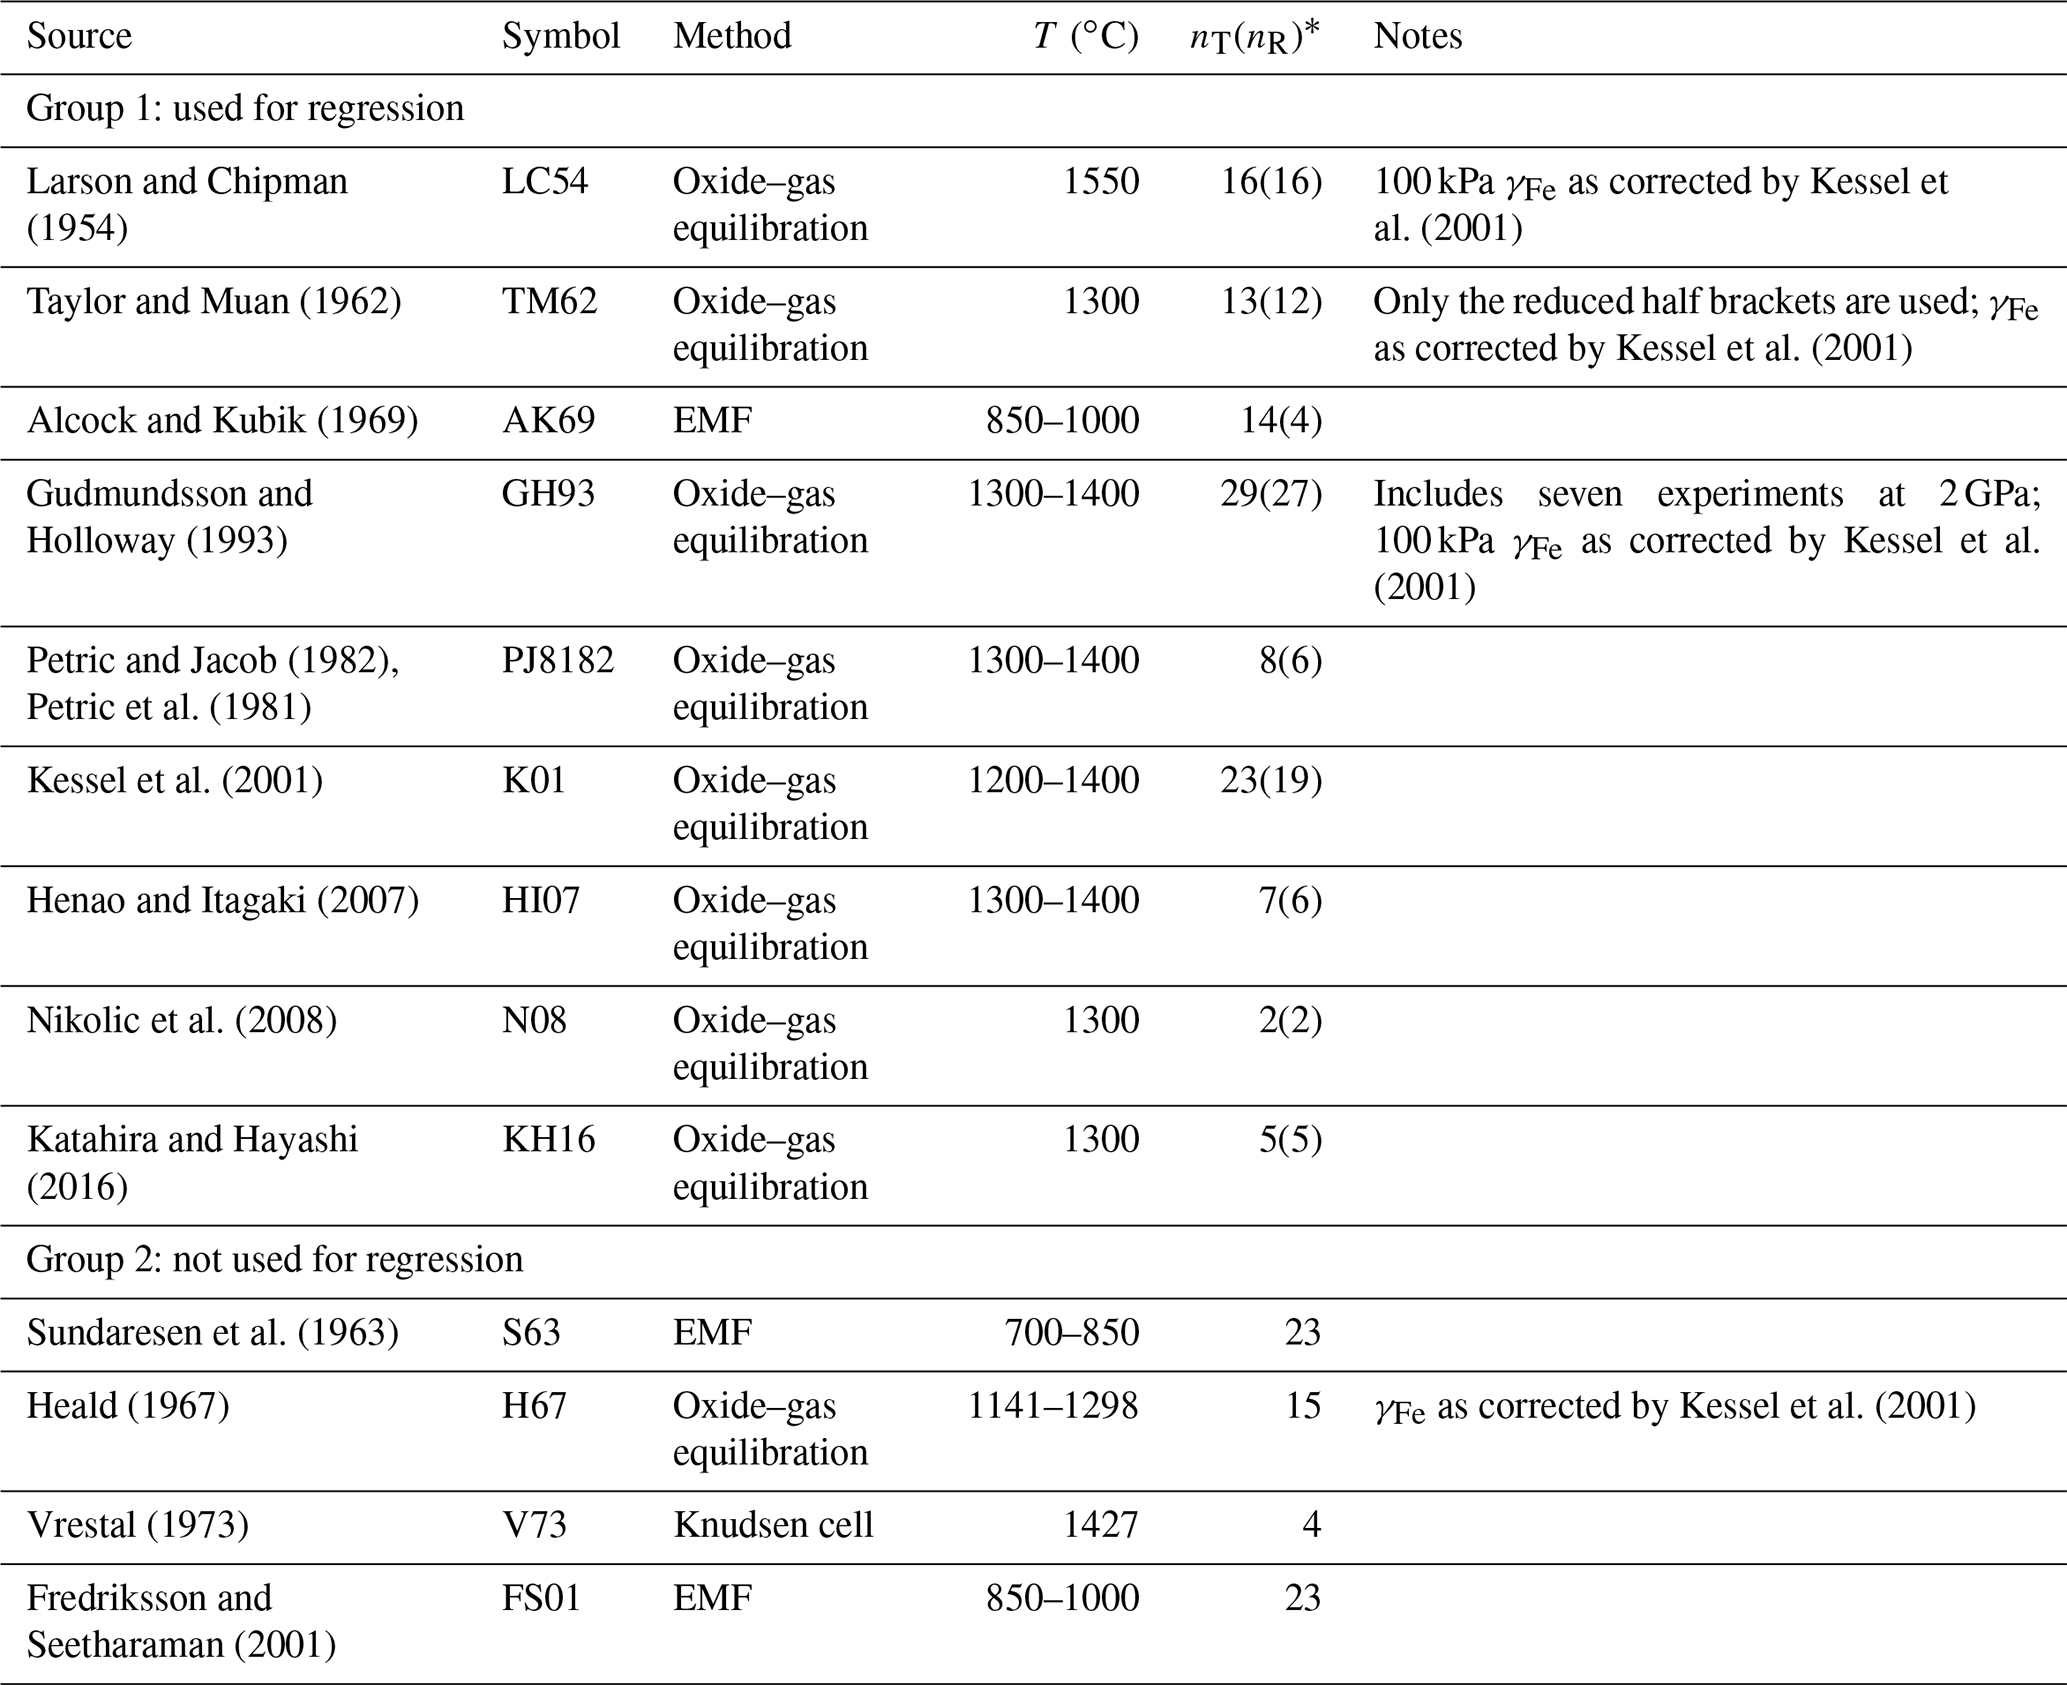
* nT denotes the total number of measurements. For Group 1, nR denotes the number of measurements likely to be homogeneous fcc FePt and used for calibration.
Experimentally determined activity coefficients of Fe show a significant spread of values (Fig. 2). The studies fall into two groups, as indicated in Table 1 and Fig. 2. Group 1 studies were conducted mostly at high temperature (1200–1550 ∘C), except that of Alcock and Kubik (1969) (850–1000 ∘C); yield activity coefficients that are comparatively small at a given FePt composition; and are broadly consistent with one another. Group 2 studies are mostly from lower temperature, 700–1298 ∘C, except data from Vrestal (1973) (1427 ∘C), and scatter to larger values of γFe at a given composition. The distinctions between these two groups are not obviously traceable to differences in the experimental technique. Lower-temperature experiments in Group 2 with intermediate compositions () may have been conducted within the region of stability of ordered FePt phases, Pt3Fe (isoferroplatinum) or FePt (tetraferroplatinum) (Cabri et al., 2022), yielding either different chemical potentials of Fe or unmixing of alloy to produce disordered face-centered cubic (fcc) alloy with a composition distinct from the bulk material (e.g., Fredriksson and Sundman, 2001). Alternatively, the lower-temperature phases may have failed to reach equilibrium, which can be slow even at relatively high temperature (Taylor and Muan, 1962). We therefore focus only on Group 1 experiments.
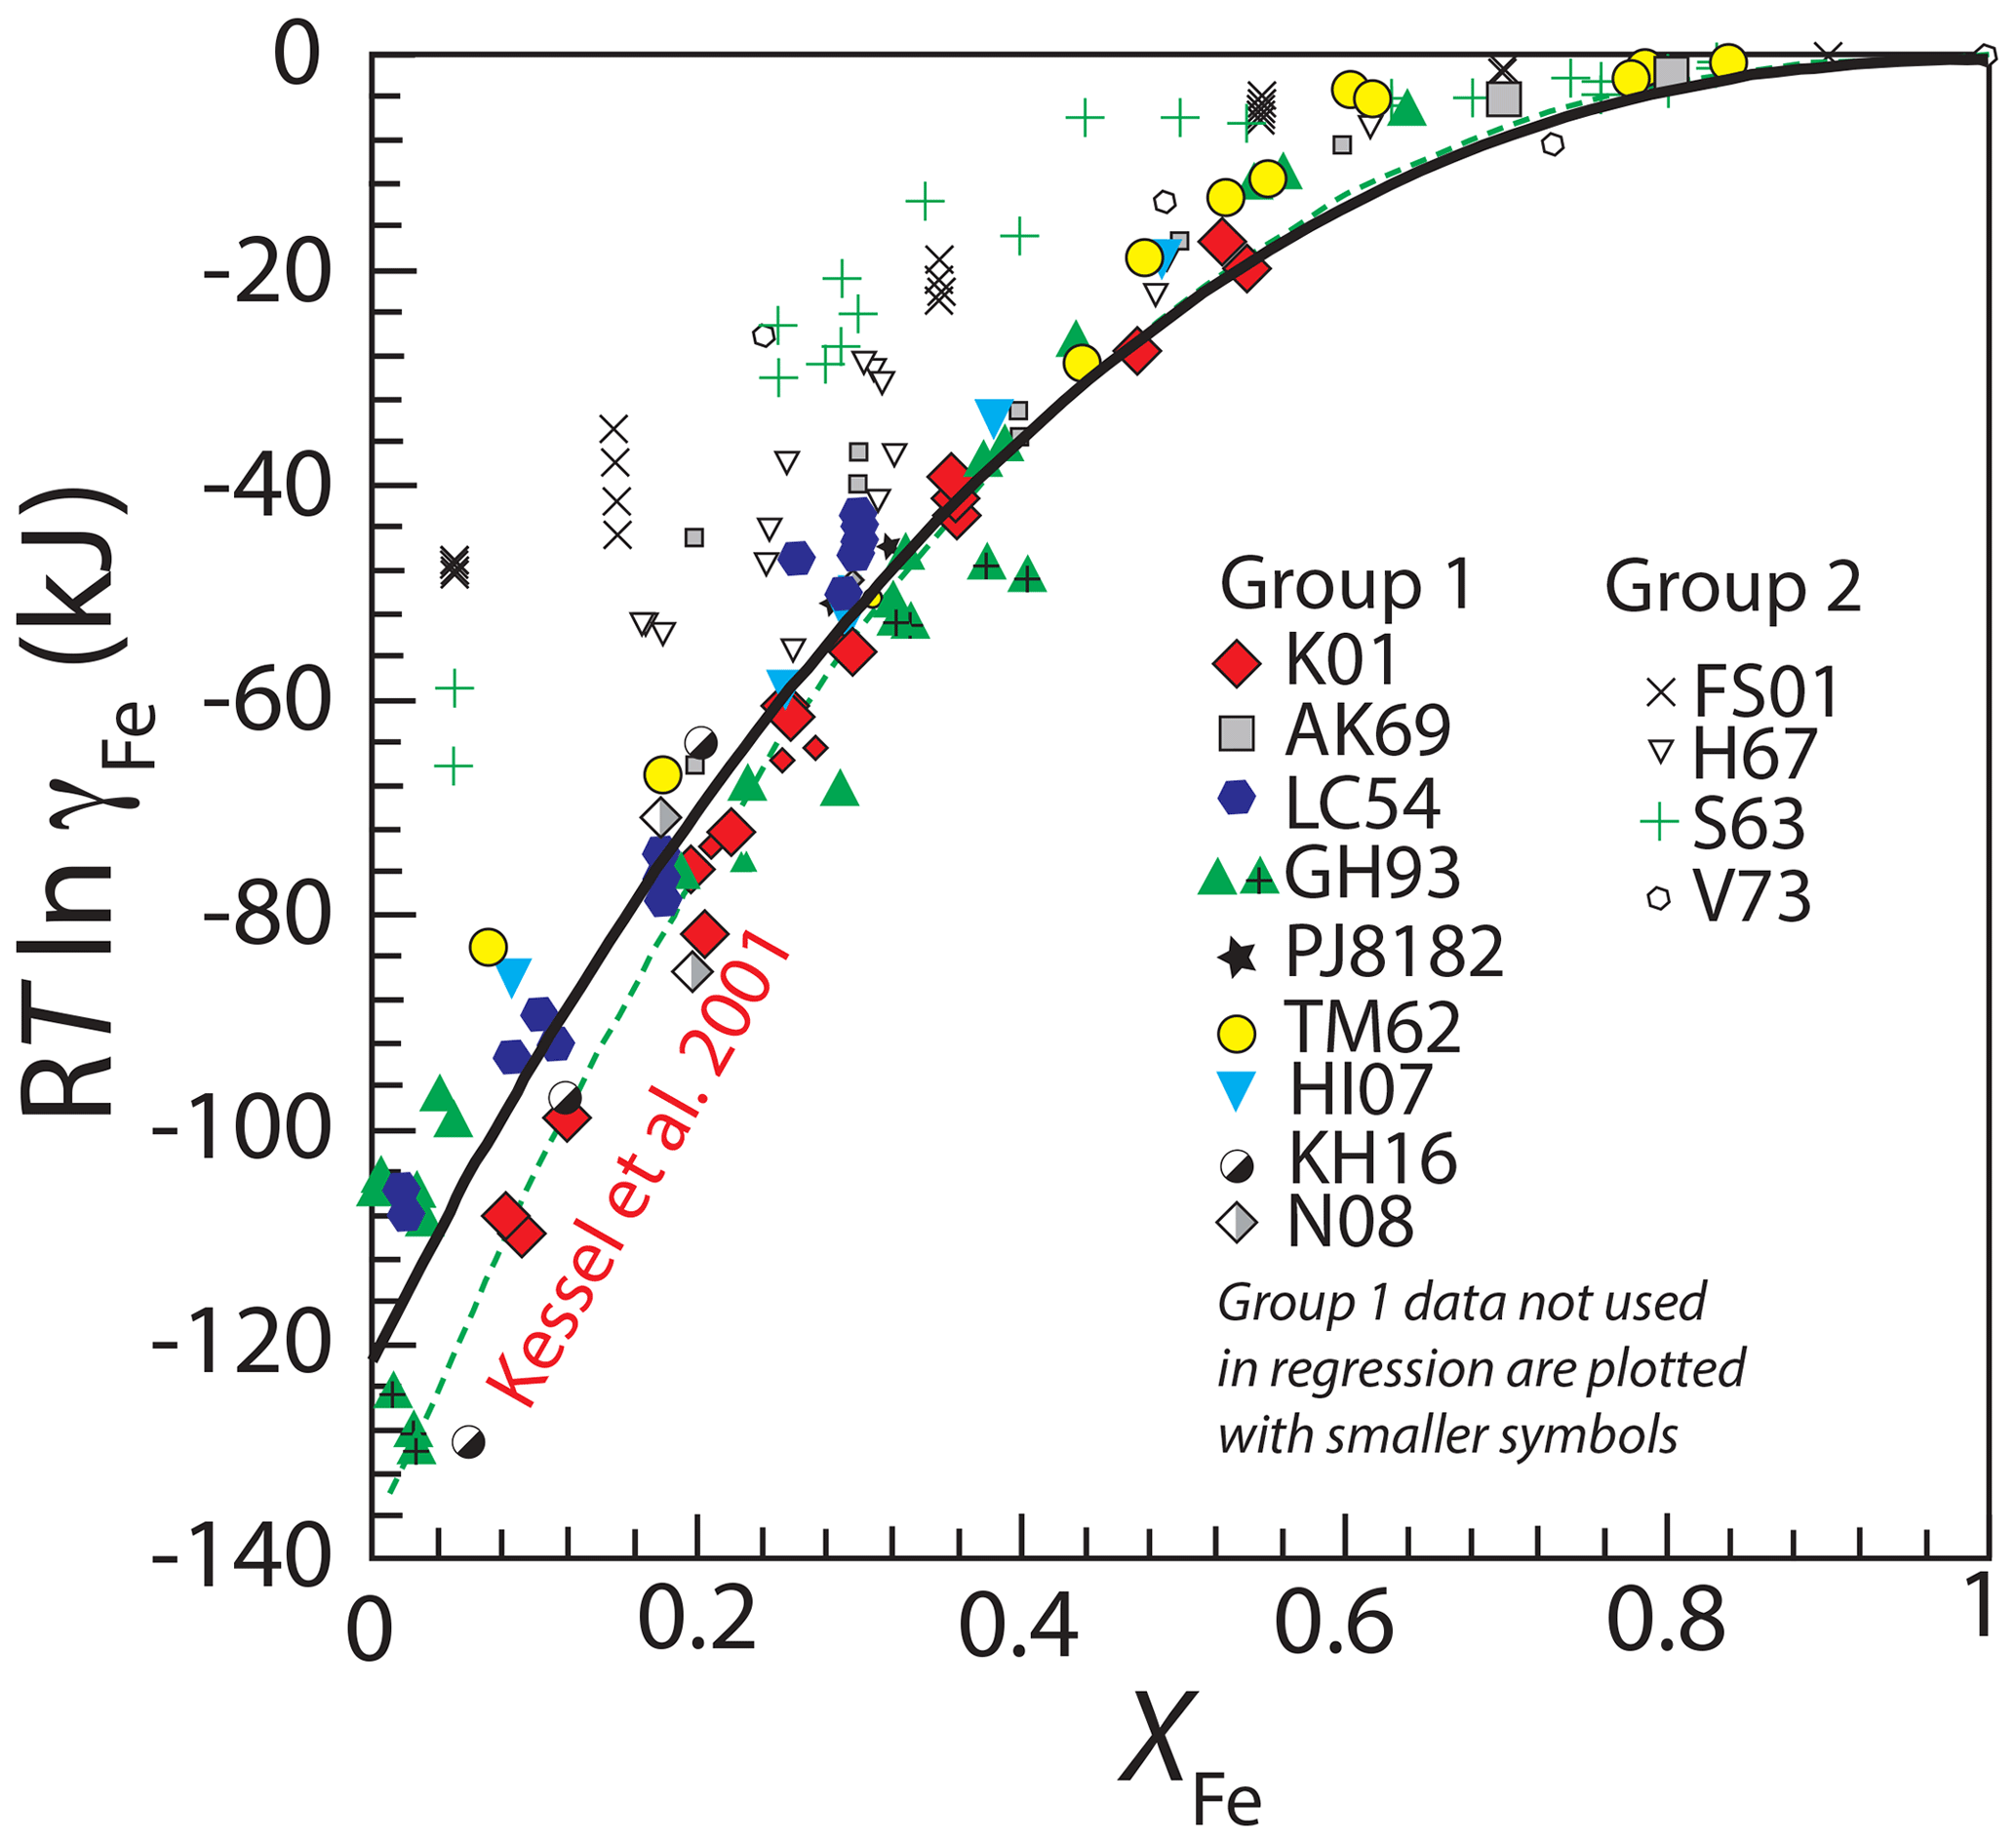
Figure 2Experimental determinations of the non-ideality of Fe, expressed as RTln γFe, in fcc FePt alloy. For sources of data and a key to the references, see Table 1. All data are from 100 kPa except for the seven experiments at 2 GPa from Gudmundsson and Holloway (1993) that are marked with “+” and which have been adjusted for pressure as described in the text. The data are divided into two groups, Group 1 studies, shown in filled symbols, were used to regress the thermodynamic model for FePt mixing. Group 2 studies, shown in unfilled symbols, were not used in calibration. Also data from Group 1 which plot inside the temperature–composition space of ordered FePt phases or in two-phase fields according to the phase diagram of Cabri et al. (2022) are not used in the final regression of interaction parameters and are plotted with smaller symbols (see text for explanation). The best fit to the remaining Group 1 data, regressed using Eq. (7), is shown with the black curve. Also shown is the fit given by Kessel et al. (2001) (dashed green curve).
We first fit the data from Group 1 to an asymmetric regular solution model, (Eq. 7), with regressed parameters kJ mol−1 and kJ mol−1 (Fig. 2). However, some of the compositions in these experiments may also have undergone unmixing or formation of ordered phases, as the stability of isoferroplatinum and tetraferroplatinum extends to 1350 and 1275 ∘C, respectively (Cabri et al., 2022). Of the 117 observations in the group, 20 plot within the temperature–composition fields of unmixed or ordered phases according to the phase diagram of Cabri et al. (2022). Therefore, we regressed independently the 97 observations that plot in the fcc field, yielding interaction parameters ( kJ mol−1 and kJ mol−1). The two sets of parameters are similar, indicating that the effect of phase diagram complexities on measured activities at high temperature is minimal. We adopt the set of parameters from the observations outside of miscibility gaps as the best approximation of γFe from Group 1 data (Table 2).
Table 2Interaction parameters for the thermodynamic models for fcc and liquid FePt alloy. The activity coefficient is given by (Eq. 7). Pressure dependencies of interaction parameters are given by (Eq.13), where P0=100 kPa.
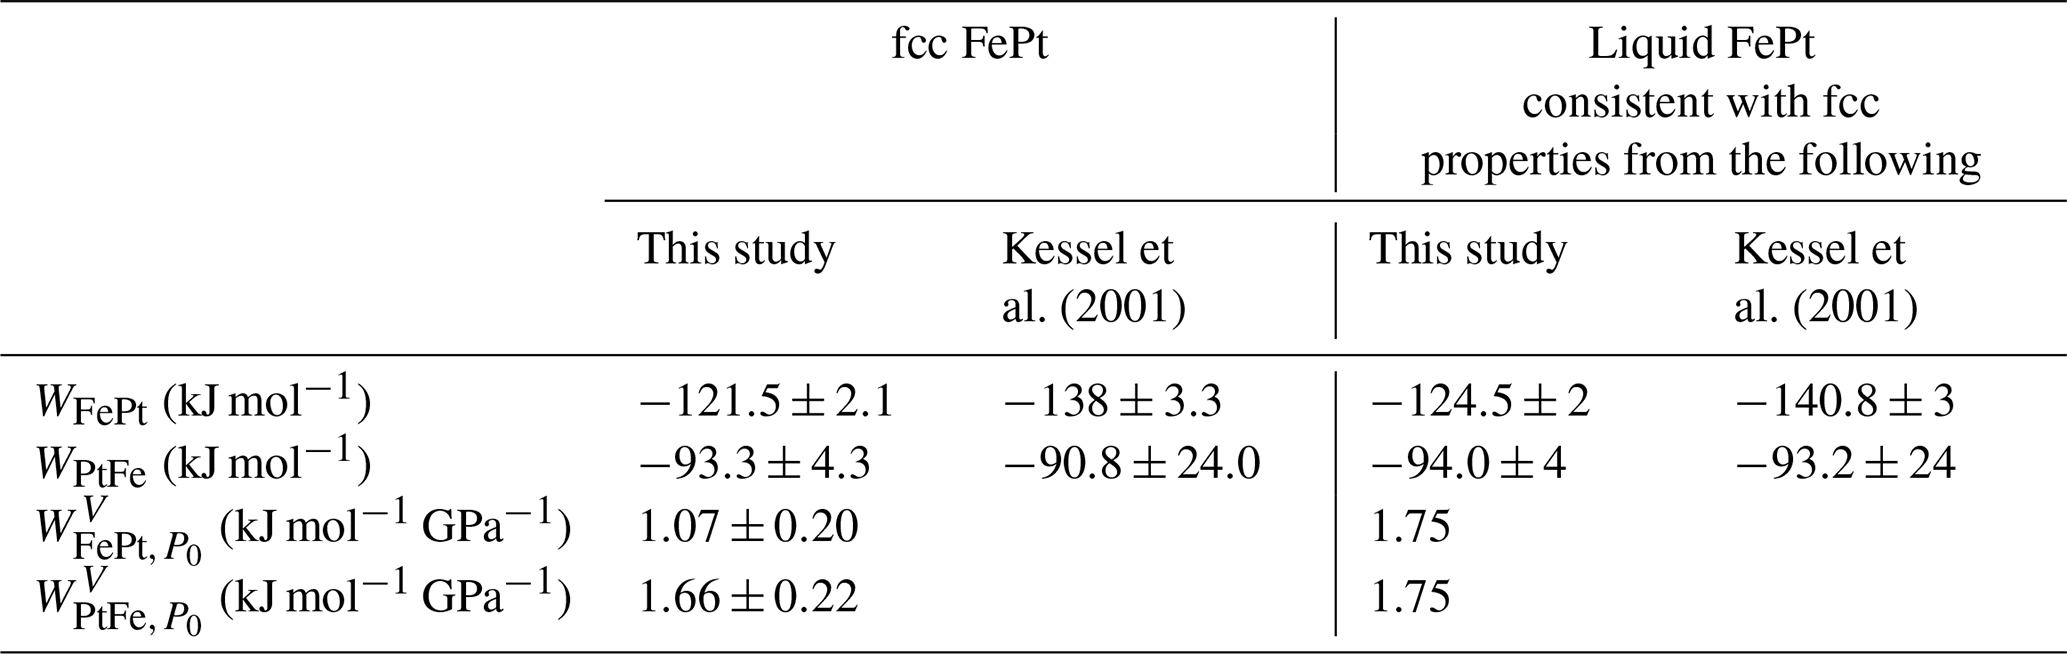
The regressed parameters are broadly similar to those from the widely used thermodynamic model of Kessel et al. (2001) ( kJ mol−1; kJ mol−1) (Table 2), and the two different curves predict similar γFe values for much of the compositional range, but they diverge at Fe mole fractions below 0.2, with the model of Kessel et al. (2001) predicting larger deviations from ideality (Fig. 2). These lower values of γFe are near the lower bound of a spread of experimental values in the Group 1 experiments at low XFe (Fig. 2). The reasons for these disagreements are not clear, as both high and low values within this population include modern studies that employed similar experimental and analytical techniques. Consequently, in subsequent calculations here we employ both the new fit and the model of Kessel et al. (2001), and in the Discussion we consider further the quantitative differences between the two.
3.2 Properties of liquid FePt alloy
Knudsen cell determinations of Fe activity in molten FePt alloy at 1819–1898 K from Alcock and Kubik (1968) indicate significant negative deviations from ideality which resemble those found for fcc alloy (Fig. 3). Unfortunately, the measurements include only compositions with XFe≥0.4, and therefore they do not constrain well the properties of Pt-richer alloys. However, a more complete picture of the mixing properties of molten FePt alloy can be gleaned from the topology of FePt melting relations.
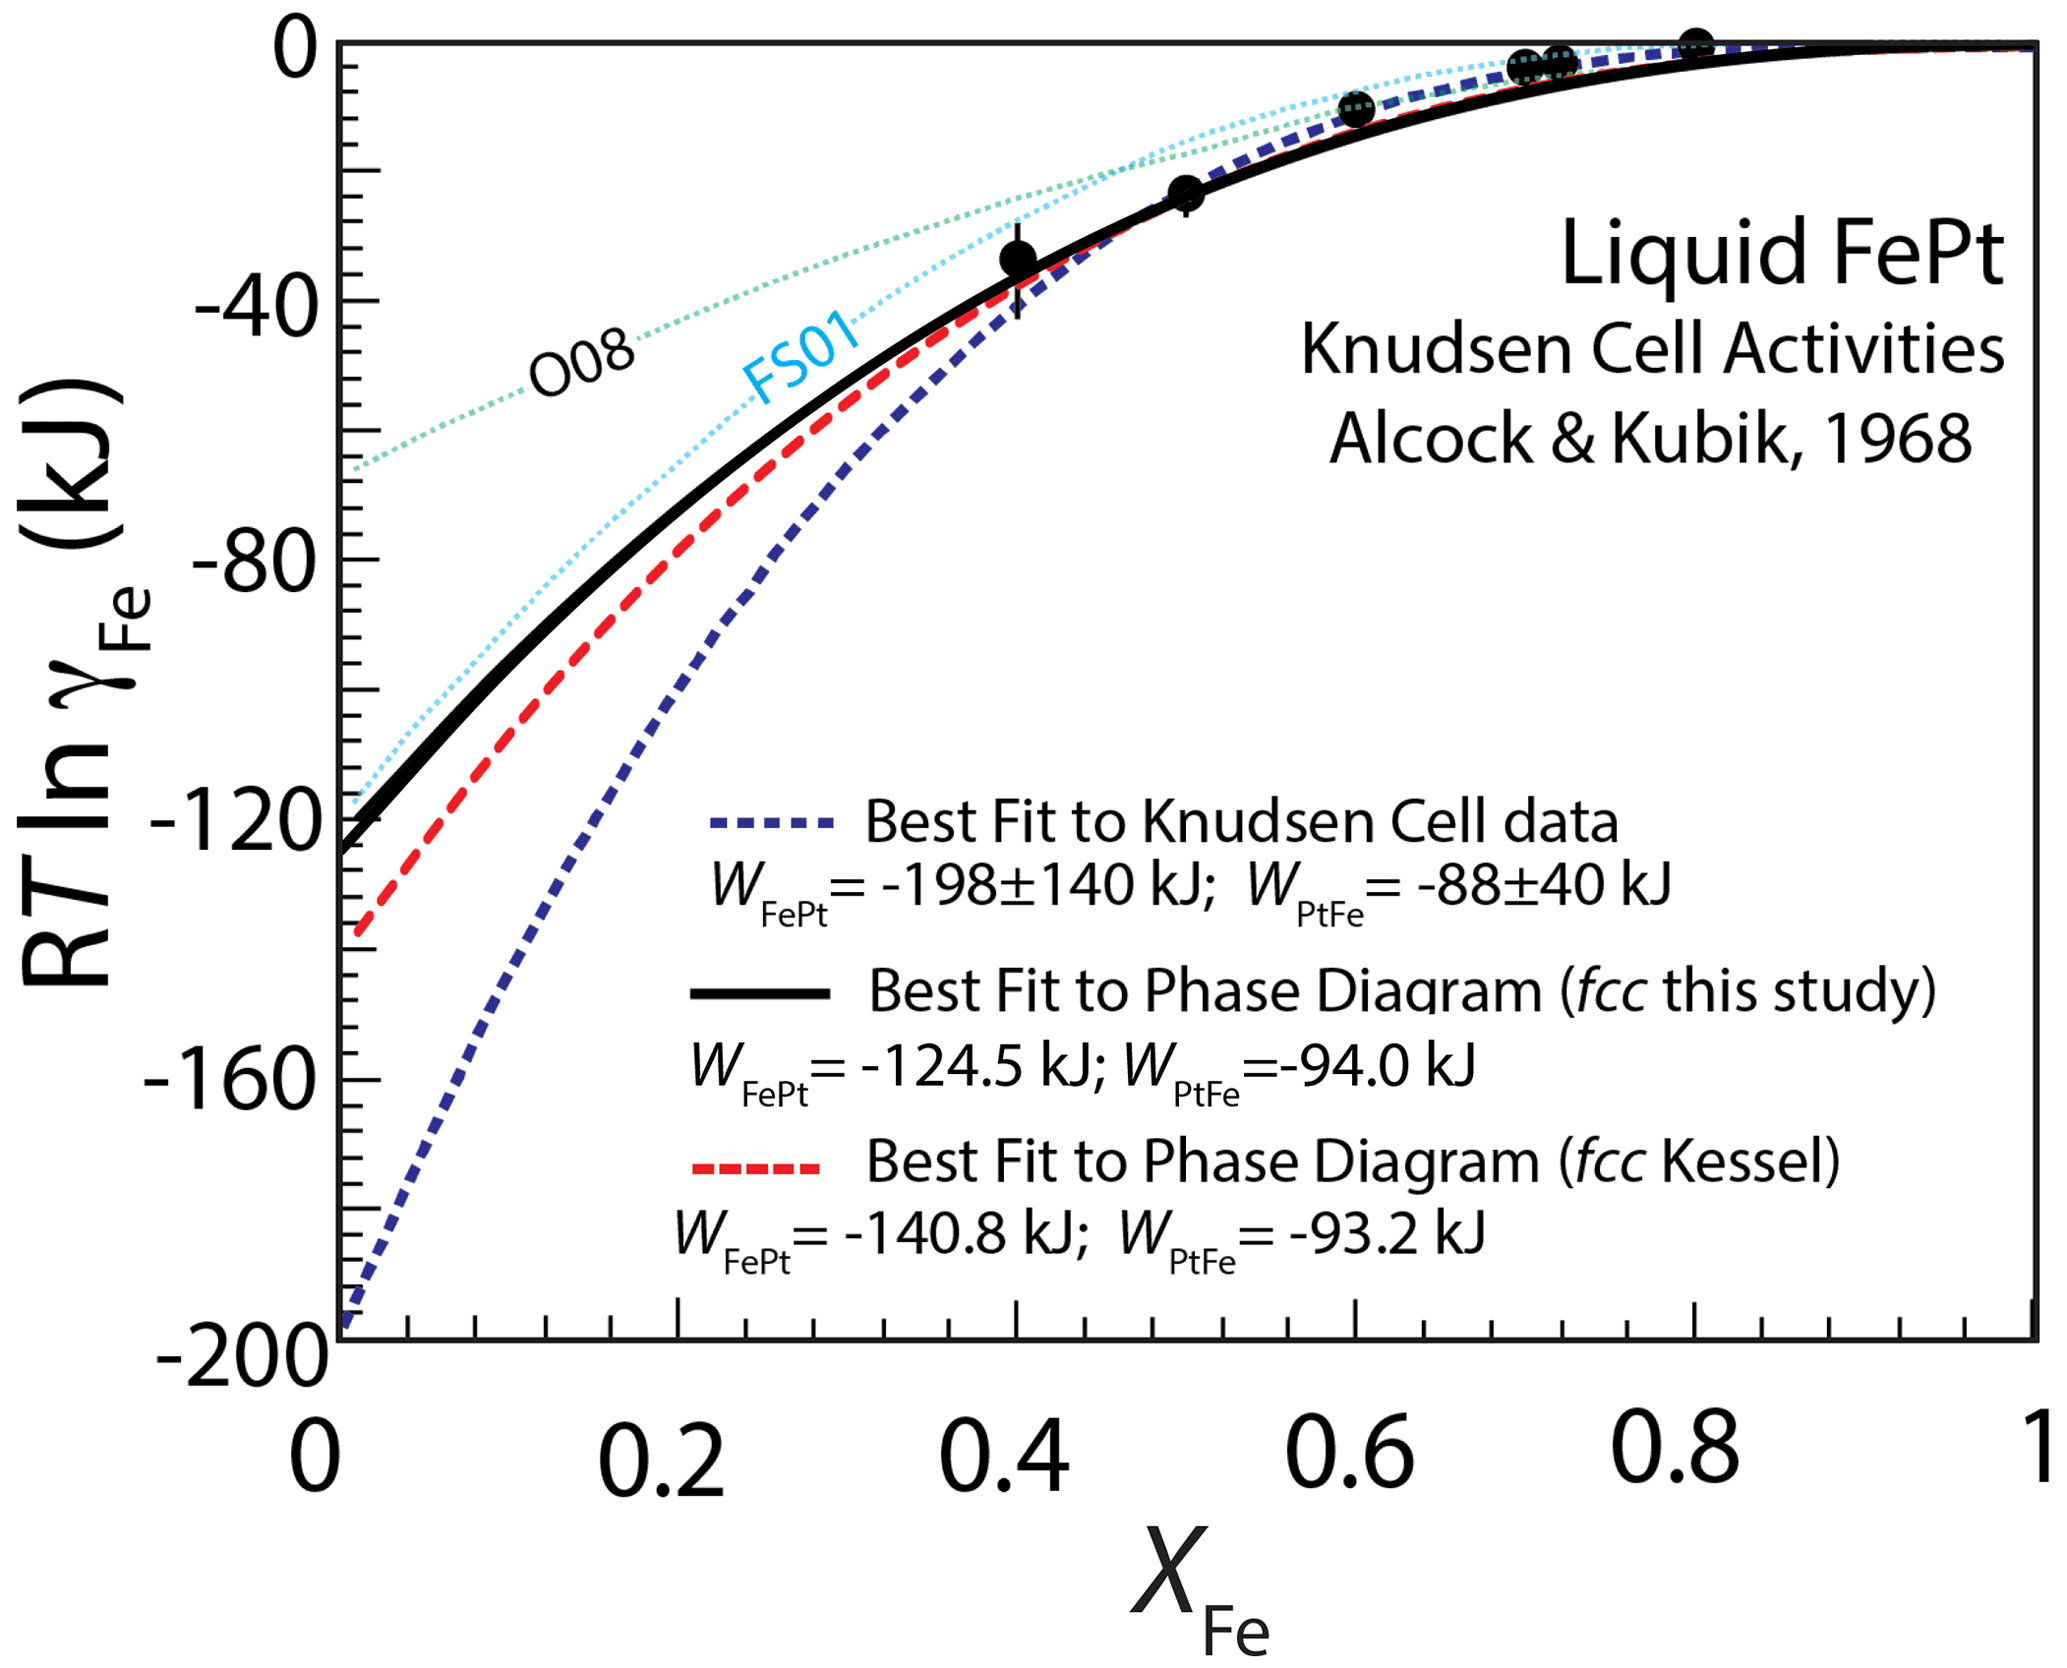
Figure 3Experimental determinations of the activity coefficient of Fe in FePt liquid by Knudsen cell mass spectrometry at 1818–1898 K (Alcock and Kubik, 1968) as a function of composition. The best fit to these data, applying Eq. (7), gives and values of and kJ mol−1. The large uncertainties in these parameters are partly owing to the lack of data for Pt-rich compositions. Alternative parameters, derived from matching the FePt liquidus (Fig. 4), also provide reasonable fits to the Knudsen cell data. Also shown for reference are the liquid mixing models of Fredriksson and Sundman (2001) (FS01) and Odusote (2008) (O08), calculated at 1875 K.
Activity–composition relations for liquid FePt alloy can be described with the same asymmetric regular solution formalism as applied to fcc alloy (Eq. 7). A least-squares fit to the Knudsen cell data gives values of and of and kJ mol−1, respectively. As indicated by the magnitude of the uncertainties, these data do not yield statistically well-defined parameters and taken in isolation would be better described by a simpler one-parameter mixing model. However, when constraints from FePt solid–melt equilibrium are considered via the phase diagram, it is apparent that a two-parameter fit is needed.
The principal observations of the melting behavior of FePt alloy across its compositional range remain the pioneering experiments of Isaac and Tammann (1907), who defined distinct liquidus and solidus curves separated by up to 100 ∘C (Fig. 4). Subsequent studies include melting experiments by Buckley and Hume-Rothery (1959), which are limited to compositions , in the region where both fcc and body-centered cubic (bcc) alloy are liquidus phases, and differential thermal analysis (DTA) for three compositions by Fredriksson (2004). The latter results are in excellent agreement with the liquidus defined by the original Isaac and Tammann (1907) experiments but provide no confirmation of their solidus. Unfortunately, Isaac and Tammann (1907) provided little detail about their solidus detection method and appear to have relied principally on metallographic textures of quenched experimental products.
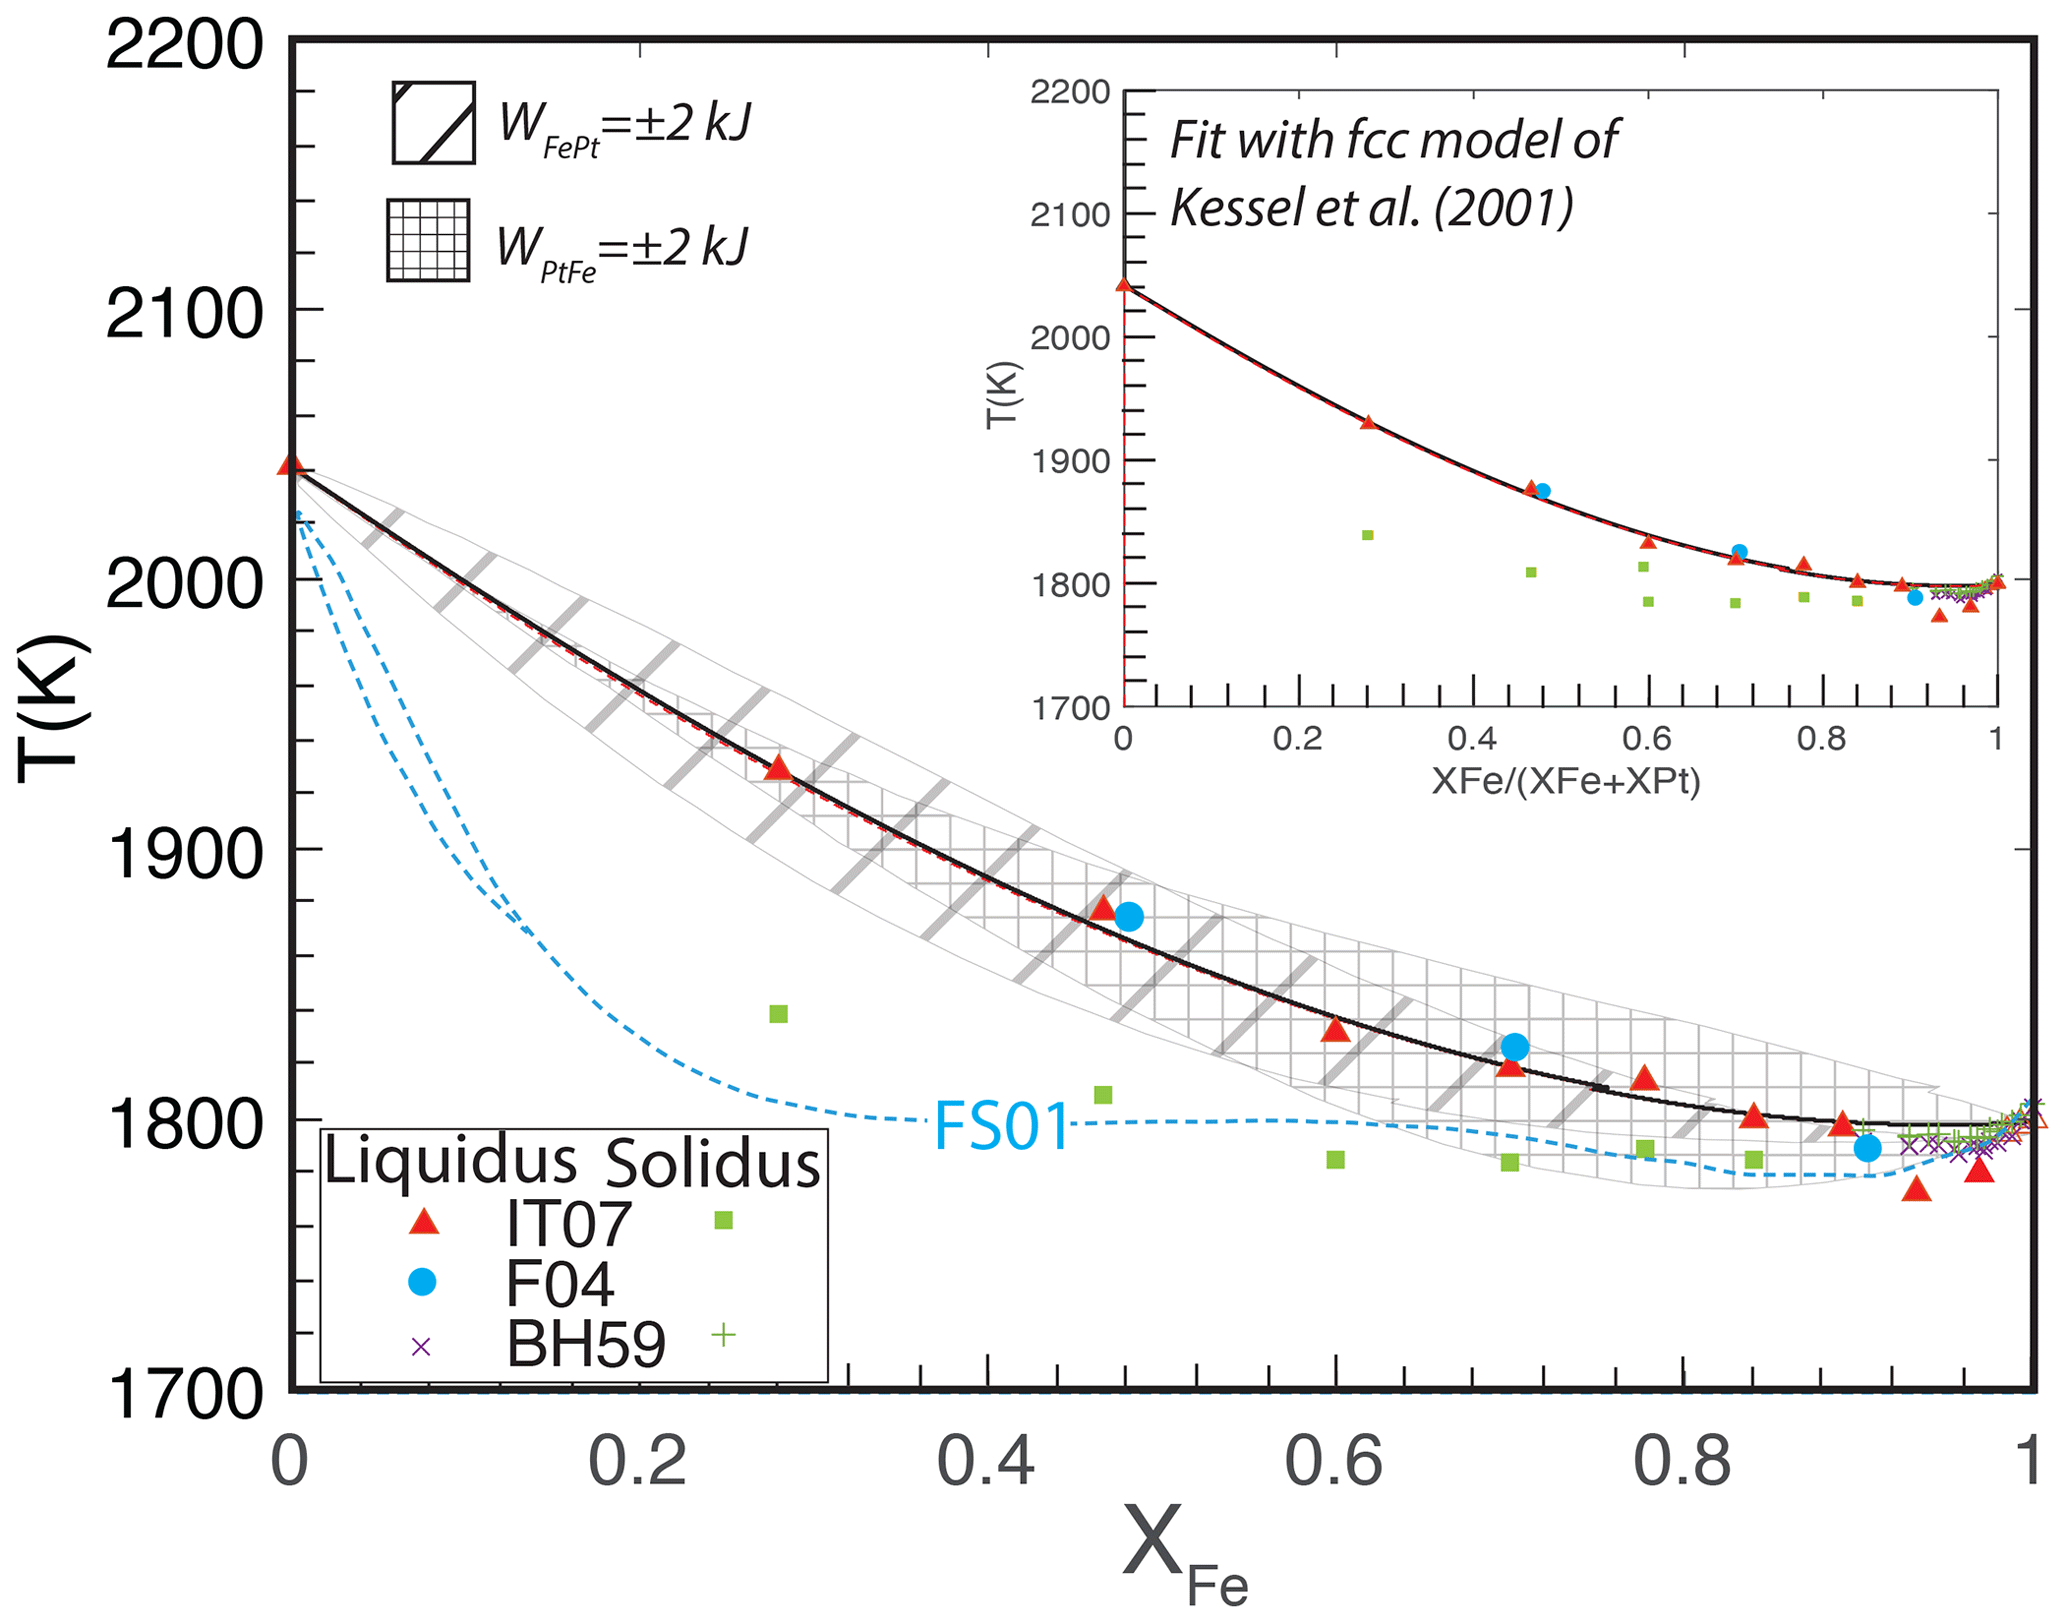
Figure 4Experiments and calculations of the FePt melting relations at 100 kPa. Experimental data from Isaac and Tammann (1907) (IT07), Buckley and Hume-Rothery (1959) (BH59), and Fredriksson (2004) (F04). The calculations, with the fcc thermodynamic model regressed in this work (Fig. 2) and liquid parameters of kJ mol−1 and kJ mol−1, show the trace of the liquidus curve (black curve) and also the solidus curve (dashed red curve, barely visible below the liquidus). Envelopes around the calculated liquidus curve show displacement from varying the liquid mixing parameters ( and by ±2 kJ mol−1. The large displacements of the envelope illustrate how sensitive the melting-loop topology is to the melt mixing parameters. Also shown are the melting relations calculated by Fredriksson and Sundman (2001), which approximate the solidus locations reported by Isaac and Tammann (1907) but do not reproduce the experimental liquidus temperatures. The inset shows an alternative fit to the melting data using the fcc mixing model of Kessel et al. (2001). The match to the experimental data is similar but with liquid parameters of kJ mol−1 and kJ mol−1.
For analysis of the binary FePt melting loop, we consider the thermodynamics of solid (fcc) and molten Fe from the SGTE database of Dinsdale (1991). Unfortunately, the SGTE database has a G function for fcc Pt that possesses a pronounced discontinuity near the fusion temperature, making calculations near the melting point unreliable. Instead, we employ the properties of fcc and molten Pt from Arblaster (2005). Our analysis neglects the stabilization of the bcc phase, as this is stable only for very Fe-rich compositions and for a narrow span of pressures and temperatures (Buckley and Hume-Rothery, 1959; Komabayashi and Fei, 2010).
Owing to the small values of the enthalpy of fusion for Fe and Pt, the width of the calculated two-phase melting loop is expected to be extremely narrow. For example, Alcock and Kubik (1968) calculated that the region of solid and liquid coexistence should span less than 10 ∘C. Fredriksson and Sundman (2001) also predicted a narrow melting loop <5 ∘C wide except for very Pt-rich compositions (XFe<0.1), where their predicted melting loop becomes steep (Fig. 4). Given that the enthalpies of fusion of pure Fe and Pt are well-constrained, no combination of liquid activity coefficients could produce a topology with a substantially larger melting interval (Pelton, 2001). A narrow melting loop is consistent with the experimental study on Fe-rich compositions by Buckley and Hume-Rothery (1959) for Fe-rich compositions but inconsistent with the wider two-phase region inferred by Isaac and Tammann (1907). Because the DTA observations of Fredriksson (2004) affirm the liquidus trend of Isaac and Tammann (1907) and because the latter's solidus detection method is not known, we focused our fitting procedure on this feature and have not attempted to reproduce the solidus reported by the latter.
For an assumed set of mixing parameters for the solid fcc phase, together with endmember properties of Fe and Pt solid and liquid, the position and shape of the calculated liquidus are highly sensitive to the liquid mixing properties, and so fitting the liquidus allows refinement of the liquid parameters with small uncertainties. Using the mixing properties of fcc alloy regressed in this work, kJ mol−1 and , liquid parameters are kJ mol−1 and kJ mol−1 (Table 2). The solidus calculated with these same parameters, also shown in Fig. 4, tracks the liquidus curve quite closely and is displaced downward by ∼ 5 ∘C.
Figure 4 also shows the ±2 kJ mol−1 uncertainty envelopes about the fitted liquidus curve. As can be seen, the calculated liquidi at the extrema of these envelopes are displaced significantly from the experimentally determined liquidus locations such that varying one of the mixing parameters by 2 kJ corresponds to a displacement of the liquidus of approximately 50 ∘C across much of the composition range. Therefore, though more plentiful modern determinations of the Fe–Pt melting loop would be welcome, they would not change the inferred mixing properties of FePt liquid by large amounts unless the revised melting temperatures were found to be quite different from those illustrated in Fig. 4. However, we note that these liquid parameter uncertainties cannot be smaller than the uncertainties in fcc interaction parameters, as variation in the latter maps nearly linearly to that of the former. Therefore, if the fcc parameters regressed in this work are considered to be the most accurate, the uncertainties in FePt liquid interaction parameters are, conservatively, ±4 kJ mol−1.
An alternative fit to the liquid interaction parameters can also be derived by adopting the fcc solid mixing parameters of Kessel et al. (2001). These reproduce the experimental melting relations with similar fidelity to the fit for the newly regressed parameters (inset, Fig. 4) but with liquid interaction parameters of kJ mol−1 and kJ mol−1 (Table 2).
Both liquid parameter fits to the phase equilibria data (Fig. 4) predict activity coefficients in liquid FePt alloy that are reasonable matches to those determined from the Knudsen cell measurements (Fig. 3). In detail, both predict activity coefficients that are a little lower than most of the Fe-rich molten alloy Knudsen cell data, but the mismatches are close to analytical uncertainties. We therefore adopt the liquid alloy parameters derived from the position of the melting loop (Fig. 4) (Table 2), as the latter have great sensitivity to the experimental data.
3.3 The effect of pressure – excess volumes of mixing
Both synthetic and natural FePt alloys exhibit significant positive excess volumes (Fig. 5), though the latter offer less accurate measures owing to variable substitutions of additional base and platinum-group metals. Therefore we consider only synthetic alloys for parameterizing excess volumes of mixing. But first it is necessary to correct Fe-rich compositions for the effects of magnetostriction on ferromagnetic “Invar”-type alloys.
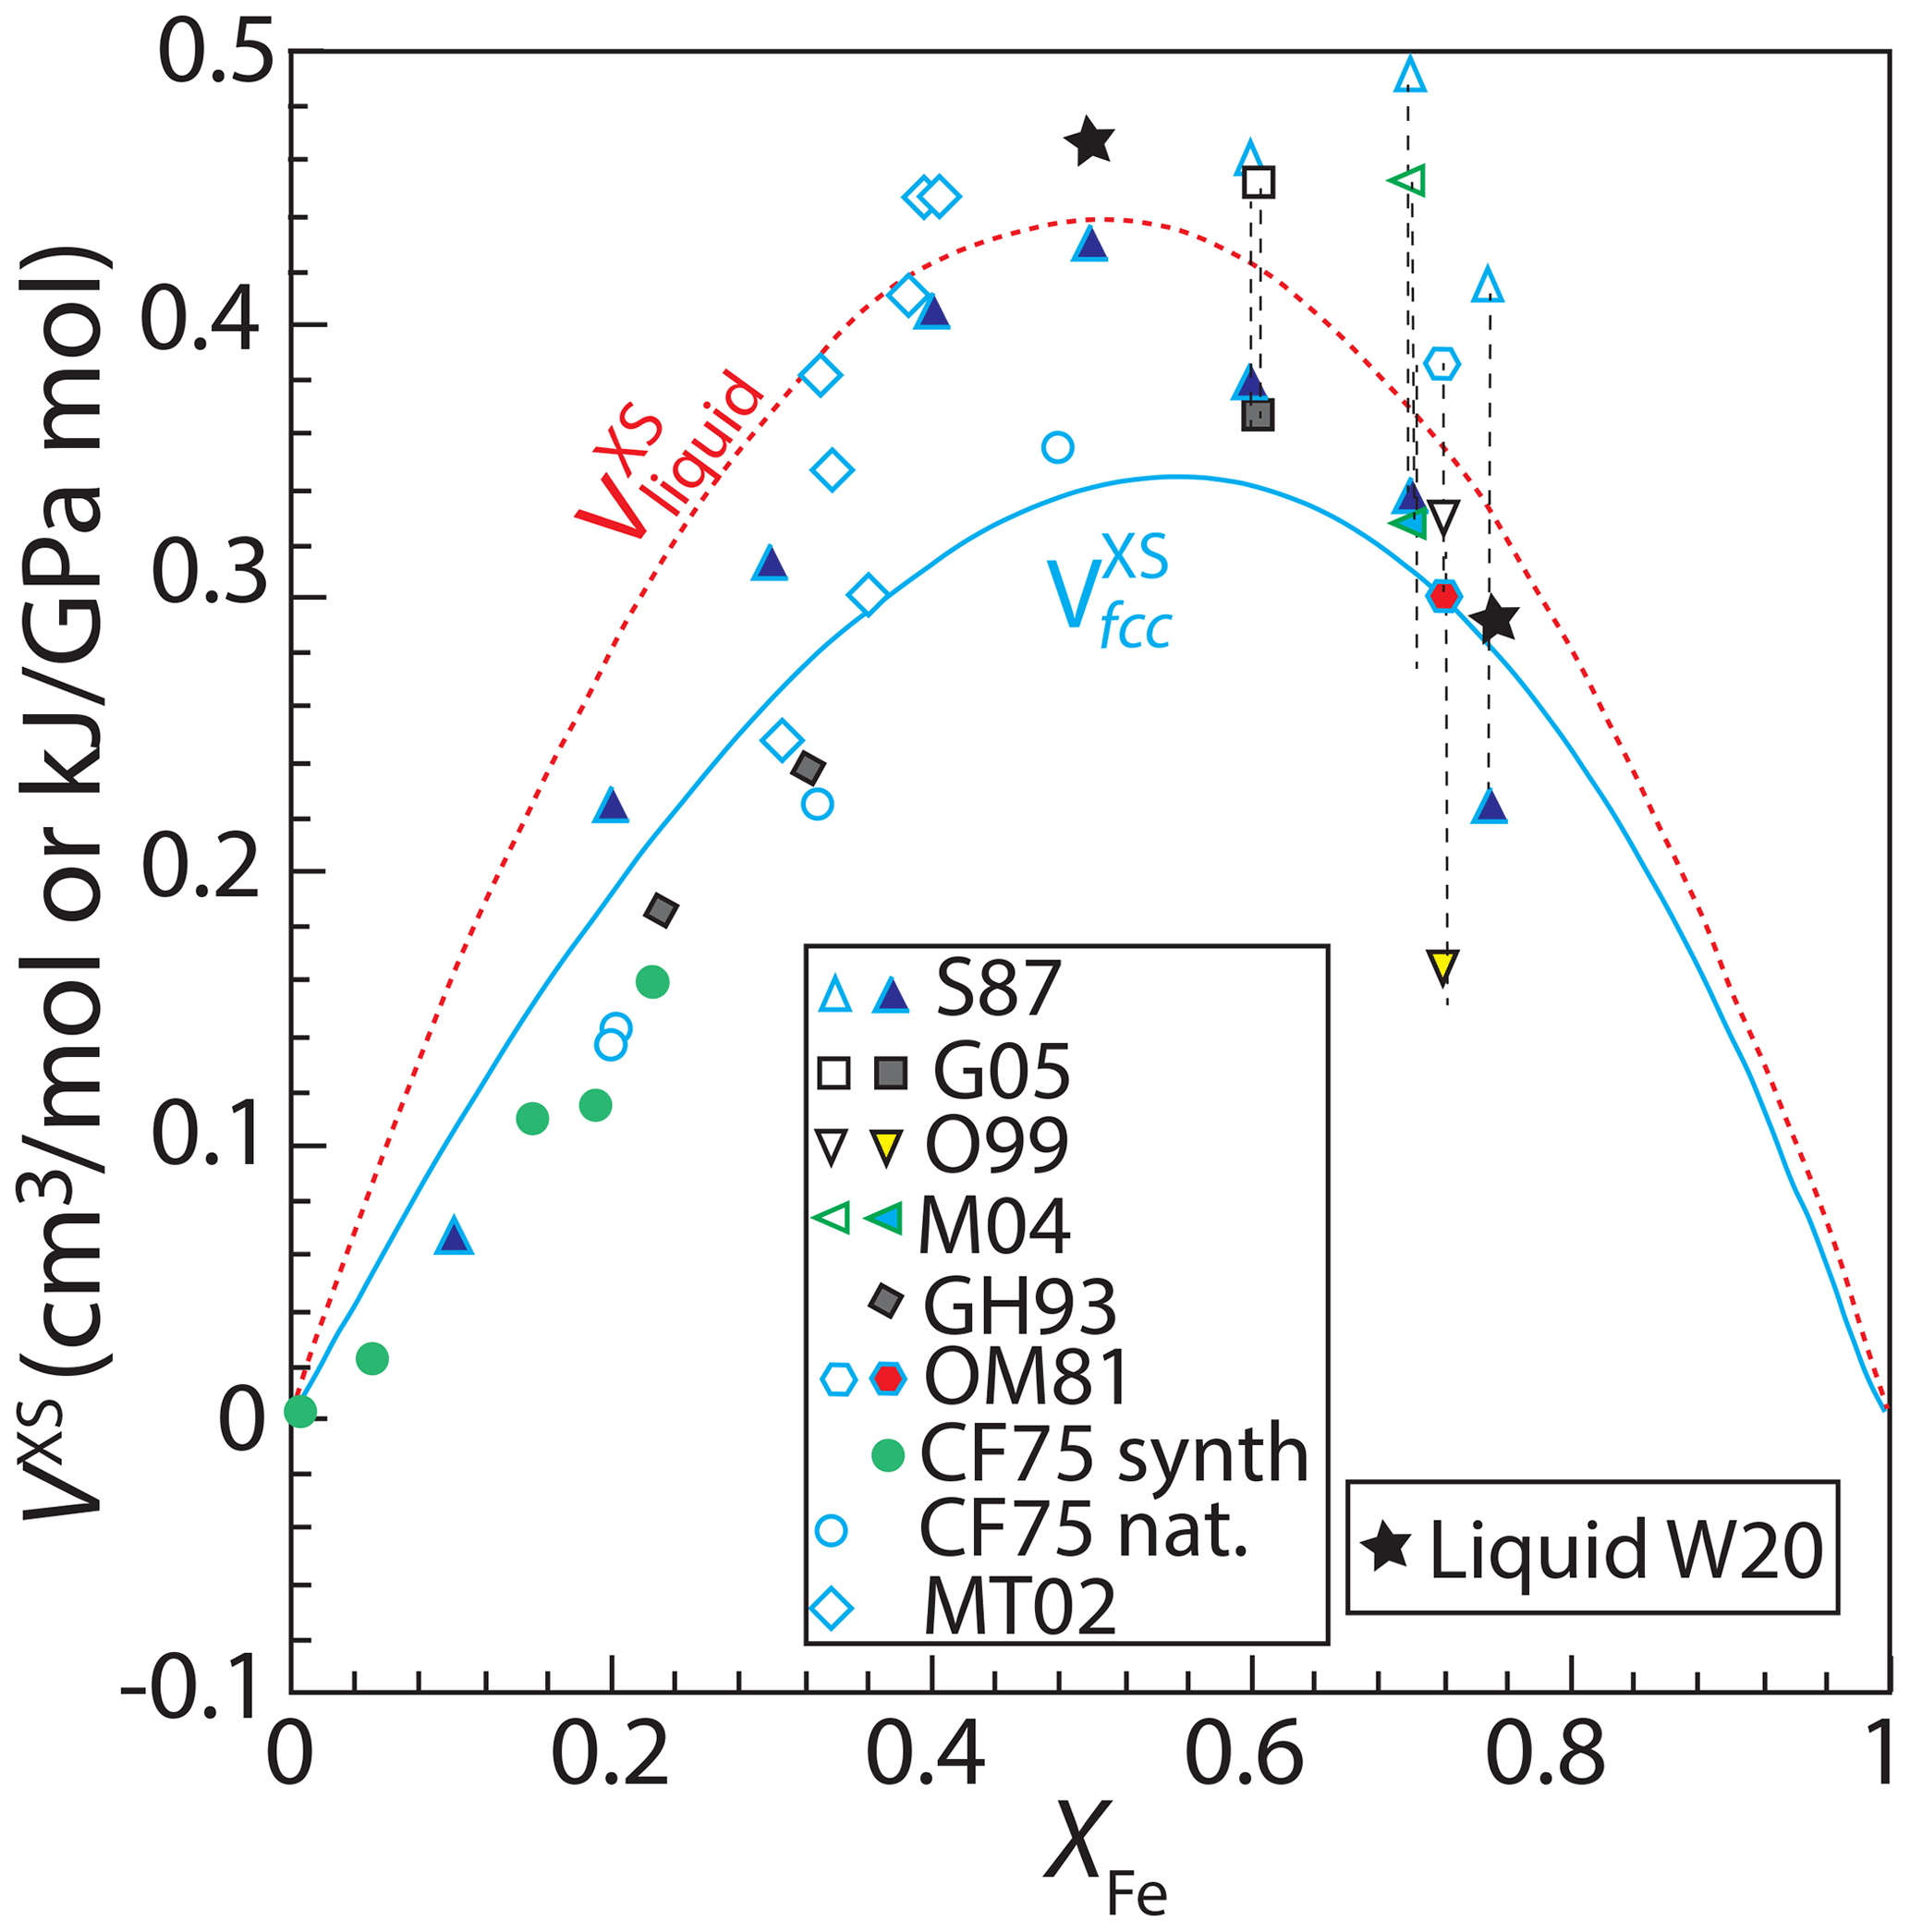
Figure 5Excess volumes of mixing, VXS, of synthetic and natural fcc structure FePt alloys at 298 K and of molten FePt alloy at 2000 K, both at 100 kPa. Synthetic fcc alloy data from Gudmundsson and Holloway (1993) (GH93), Gang et al. (2005) (G05), Cabri and Feather (1975) (CF75), Matsushita et al. (2004) (M04); Odin et al. (1999) (O99), Oomi and Mōri (1981a) (OM81), and Sedov (1987) (S87). Natural alloy data from Cabri and Feather (1975) and Malitch and Thalhammer (2002) (MT02). Vertical dashed lines join observed volumes of (open symbols) ferromagnetic fcc alloys with (solid symbols) volumes of paramagnetic phases of the same composition from the same study (Oomi and Mōri, 1981a), or extrapolated from high-pressure paramagnetic data (Matsushita et al., 2004; Odin et al., 1999), or volumes corrected for the effects of magnetostriction using Eq. (14) (Sedov, 1987; Gang et al., 2005). The solid curve gives the VXS function (Eq. 11), fit only to synthetic data for paramagnetic alloys and corrected ferromagnetic alloys (all shown as solid symbols). Natural crystals and uncorrected ferromagnetic crystals (all open symbols) were not used for the fit. Also shown are volumes of liquid FePt alloy at 2000 K (Watanabe et al., 2020) and the fit to those data (dashed curve) (Eq. 11). Values of VXS are calculated according to Eq. (10), where volumes of pure Fe and Pt were taken from the same study in which the FePt alloy volume was reported or, if not reported, was 6.835 cm3 mol−1 for Fe (Komabayashi and Fei, 2010) and 9.091 cm3 mol−1 for Pt (Arblaster, 1997) at 100 kPa. We do not consider data from ordered low-temperature alloys such as isoferroplatinum and tetraferroplatinum, as their volumes are affected by the phase change and the thermodynamic mixing model of interest applies only to the fcc high-temperature phase. Considering only synthetic fcc phases, corrected where necessary for the effects of magnetostriction, we regress an excess-volume mixing relation based on Eq. (11), leading to values of and of 1.07±0.20 kJ mol GPa−1 and 1.66±0.22 kJ mol GPa−1 (1 kJ GPa mol−1 = 1 cm3 mol−1) (Table 2).
Ferromagnetic FePt alloys display the Invar effect, in which magnetostriction produces anomalous volumes relative to the paramagnetic disordered state (Wassermann, 1991). At 100 kPa, FePt alloys have Curie temperatures greater than room temperature for compositions approximately between Fe75Pt25 and Fe30Pt70 (Vlaic and Burzo, 2010; Ponomaryova et al., 2014), although above ∼ 4 GPa they become paramagnetic at room temperature across their compositional range (Odin et al., 1999; Matsushita et al., 2004; Oomi and Mōri, 1981a). Density functional theory (DFT) calculations demonstrate that the anomalous volumes caused by the Invar effect are maximal near the peak of magnetization, which occurs at Fe75Pt25 (Hayn and Drchal, 1998), and diminish significantly for more Fe- or Pt-rich solutions, such that they are negligible for compositions that are Pt-richer than Fe50Pt50 (Khmelevskyi et al., 2003) and more Fe-rich than Fe75Pt25 (Hayn and Drchal, 1998). Figure 6 illustrates the effects of magnetostriction on FePt alloy volumes from both experiments (Franse and Gersdorf, 1986; Oomi and Mōri, 1981a; Odin et al., 1999) and molecular dynamics calculations (Khmelevskyi et al., 2005, 2003; Vlaic and Burzo, 2010). As noted by Khmelevskyi et al. (2005), theoretical calculations overpredict experimentally observed magnetostriction effects. Therefore, we correct experimentally observed excess volumes for ferromagnetic fcc FePt alloy between 0.5 < XFe < 0.75 according to the linear approximation shown in Fig. 6.
Based on density measurements for XFe=0.5, XFe=0.75, and pure Fe and Pt liquids at 1753–2354 K (Watanabe et al., 2020), liquid FePt alloys also have positive excess volumes of mixing (Fig. 5) which exceed those found for fcc alloys. Owing to the small number of constraints, these are best parameterized by a single symmetric excess volume of mixing of kJ mol GPa−1 (Fig. 5) (Table 2).
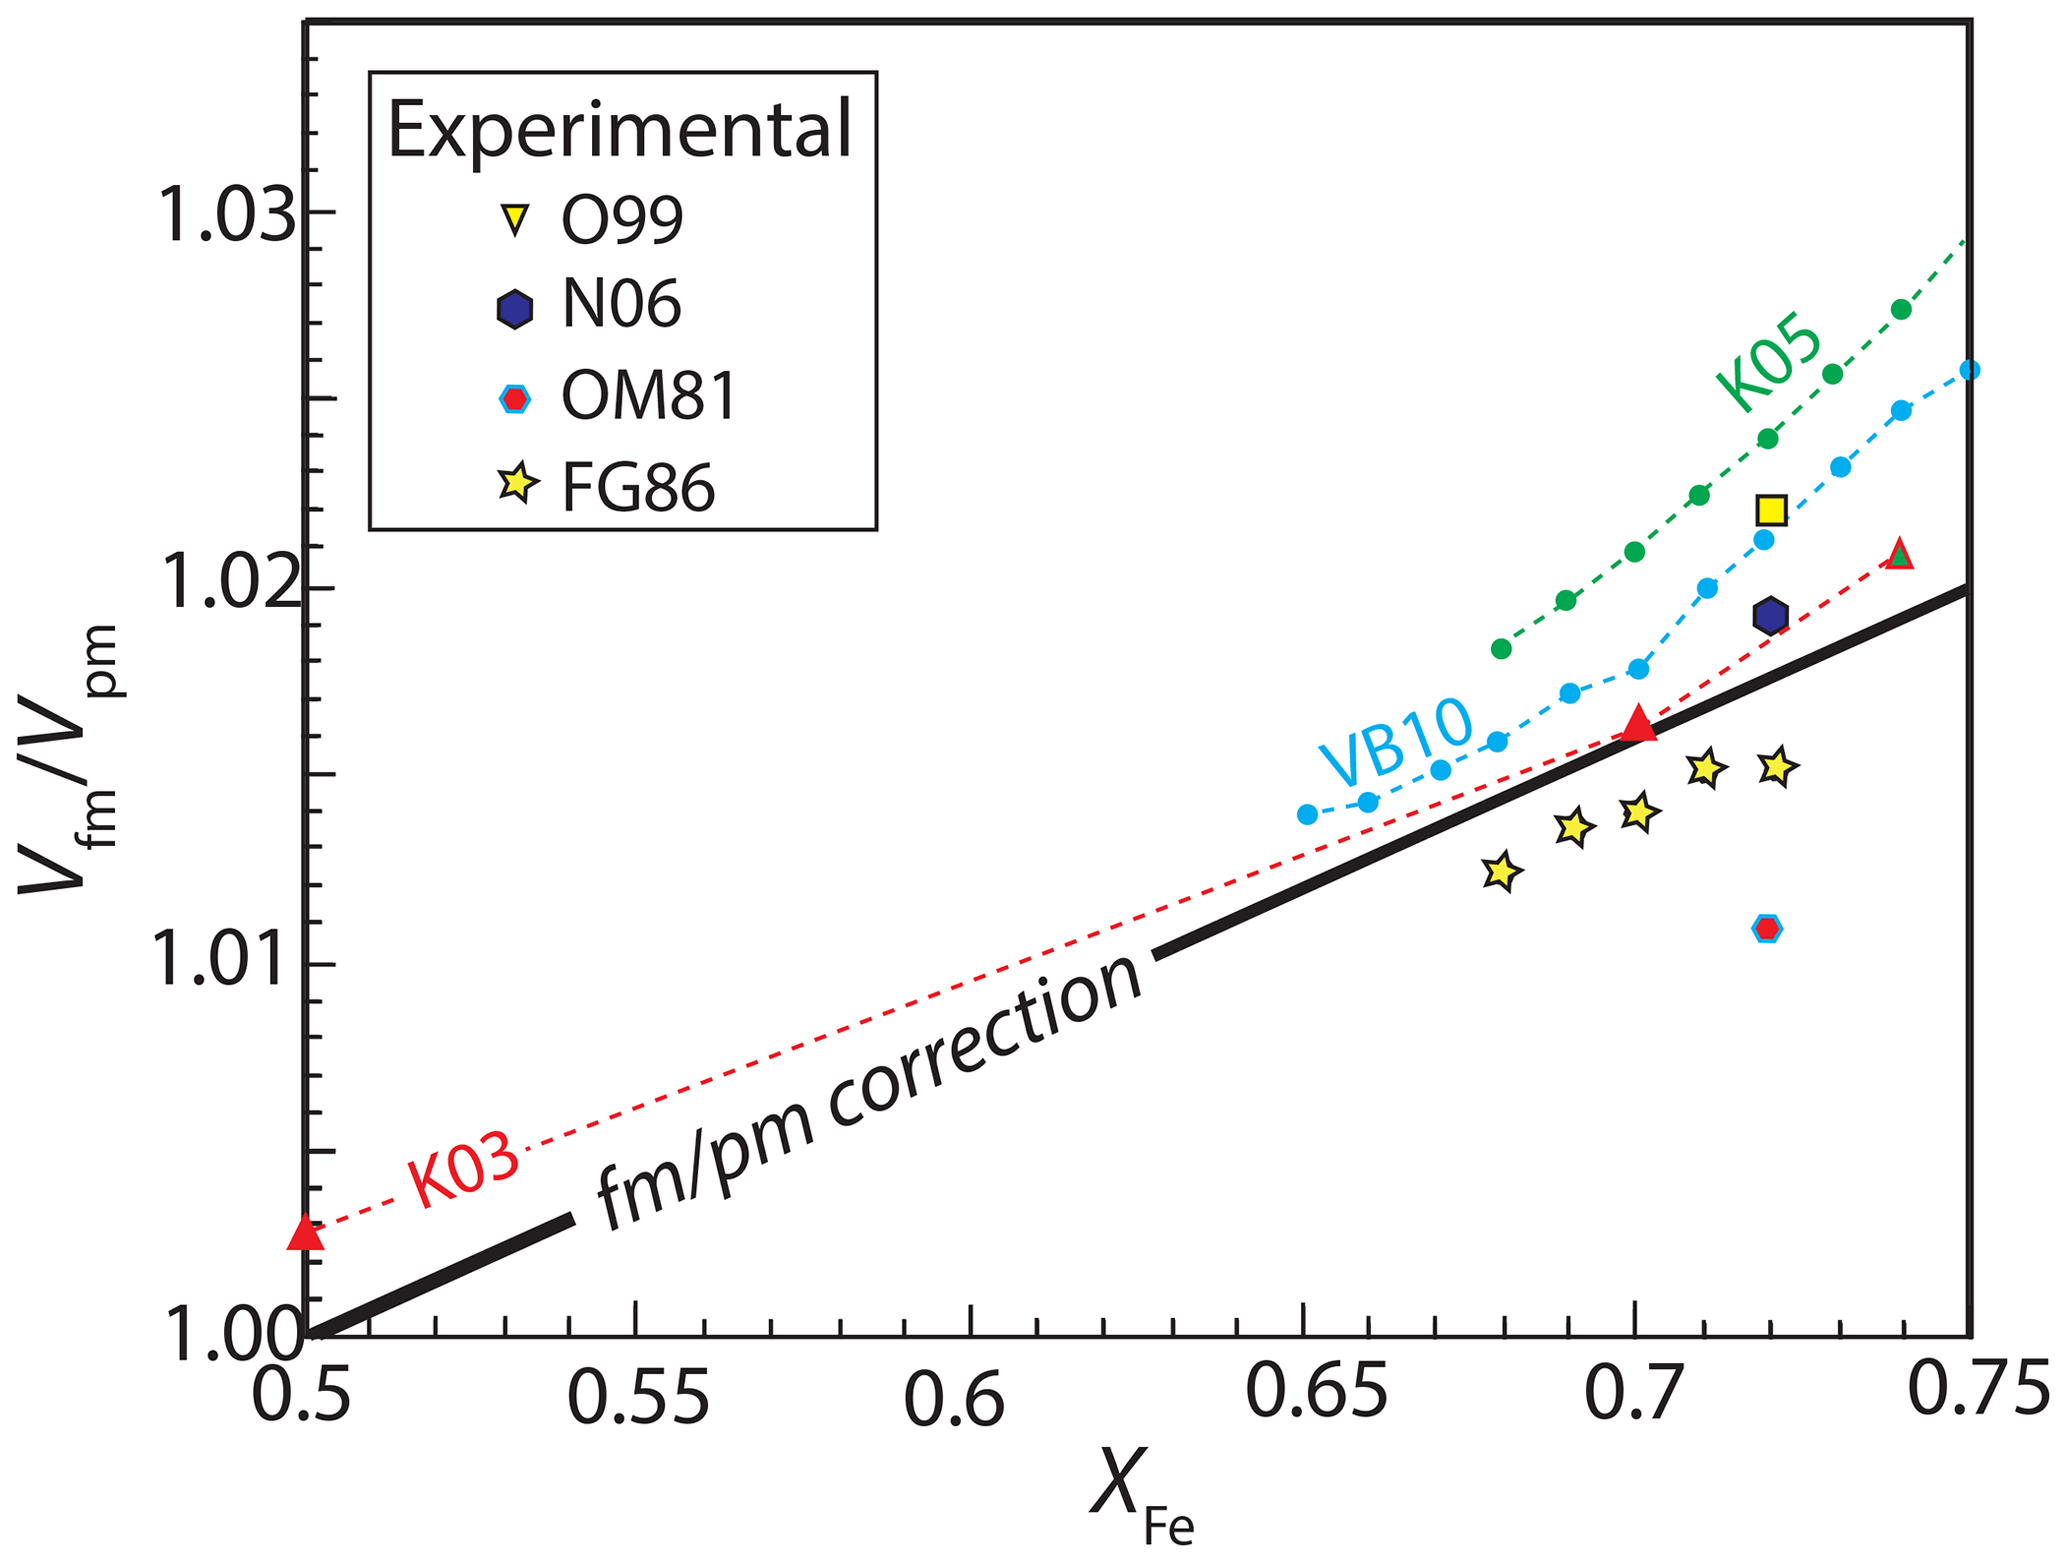
Figure 6The magnetostriction effect of the ferromagnetic-to-paramagnetic transition on molar volume for ferromagnetic fcc FePt alloys between . Magnetostriction is negligible for compositions outside this compositional range (Hayn and Drchal, 1998; Khmelevskyi et al., 2003). Ab initio calculations, shown with dashed lines connecting individual compositions, are from Khmelevskyi et al. (2003) (K03), Khmelevskyi et al. (2005)(K05), and Vlaic and Burzo (2010) (VB10), and experimental determinations are from Odin et al. (1999) (O99), Nataf et al. (2006) (N06), Oomi and Mōri (1981a) (OM81), and Franse and Gersdorf (1986) (FG86). For this compositional interval, corrections for the effect of magnetostriction on excess volumes of mixing of ferromagnetic fcc FePt alloys are calculated with the line labeled “fm/pm” (Eq. 14).
Activity coefficients of Fe, γFe in fcc FePt alloy, calculated at 2000 K with the values of and regressed in this work, are shown in Fig. 7a as a function of composition and pressure. Strongly negative deviations from ideality in Pt-rich compositions at low pressure, expressed as small values of γFe, become less pronounced with increasing pressure. The pressure dependence of γFe produces a decrease in calculated oxygen fugacity, relative to the iron–wüstite or similar buffer, for FePt alloy of a given composition coexisting with an assemblage that imposes a particular chemical potential of FeO (Fig. 7b). The latter could be olivine coexisting with orthopyroxene (Jamieson et al., 1992) or a silicate melt for which the activity coefficient of FeO can be estimated (Kessel et al., 2001; Medard et al., 2008). As previously noted by Kessel et al. (2001), the pressure effect is relatively small at moderate pressures imposed by piston cylinder experiments. For example, the pressure correction to log at 3 GPa and 1400 ∘C amounts to no more than 0.2 log units. But it becomes more pronounced at higher pressure, exceeding 2 log units for Pt-rich compositions above 40 GPa (Fig. 7b).
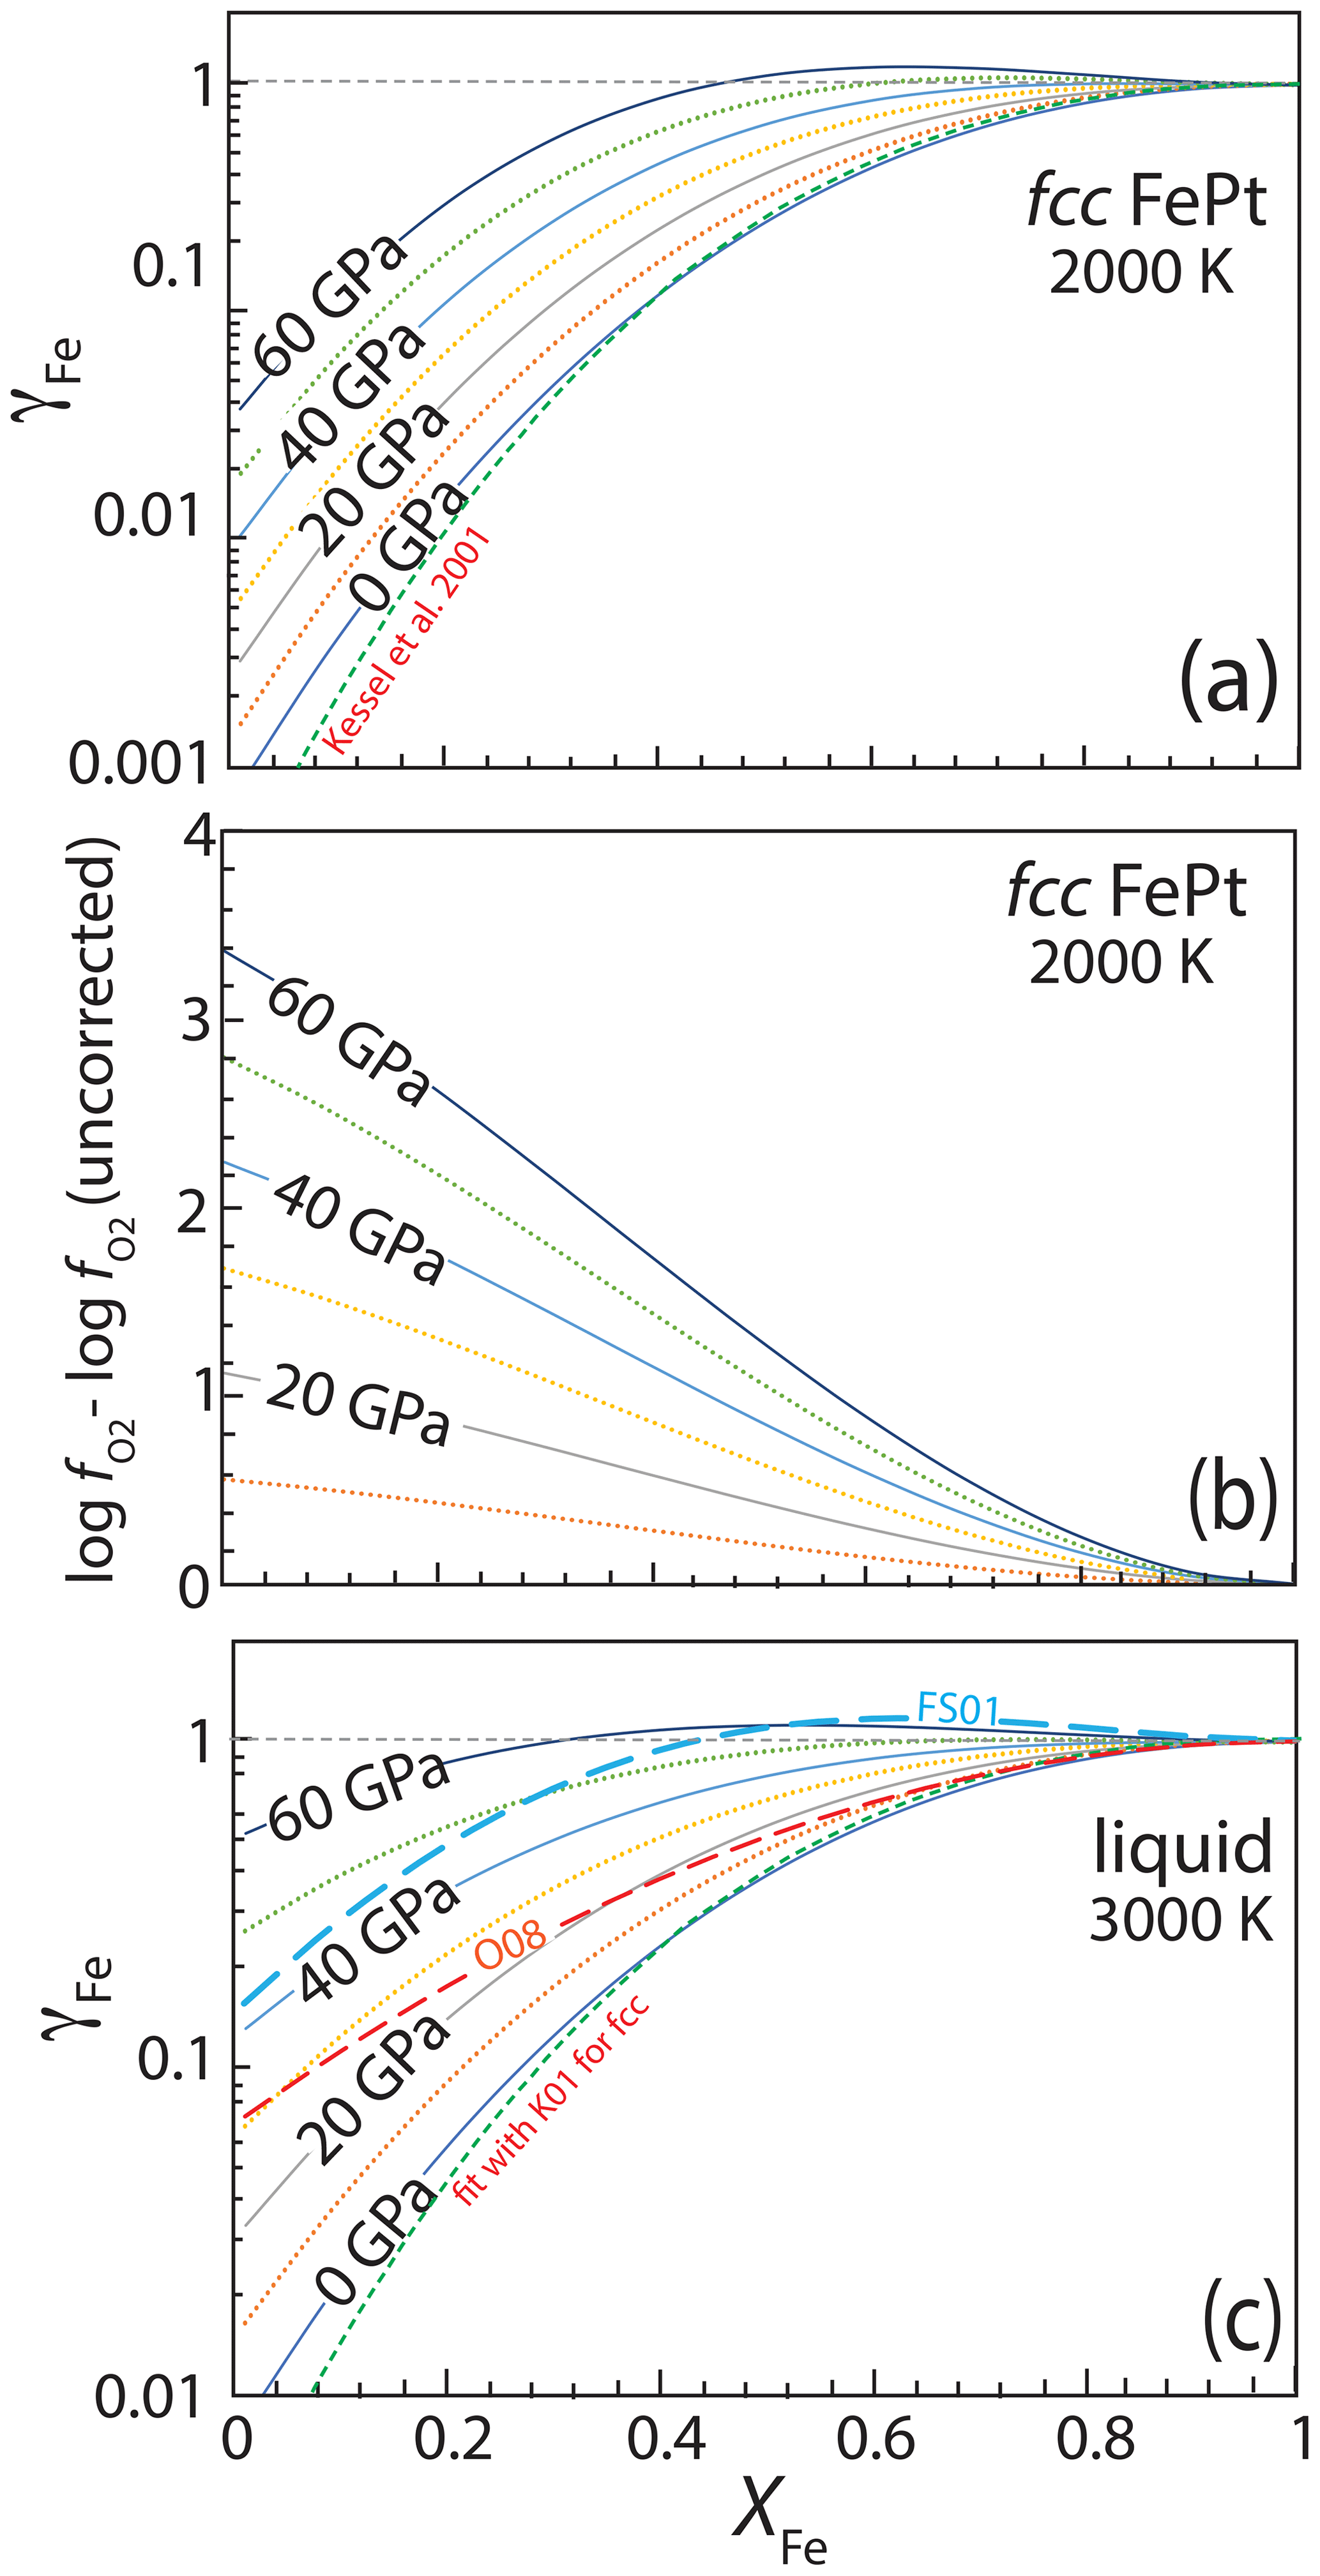
Figure 7(a) Calculated activity coefficient of Fe, γFe, in fcc FePt alloy as a function of composition and pressure at 2000 K. For calculations at low pressure with iron-rich compositions, the calculated fcc phase is metastable relative to liquid FePt. Alloys have strong negative deviations from ideality at low pressure, particularly at low bulk Fe content, but with increasing pressure, the excess volume of Fe–Pt mixing (Fig. 5) strongly moderates this effect. (b) The pressure effect on γFe for fcc FePt manifested in calculated log . For a given assemblage with known chemical potential of FeO (i.e., wüstite, olivine + orthopyroxene, silicate melt) coexisting with fcc FePt alloy, this calculation shows how the resulting log is affected by the pressure effect on γFe in comparison to the results of the same calculation if the pressure effect is neglected. (c) Calculated activity coefficient of Fe in liquid FePt alloy as a function of composition and pressure at 3000 K from 0 to 60 GPa. For calculations at high pressure with Pt-rich compositions, the calculated liquid phase is metastable relative to fcc FePt. Also shown are liquid activities at 0 and 3000 GPa calculated with the alternative liquid model calibrated against the fcc model of Kessel et al. (2001) (K01) and with the thermodynamic models of Fredriksson and Sundman (2001) (FS01) and Odusote (2008) (O08).
Because the thermodynamic mixing properties of liquid and solid FePt are quite similar, activity coefficients for liquid are nearly indistinguishable from those of the solid at a given composition and temperature, albeit relative to a liquid rather than solid standard state. Activity coefficients calculated at 3000 K for FePt liquid are shown in Fig. 7c. Comparison to Fig. 7a shows relatively large values γFe for liquid compared to solid at 0 GPa, owing to the nearly more ideal behavior at higher temperature. As pressure increases, increases in γFe for liquid are more pronounced than for solid (i.e., the isobars are spaced further apart in Fig. 7c compared to Fig. 7a), owing to larger excess volumes of mixing (Fig. 5). Consequently, FePt liquid approaches ideal mixing at approximately 60 GPa.
5.1 Comparison to model of Kessel et al. (2001)
As previously mentioned, the new model for γFe, regressed in this work from all of the “Group 1” studies, is quite similar to the Kessel et al. (2001) model, derived only from the experiments in that investigation, but the two diverge for Pt-rich compositions (Figs. 2, 7). At 1400 ∘C, the Kessel et al. (2001) model gives values of γFe that are 0.17, 0.32, and 0.49 log units lower than the preferred model at XFe=0.2, 0.1, and 0.01, respectively. For the calculation of oxygen fugacities, all other parameters being equal, this translates to values of that are 0.34, 0.64, and 0.99 log units more reducing. These differences are large enough to be potentially testable in experiments for which either aFe or log is measured by other means.
Klemettinen et al. (2021) measured aFe in spinel-saturated slags over a range of oxygen fugacities using both FePt and FePd alloy as sensors. They calculated aFe from FePt compositions using the model of Kessel et al. (2001) and from FePd sensors using the model of Ghosh et al. (1999). The two sensors show excellent agreement under reducing conditions, corresponding to Fe-rich alloys, but diverged under more oxidizing conditions and Pt-richer alloys (Fig. 8). Recalculating aFe from the FePt alloys using the regressed model from this work improves agreement with the FePd sensor. At log , corresponding to alloy with XFe=0.14, the Kessel et al. (2001) model gives an aFe value 0.7 log units lower than the FePd sensor, whereas the new regressed model gives an aFe value only 0.3 log units lower. Thus, the new model improves consistency with activities of Fe determined from FePd alloys.
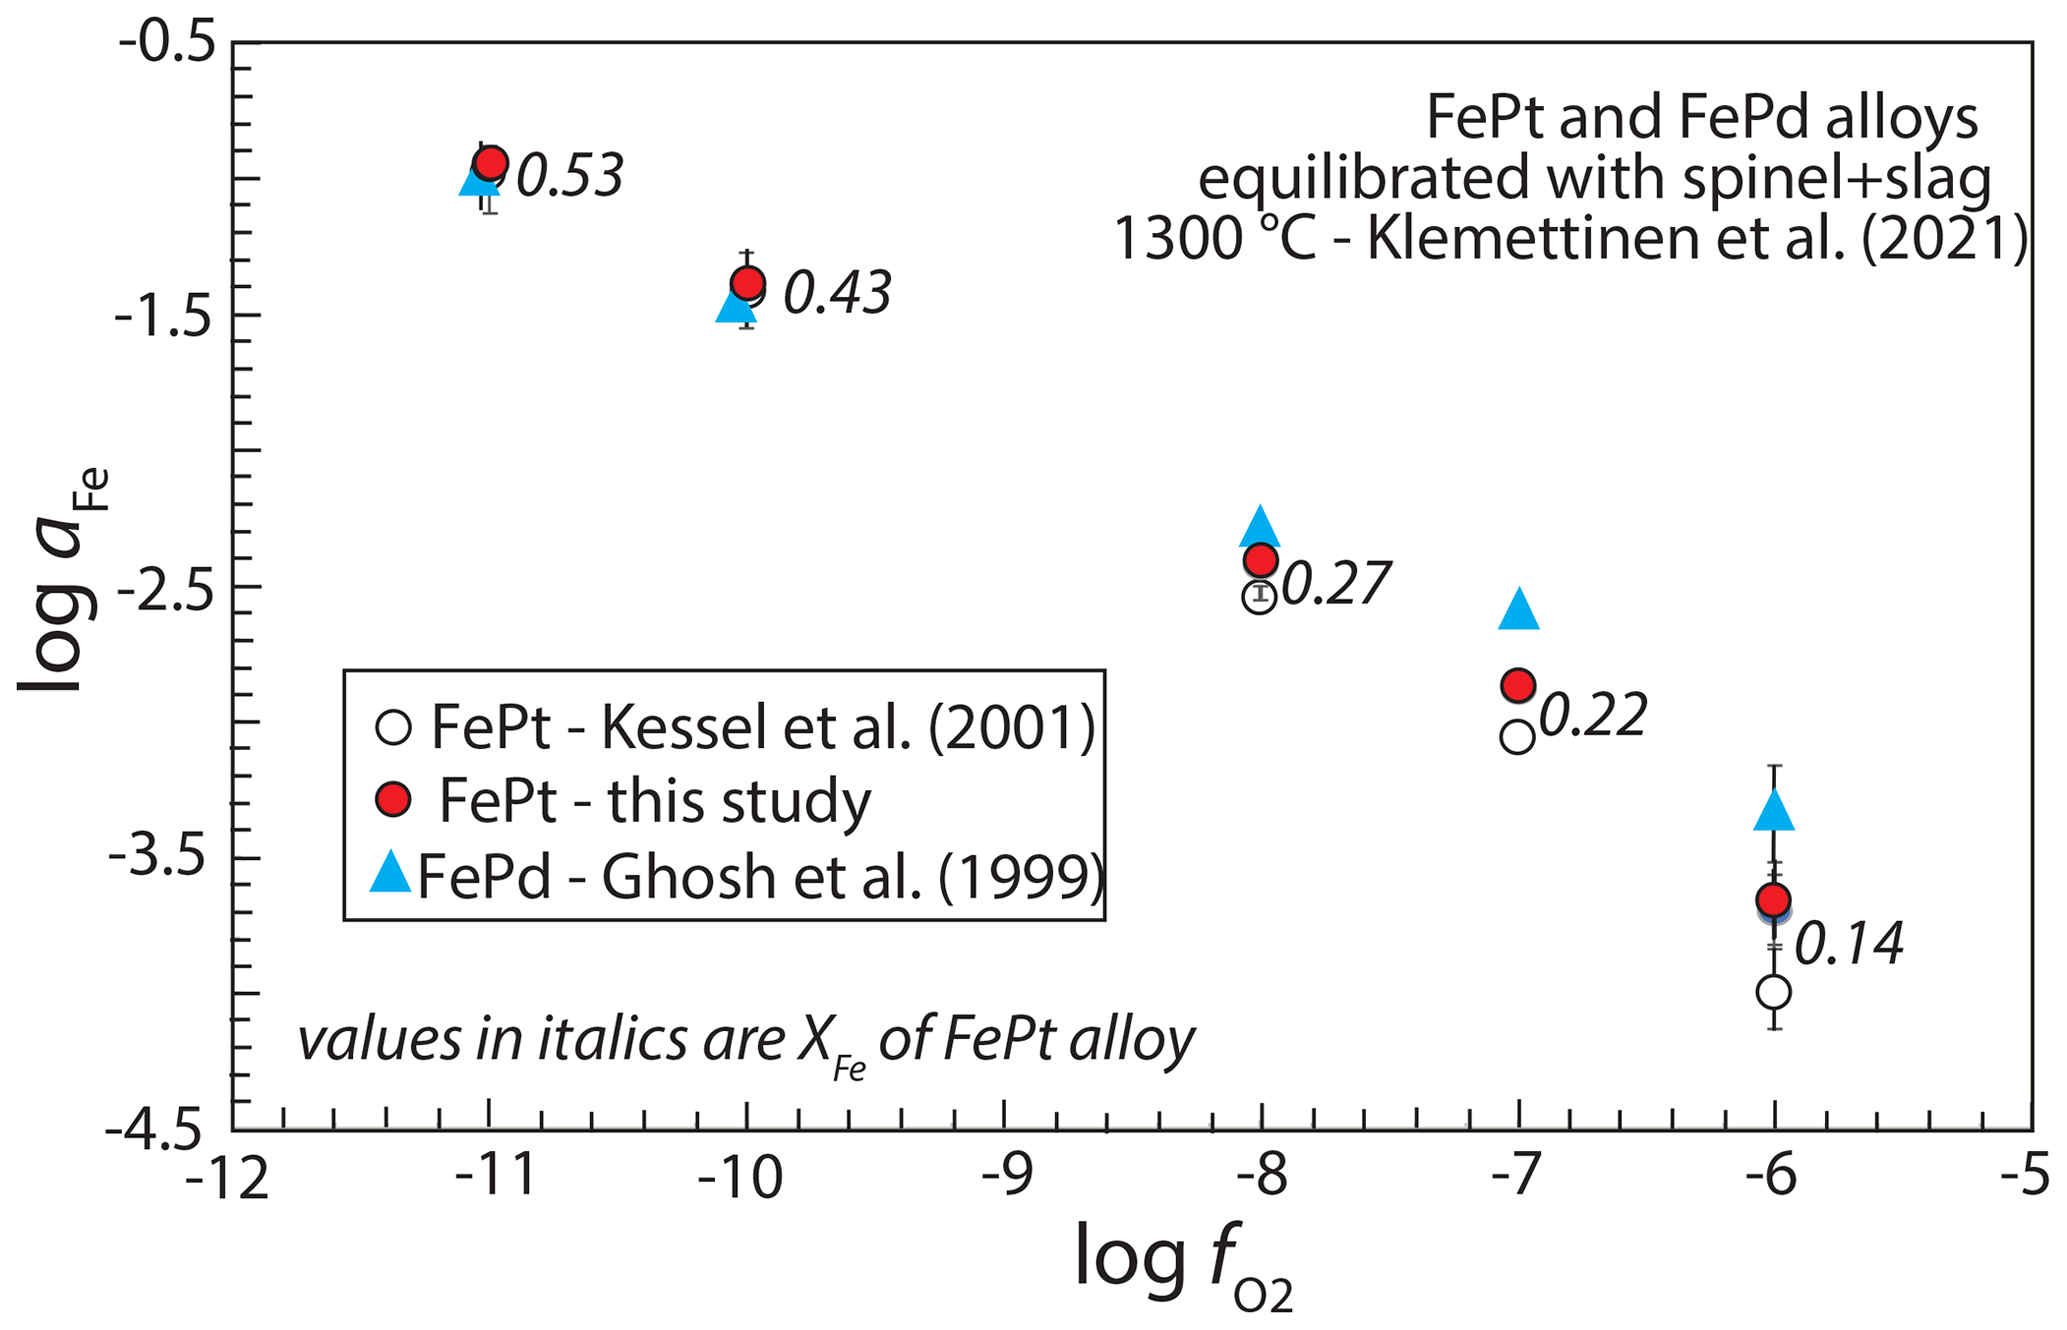
Figure 8Comparison between activity of Fe, aFe, determined with FePt alloy and with FePd alloy equilibrated with slag + spinel in experiments with variable set by gas mixing (Klemettinen et al., 2021). Activities of Fe in FePd alloy are calculated from the model of Ghosh et al. (1999), and for FePt alloy they are calculated from the model of Kessel et al. (2001) and from the parameters regressed in this work. Numbers beside each set of values of aFe are mole fractions of Fe, XFe, which become smaller as conditions become more oxidized. Calculated values of aFe from FePd and FePt agree well at low but diverge under oxidizing conditions. However, values of aFe determined by the newly regressed model show greater consistency with the FePd sensor than the Kessel et al. (2001) parameters.
Davis and Cottrell (2021) compared values of log calculated from equilibria between FePt alloy, using Kessel et al. (2001), and the FeO component in quenched silicate melts in experiments at 1380–1400 ∘C and 1.5 GPa with those determined from the same experiments by both spinel–olivine–orthopyroxene oxybarometry (Mattioli and Wood, 1988) and silicate melt oxybarometry (Kress and Carmichael, 1991), with the latter based on measurements of in the quenched glasses. They found close agreement between determined from alloy–melt equilibria and from spinel oxybarometry, with the former averaging 0.17 log units more oxidized than the latter (n=5), but alloy-melt fugacities were on average 0.65 log units more oxidized than those from melt oxybarometry (n=12) (Fig. 9). Recalculating with the newly regressed alloy-melt model yields oxygen fugacities averaging 0.43 log units more reduced than the spinel oxybarometry and 0.05 more oxidized than the melt oxybarometry (Fig. 9). Thus, compared to the model of Kessel et al. (2001), the regressed model is less congruent with spinel oxybarometry but in better agreement with melt oxybarometry. As noted by Davis and Cottrell (2021), spinel oxybarometry may be more accurate at 1.5 GPa than the melt oxybarometer of Kress and Carmichael (1991). However, we note that for both alloy models, as XFe in the alloy becomes smaller (which is to say, as conditions become more oxidized), the oxygen fugacity calculated with the alloy-melt oxybarometer becomes more oxidized relative to those calculated from both spinel oxybarometry and melt oxybarometry (i.e., the trends for all four have negative slopes in Fig. 9). This indicates that there may be an unidentified systematic contribution to the mismatches.
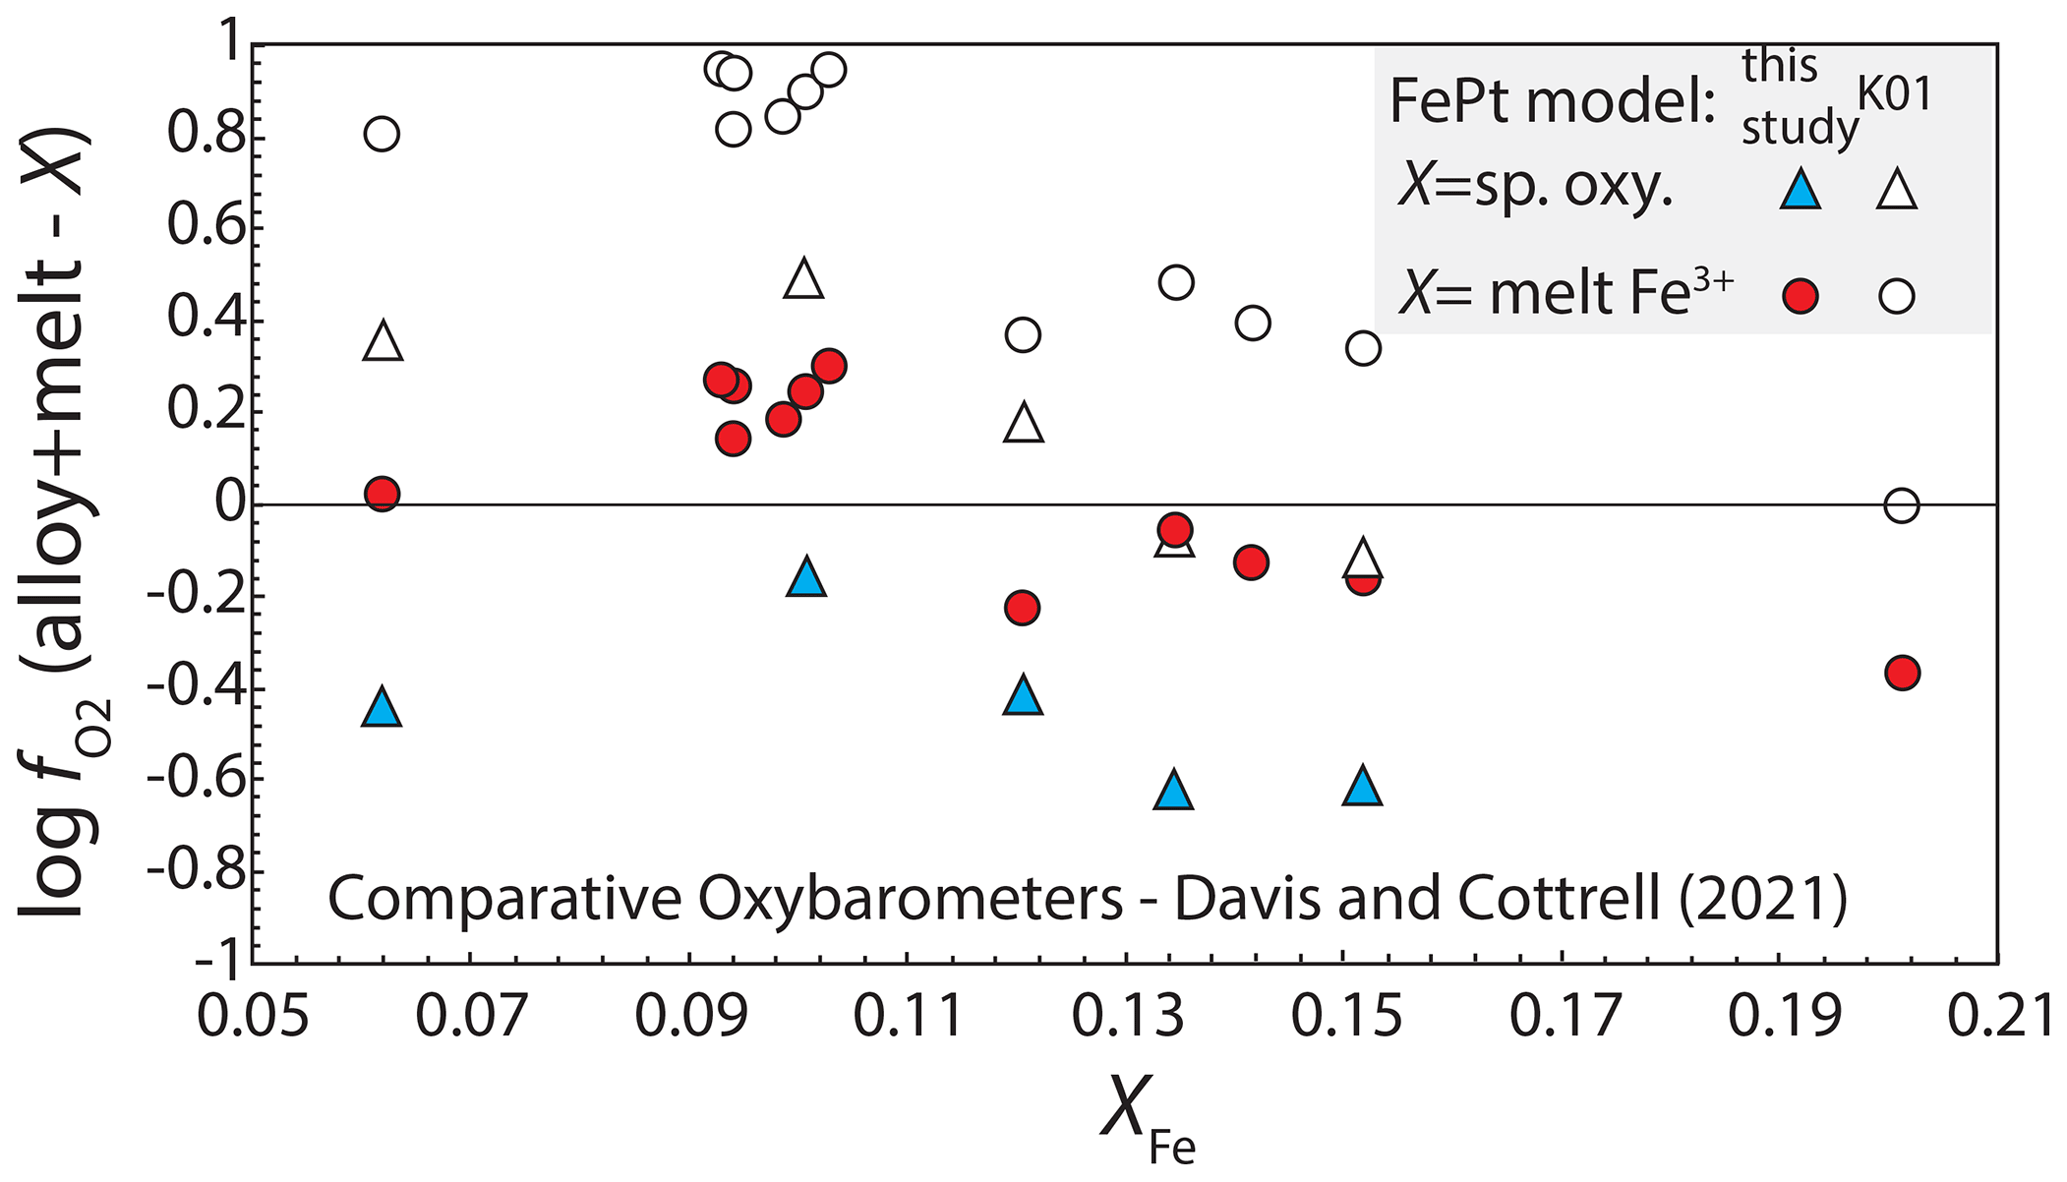
Figure 9Oxygen fugacities from silicate melt/mineral experiments at 1380–1400 ∘C and 1.5 GPa (Davis and Cottrell, 2021), showing the differences between log calculated from alloy–melt equilibria, combining a FePt mixing model with the parameterization of Medard et al. (2008), and those calculated from spinel oxybarometry (Mattioli and Wood, 1988) and from silicate melt ferric ferrous ratio oxybarometry (Kress and Carmichael, 1991). Oxygen fugacities are compared with alloy/melt calculations using both Kessel et al. (2001) and the newly regressed FePt model. The former gives better agreement with the spinel oxybarometry (average difference +0.17 log units) than the latter (average difference −0.43 log units) but agrees less well with the melt oxybarometry (average difference 0.65 log units for Kessel et al., 2001, and 0.05 log units for the new model).
Given these comparisons, it is not clear whether the newly regressed alloy model or that of Kessel et al. (2001) is most accurate. Additional studies allowing for further comparisons are needed.
5.2 Comparison to previous models for liquid FePt
Comparison of the newly derived model for liquid FePt alloy to those proposed by Fredriksson and Sundman (2001) and Odusote (2008) shows that these previous studies predict significantly larger activity coefficients at 3000 K and 0 GPa (Fig. 7). In the case of Fredriksson and Sundman (2001), this is owing to a strong temperature dependence on interaction parameters, as at more modest temperatures, this model predicts non-ideality similar to those from this work (Fig. 4). On the other hand, the Odusote (2008) model implies smaller deviations from ideality at all temperatures (Figs. 3 and 7).
Fredriksson and Sundman (2001) calculated melting relations for FePt alloy that are quite distinct from those modeled here. Although they also found that the melting interval is extremely narrow, their calculated liquidus is at considerably lower temperature (Fig. 4). For Fe-rich compositions it is 25 ∘C lower, and for Pt-rich compositions it is more than 100 ∘C lower. Their melting interval is close to the solidus reported by Isaac and Tammann (1907), and therefore it does not reproduce the liquidus defined by the experiments of Isaac and Tammann (1907) or Fredriksson (2004).
5.3 Excess volume of fcc FePt at high pressure
Equation (13) is appropriate for the calculation of activities of Fe and Pt at high pressure if VXS can be assumed to be independent of pressure. Thermodynamic models of activity–composition relationships in solids and relatively incompressible fluids (e.g., molten alloys, oxide, or silicate liquids) typically make this assumption, whereas models for more compressible solutions, such as C–O–H–X mixed fluids, do not (e.g., Duan et al., 2008). Particularly for extrapolation to the high pressures that prevail in Earth's deep mantle, there is no a priori justification for making the approximation in Eqs. (12) and (13), and so it is desirable to discern how excess volumes of mixing of FePt alloys are affected by pressure.
Because of the interest in volumetric and magnetic behavior of FePt Invar alloys near the composition Fe3Pt, several studies have investigated the effect of pressures up to 26 GPa on volumes of fcc FePt alloys with XFe=0.7 or 0.72 (Matsushita et al., 2004; Odin et al., 1999; Oomi and Mōri, 1981b). Ko et al. (2009) determined the equation of state for alloy with XFe=0.5 up to 55 GPa, but they investigated the ordered tetragonal phase rather than fcc alloy. Observed high-pressure volumes of fcc FePt can be converted to values of VXS from Eq. (6), with high-pressure volumes of pure Fe and Pt from appropriate equations of state (Zha et al., 2008; Komabayashi and Fei, 2010). Interpretation is complicated by the influence of magnetostriction on ferromagnetic fcc alloys with XFe=0.7 or 0.72, but above ∼ 4 GPa, these effects are absent as the alloys become paramagnetic at 300 K (Oomi and Mōri, 1981a). Therefore, the volumes of higher-pressure paramagnetic phases can be compared to 100 kPa volumes by correction of the latter for the effects of magnetostriction, as described by Eq. (14).
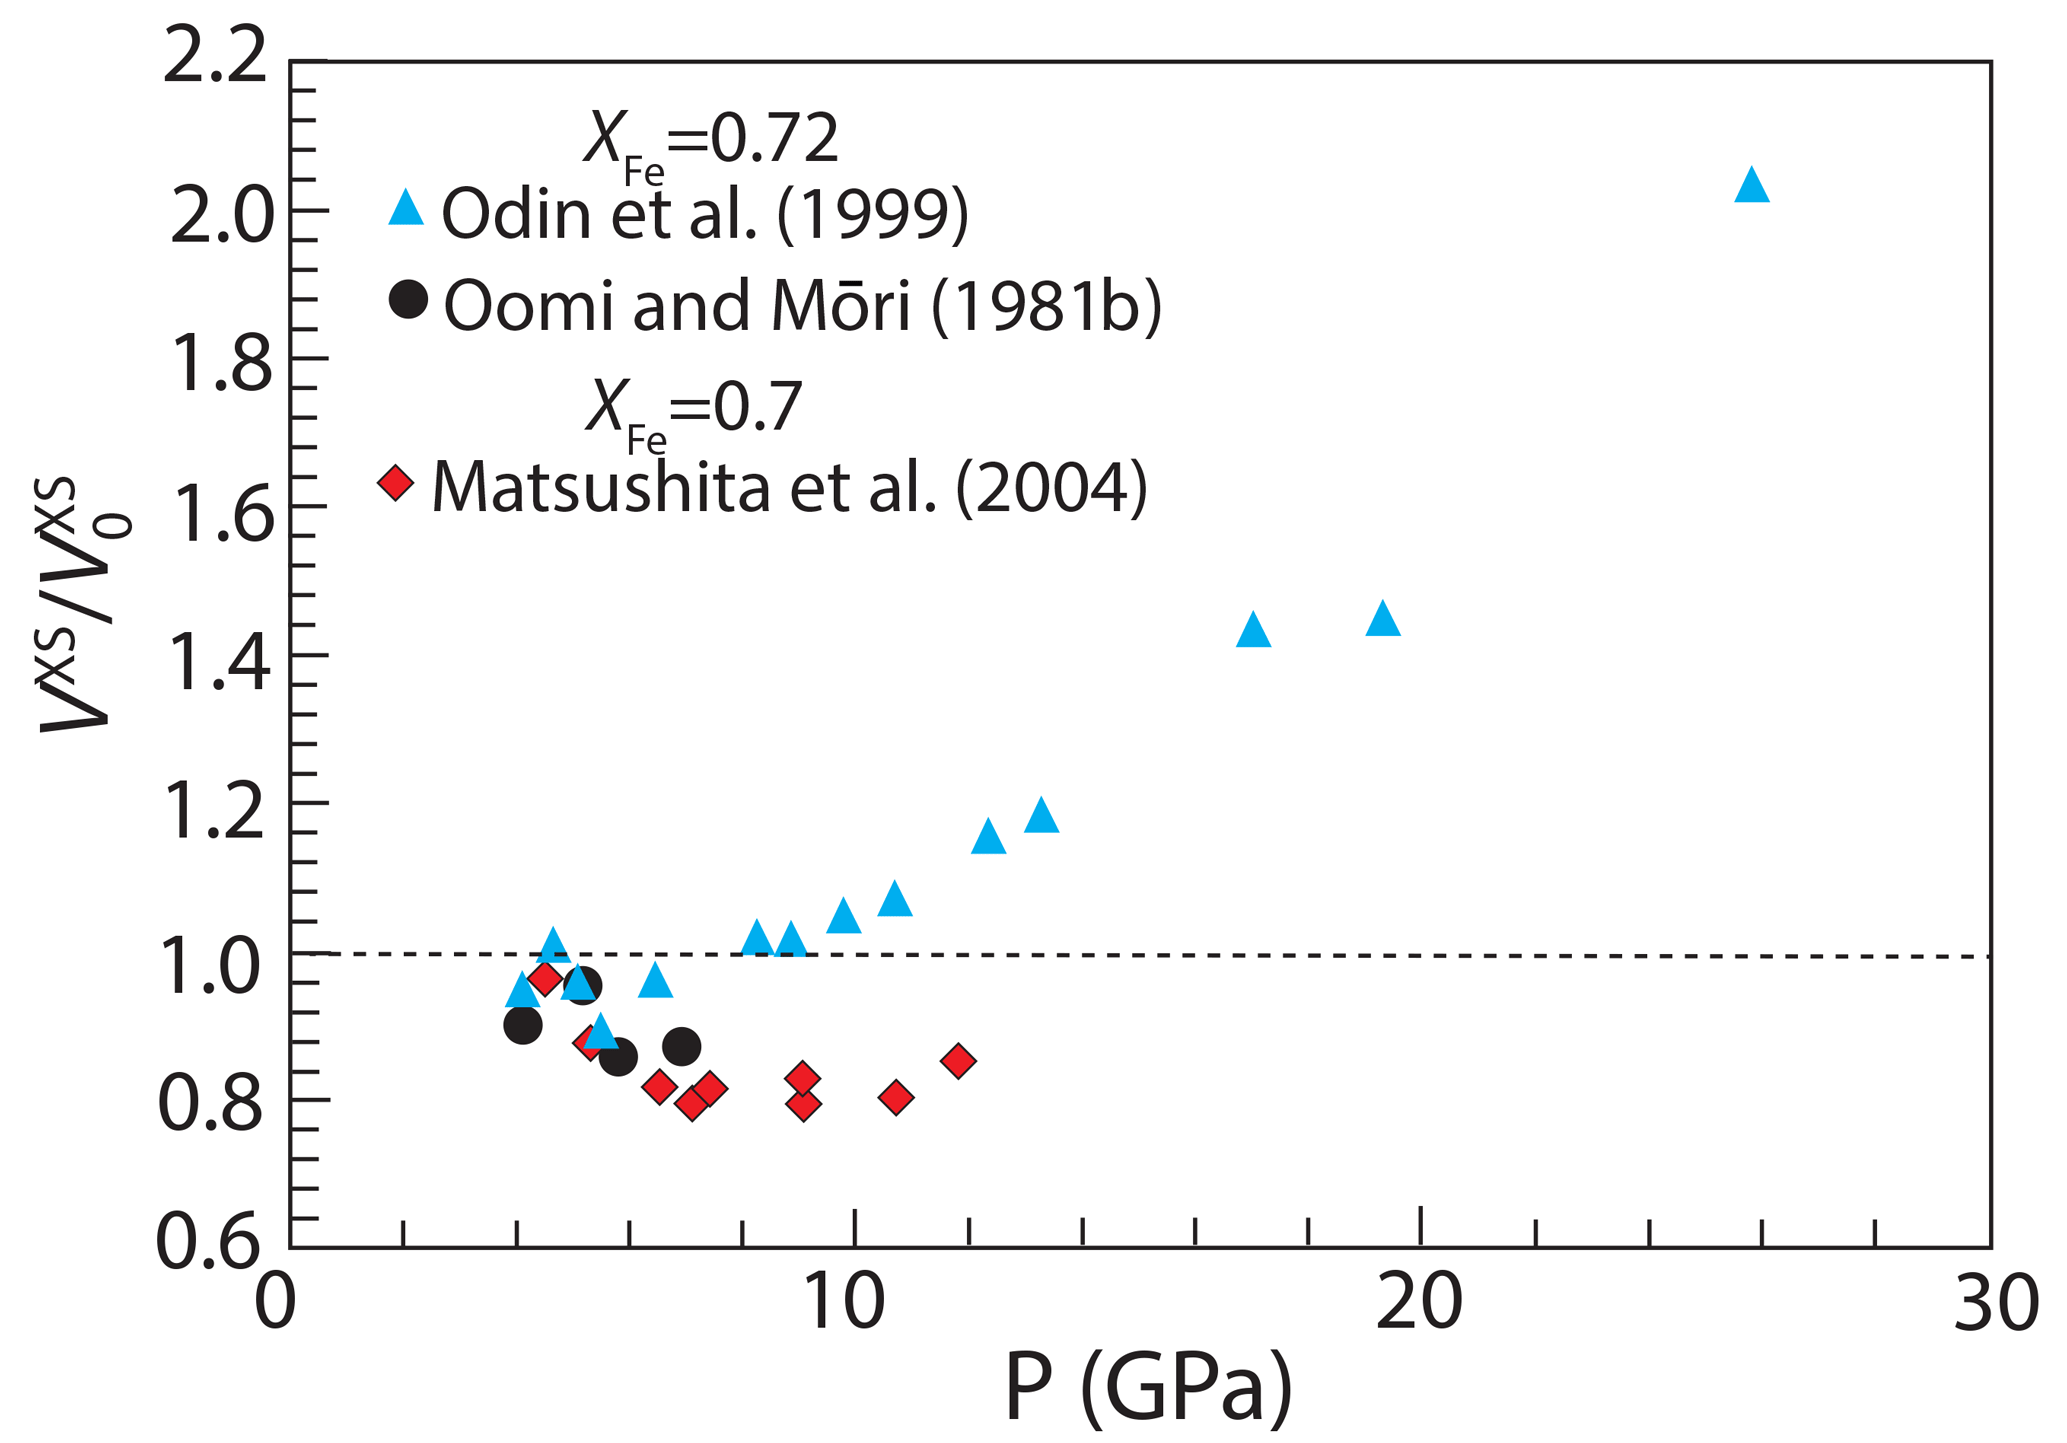
Figure 10Excess volume of mixing, VXS, of FePt alloy as a function of pressure, normalized to the value at 100 kPa, . Data from Oomi and Mōri (1981b) and Odin et al. (1999) (XFe=0.72) and from Matsushita et al. (2004) (XFe=0.7). At each pressure, values of VXS are calculated from Eq. (10) using the volumes of pure Fe and Pt (Zha et al., 2008; Komabayashi and Fei, 2010). Below ∼4 GPa, volumes are affected by magnetostriction and, in each case, values of are for ferromagnetic FePt extrapolated to 100 kPa from the trend of observations above 4 GPa.
Unfortunately, these studies do not provide a coherent picture of the effects of pressure on VXS of FePt alloys. Whereas the data of Odin et al. (1999) indicate that VXS is nearly constant up to 10 GPa and then increases sharply up to 26 GPa, the highest pressure of that study, those of Oomi and Mōri (1981b) and Matsushita et al. (2004), up to 7 and 13 GPa, respectively, indicate that VXS decreases with pressure (Fig. 10). Values of VXS calculated from the data of Matsushita et al. (2004) have an apparent minimum between approximately 6–11 GPa and hint at an increasing trend in a single datum at 13 GPa. Thus, it seems that pressure variations in VXS are small or negative up to approximately 10 GPa and then increase significantly at greater pressures. If this is the case, then values of γFe calculated in this study (Fig. 7a) are underestimates at lower mantle pressures and calculated values of will be overestimates. However, the data in Fig. 10, with limited compositional range and significant interlaboratory discrepancies, are too fragmentary to formulate a model more complex than that given by Eqs. (12) and (13). Additional studies with a greater range of pressures and fcc alloy compositions are needed to better refine the effects of pressure on aFe in FePt alloy.
5.4 Prospects for improved model for liquid FePt
Constraints on the thermodynamic mixing properties of FePt liquid alloy remain limited, regarding both mixing properties at 100 kPa (Fig. 3) and volumetric properties required for extrapolation to high pressure. Whilst further characterization of volumetric properties of liquid alloy, particularly at high pressure, is desirable, it is likely more tractable that improved resolution of the activity of Fe in molten FePt would be attained from accurate characterization of the melting relations in the Fe–Pt system, particularly at high pressure. As demonstrated by the thermodynamic calculations displayed in Fig. 4, the topology of the Fe–Pt liquidus is highly sensitive to Fe–Pt mixing properties of the solid and liquid. As the equations of state of pure Pt and Fe are well-studied (Dorogokupets et al., 2017; Jin et al., 2011; Komabayashi, 2014; Zha et al., 2008), high-pressure studies of the melting across the FePt phase loop would give strong constraints on activity–composition relations in FePt liquid, provided that they were combined with improved characterization of the equation of state of FePt solid alloy.
A reexamination of all the experimental data known to us for activities of Fe in fcc FePt alloy allows reevaluation of the mixing properties. Low-temperature studies produce larger and more dispersed values of γFe, which we attribute to either the complexities introduced by the stabilization of ordered Fe–Pt intermetallic alloys or experimental durations insufficient to achieve equilibrium. Considering only the high-temperature data and filtering these for conditions potentially affected by intermetallic stabilization yield a new thermodynamic parameterization. Resulting activity coefficients are similar to those predicted by Kessel et al. (2001) but diverge to larger values for Pt-rich compositions. Experimental data available to evaluate which of these two models are more accurate yield, at present, equivocal conclusions.
Non-ideal mixing of liquid Fe–Pt alloy is tightly constrained by the position of the liquidus, provided that the properties of the coexisting fcc alloy are known. Activity coefficients of Fe in liquid alloy are very similar to those in fcc alloy for the same composition and temperature. Owing to the small enthalpies of fusion of Fe and Pt metal, the temperature interval for coexisting solid and liquid alloy is extremely narrow, amounting to ∼ 5 ∘C.
Significant excess volumes of mixing for both fcc solid and liquid FePt alloy produce increased activity coefficients with increasing pressure, especially for Pt-rich compositions. Under lower-mantle conditions, this can enhance evaluated log by several orders of magnitude. However, the pressure dependence of excess volumes is not well-constrained, and further investigation of the equation of state of FePt alloys is needed.
The MATLAB code used to calculate Fig. 4 is provided in the Supplement. All data used have been published previously in the cited publications.
The supplement related to this article is available online at: https://doi.org/10.5194/ejm-35-789-2023-supplement.
MMH and HLZ mutually recognized the need for a model to calculate Fe activities in solid and liquid FePt at high pressure and examined previous work to evaluate its applicability. MMH compiled the data, did the thermodynamic modeling, prepared the figures, and wrote the original draft of the manuscript. MMH and HLZ together weighed how to evaluate conflicting data and models and how best to approach an objective presentation. HLZ edited and improved the original manuscript draft.
The contact author has declared that neither of the authors has any competing interests.
Publisher's note: Copernicus Publications remains neutral with regard to jurisdictional claims in published maps and institutional affiliations.
This work was completed during a stay by the first author at the Bayerisches Geoinstitut, enabled by a fellowship from the Alexander von Humboldt Stiftung. We thank Fred Davis, Meryem Berrada, Jie Li, and Tony Withers for encouragement and helpful discussions and the two anonymous referees for their comments.
This research has been supported by grants from the US National Science
Foundation (grant nos. EAR2016215 and EAR2317026) to Marc M. Hirschmann and from the National Natural Science
Foundation of China (grant nos. 41873067 and 42150102) to Hongluo L. Zhang.
This open-access publication was funded by the University of Bayreuth.
This paper was edited by Didier Laporte and reviewed by two anonymous referees.
Alcock, C. and Kubik, A.: Thermodynamic behaviour of liquid iron-cobalt and nickel-platinum alloys, T. I. Min. Metall. C, 77, 220–224, 1968.
Alcock, C. and Kubik, A.: A thermodynamic study of the γ phase solid solutions formed between palladium, platinum and iron, Acta Metall., 17, 437–442, 1969.
Anzellini, S., Monteseguro, V., Bandiello, E., Dewaele, A., Burakovsky, L., and Errandonea, D.: In situ characterization of the high pressure–high temperature melting curve of platinum, Sci. Rep., 9, 1–10, https://doi.org/10.1038/s41598-019-49676-y, 2019.
Arblaster, J.: Crystallographic properties of platinum, Platin. Met. Rev., 41, 12–21, 1997.
Arblaster, J.: The thermodynamic properties of platinum, Platin. Met. Rev., 49, 141–149, https://doi.org/10.1595/147106705X54262, 2005.
Balta, J. B., Beckett, J. R., and Asimow, P. D.: Thermodynamic properties of alloys of gold-74/palladium-26 with variable amounts of iron and the use of Au-Pd-Fe alloys as containers for experimental petrology, Am. Mineral., 96, 1467–1474, https://doi.org/10.2138/am.2011.3637, 2011.
Buckley, R. A. and Hume-Rothery, W.: Liquidus and solidus relations in iron-rich iron-platinum alloys, J. Iron Steel I., 193, 61–62, 1959.
Cabri, L. J. and Feather, C. E.: Platinum-iron alloys; a nomenclature based on a study of natural and synthetic alloys, Canad. Mineral., 13, 117–126, 1975.
Cabri, L. J., Oberthür, T., and Schumann, D.: The mineralogy of Pt-Fe alloys and phase relations in the Pt–Fe binary system, Can. Mineral., 60, 331–339, https://doi.org/10.3749/canmin.2100060, 2022.
Cline, C., Faul, U., David, E., Berry, A., and Jackson, I.: Redox-influenced seismic properties of upper-mantle olivine, Nature, 555, 355–358, https://doi.org/10.1038/nature25764, 2018.
Davis, F. A. and Cottrell, E.: Partitioning of Fe2O3 in peridotite partial melting experiments over a range of oxygen fugacities elucidates ferric iron systematics in mid-ocean ridge basalts and ferric iron content of the upper mantle, Contrib. Mineral. Petr., 176, 67, https://doi.org/10.1007/s00410-021-01823-3, 2021.
Dinsdale, A. T.: SGTE data for pure elements, Calphad-Computer Coupling of Phase Diagrams and Thermochemistry, Calphad, 15, 317–425, https://doi.org/10.1016/0364-5916(91)90030-n, 1991.
Dorogokupets, P. I., Dymshits, A. M., Litasov, K. D., and Sokolova, T. S.: Thermodynamics and equations of state of iron to 350 GPa and 6000 K, Sci. Rep., 7, 41863, https://doi.org/10.1038/srep41863, 2017.
Doyle, C. D.: Prediction of the activity of FeO in multicomponent magma from known values in SiO2-KAlO2-CaAl2Si2O8-FeO liquids, Geochim. Cosmochim. Ac., 52, 1827–1834, https://doi.org/10.1016/0016-7037(88)90006-3, 1988.
Duan, Z., Hu, J., Li, D., and Mao, S.: Densities of the CO2–H2O and CO2–H2O–NaCl systems up to 647 K and 100 MPa, Energ. Fuel., 22, 1666–1674, https://doi.org/10.1021/ef700666b, 2008.
Fiquet, G., Auzende, A. L., Siebert, J., Corgne, A., Bureau, H., Ozawa, H., and Garbarino, G.: Melting of peridotite to 140 Gigapascals, Science, 329, 1516–1518, https://doi.org/10.1126/science.1192448, 2010.
Franse, J. J. M. and Gersdorf, R.: 3d, 4d and 5d elements, alloys and compounds, in: Magnetic properties of metals, Landolt-Börnstein Tables, Group 3, Landolt-Börnstein Tables Springer, Germany, Fig. 83, https://doi.org/10.1007/b29710, 1986.
Fredriksson, P.: Differential thermal analysis of the iron–platinum system, Scand. J. Metall., 33, 183–188, https://doi.org/10.1111/j.1600-0692.2004.00682.x, 2004.
Fredriksson, P. and Seetharaman, S.: Thermodynamic studies of some Fe-Pt alloys by the solid electrolyte galvanic cell method, Scand. J. Metall., 30, 258–264, https://doi.org/10.1034/j.1600-0692.2001.300410.x, 2001.
Fredriksson, P. and Sundman, B.: A thermodynamic assessment of the Fe-Pt system, Calphad, 25, 535–548, 2001.
Frost, D. J. and McCammon, C. A.: The redox state of Earth's mantle, Annu. Rev. Earth Pl. Sc., 36, 389–420, https://doi.org/10.1146/annurev.earth.36.031207.124322, 2008.
Gang, C., Gu, Z., Zhou, H., Wang, Z., Ruiping, Z., and Yuan, S.: In-situ high temperature X-ray diffraction study of structure and phase transformation of Nd-FePt alloys, J. Rare Earths, 23, 724–726, 2005.
Ghosh, G., Kantner, C., and Olson, G.: Thermodynamic modeling of the Pd-X (X = Ag, Co, Fe, Ni) systems, J. Phase Equilib., 20, 295–308, https://doi.org/10.1361/105497199770335811, 1999.
Grove, T. L.: Use of FePt alloys to eliminate the iron loss problem in 1-atmosphere gas mixing experiments – theoretical and practical considerations, Contrib. Mineral. Petr., 78, 298–304, 1981.
Gudmundsson, G. and Holloway, J. R.: Activity-composition relationships in the system Fe-Pt at 1300 and 1400 ∘C and at 1 atm and 20 kbar, Am. Mineral., 78, 178–186, 1993.
Hayn, R. and Drchal, V.: Invar behavior of disordered fcc-FexPt1−x alloys, Phys. Rev. B, 58, 4341, https://doi.org/10.1063/1.3322459, 1998.
Heald, E.: Thermodynamics of iron-platinum alloys, Trans. Metall. Soc. AIME, 239, 1337–1340, 1967.
Henao, H. M. and Itagaki, K.: Activity and activity coefficient of iron oxides in the liquid FeO-Fe2O3-CaO-SiO2 slag systems at intermediate oxygen partial pressures, Metall. Mater. Trans. B, 38, 769–780, https://doi.org/10.1007/s11663-007-9077-7, 2007.
Herzberg, C. and Zhang, J.: Melting experiments on anhydrous peridotite KLB-1: Compositions of magmas in the upper mantle and transition zone, J. Geophys. Res.-Sol. Ea., 101, 8271–8295, https://doi.org/10.1029/96JB00170, 1996.
Hirschmann, M. M.: Magma ocean influence on early atmosphere mass and composition, Earth Planet. Sc. Lett., 341, 48–57, 2012.
Hirschmann, M. M.: Magma oceans, iron and chromium redox, and the origin of comparatively oxidized planetary mantles, Geochim. Cosmochim. Ac., 328, 221–241, https://doi.org/10.1016/j.gca.2022.04.005, 2022.
Holzheid, A. and Grove, T. L.: The effect of metal composition on Fe-Ni partition behavior between olivine and FeNi-metal, FeNi-carbide, FeNi-sulfide at elevated pressure, Chem. Geol., 221, 207–224, https://doi.org/10.1016/j.chemgeo.2005.05.005, 2005.
Isaac, E. and Tammann, G.: L. Über die Legierungen des Eisens mit Platin, Z. Anorg. Chem., 55, 63–71, 1907.
Jamieson, H., Roeder, P., and Grant, A.: Olivine-pyroxene-PtFe alloy as an oxygen geobarometer, J. Geol., 100, 138–145, https://www.jstor.org/stable/30082324 (last access: 19 September 2023), 1992.
Jin, K., Wu, Q., Geng, H., Li, X., Cai, L., and Zhou, X.: Pressure–volume–temperature equations of state of Au and Pt up to 300 GPa and 3000 K: internally consistent pressure scales, High Press. Res., 31, 560–580, https://doi.org/10.1080/08957959.2011.611469, 2011.
Katahira, Y. and Hayashi, M.: Activities of FeO1.33 in the FeOx–CaO–SiO2 and FeOx–CaO–SiO2–Al2O3 slags at 1573 K Under oxygen partial pressures between 10−6 and 10−2 atm, ISIJ Int., 56, 1164–1170, https://doi.org/10.2355/isijinternational.ISIJINT-2016-065, 2016.
Kessel, R., Beckett, J. R., and Stolper, E. M.: Thermodynamic properties of the Pt-Fe system, Am. Mineral., 86, 1003–1014, https://doi.org/10.2138/am-2001-8-907, 2001.
Khmelevskyi, S., Turek, I., and Mohn, P.: Large negative magnetic contribution to the thermal expansion in iron-platinum alloys: Quantitative theory of the Invar effect, Phys. Rev. Lett., 91, 037201, https://doi.org/10.1103/PhysRevLett.91.037201, 2003.
Khmelevskyi, S., Ruban, A. V., Kakehashi, Y., Mohn, P., and Johansson, B.: Ab initio investigation of the Invar anomaly in ordered fcc Fe-Pt alloys, Phys. Rev. B, 72, 064510, https://doi.org/10.1103/PhysRevB.72.064510, 2005.
Klemettinen, L., Avarmaa, K., Jokilaakso, A., and Taskinen, P.: Iron activity measurements and spinel-slag equilibria in alumina-bearing iron silicate slags, J. Alloys Compd., 855, 157539, https://doi.org/10.1007/s11837-019-03960-4, 2021.
Ko, Y., Kim, K., Han, C., Petrovic, C., Hu, R., Lee, H., and Lee, Y.: Pressure–volume equation of state of FeAu and FePt, High Press. Res., 29, 800–805, https://doi.org/10.1080/08957950903335513, 2009.
Komabayashi, T.: Thermodynamics of melting relations in the system Fe-FeO at high pressure: Implications for oxygen in the Earth's core, J. Geophys. Res.-Sol. Ea., 119, 4164–4177, https://doi.org/10.1002/2014jb010980, 2014.
Komabayashi, T. and Fei, Y.: Internally consistent thermodynamic database for iron to the Earth's core conditions, J. Geophys. Res.-Sol. Ea., 115, B03202, https://doi.org/10.1029/2009JB006442, 2010.
Kress, V. C. and Carmichael, I. S. E.: The compressibility of silicate liquids containing Fe2O3 and the effect of composition, temperature, oxygen fugacity and pressure on their redox states, Contrib. Mineral. Petr., 108, 82–92, https://doi.org/10.1007/bf00307328, 1991.
Larson, H. R. and Chipman, J.: Activity of iron in iron-platinum solid solutions, Acta Metall., 2, 1–2, 1954.
Lichtenberg, T.: Redox hysteresis of super-Earth exoplanets from magma ocean circulation, Astrophys. J. Lett., 914, L4, https://doi.org/10.3847/2041-8213/ac0146, 2021.
Malitch, K. N. and Thalhammer, O. A.: Pt–Fe nuggets derived from clinopyroxenite–dunite massifs, Russia: a structural, compositional and osmium-isotope study, Canad. Mineral., 40, 395–418, https://doi.org/10.2113/gscanmin.40.2.395, 2002.
Matsushita, M., Nakamoto, Y., Suzuki, E., Miyoshi, Y., Inoue, H., Endo, S., Kikegawa, T., and Ono, F.: The lattice softening and the crystal structure of Fe–Pt Invar alloys under high pressures, J. Magn. Magn. Mater., 284, 403–408, https://doi.org/10.1016/j.jmmm.2004.07.006, 2004.
Mattioli, G. S. and Wood, B. J.: Magnetite activities across the MgAl2O4-Fe3O4 spinel join, with application to thermobarometric estimates of upper mantle oxygen fugacity, Contrib. Mineral. Petr., 98, 148–162, https://doi.org/10.1007/bf00402108, 1988.
Medard, E., McCammon, C. A., Barr, J. A., and Grove, T. L.: Oxygen fugacity, temperature reproducibility, and H2O contents of nominally anhydrous piston-cylinder experiments using graphite capsules, Am. Mineral., 93, 1838–1844, https://doi.org/10.2138/am.2008.2842, 2008.
Nataf, L., Decremps, F., Gauthier, M., and Canny, B.: High-pressure structural study of Fe64Ni36 and Fe72Pt28 Invar alloys at low-temperature, Phys. Rev. B, 74, 184422, https://doi.org/10.1103/PHYSREVB.74.184422, 2006.
Nikolic, S., Henao, H., Hayes, P. C., and Jak, E.: Phase equilibria in ferrous calcium silicate slags: part II. Evaluation of experimental data and computer thermodynamic models, Metall. Mater. Trans. B, 39, 189–199, https://doi.org/10.1007/s11663-008-9131-0, 2008.
O'Neill, H. S. C. and Eggins, S. M.: The effect of melt composition on trace element partitioning: an experimental investigation of the activity coefficients of FeO, NiO, CoO, MoO2 and MoO3 in silicate melts, Chem. Geol., 186, 151–181, https://doi.org/10.1016/s0009-2541(01)00414-4, 2002.
Odin, S., Baudelet, F., Giorgetti, C., Dartyge, E., Itié, J., Polian, A., Chervin, J., Pizzini, S., Fontaine, A., and Kappler, J.: Magnetic phase transitions in Fe72Pt28 Invar compound studied by high-pressure X-ray magnetic circular dichroism and X-ray diffraction, Europhys. Lett., 47, 378, https://doi.org/10.1209/epl/i1999-00399-6, 1999.
Odusote, Y. A.: Investigation of ordering phenomenon in Me–Pt (Me = Fe, Ni) liquid alloys, Sci. Tech. Adv. Materal., 9, 015001, https://doi.org/10.1088/1468-6996/9/3/015001, 2008.
Oomi, G. and Mōri, N.: Pressure effect on the spontaneous volume magnetostriction of Fe–Ni and Fe–Pt invar alloys, J. Phys. Soc. Jpn., 50, 2924–2930, 1981a.
Oomi, G. and Mōri, N.: Bulk modulus anomalies of Fe–Ni and Fe–Pt invar alloys, J. Phys. Soc. Jpn., 50, 2917–2923, 1981b.
Otsuka, K., Longo, M., McCammon, C. A., and Karato, S.-I.: Ferric iron content of ferropericlase as a function of composition, oxygen fugacity, temperature and pressure: Implications for redox conditions during diamond formation in the lower mantle, Earth Planet. Sc. Lett., 365, 7–16, https://doi.org/10.1016/j.epsl.2012.11.030, 2013.
Pelton, A. D.: Thermodynamics and phase diagrams of materials, in: Phase transformations in Materials, edited by: Kostorz, G., Wiley, 1–80, 2001.
Petric, A. and Jacob, K.: Thermodynamic Properties of Fe3O4-FeV2O4 and Fe3O4-FeCr2O4 Spinel Solid Solutions, J. Am. Ceram. Soc., 65, 117–123, 1982.
Petric, A., Jacob, K. T., and Alcock, C.: Thermodynamic properties of Fe3O4-FeAl2O4 spinel solid solutions, J. Am. Ceram. Soc., 64, 632–639, 1981.
Ponomaryova, S., Tatarenko, V., Koval, Y. M., Odnosum, V., and Ponomaryov, O.: Magnetic interactions in fcc Fe–Pt alloys, Int. J. Mech. Mater. Eng, 3, 45-53, https://doi.org/10.14355/ijmme.2014.0302.04, 2014.
Righter, K. and Drake, M. J.: Core formation in Earth's Moon, Mars, and Vesta, Icarus, 124, 513–529, https://doi.org/10.1006/icar.1996.0227, 1996.
Rubie, D., Karato, S., Yan, H., and O'Neill, H. S. C.: Low differential stress and controlled chemical environment in multianvil high-pressure experiments, Phys. Chem. Miner., 20, 315–322, 1993.
Sedov, V. L.: Antiferromagnetizm gamma-železa: Problema invara, Nauka, 1987.
Stagno, V., Frost, D., McCammon, C., Mohseni, H., and Fei, Y.: The oxygen fugacity at which graphite or diamond forms from carbonate-bearing melts in eclogitic rocks, Contrib. Mineral. Petr., 169, 1–18, https://doi.org/10.1007/s00410-015-1111-1, 2015.
Stanley, B. D., Hirschmann, M. M., and Withers, A. C.: Solubility of C-O-H volatiles in graphite-saturated martian basalts, Geochim. Cosmochim. Ac., 129, 54–76, https://doi.org/10.1016/j.gca.2013.12.013, 2014.
Steenstra, E. S., Lin, Y., Rai, N., Jansen, M., and van Westrenen, W.: Carbon as the dominant light element in the lunar core, Am. Mineral., 102, 92–97, https://doi.org/10.2138/am-2017-5727, 2017.
Stixrude, L., de Koker, N., Sun, N., Mookherjee, M., and Karki, B. B.: Thermodynamics of silicate liquids in the deep Earth, Earth Planet. Sc. Lett., 278, 226–232, https://doi.org/10.1016/j.epsl.2008.12.006, 2009.
Sundaresen, M., Gerasimov, Y. I., Geiderikh, V., and Vasileva, I.: EMF study of the thermodynamical properties of iron-platinum alloys, Zhurnal Fizcheskoi Khmiii, 37, 2462–2466, 1963.
Taylor, J. R., Wall, V. J., and Pownceby, M. I.: The calibration and application of accurate redox sensors, Am. Mineral., 77, 284–295, 1992.
Taylor, R. and Muan, A.: Activities of iron in iron-platinum alloys at 1300 degrees C, T. Metall. Soc. AIME, 224, 500–502, 1962.
Vlaic, P. and Burzo, E.: Magnetic behaviour of iron-platinum alloys, J. Optoelectr. Adv. M., 12, 1114, 2010.
Vrestal, J.: Tensimetrické stanovení termodynamickych funkcí systému Fe-Pt, Koveve Materialy, 11, 291–299, 1973.
Wassermann, E.: The invar problem, J. Magn. Magn. Mater., 100, 346–362, 1991.
Watanabe, M., Adachi, M., Uchikoshi, M., and Fukuyama, H.: Densities of Pt–X (X: Fe, Co, Ni and Cu) binary melts and thermodynamic correlations, Fluid Phase Equilib., 515, 112596, https://doi.org/10.1016/j.fluid.2020.112596, 2020.
Woodland, A. B. and O'Neill, H. S. C.: Thermodynamic data for Fe-bearing phases obtained using noble metal alloys as redox sensors, Geochim. Cosmochim. Ac., 61, 4359–4366, 1997.
Yoshino, T., Makino, Y., Suzuki, T., and Hirata, T.: Grain boundary diffusion of W in lower mantle phase with implications for isotopic heterogeneity in oceanic island basalts by core-mantle interactions, Earth Planet. Sc. Lett., 530, 115887, https://doi.org/10.1016/j.epsl.2019.115887, 2020.
Zha, C.-S., Mibe, K., Bassett, W. A., Tschauner, O., Mao, H.-K., and Hemley, R. J.: P-V-T equation of state of platinum to 80 GPa and 1900 K from internal resistive heating/x-ray diffraction measurements, J. Appl. Phys., 103, 054908, https://doi.org/10.1063/1.2844358, 2008.
Zhang, H. L., Hirschmann, M. M., Walter, M. J., Lord, O. T., Cottrell, E., Tracy, S. J., and Rudra, A.: Pressure effect on the oxidation state of a terrestrial magma ocean, from experimental perspective, San Francisco, December 2019, AGU abs., VF31-0189, 2019.