the Creative Commons Attribution 4.0 License.
the Creative Commons Attribution 4.0 License.
 | 21 Jun 2023
Multistage fluorite mineralization in the southern Black Forest, Germany: evidence from rare earth element (REE) geochemistry
Robin Hintzen
Wolfgang Werner
Michael Hauck
Reiner Klemd
Lennart A. Fischer
The Black Forest hosts a wide range of hydrothermal mineralization, including fluorite–barite vein deposits. In a detailed investigation of the Finstergrund and Tannenboden deposits in the Wieden mining district (southern Black Forest), the diversity, geochemical evolution and relative chronology of multistage fluorite precipitation is tracked on the basis of rare earth element (REE) geochemistry, geologic field relationships and crystal zoning. Geochemical discrimination and mathematical λ coefficients suggest a total of seven fluorite REE groups, at least three distinguishable post-Variscan fluid mobilization events and independent formation histories for the deposits despite their spatial proximity. Fluorite vein mineralization at the Finstergrund deposit evolved over three fluid generations, was derived from gneissic source aquifers and comprises five distinct fluorite REE groups: the first fluid generation is characterized by fluorite precipitation above 200 ∘C (“group III”), below 200 ∘C (“group I”) and after fractional crystallization (“group IV”); the second generation comprises remobilized fluorite (“group II”); and the third generation revealed fluorite precipitation by meteoric water mixing (“group V”). Fluorite vein formation at the Tannenboden deposit is associated with two distinct fluorite REE patterns derived from the same fluid generation: fluorite precipitation above 200 ∘C (“group VII”) and after cooling below 200 ∘C (“group VI”). Its fluid source aquifer lithology best matches migmatites contrary to previous models that suggest either gneissic or granitic aquifer rocks for fluorite vein precipitation in the Black Forest. The decoupled formation history between the deposits is tectonically controlled as suggested by a new genetic model for the Wieden mining district. The model argues for a change in the local fluid percolation network and the termination of hydrothermal activity at the Tannenboden deposit after the first fluid mobilization event.
The geochemical evolution of multistage fluorite mineralization, as exemplified by the Tannenboden and Finstergrund deposits in combination with other fluorite mineralizations in the Black Forest, provides unique insights into the lithospheric origin and precipitation behaviour of fluorite by various fluid–rock interaction processes occurring in large hydrothermal systems. The local diversity of REE patterns emphasizes the need for detailed investigations of individual hydrothermal vein deposits.
- Article
(11739 KB) - Full-text XML
- BibTeX
- EndNote


The Black Forest hosts about 400–500 hydrothermal veins comprising different mineralogical assemblages, of which a large number is fluorite-bearing and of former economic importance over a period of many years. Fluorite mining still takes place at the Clara Mine (central Black Forest) where a depth of 900 m is reached today. Europe's largest fluorite vein with a total length of 3.5 km and a width up to 35 m occurs in the northern Black Forest near Pforzheim (Werner and Dennert, 2004) and is currently prepared for the resumption of mining activity. Regarding the central to southern Black Forest, most deposits occur in an area enclosed by the Upper Rhine Graben (URG) to the west, the Badenweiler–Lenzkirch zone (BLZ) to the south and the extension of the Bonndorf graben system along the Dreisam Valley east of Freiburg. This area, where the Wieden mining district is situated (Fig. 1), hosts a number of fluorite–barite veins that represented one of the economically most significant German reserves in the 20th century (Werner and Dennert, 2004; Werner, 2011; Markl, 2017).
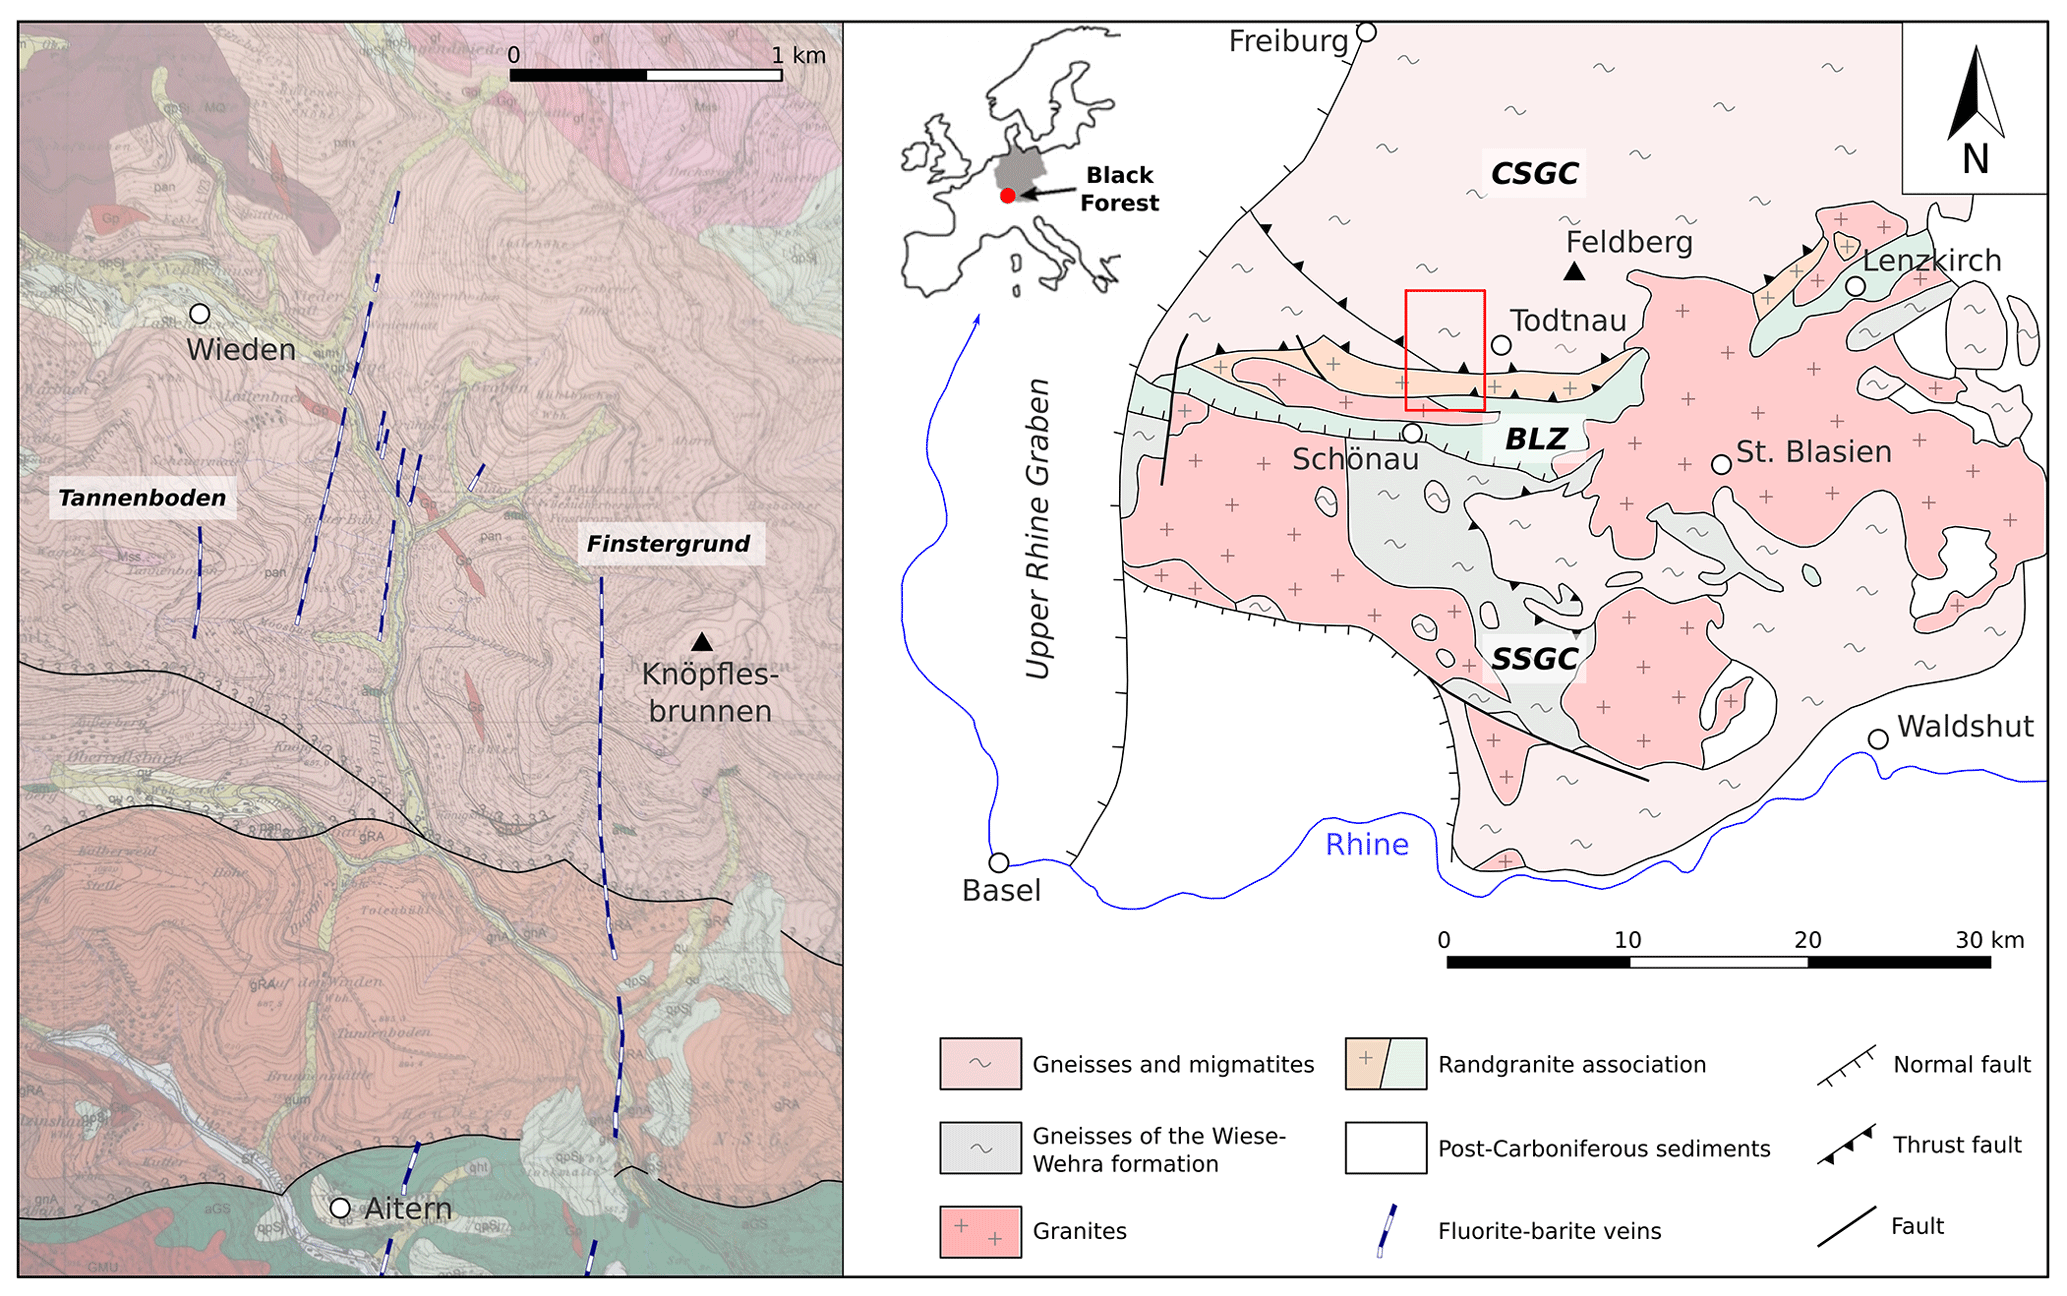
Figure 1Geologic overview of the central and southern Black Forest with the main sections of fluorite–barite veins in the Wieden mining district. CSGC: central Black Forest gneiss complex; BLZ: Badenweiler–Lenzkirch Zone; SSGC: southern Black Forest gneiss complex. Overview map: modified following Werner and Markl, 2020 p. 11, Wieden mining district: modified section of the geological map 1:25 000, sheet 8113 Todtnau, 2011 – published by the regional council of Freiburg, Germany – dept. 9 geological survey (https://www.lgrb-bw.de, last access: 18 January 2022); approved on 13 July 2022, s. RPF91-4700-5/31/2 and spatial base data © LGL, https://www.lgrb-bw.de.
Five time periods of intensified hydrothermal activity and vein formation are suggested to have occurred on the scale of the entire Black Forest (Walter et al., 2016, 2018b; Scharrer et al., 2021). In the Carboniferous, quartz–tourmaline veins precipitated from low-salinity (< 4.5 wt % NaCl + CaCl2), high-temperature fluids (up to 390 ∘C). Followed by Sb–Au-bearing quartz veins that formed from cooling metamorphic fluids (2 wt %–4.5 wt % NaCl + CaCl2, < 310 ∘C). Around the Triassic–Jurassic boundary, two coexisting, non-mixing fluids of opposed salinity (2 wt %–4.5 wt % vs. > 26 wt % NaCl + CaCl2) were linked to quartz–hematite veins. In the Jurassic–Cretaceous period the first fluorite–quartz–barite and barite–quartz veins formed from mixing between a bittern brine and a halite dissolution brine (23 wt %–26 wt % NaCl + CaCl2, 50–143 ∘C). The youngest period of hydrothermal activity is of post-Cretaceous age, represented by quartz–barite–fluorite veins, as well as carbonate veins from mixed fluids of variable salinity (5 wt %–25 wt % NaCl + CaCl2, 66–194 ∘C) (Walter et al., 2016). The middle Jurassic to Cretaceous fluorite-bearing group of hydrothermal veins comprises a large fraction of the veins in the Black Forest (Walter et al., 2018b).
Schwinn and Markl (2005) compared the rare earth element (REE) patterns of 63 post-Variscan hydrothermal fluorite veins of the entire Black Forest area. Two major groups are distinguished that reflect either gneissic (type A) or granitic source-related (type B) features in agreement with the REE characteristics evaluated for mineral waters and leachates from gneiss- and granite-hosted aquifers (Möller et al., 1997). Key features to distinguish the hydrothermal origin of fluids and fluorite mineralizations are the Eu anomaly and the degree of heavy REE (HREE) depletion in REE patterns normalized to post-Archean Australian shale (PAAS; McLennan, 1989). Gneiss-related fluids and fluorite mineralizations inherit a positive Eu anomaly and only a slight to no depletion of HREEs, while those from granite aquifers are characterized by none or a negative Eu anomaly and strongly depleted HREEs (Möller et al., 1997, 1998; Möller, 2000; Schwinn and Markl, 2005). However, no systematic evaluation of REE patterns of basement rocks from the central and southern Black Forest has been conducted so far. The largest dataset of REE abundances of granites comprises data from 12 intrusions (Emmermann et al., 1975), which lacks, however, the full range of REEs. A comprehensive overview of mineral, thermal and mine waters from the entire Black Forest area on the other hand is given by Göb et al. (2013).
The majority of previous studies are based on extensive comparisons of a large number of different hydrothermal veins across the entire Black Forest district but are limited with respect to the number of investigated samples per vein. For example, Walter et al. (2018b) determined the Sm Nd ages of 21 fluorite-bearing veins on the basis of 25 samples. In addition, Walter et al. (2016) and Walter et al. (2018a) performed fluid inclusion studies of hydrothermal veins of different ages at 30 locations with 50 samples and 96 post-Cretaceous veins with 155 samples for the central and southern Black Forest, respectively. On average, these studies account for less than two samples per vein. The variability in REE patterns in 63 hydrothermal fluorites by Schwinn and Markl (2005) are based on six to seven samples per vein on average. The local variability, as well as the complexity of successive vein formation stages on the scale of a single deposit, is, therefore, unlikely to be fully covered.
In contrast to previous studies, this investigation focuses on a detailed examination of the variety of rare earth element patterns including Y (REY) from more than 70 samples taken from the Finstergrund and Tannenboden deposits only. These comprise two multi-generational fluorite veins of the Wieden mining district that are approx. only 1.5 km apart from each other (Fig. 1). Fluorites usually preserve and/or inherit their REY patterns from the hydrothermal fluid from which they precipitated and, thus, provide insight into the REY source of the hydrothermal fluid (e.g. Schwinn and Markl, 2005; Nadoll et al., 2018). It is shown that different fluid and fluorite mineralization events are distinguishable and that the physico-chemical processes between hydrothermal events can be tracked by REY patterns. Evidence is provided that the mineralization from fluids in the Finstergrund and Tannenboden deposits does not share the same evolution and must be related to different source aquifers despite their spatial proximity. This raises the need for an update of the genetic model for the Wieden mining district and questions the rough division of Black Forest hydrothermal fluorite veins into type A and type B by Schwinn and Markl (2005). This study serves as an example for the application of REE geochemistry to unravel the histories of locally differing multistage fluorite vein mineralization.
The crystalline basement in the central and southern Black Forest is predominantly constituted of lithologically homogenous paragneiss and migmatites (Werner and Markl, 2020). These formed during the Variscan orogeny around 340–325 Ma from impure greywacke (Kalt et al., 2000) at 30–35 km depth and 500–730 ∘C, achieving in parts anatectic conditions (Hanel et al., 2001). Along the southeastern margin of the central Black Forest gneiss complex, the lithologically diverse association broadly called “Randgranit” is situated, comprising different augen gneisses, fine-to-medium-grained paragneisses, amphibolites, calc–silicate rocks and leptynites, as well as different metagranitic bodies (Altherr et al., 2019). Farther south to southeast, the batholith complex of the southern Black Forest intruded approx. simultaneously with Variscan peak metamorphism including, for example, the Bärhalde, Albtal or St. Blasien granite among others (Schaltegger, 2000). The post-Variscan, sedimentary sequence on top of the crystalline basement, up to and including Upper Jurassic limestones, was eroded in the course of uplift related to the alpine orogeny. The Eocene to Pliocene URG formation caused the exhumation of the crustal section that constitutes the Black Forest today (Ziegler and Dèzes, 2007).
2.1 Basement fluid reservoir evolution and fluorite vein formation in the southern Black Forest
The number and chemical characteristics of hydrothermal veins in the central Black Forest gneiss complex and in the mining district of Wieden are related to the long-term geologic evolution of the Variscan to Alpine orogenies in addition to the mechanical properties of the basement rocks. Contrary to granite, gneiss favours the formation of discrete, linearly oriented, deep-reaching faults that provide crustal permeability and enable fluid circulation along linear segments (Etheridge et al., 1984; Sibson et al., 1988; Werner and Dennert, 2004). Reoccurrence of the same dominant strike direction, Upper Jurassic–Lower Cretaceous and Tertiary ages, as well as geomorphologic features such as the URG, indicate Variscan pre-defined tectonic failure zones as fluid pathways (Werner et al., 2020). Tectonic reactivation drives the mobilization of metamorphic and infiltrated fluids stored in the pore space of the crystalline basement, connate waters residing among the sedimentary layers of basin fillings and meteoric waters (Sibson et al., 1975; Sibson, 1987; Werner et al., 2020). With changing sedimentary deposition in the Mesozoic to Neogene basins and the chemical equilibration of downward-migrating, originally seawater-derived fluids through basins into the crystalline basement, a gradually stratified basement fluid reservoir developed over time (Fig. 2). From depth to shallower levels this basement reservoir contained metamorphic fluid, modified bittern brine and halite dissolution brine (Walter et al., 2016; Scharrer et al., 2021). Deeper-seated late-metamorphic Permian H2O–NaCl fluids were interpreted to have been comparably hot (up to 310 ∘C) but low in salinity (2 wt %–4.5 wt % NaCl + CaCl2), whereas Triassic to Tertiary basin brines show variable fluid compositions and salinities at temperatures ranging from 50–200 ∘C (Walter et al., 2016). The older modified bittern brine, compositionally resulting from leaching of mainly Ca-rich plagioclase in the host rock, is a CaCl2-dominated, KCl-poor fluid with a salinity of about 25 wt % CaCl2 + NaCl. The subsequent, shallower-seated halite dissolution brine interacted with the previously altered basement in equilibrium with alkali feldspars and clay minerals and is thus depleted in Ca2+ and Ba2+. It represents an NaCl-dominated, KCl-enriched fluid with a salinity of approx. 22 wt % NaCl + CaCl2 (Scharrer et al., 2021). Jurassic H2O–NaCl–CaCl2 fluids are highly saline with 20 wt %–26 wt % NaCl + CaCl2 related to leaching of evaporites in the sedimentary cover of the basement. Erosion of evaporite sequences and exposition of aquifers due to uplift in the course of the URG opening resulted in post-Cretaceous multi-component H2O–NaCl–CaCl2–(SO4–CO2–HCO3) fluids of highly variable salinities between 5 wt %–25 wt % NaCl + CaCl2 due to mixing of high- and low-salinity fluids (Walter et al., 2016, 2017, 2018a, 2019). Fluids from Triassic sediments are designated carriers for SO and/or H2S (Walter et al., 2016). F− and Ba2+ were leached from biotite- and feldspar-bearing granites and gneisses in the crystalline basement (Markl, 2005; Schwinn and Markl, 2005; Burisch et al., 2016). Fluorite–barite precipitation occurs either by the mixing of F−- and Ba2+-enriched deep metamorphic fluids with cooler Ca2+- and/or SO H2S-bearing shallower formation waters (Lüders, 1994; Walter et al., 2016, 2017, 2018a, 2019) or by fluid mixing of Ca2+- and Ba2+-bearing modified bittern with F−- and SO-enriched halite dissolution brines from stratified reservoirs in the upper crystalline basement. Direct fluorite precipitation from the Ca2+-rich modified bittern brine in the course of fluid cooling and neutralization is not excluded if it contained a sufficient number of F− anions (Scharrer et al., 2021). The solubility of F− is, however, limited in CaCl2-dominated solutions relative to higher solubilities in NaCl-dominated ones and in the presence of SO (Richardson and Holland, 1979; Zhang et al., 2015). As the modified bittern brine and the halite dissolution brine share similar host rocks, higher F concentrations are expected in the latter for these reasons. The predominant precipitation of fluorite or barite is controlled by the mixing ratio of the fluid endmembers and limited by the availability of anions (Scharrer et al., 2021). Fluorite–barite veins in the Black Forest have been assigned to two main formation periods, the Jurassic–Cretaceous and the post-Cretaceous (Walter et al., 2016). Multi-generational fluorite–barite vein deposits are expected to bear chemically distinct signatures as they are linked to repeated episodes of fault reactivation, fluid mobilization and mixing from an evolving basement reservoir since the Variscan.
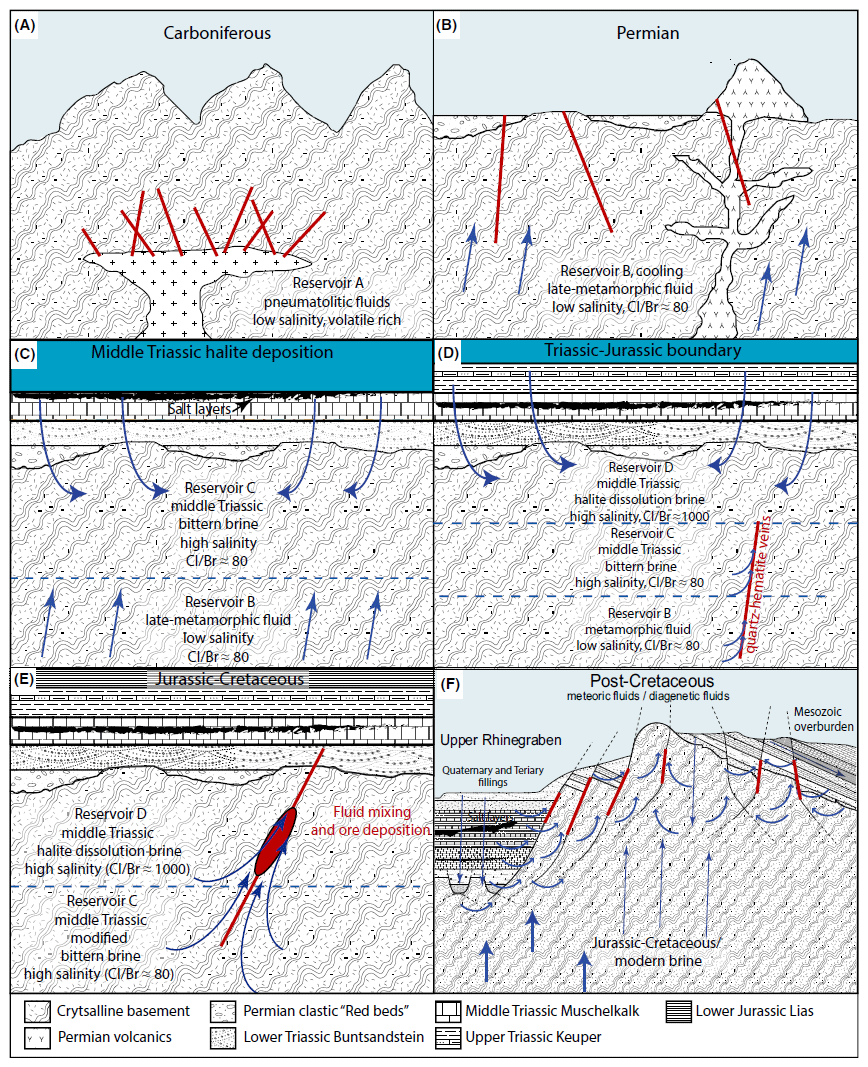
Figure 2Schematic cross-sections through the central European crust from the Carboniferous to the Holocene showing the evolution of continental fluid reservoirs and their salinity in relation to the formation of sedimentary covers (after Walter et al., 2016). Reproduction rights approved by John Wiley and Sons, license number: 5338390496195.
2.2 Mineralization phases in the Wieden mining district
The Wieden mining district hosts multiple parallel-striking, subvertical fluorite–barite deposits, the most important of which are “Tannenboden”, “Finstergrund”, “Werner II”, “Anton” and “Neuhoffnung” (Werner and Dennert, 2004; Werner et al., 2020). The Finstergrund and Tannenboden mines were active from 1922 until 1974. Altogether more than 1 Mt of fluorite ore was mined in the Wieden district (Hauck, 2020). Today, the northern part of the Finstergrund deposit is partly open to the public and can be visited with guided tours (Fig. 3a). It represents the longest hydrothermal vein of the Wieden mining district with a total length of 3.5 km and between 0.1–3.8 m in width. It is characterized by discontinuous mineralization and consists of approx. 50 %–60 % fluorite, 25 %–30 % quartz and 1 %–2 % barite, while galena dominates over sphalerite in subordinate amounts. The length of the Tannenboden deposit (Fig. 3b) is less than 1 km and 0.7–2.7 m in width. It consists of approx. 60 % fluorite, 30 % barite, 10 % quartz and sphalerite as the most prominent sulfide (Werner and Dennert, 2004; Werner et al., 2020). Both veins were formed by multiple hydrothermal events as evidenced by a banded vein structure yielding fluorite in various colours and textures. A new fluorite generation precipitates in the tectonically reopened void amidst the previous fluorite formation that is laterally displaced as a consequence. The oldest mineralization event, thus, forms the selvage, while the youngest is situated in the centre of the vein. Towards both sides from the vein centre, the same syntaxial mineral precipitation sequence can ideally be witnessed (Werner and Dennert, 2004).
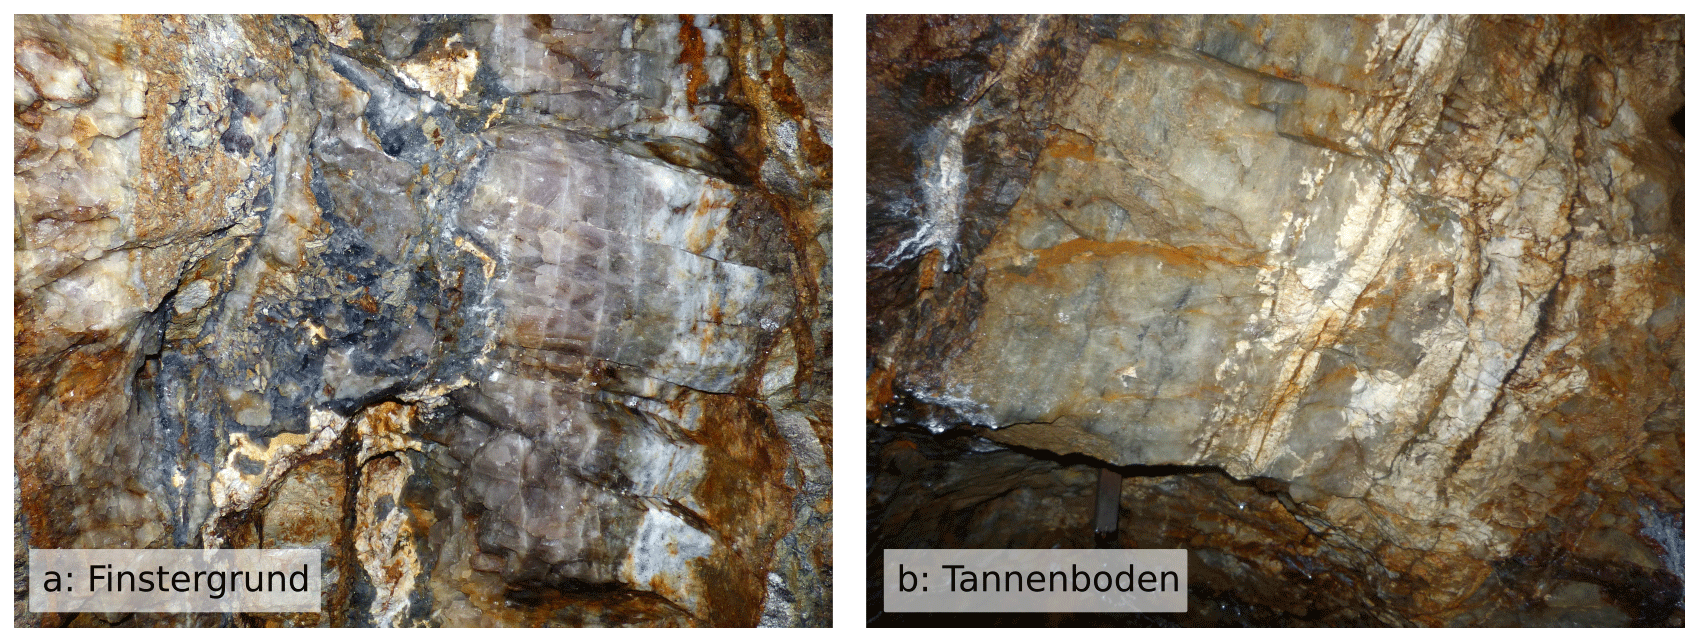
Figure 3Photographic impressions of the fluorite vein mineralization. (a) At the Finstergrund deposit, fluorite in yellowish, blue and pale pink to translucent colours; barite in the centre of the vein is milky white; galena-bearing quartz seams on the right are a dirty white colour (width of the photo approx. 40 cm). (b) At the Tannenboden deposit, yellowish-grey fluorite with syngenetic barite distinguished by its milky white colour (width of the photo approx. 1 m).
Werner et al. (2020) distinguish three main mineralization episodes after the formation of crustal fluid pathways from 300–290 Ma (Bültemann, 1979; Mankopf and Lippolt, 1997). First, mostly whitish-greyish to slightly rose-coloured fluorite I was deposited between 186–129 Ma (Jurassic–Cretaceous) at temperatures up to 200 ∘C. In the Tannenboden vein, fluorite I is additionally intergrown with barite I which is not known from the Finstergrund vein at this time. Upon cooling, fluorite I was partly replaced by quartz along with the precipitation of dispersed Pb and Zn sulfides. Second, blue-coloured, often euhedral fluorite II formed in association with quartz at 80–60 Ma (Late Cretaceous) in brecciated wall rock (Walter et al., 2018b), followed by an event of white barite II precipitation of Tertiary age. Third, reactivation of faults linked to the URG formation led to the mineralization or remobilization and redeposition of quartz, fluorite and carbonates from Muschelkalk-derived low-temperature fluids around 50–70 ∘C (Burisch et al., 2018) between 22 and 0.5 Ma (post-Cretaceous) (Walter et al., 2018b). Post-mineralization exhumation of the veins partly led to the dissolution of fluorite by meteoric infiltration waters, as well as the formation of an Fe-enriched supergene oxidation zone (Werner et al., 2020).
In order to cover the largest number of different fluorite generations, sampling targeted mineralization sequences and fluorite precipitation of different colours, textures and adjacent lithologies. Samples were collected from 11 locations at the Finstergrund deposit (including the northern Werner IV and the southern Finstergrund section) and 5 locations from the Tannenboden deposit (including the lower and the 30 m adit).
Samples were prepared at the Institute for Mineralogy, University of Freiburg, Germany. All small- and medium-sized samples were cleaned by deionized water in an ultrasonic bath for 5–8 min. Larger-sized samples were washed and brushed using tap water. Fluorite grains designated for analysis were hand-picked, resulting in a total of 49 samples from the Finstergrund deposit and 23 samples from the Tannenboden deposit. The samples were embedded in epoxy resin. The surface of sample mounts was ground, lapped, cleaned in an ultrasonic bath with water and polished. Sample screening was performed using a binocular and a Leitz Laborlux 12 Pol S petrographic microscope to identify volumes with the least number of fluid inclusions as possible in addition to growth zoning and intergrown crystallites to select suitable spots for laser ablation.
Laser ablation inductively coupled plasma mass spectrometry (ICP-MS) analysis was performed at the GeoZentrum Nordbayern, Friedrich-Alexander University of Erlangen–Nuremberg, Germany. An Excimer 193 nm laser ablation unit from Teledyne coupled to an Agilent 7500c quadrupole ICP-MS was used for analysis. The laser was run at a pulse frequency of 40 Hz and a fluence of 7.87 J cm−2 at a spot size of 50 µm in diameter. Analyses were carried out in time-resolved mode using an integration time of 10 ms for 29Si; 30 ms for 42Ca and 44Ca; and 35 ms for 7Li, 23Na, 24Mg, 26Mg, 39K, 55Mn, 57Fe, 66Zn, 88Sr, 89Y, 137Ba, 139La, 140Ce, 141Pr, 146Nd, 147Sm, 153Eu, 157Gd, 159Tb, 163Dy, 165Ho, 166Er, 169Tm, 172Yb, 175Lu, 208Pb, 232Th and 238U. The NIST SRM 612 glass was used as external standard (Pearce et al., 1997), while an ideal stoichiometric value of 51.1 wt % Ca was used as internal standard for fluorite. The measurement campaign was conducted within 2 subsequent days. On the first day, recurrent measurements of the NIST SRM 612 glass standard yielded a reproducibility better than 2.89 % RSD (relative standard deviation) (n=8) and better than 3.29 % RSD (n = 3) with respect to the secondary standard BCR2G. On the second day, repeated measurements of NIST SRM 612 glass yielded a reproducibility better than 2.50 % RSD (n = 8) and better than 2.22 % RSD (n = 3) for BCR2G. The overall minimum detection limit considering all REEs plus Y retrieved from the NIST SRM 612 glass measurements was 22 and 19 ppb on the first and second day, respectively. Raw data evaluation was performed using the software GLITTER (van Achterbergh et al., 2000).
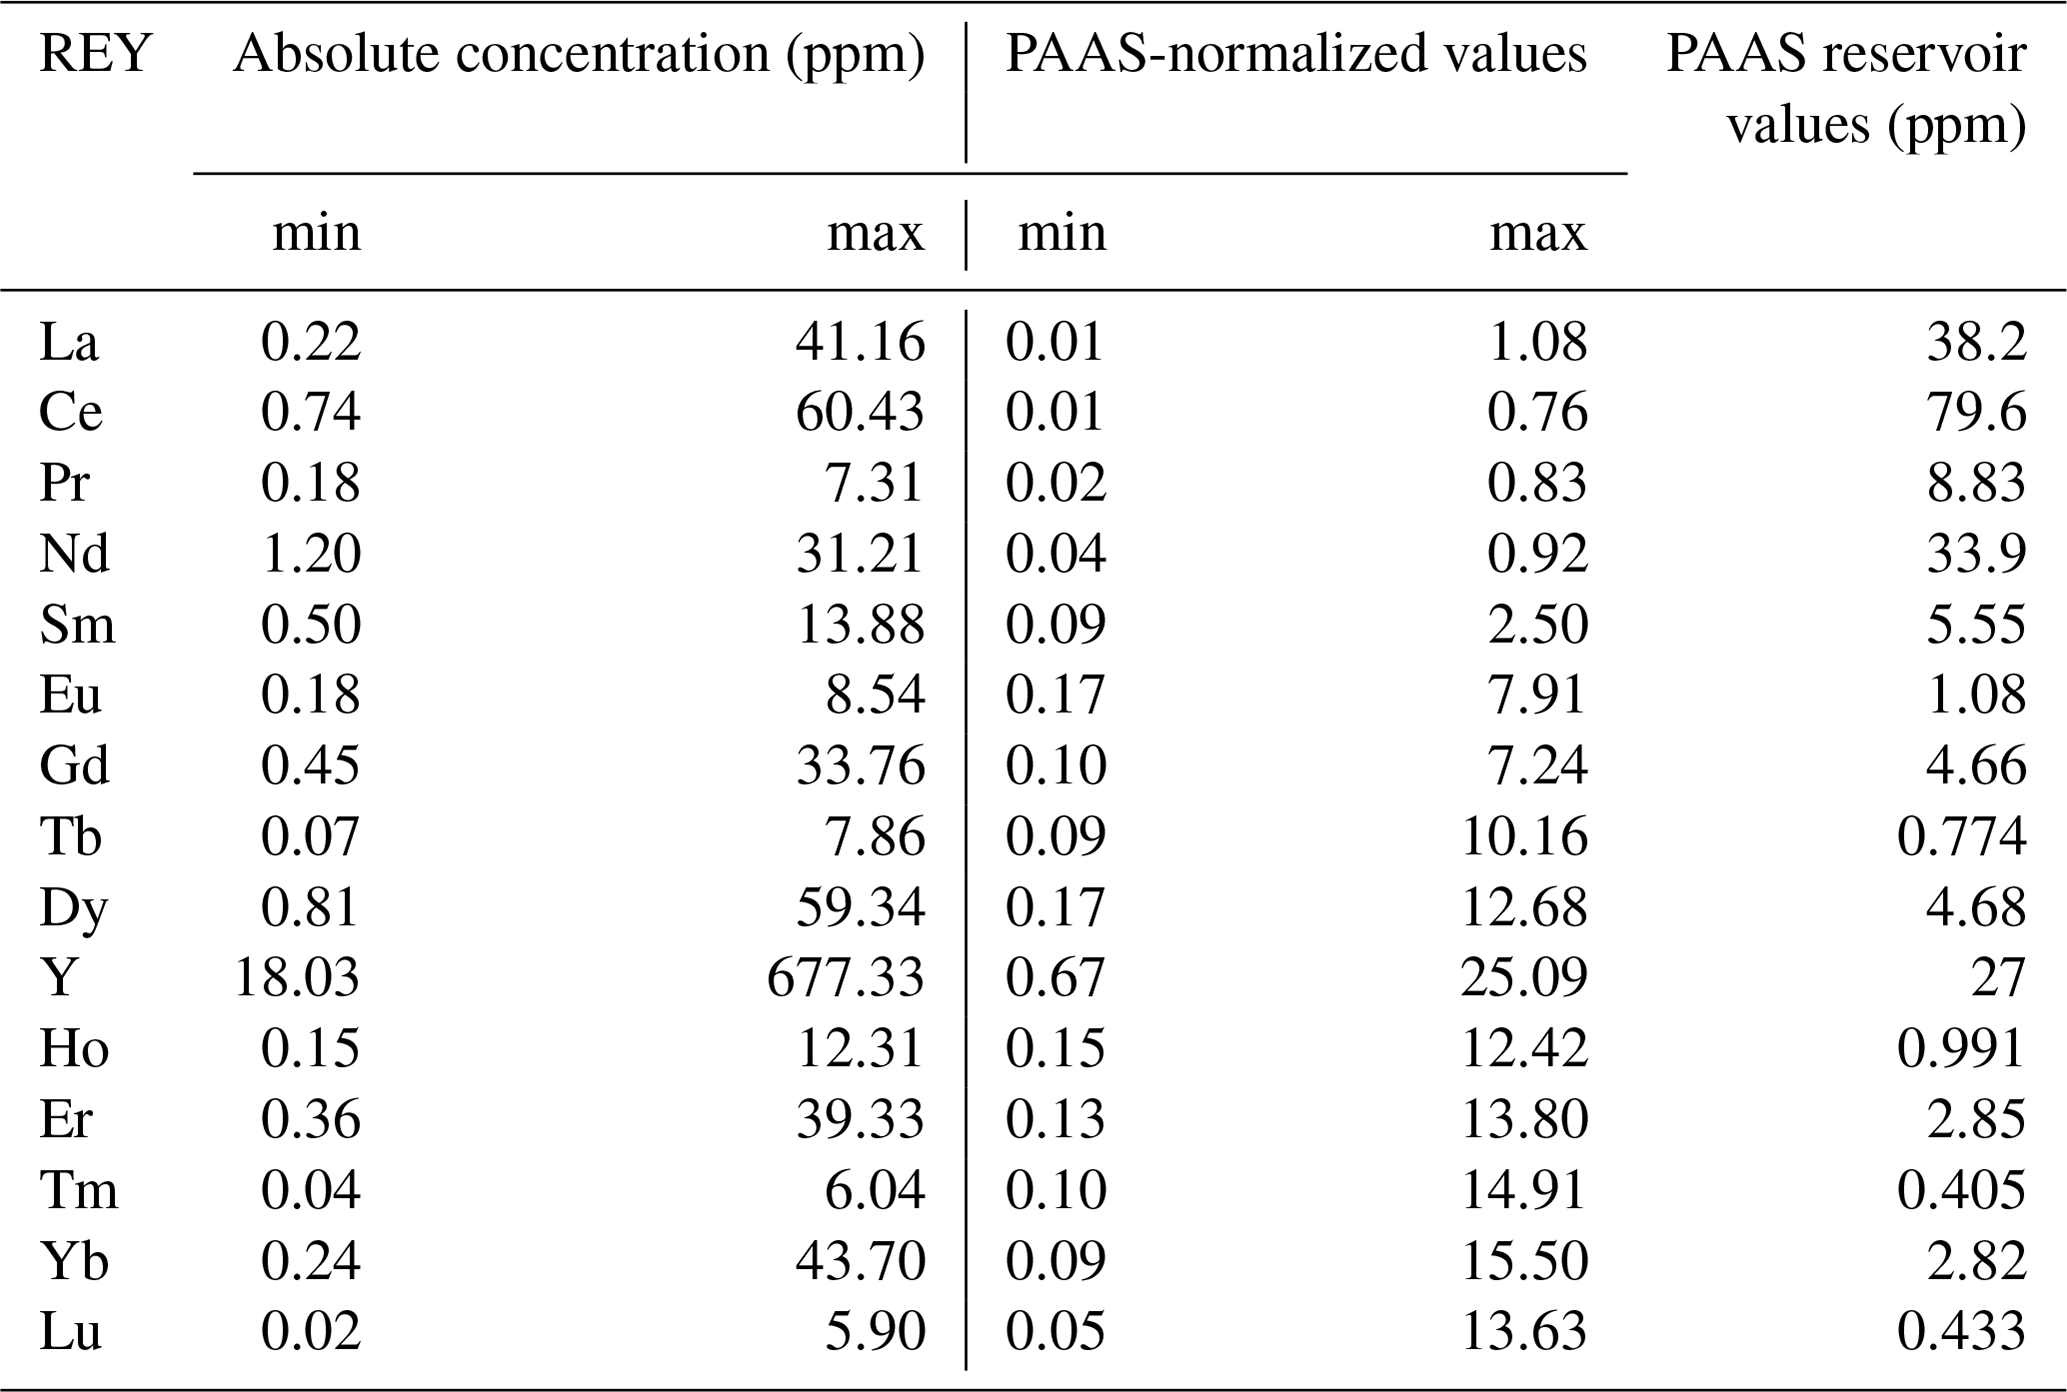
All measurements were performed as point analyses with varying numbers of measurement spots per sample depending on zoning, intergrown crystallites or internal heterogeneities. The trace element patterns are presented as REY patterns after Bau and Dulski (1995) normalized to PAAS after McLennan (1989) (Table 1). All patterns from the single analysis are classified individually into distinct groups based on manual inspection, followed by geochemical discrimination and λ coefficients after O'Neill (2016). The λ coefficients are directly related to the shape of their respective REE pattern, thus allowing them to be used as a mathematical discrimination approach. They represent the polynomial fit coefficients to the shape of REE patterns if algebraically rearranged into an orthogonal form (O'Neill, 2016):
where are polynomials with the three-valent ionic radii of REEs as independent variables excluding Eu due to its anomalous behaviour.
After having classified each pattern from a single analysis, averages were calculated from equally classified, individual measurement spots belonging to the same sample (Table A1). The total ranges of measured absolute concentrations and PAAS-normalized values among all analyses for the individual REEs and Y are given in Table 1.
Table 1The total range of absolute concentrations among all samples for REEs plus Y measured by LA-ICP-MS, the total range of corresponding PAAS-normalized values and the PAAS reservoir values after McLennan (1989).
4.1 Fluorite groups
From all REY patterns, a total of seven fluorite groups were identified (Fig. 4) that are named from I to VII for the purpose of distinguishability only without implying any inherent sequence. In general, all groups are characterized by a roof-shaped pattern showing a depletion of LREEs (light REEs; La to Sm) with a kink at Nd and enrichment in MREEs (medium REEs; Eu to Dy), as well as enriched HREEs (Ho to Lu) relative to LREEs but variable with respect to MREEs. In addition, a positive Y anomaly is present in all groups. Subtle differences exist among all patterns that allow us to uniquely distinguish them. Group III is characterized by a strong depletion of LREEs, the lack of a Eu anomaly, and an approx. homogenous level of MREEs and HREEs. Group I differs from this pattern only by a positive Eu anomaly. Group IV shares a less distinct positive Eu anomaly but is distinguished by a positive slope within the MREEs and characterized by elevated HREEs relative to III and I. Group II mimics the pattern of IV except for a more intense depletion of LREEs. The pattern of group V stands out from the others due to an overall more equal distribution of REY values, as well as a continuous, non-linear increase from the enriched LREEs over the MREEs to the HREEs. All samples included in groups I to V were collected from the Finstergrund deposit. Group VI and VII samples show the only patterns with a distinct depletion and a negative slope within the HREEs relative to MREEs. Group VI and VII samples can be distinguished by the presence or absence of a positive Eu anomaly, respectively. The samples of group VI and VII originate from the Tannenboden deposit with one single exception of a 2 mm sized vein in gneiss (sample “FI20-09-01”).
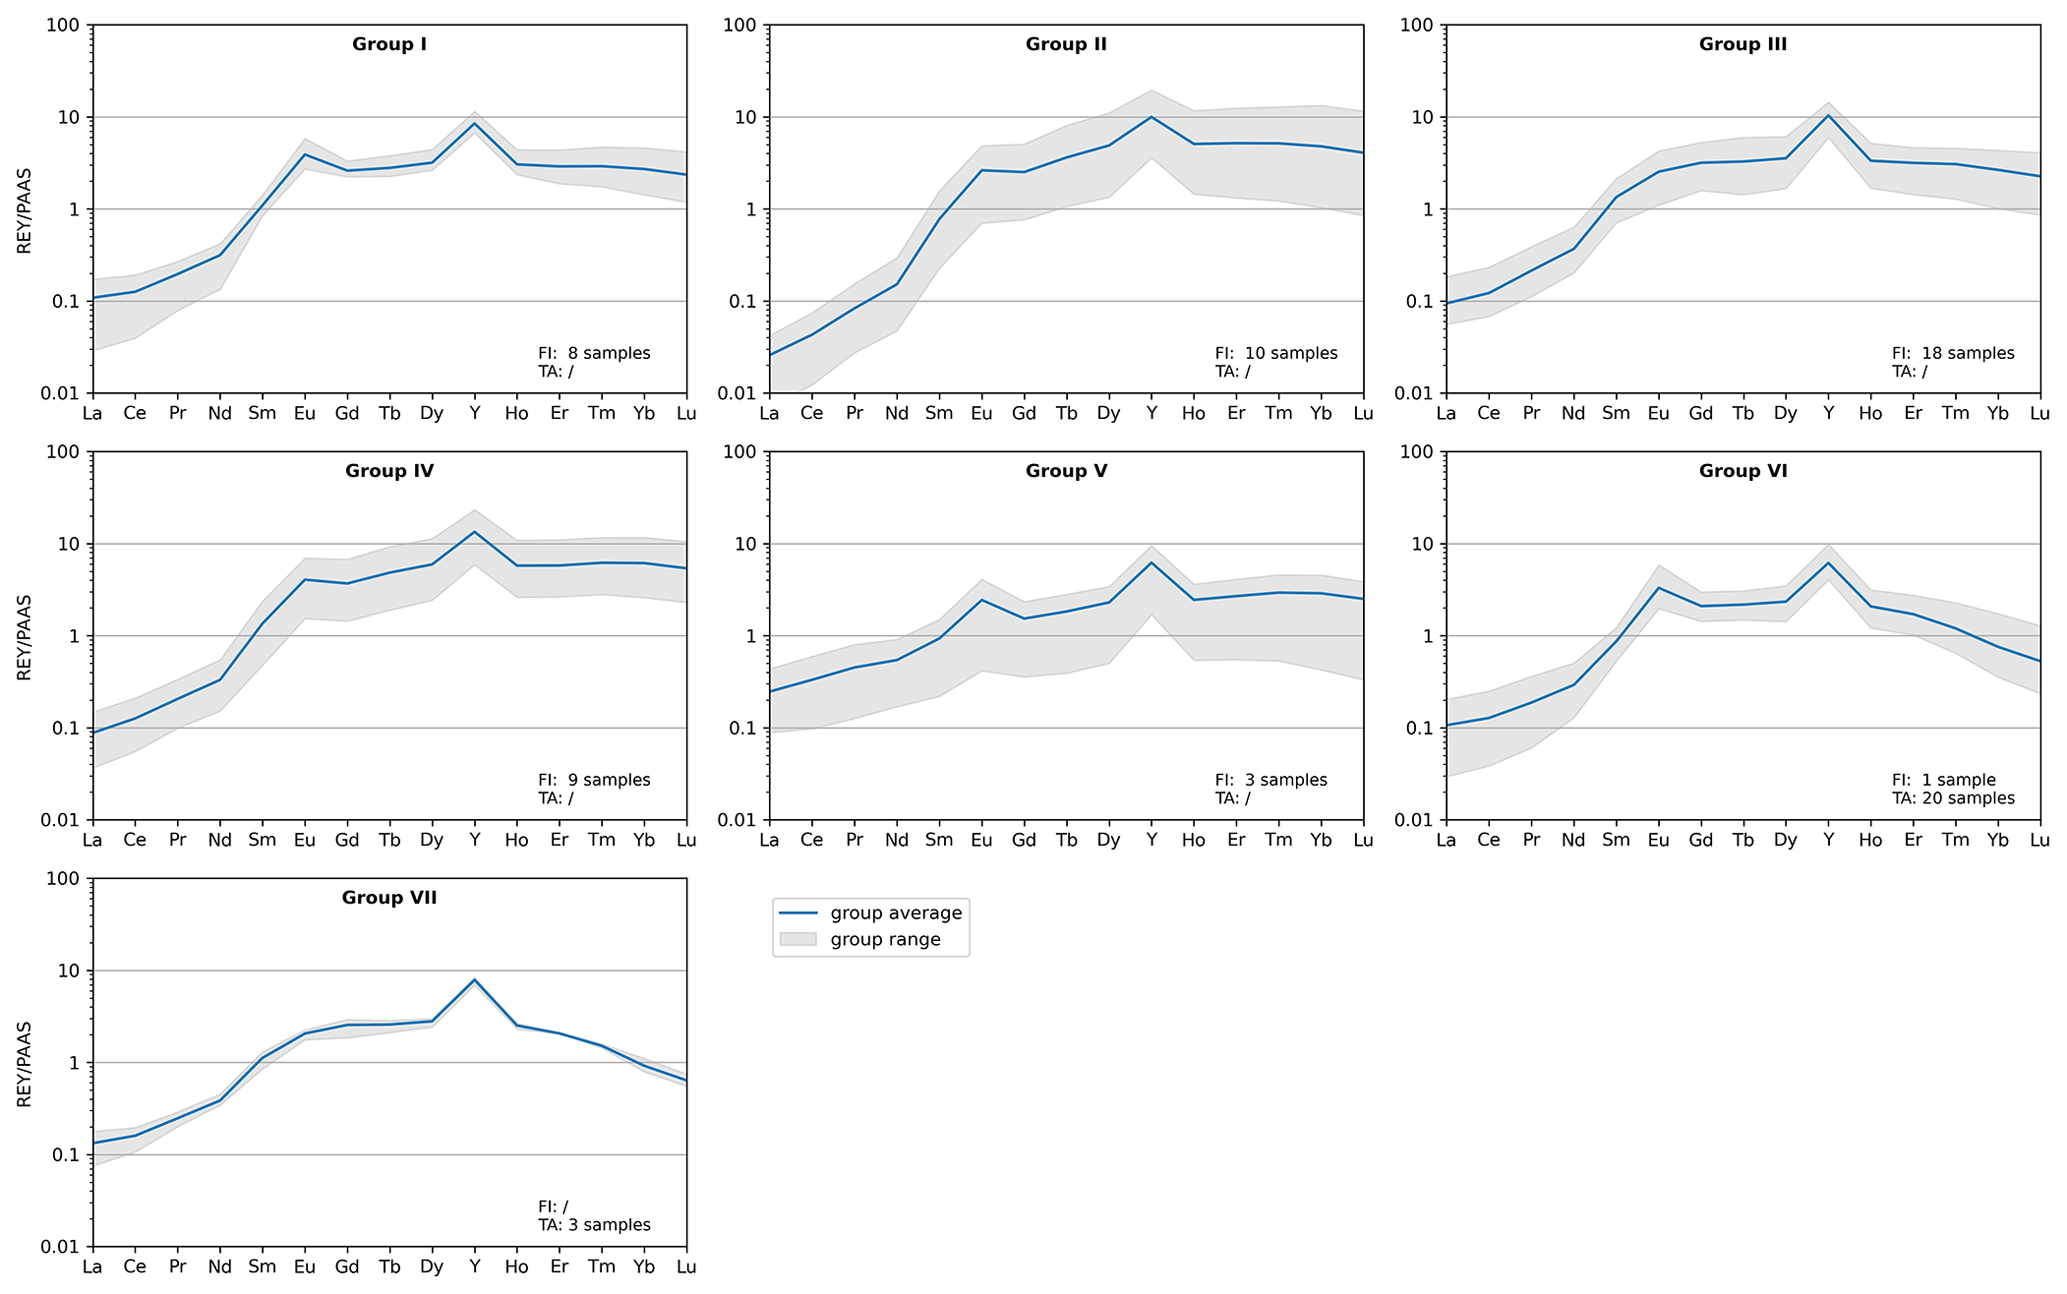
Figure 4Identified fluorite groups with unique REY pattern. The number and origin of samples included in a group are each given in the lower right. FI: Finstergrund deposit; TA: Tannenboden deposit.
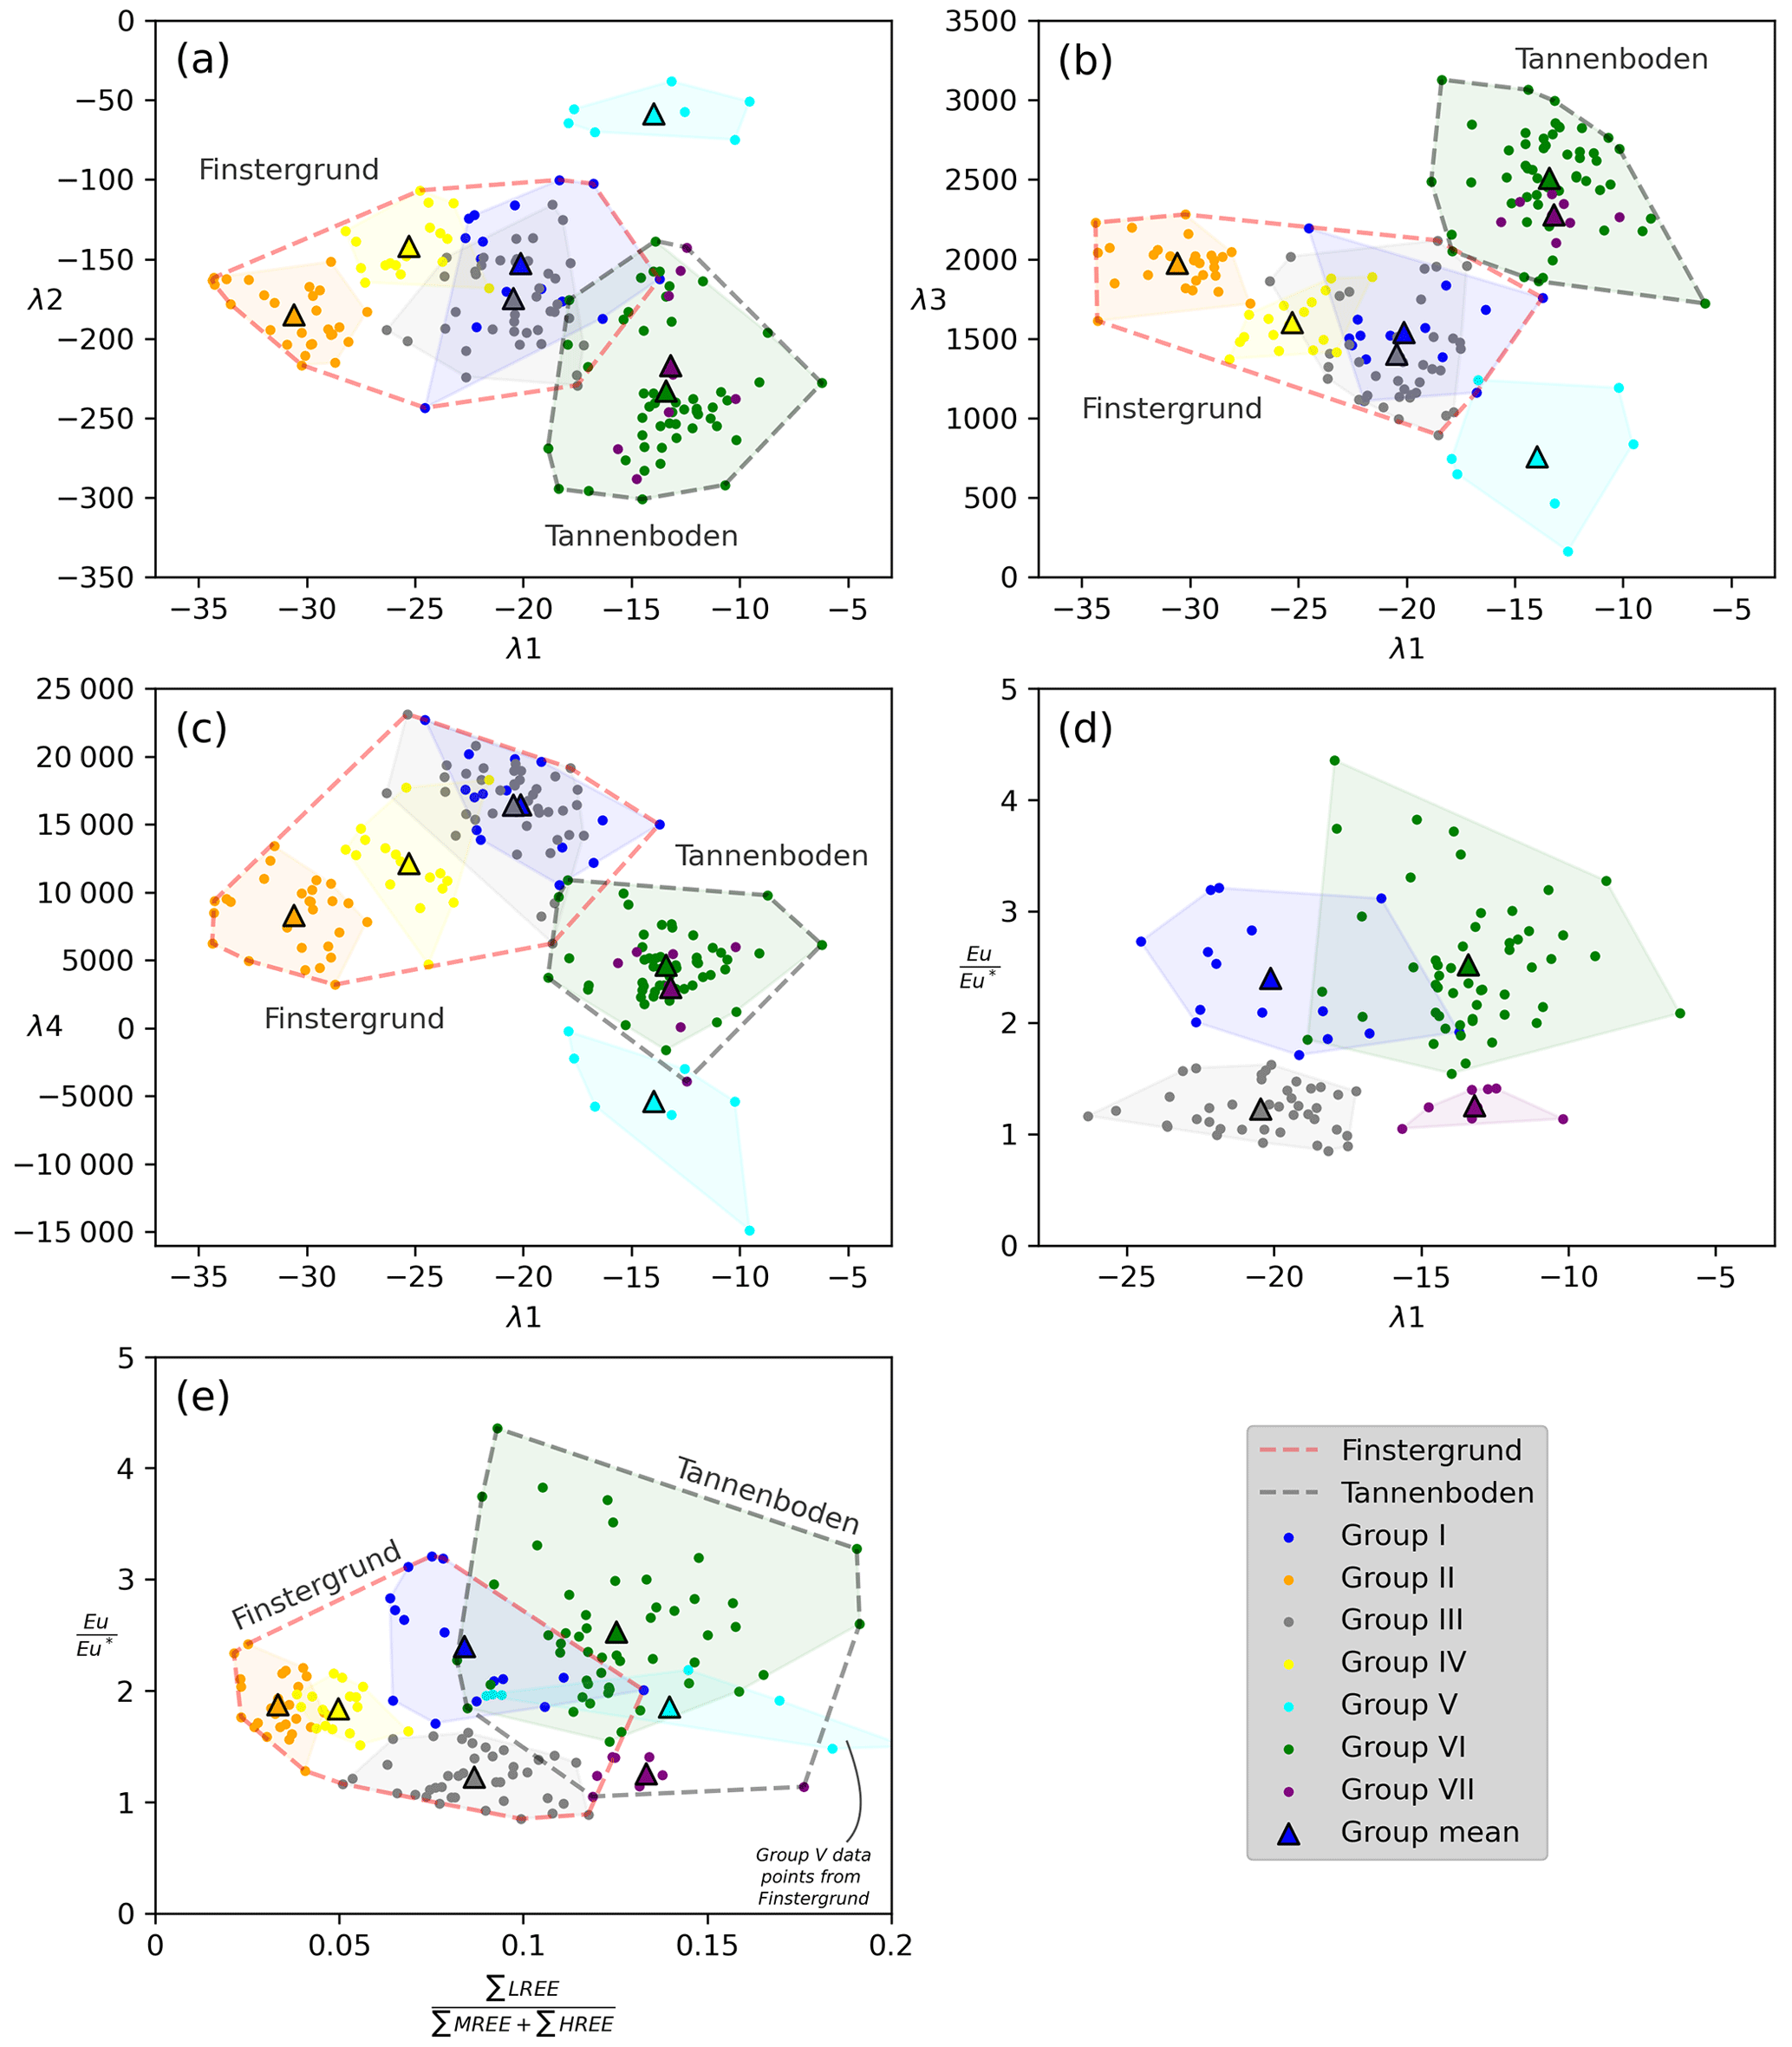
Figure 5Discrimination of identified fluorite groups by geochemical parameters, (e) where Eu Eu∗ = , and λ coefficients (a–c) using the mathematical approach of O'Neill (2016). The overlap between groups III and I on the one hand, as well as VI and VII on the other, is resolved by a hybrid discrimination plot (d). Note that the samples comprising group V are collected from the Finstergrund deposit but have been left separated due to unclear attachment to either the Finstergrund or Tannenboden suite as explained in the text. Each data point refers to a single analysis.
4.2 Discrimination of fluorite groups
The classification of the fluorite REY patterns into the presented groups is supported by discrimination using geochemical parameters and λ coefficients (Fig. 5). Parameters from both approaches are required to fully separate the proposed fluorite groups. Apart from group V in the geochemical discrimination plot (Fig. 5e), the majority of groups are clearly separated. The Tannenboden data tend to plot towards elevated LREEs (MREEs + HREEs) ratios compared to the data from Finstergrund. A small overlap exists for individual data points between groups I and VI, as well as between groups II and IV. Regarding the total ranges for these groups in Fig. 5, the outermost patterns may overlap. However, the group averages presented for the patterns (Fig. 5), as well as for the discrimination plots (Fig. 5), are clearly distinguished. Group V samples cannot unambiguously be assigned to the remaining agglomeration of Finstergrund data in the geochemical discrimination plot despite including only samples from this deposit. In the λ-coefficient plots (Fig. 5a–c), however, group V samples are clearly designated as own fluorite group. Its association to the remaining Finstergrund or Tannenboden data remains unclear. In Fig. 5a and b, it is rather assigned to the Finstergrund suite, whereas in Fig. 5c, it appears to be associated with Tannenboden. Besides group V, the fluorite suites sampled from Finstergrund and Tannenboden are unequivocally separated.
The identified fluorite patterns are equally well discriminated by different combinations of λ coefficients, taking into account that Eu is neglected in the fitting approach (O'Neill, 2016). For this reason, the direct overlap between groups I and III on the one hand, as well as groups VI and VII on the other, was expected because they differ only by the presence or absence of a positive Eu anomaly. The hybrid λ1 vs. plot (Fig. 5d) shows that discrimination between both cases is possible if Eu is considered.
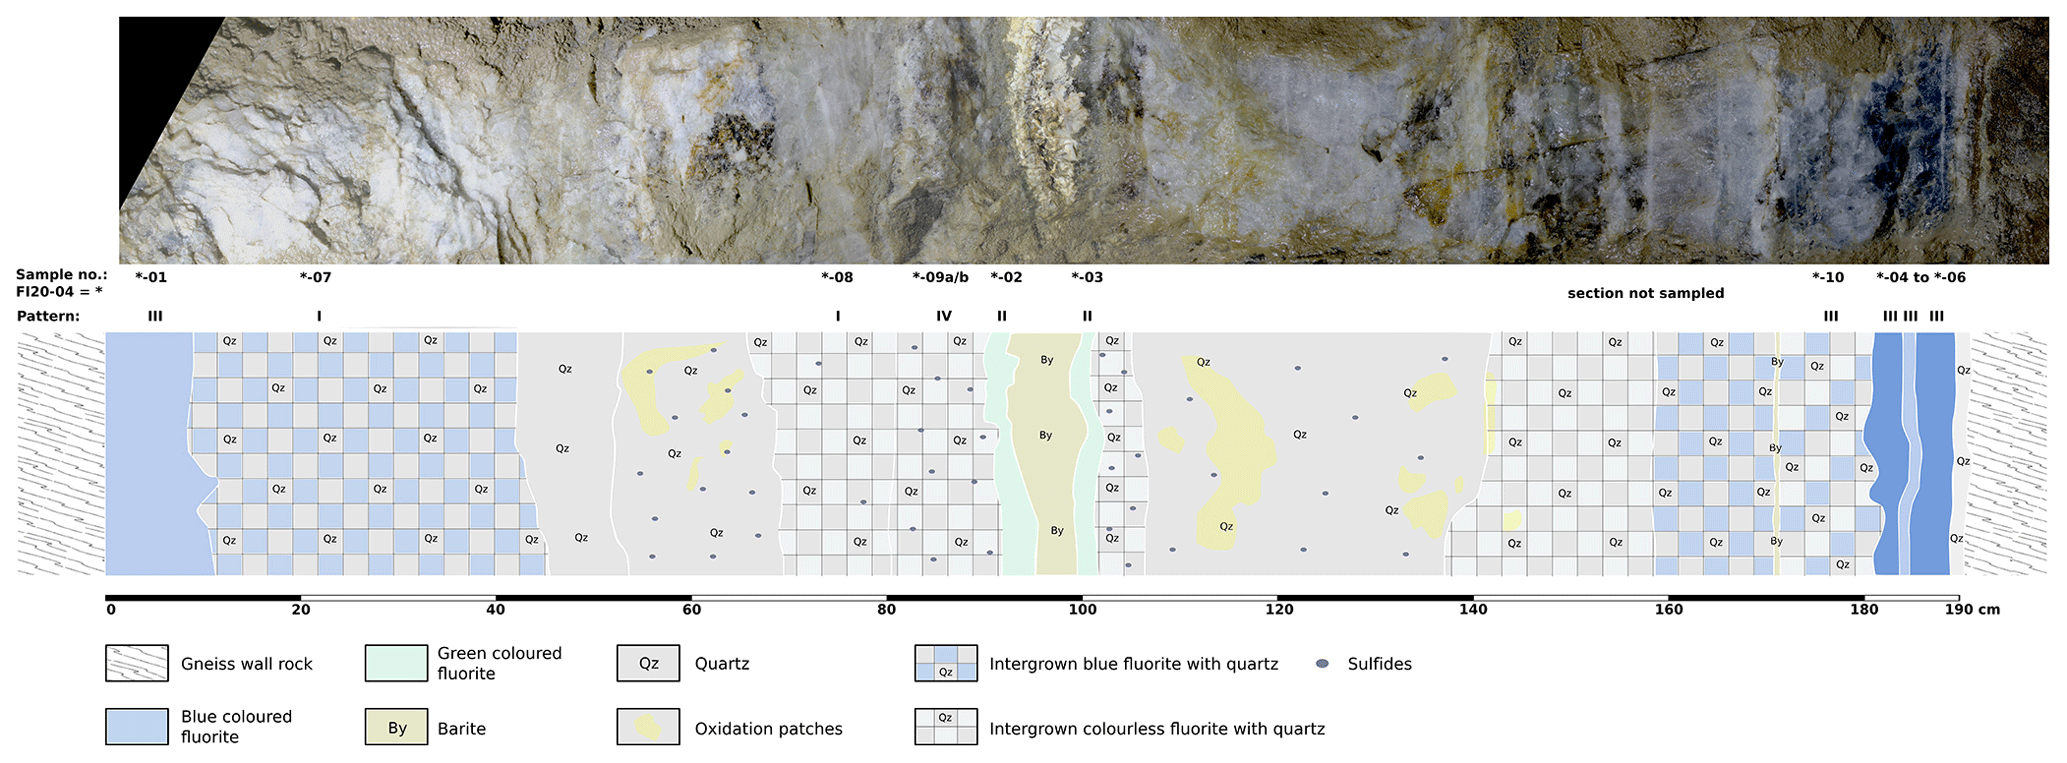
Figure 6Photographic stitch and schematic abstraction of the mineralization sequence “FI20-04” from the Finstergrund deposit. The classification results of fluorite REY patterns are indicated in the centre showing a symmetric sequence of precipitated fluorite groups from the central occurrence of barite towards both selvages at the outer rims.
4.3 Geological and mineralogical relationships
By transferring the classified fluorites into their geological context, a relationship between the identified fluorite REY groups from the scale of vein mineralization to crystal zoning is revealed. Figure 7 shows a sequence of fluorite mineralization from the Finstergrund deposit, nearly 2 m in width, composed of different precipitation events including non-fluorite phases like quartz, barite and subordinate amounts of sulfides. The barite mineralization is situated at the centre of the sequence from where the same order of lithological changes and fluorite groups occurs towards both sides. Subtle deviations exist only with respect to the thickness of bands or the presence of subordinate, small-sized veins (e.g. barite vein at approx. 170 cm). Adjacent to the central barite mineralization, greenish-coloured fluorite bands classified as group II are observed on both sides. Equally, blue-coloured group III fluorite forms the selvage on both sides. The intermediate sequence composed of group I and group IV fluorites has unfortunately been sampled only at one side. Independently from this sequence, sample FI20-08-02c (Fig. 7) is characterized by concentric growth zoning along which the fluorite evolves from group III in the core to group I at the rim. A positive Eu anomaly is formed stepwise across the zoned grains, while the total amount of REEs tends to decrease non-linearly from III to I. The fluorite colour seems to become lighter with the decreasing total amount of REEs as the core is dark grey and the rim significantly more transparent. This difference in colour is observed in additional samples that contain subgrains classified as either group I or group III. The relative order between group III and I in the zoned fluorite is in agreement with the order observable in the sequence presented before. Figure 9 shows a second example for concentric fluorite zoning with group II dominating from the core outwards except for the outermost zone classified as group V as the rim. Group V fluorite occurs with three collected samples only, all of which share a dark blue or purple colour and are partly enriched in Th.
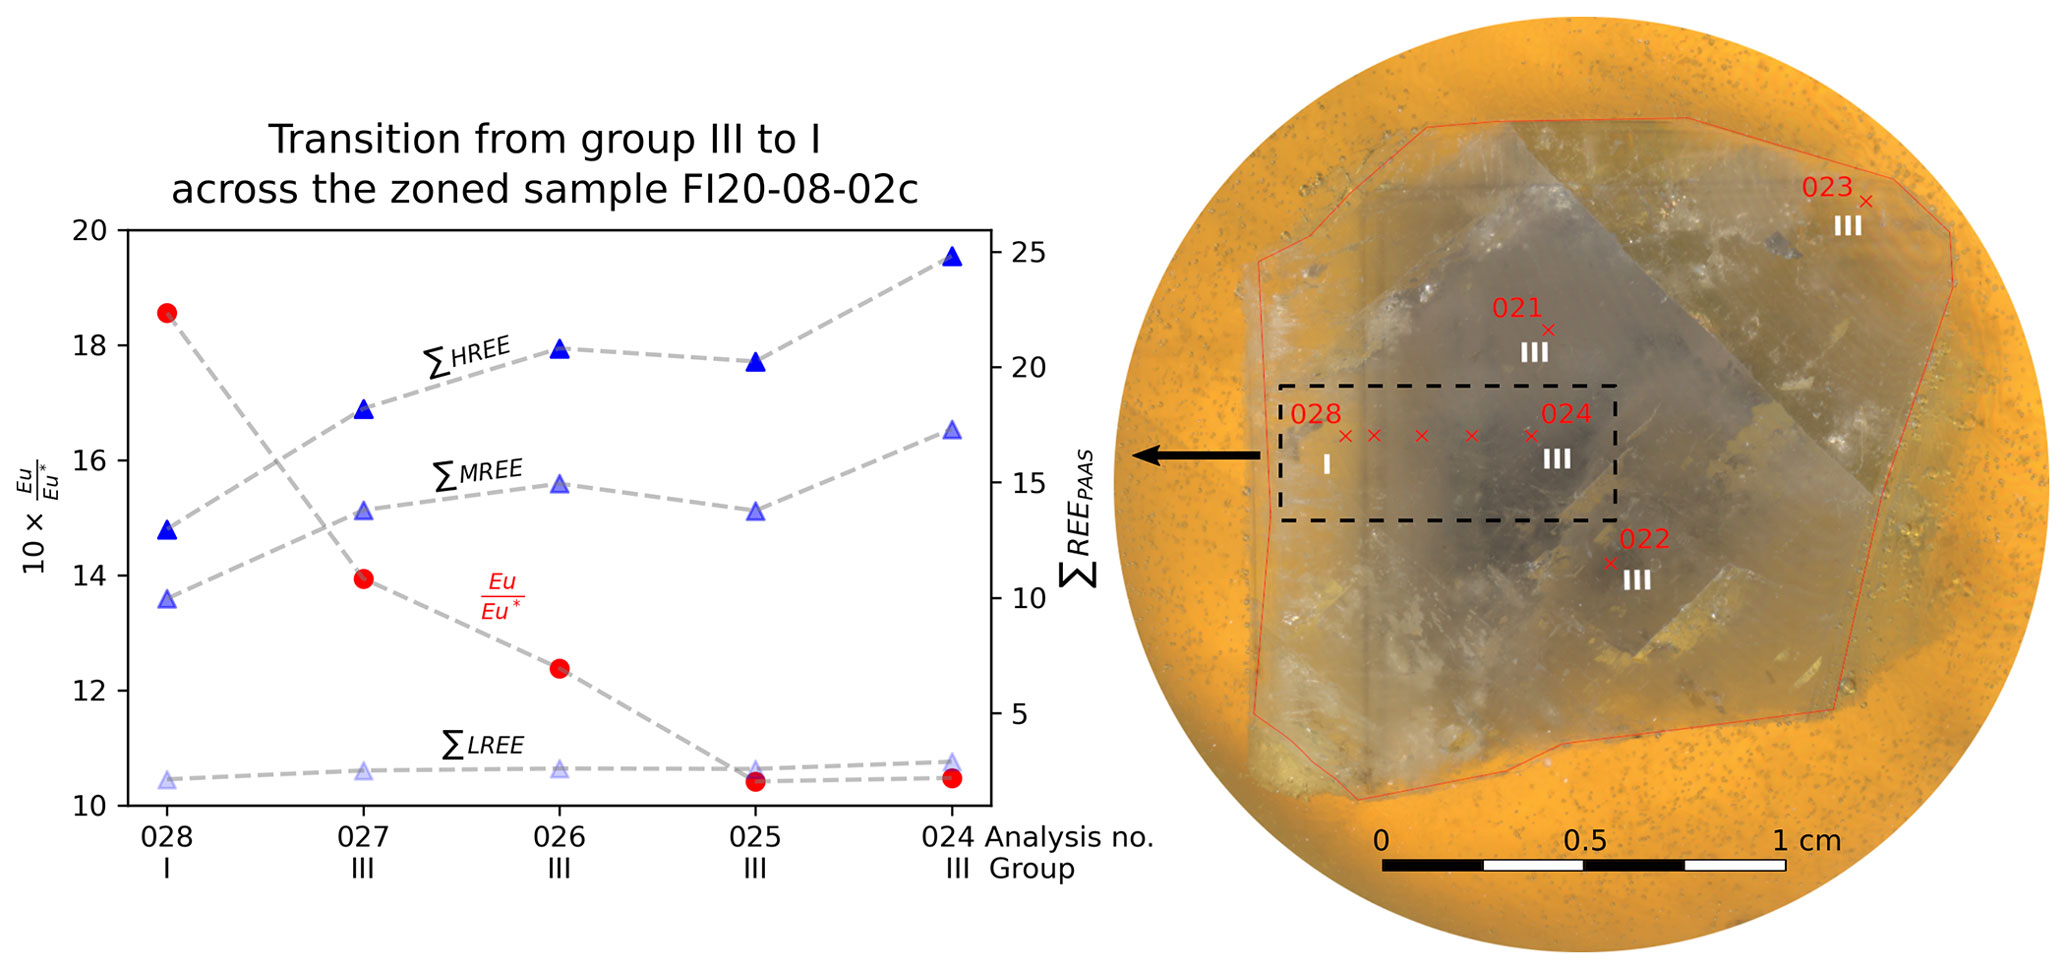
Figure 7Sample “FI20-08-02c” embedded in epoxy resin showing the distribution of analysis spots and affiliated REY groups. The grain is concentrically zoned (spots 24–28) and includes internal subgrains (e.g. spot 22). The change in REEs and Eu Eu* from core to rim across the zoning is plotted in the diagram to the left.
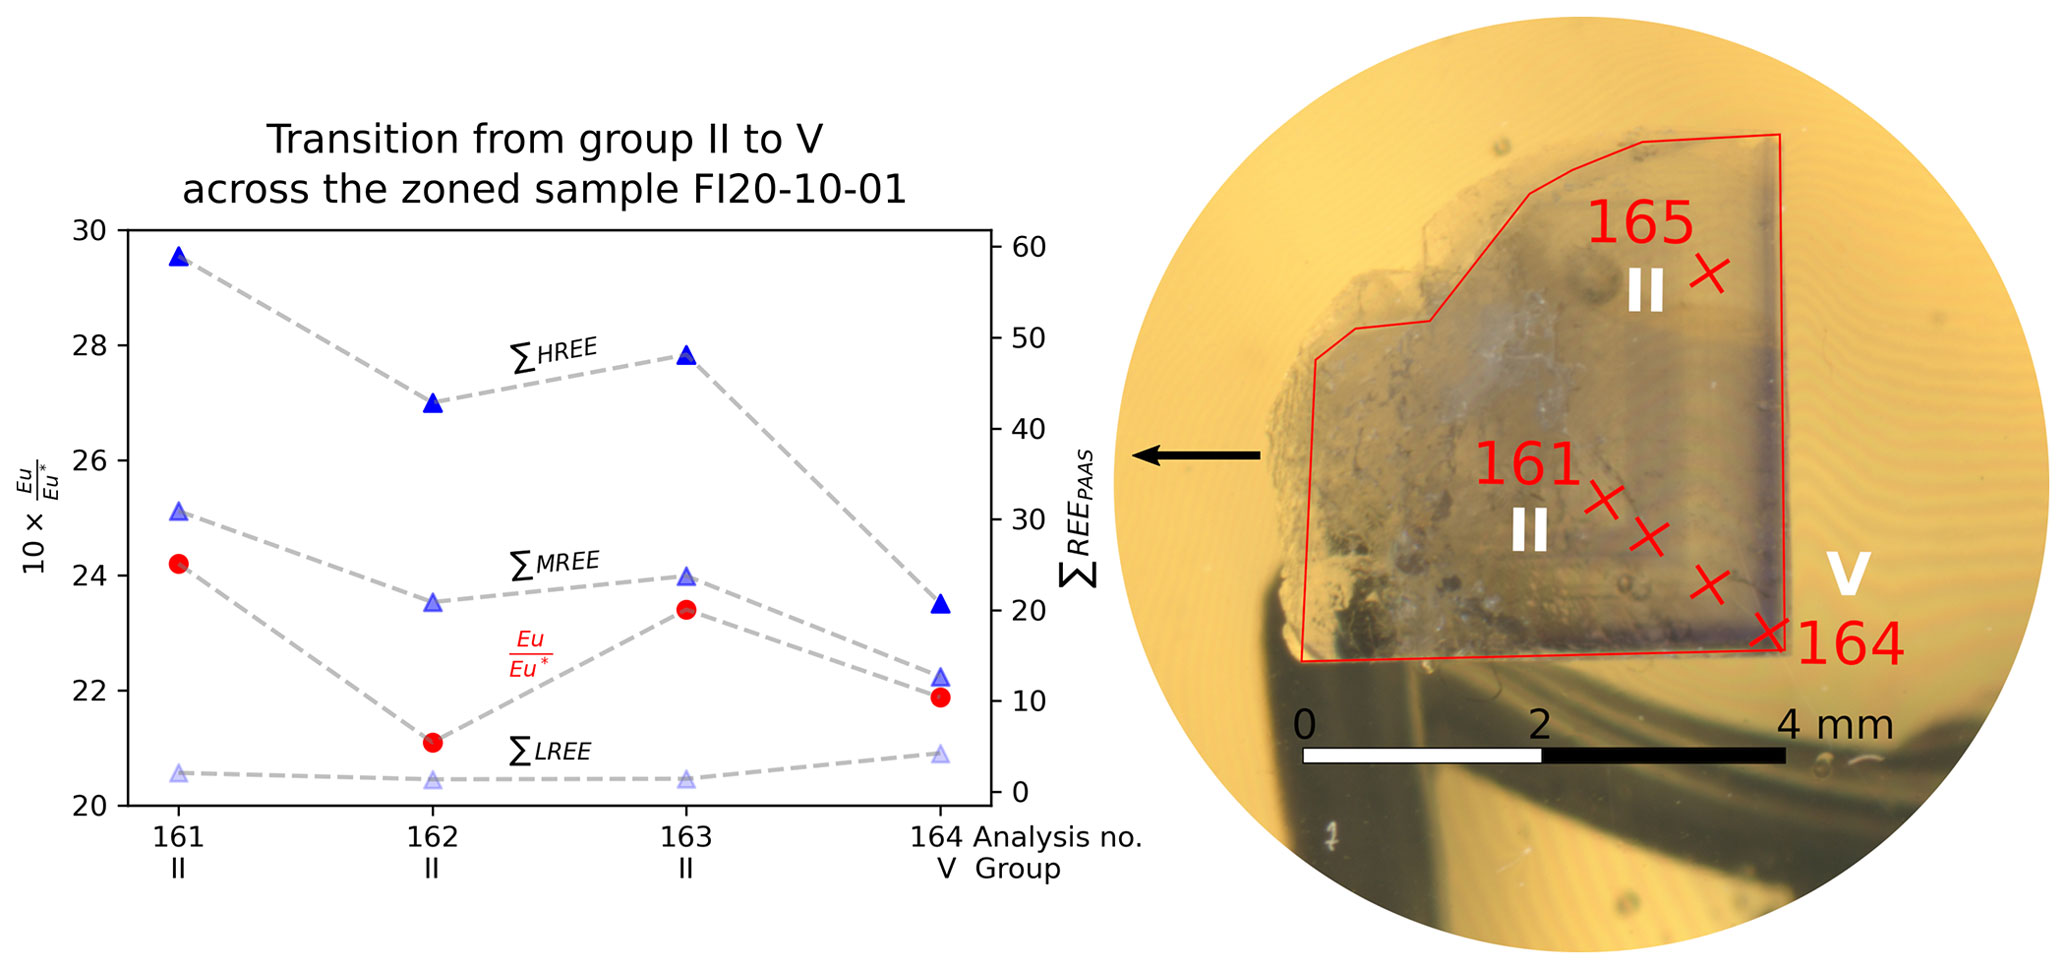
Figure 8Sample “FI20-10-01” from the Finstergrund deposit embedded in epoxy resin showing the distribution of analysis spots and affiliated REY groups. The grain is concentrically zoned (spots 161–164) and classified as group II fluorite from its core outwards except for the rim matching with group V (spot 164 only). The change in REEs and Eu Eu* from core to rim across the zoning is plotted in the diagram to the left.
4.4 Unmatched fluorite REY patterns
A total of 182 fluorite analyses were obtained by laser ablation ICP-MS (LA-ICP-MS), from which 15 do not match the proposed fluorite groups on the basis of their REY pattern (Fig. B1). The majority resembles the typical roof-shaped pattern of the identified groups but is mismatched due to deviating slopes or unfitting PAAS-normalized values of individual elements. Some are characterized by REY patterns that vary completely from the proposed fluorite groups (e.g. analysis 029, 030). These were not identified in any other sample.
Single-fluorite REE patterns from the Wieden mining district were reported by Möller et al. (1982) and Franzke and Lüders (1993) without specification of the investigated veins. Bau and Dulski (1995) and Walter et al. (2018b) include fluorite REE patterns from the Tannenboden deposit for a single sample only. To the best of our knowledge, fluorite REE data for the Finstergrund deposit have not been published up to now. Hence, the local diversity of fluorite REE geochemistry linked to the long-term fluid evolution and successive mineralization events in the Wieden mining district (Walter et al., 2016; Werner et al., 2020) has not yet been investigated.
The physico-chemical processes during fluorite mineralization are recorded by the REE pattern and can be used to unravel the conditions during mineral precipitation, to estimate a minimum number of fluid mobilization events and for aquifer provenance analysis (Bau and Dulski, 1995; Möller et al., 1997, 1998; Schwinn and Markl, 2005). It is widely accepted that the REY signature of hydrothermal fluorites can reflect the fluid REY composition (e.g. Möller et al., 1998; Schwinn and Markl, 2005; Nadoll et al., 2018). The effect of co-precipitating minerals on the REY signature of fluorite is commonly attributed to REE-rich minerals such as bastnäsite or monazite and to calcite where REY substitutes for Ca (e.g. Chesley et al., 1991; Smith et al., 2000; Gagnon et al., 2003; Debruyne et al., 2016; Perry and Gysi, 2020). In the study area, minerals co-precipitating with fluorite include quartz, barite and pyrite, which do not contain stoichiometric Ca. Therefore, no significant effect on the fluorite REY pattern is expected by co-precipitating minerals. It is emphasized that the number of identified fluorite REY patterns is not equal to the number of fluorite generations or fluid mobilization events in the lithosphere. Only the continuous evolution of the fluid chemistry, leading to distinct patterns, is recorded as will be explained in the following. The interpretation is assisted by the La Ho vs. Y Ho plot (Fig. 9). The total amount of samples collected from fluorite sequences in this study ought to cover all major fluorite precipitation events of the Finstergrund and Tannenboden deposits within the Wieden mining district. Based on the distinct features in fluorite REY patterns between samples from both deposits (Fig. 5) and their clear separation in geochemical and λ-coefficient discrimination plots (Fig. 5), two independent formation histories are implied for the Finstergrund and Tannenboden deposits.
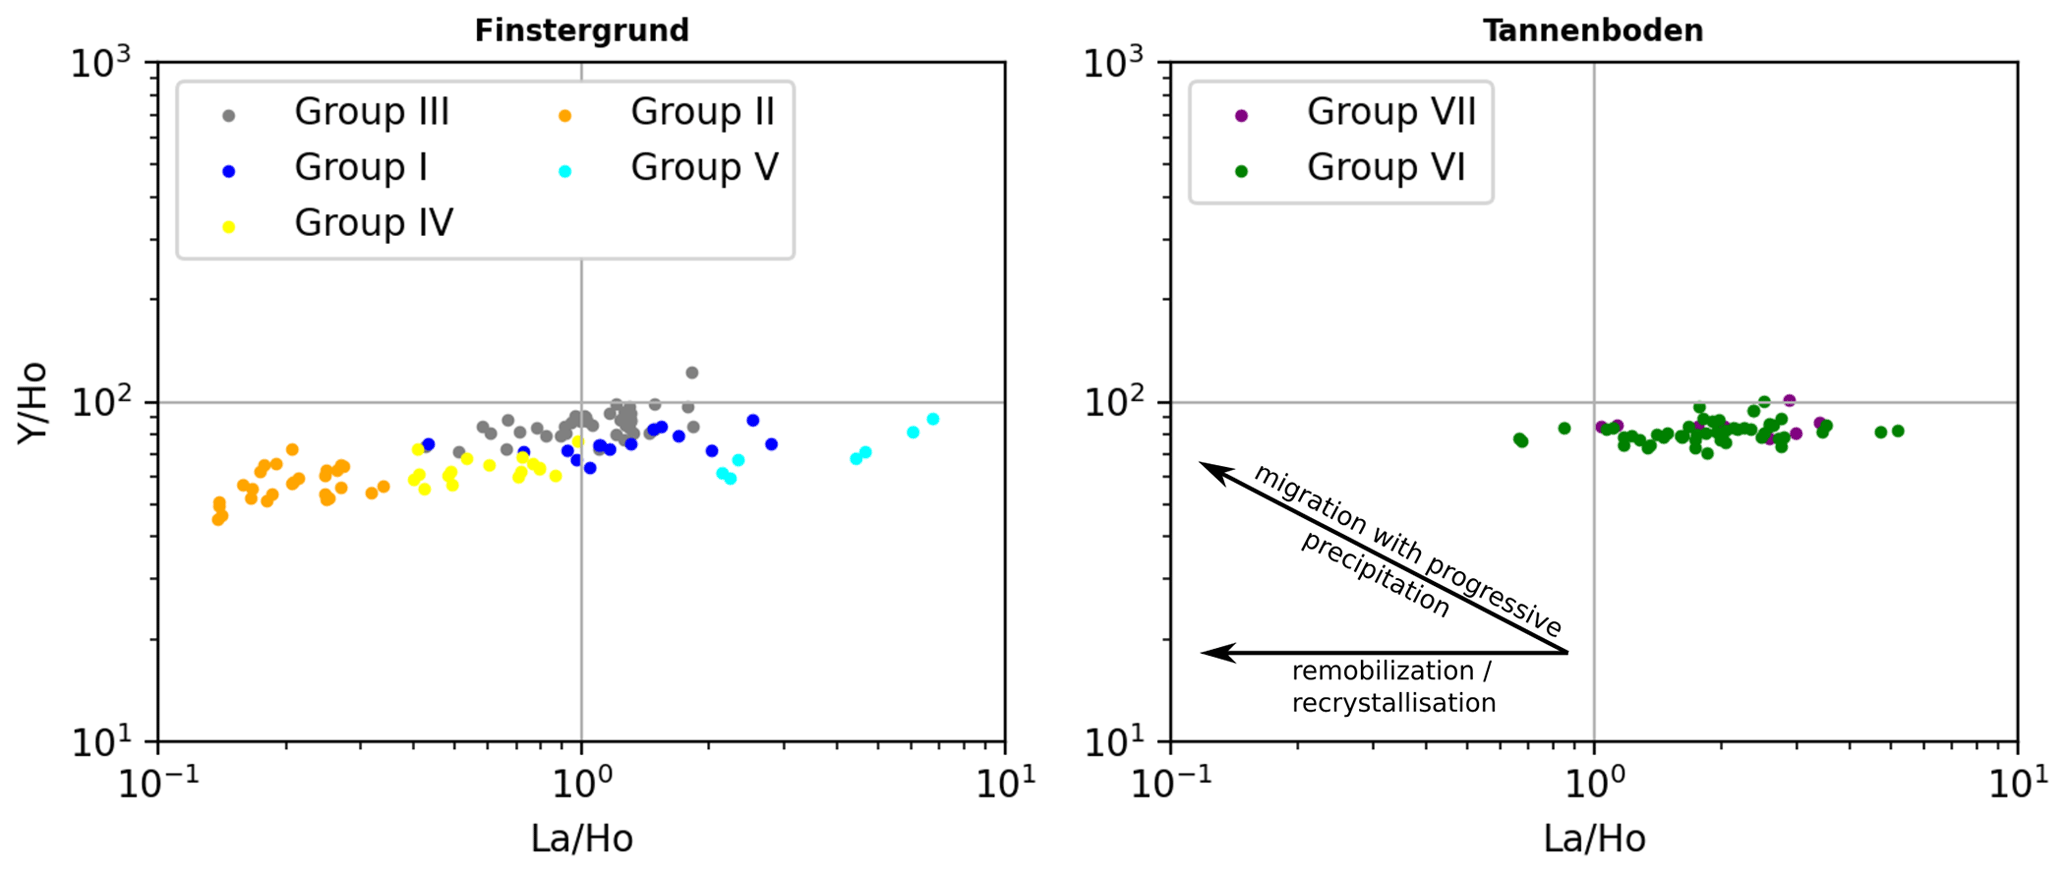
Figure 9La Ho–Y Ho plot highlighting migration-coupled precipitation vs. remobilization and recrystallization trends based on the relative mono-fluoride REE complex stabilities after Bau and Dulski (1995). Data points for the identified fluorite groups from the Finstergrund and Tannenboden deposits are plotted.
5.1 Genetic implications for the Finstergrund deposit
Based on the observed mineralization sequence in the Finstergrund vein (Fig. 6) and crystal zoning (Figs. 7 and 9), the order of precipitation for the identified fluorite REY patterns is III → I → IV → II → V (Fig. 11).
5.1.1 Geochemical evolution and fluorite mineralization stages at the Finstergrund deposit
A temperature decline is expected due to post-Variscan cooling. The relative temperature of fluorite precipitation is indicated by the presence or absence of an Eu anomaly in the REY pattern (Bau and Dulski, 1995; Möller et al., 1998; Möller, 2000). The ratio in the fluid is thermochemically governed by the oxidation of Eu2+ to Eu3+ below 250 ∘C with respect to relevant oxygen fugacity conditions, f(O2), in the shallow lithosphere (Sverjensky, 1984; Bilal, 1991). At higher temperatures, Eu2+ is the dominant ion whose octahedrally coordinated radius ( nm) is too large to be incorporated in fluorite by Ca2+ substitution ( nm). It is enriched in the residual fluid or adsorbed onto mineral surfaces instead. Upon oxidation to Eu3+ at lower temperatures, the ionic radius decreases ( nm) and matches the fluorite crystal lattice (Shannon, 1976; Möller et al., 1998; Möller, 2000). A slightly reduced hydrothermal fluid that has inherited a positive Eu anomaly from its source rock will precipitate fluorites with a positive Eu anomaly only at temperatures significantly below 250 ∘C. Möller et al. (1998) and Schwinn and Markl (2005) thus emphasize that all fluorites with a positive Eu anomaly must have crystallized at temperatures below 200 ∘C. According to this argumentation, group III fluorites of the Finstergrund deposit are suggested to have formed above 200 ∘C representing the oldest mineralization event, whereas groups I, IV, II and V are younger having formed below 200 ∘C due to their positive Eu anomalies (Fig. 11). Group I fluorites succeed group III in terms of the mineralization history because of its analogous pattern except for the increasing positive Eu anomaly also displayed in the core–rim relationship observed in Fig. 7. In the La Ho vs. Y Ho plot (Fig. 9), group I and III fluorites show similar values, indicative of precipitation from the same fluid suite.
The transition from group I to group IV fluorites is characterized by an increase in MREEs and HREEs at unchanged values for the LREEs (Fig. 11c). Migdisov and William-Jones (2014) argued that chloride and sulfate complexes are very efficient at binding and transporting REEs in hydrothermal fluorine-bearing fluids; however, given the presence of fluorite mineralization, the speciation and complexation of metals is assumed to be dominated by F−-based ligands. In the range between 100–250 ∘C, the REE speciation is dominated by mono-fluoride complexes, [REEF]2+, which become increasingly stable, with the higher atomic number of the complex metal (Walker and Choppin, 1967; Möller, 1991; Bau and Dulski, 1995). Yttrium, on the other hand, forms the di-fluoride complex [YF2]+ that is more stable relative to the mono-fluoride complexation of Dy and Ho (Loges et al., 2013), which explains the positive Y anomalies in all groups. The HREEs and Y are, thus, preferentially retained in solution due to more stable complexation relative to the LREEs. During continued precipitation under ideal complex-controlled conditions, modelling predicts an increasing trend of LREE and HREE fractionation and the intensification of roof-shaped REY patterns (Möller, 1991). The enrichment in HREEs from group I to group IV is, thus, explained by fractional crystallization during continued precipitation of fluorite. Figure 10, however, shows similar Y Ho values for both groups at decreasing La Ho values from fluorites of group I to group IV fluorite, a typical indication for remobilization or recrystallization (Bau and Dulski, 1995).
The next identified fluorite mineralization event represented by group II shows equally enriched HREEs but differs from group IV by more intensively depleted LREEs and MREEs (Fig. 11d). LREE depletion in fluorite is commonly associated with remobilization and recrystallization. However, different mechanisms are proposed in the literature to explain the observed depletion trend. On the one hand, LREEs are preferentially adsorbed onto mineral surfaces during fluid migration. Remobilization, induced for instance by tectonic stress, therefore leads to a more intensified LREE depletion in recrystallized fluorites (Sholkovitz, 1992; Möller et al., 1998; Nelson et al., 2003). On the other hand, stepwise incomplete fluorite leaching experiments indicate a heterogeneous distribution of REEs by the coexistence of fluorite with an LREE-incorporating submicroscopic phase that is more susceptible to dissolution than fluorite. Partial dissolution of fluorite thus results in LREE depletion, while HREE abundances remain rather unaffected (Bau and Dulski, 1995; Möller et al., 1998). LREE-depleted patterns are related to fluorite remobilization as a consequence of both processes and in agreement with the La Ho vs. Y Ho plot (Fig. 9). Group II and group IV fluorites show equal Y Ho values, while the La Ho values of group II are significantly lower, indicative of remobilization. In terms of La Ho values, group II is also clearly detached from groups III and I of the Finstergrund deposit which, however, unlike group IV, do not share the same HREE characteristics with group II. For these reasons, the pattern of group II fluorites is explained by recrystallization from previously remobilized group IV fluorites. Petrographic features in support of group II fluorite precipitation after remobilization are a predominantly coarse-grained, euhedral crystal growth of mostly group II fluorites (Fig. 10).
Group V involves the youngest fluorites according to crystal zoning (Fig. 8). Characterized by an enrichment in LREEs compared to the other groups (Fig. 11), a shallower origin of the hydrothermal fluid or mixing with meteoric waters is suspected as the rainwater and REE pattern influenced by water–soil interaction are commonly flat (Göb et al., 2013). In the La Ho vs. Y Ho diagram (Fig. 9), group V plots at elevated La Ho values relative to the previous groups. In the λ-coefficient plots (Fig. 5a–c), group V data points are less well correlated with the Finstergrund or Tannenboden agglomeration. Both generally support a genetically decoupled origin of group V fluorites compared to the other fluorite groups, which is suggested to be related to the mixing with meteoric water.
Figure 10Photographs of exemplary group II fluorites exhibiting coarse-grained, euhedral crystal growth and blue colour.
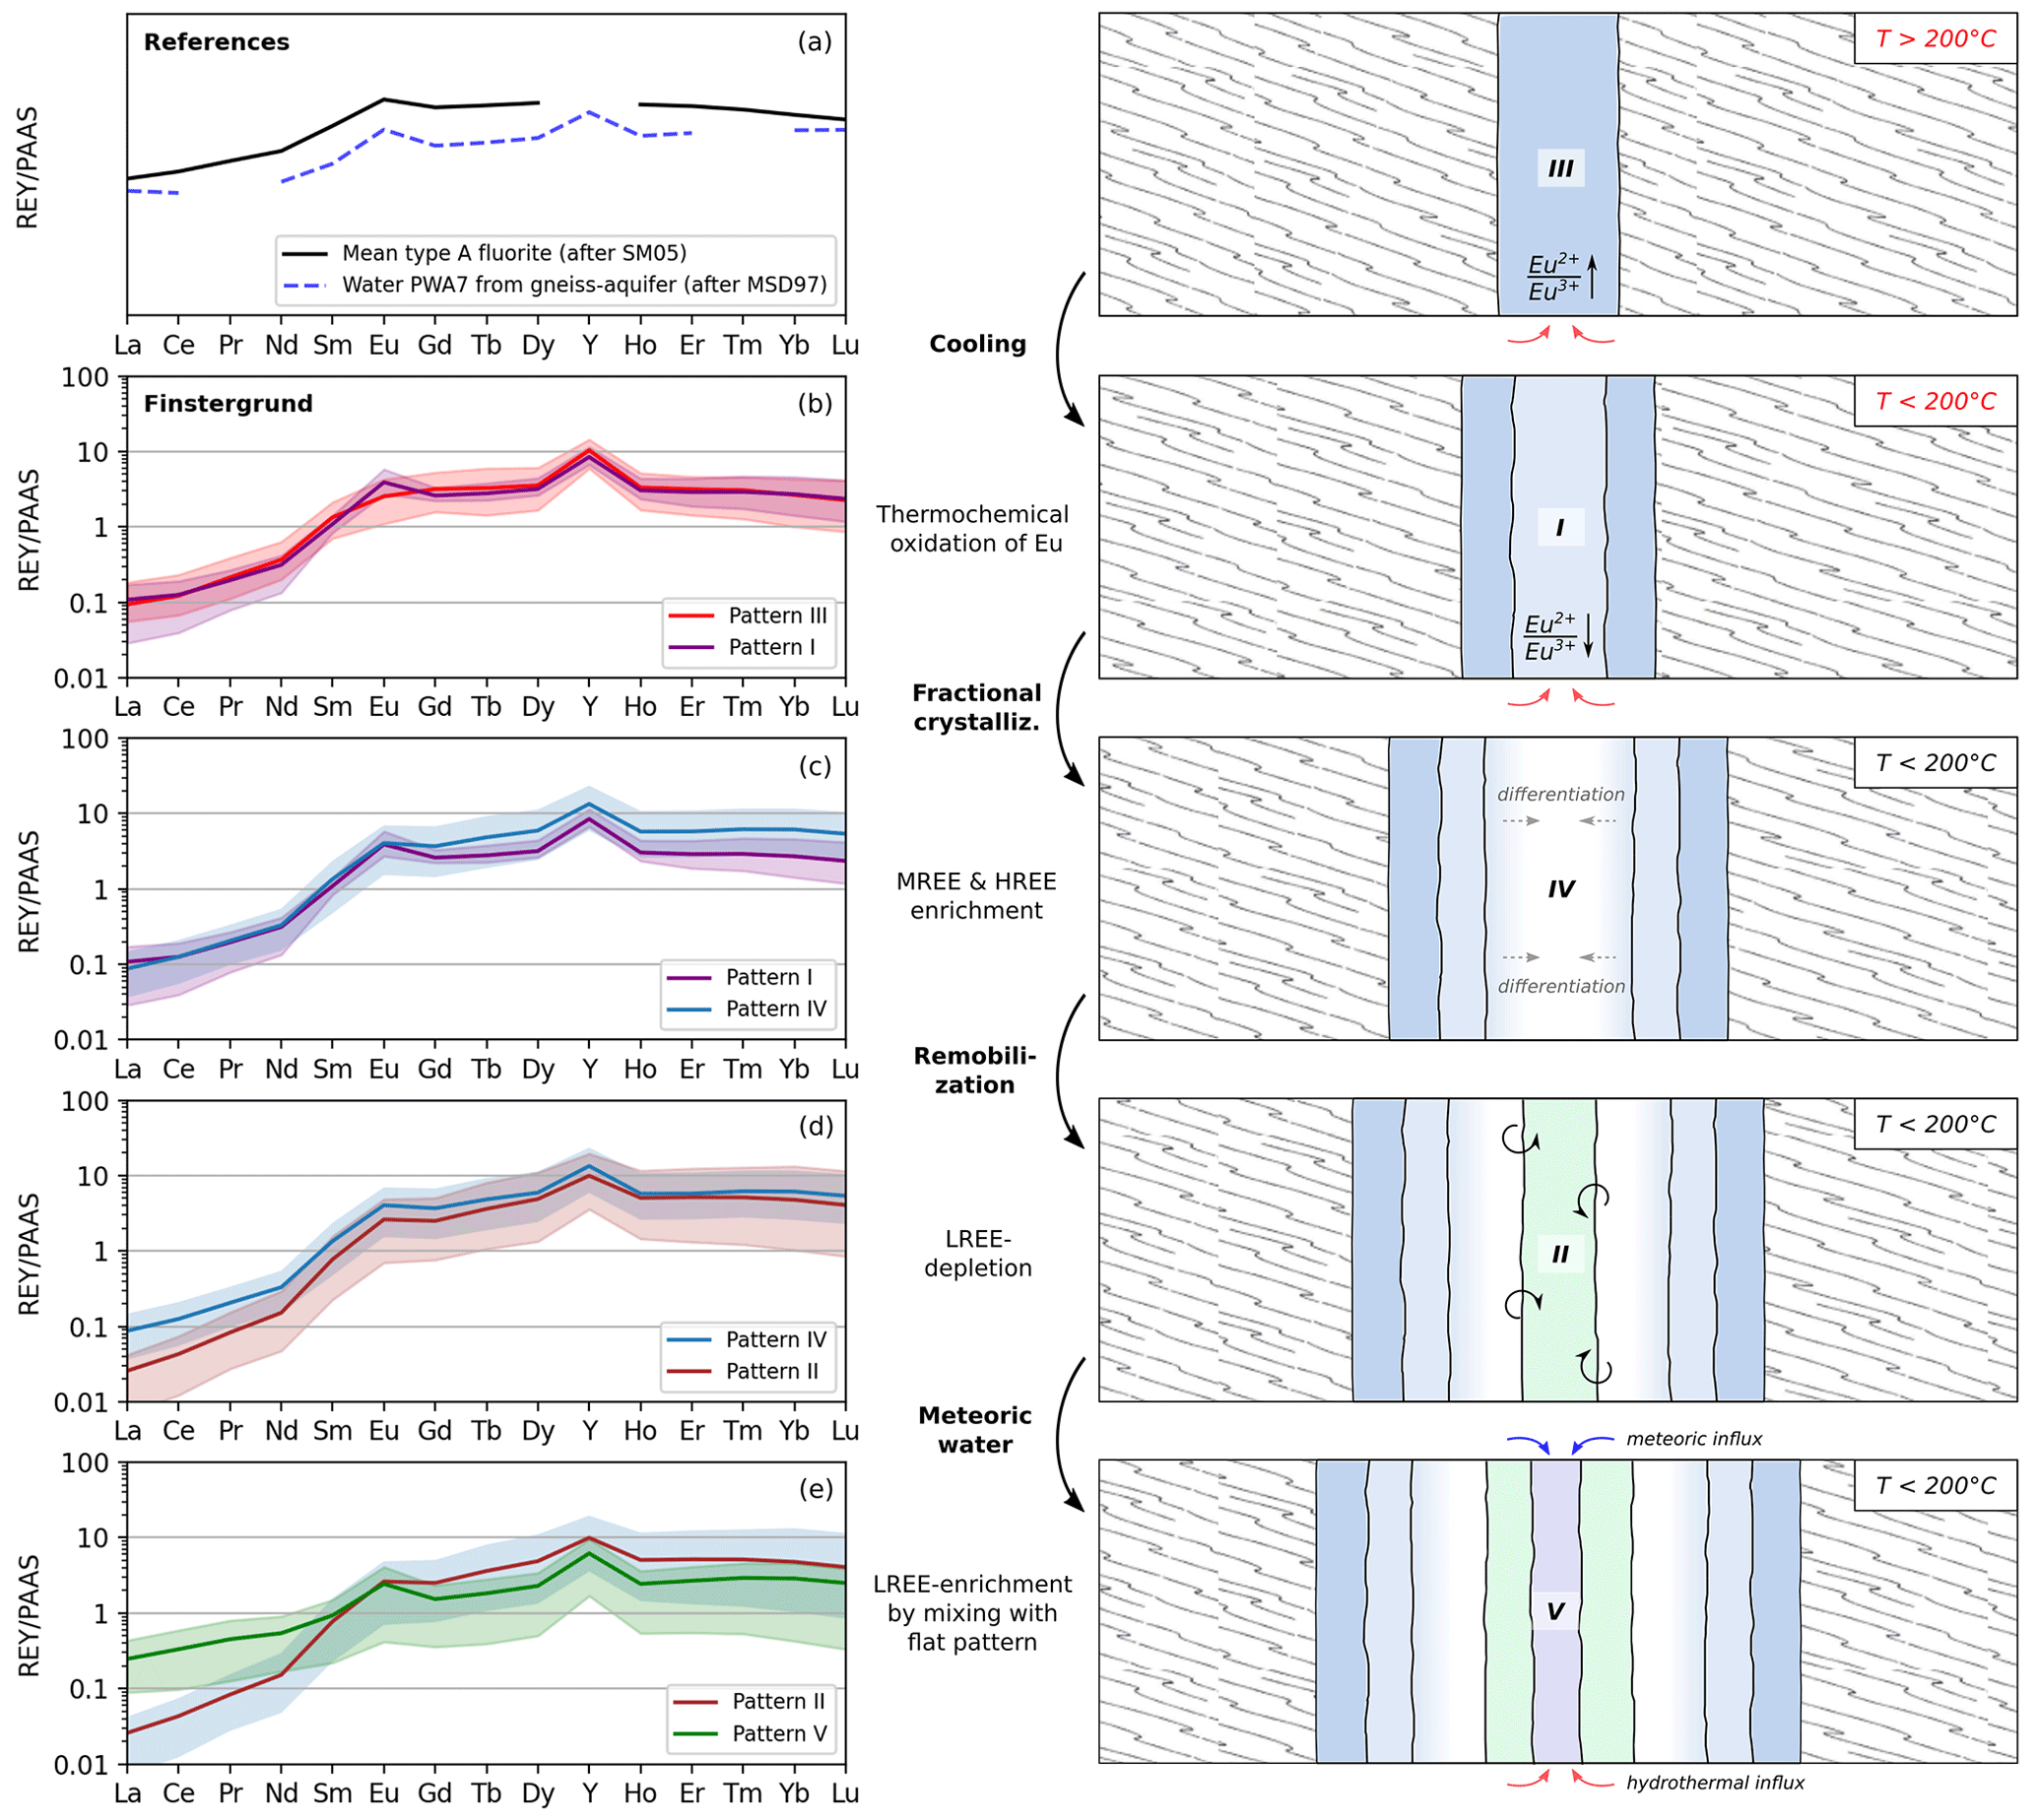
Figure 11Physico-chemical evolution of the Finstergrund deposit. On the left: direct comparison between chronologically successive REY patterns in addition to reference patterns with respect to the fluid's source aquifer lithology (SM05: Schwinn and Markl 2005; MSD97: Möller et al., 1997). On the right: graphical sketch of the corresponding fluorite mineralization sequence.
5.1.2 Fluid generations related to the Finstergrund vein mineralization
Based on the physical-chemical interpretation of the fluorite patterns, three different fluid generations or fluid mobilization events are concluded for the Finstergrund deposit. The first generation comprises groups III, I and IV describing a continuous evolution of the fluid during cooling from above to below 200 ∘C and fractional crystallization. Initially, blue-coloured fluorite is formed and accompanied by the co-precipitation of or the replacement by quartz upon decreasing temperatures (Fig. 6). This generation matches the first main mineralization episode of so-called “fluorite I” and “barite I” after Werner et al. (2020) that is attributed to 186–129 Ma up to 200 ∘C. The replacement by quartz and the precipitation of dispersed sulfides is equally observed in the sequence from Finstergrund (Fig. 6). A discrepancy exists, however, with respect to the colour of fluorite I which is mostly whitish-greyish according to Werner et al. (2020) instead of blue. Equally high temperatures of initial fluorite-forming hydrothermal solutions were also suggested for fluorites from the Badenweiler–Quarzriff and the Teufelsgrund mine near Untermünstertal (Lüders, 1994). The second fluid generation is represented by group II, optically indicated by a change in colour and related to remobilization. The reprecipitation of green fluorite (Fig. 6) is in disagreement with the second main mineralization episode after Werner et al. (2020), who propose next the formation of blue-coloured “fluorite II” between 80–60 Ma. Blue-coloured group II fluorites are, however, observed in multiple samples independently from the sequence in Fig. 6 (e.g. FI20-05-01d, FI20-05-01f, FI20-06-01, FI20-10-01) and often characterized by euhedral crystals, consistent with observations of Werner et al. (2020) (Fig. 10). A relationship between the colouration and REE impurities in fluorites seems to exist by the formation of complex centres (Bill and Calas, 1978) but is not directly linked to absolute REE contents (Naldrett et al., 1987; Nadoll et al., 2018). It is complicated by the presence of H2O, O2 and O, as well as colloids, crystal growth rates and thermal bleaching (Calas, 1972; Bill and Calas, 1978; Naldrett et al., 1987). Besides the colouration, Werner et al. (2020) and this study agree that the second fluorite generation is followed by the precipitation of barite (Fig. 6). Thus, group II can roughly be constrained to 129–60 Ma. The third fluid generation given by group V is characterized by dark-blue- to purple-coloured fluorite and mixing with meteoric water. Werner et al. (2020) link the third main mineralization episode to the tectonic evolution of the URG and suggest the precipitation of quartz, fluorite and calcite between 22–0.5 Ma at 50–70 ∘C. An agreement between both studies with respect to the third generation can hardly be drawn based on the rare occurrence of group V. In general, the same number of fluid mobilization events and fluorite generations is concluded by both studies.
5.1.3 Fluid source aquifer related to the Finstergrund deposit
The fluid source aquifer rock, fluid migration pathways and mineral precipitation influence the REY pattern in fluorites. Specific features such as the Eu anomaly and HREE characteristics are, however, inherited from the source aquifer rock and preserved in the fluid, as well as in fluorite precipitates. This relationship has been shown for gneiss and granite aquifers in the Black Forest by comparison of the REE patterns of hydrothermal fluorites with those from drill-core-derived fluids, their corresponding aquifer rocks and experimental leachates (Möller et al., 1997; Schwinn and Markl, 2005). Even where fluorite veins are hosted by sedimentary lithologies, the typical granite or gneiss source-rock-related features are preserved. Elemental fractionation between fluorite and the fluid does not overprint source-rock-related features during fluorite precipitation either, as shown by similar patterns between natural waters, leachates and hydrothermal fluorites (Schwinn and Markl, 2005). Despite generally modified REY signatures between aquifer fluids and their source rocks, the Eu anomaly and HREE characteristics in fluorites remain conserved features, thus indicative for gneiss or granite source aquifer rocks.
The various fluorite REY patterns retrieved for the Finstergrund deposit overall match the type A fluorite after Schwinn and Markl (2005) regarding the roof-shaped pattern, the positive Eu anomaly and maximum slight depletion of HREEs (Fig. 11a). Its pattern is representative of fluorite vein mineralization of the Black Forest whose hydrothermal fluid is derived from gneissic source aquifers. The REY pattern is consistent with those derived from gneiss leachates, as well as those inherited in natural waters from known gneiss aquifers. The positive Eu anomaly is commonly used to distinguish gneissic source aquifers from others, e.g. granitic aquifers (Möller et al., 1997), and most likely originates from altered biotite (Göb et al., 2013). The gneissic basement rock that hosts the Finstergrund deposit is, however, not believed to be the source rock of the hydrothermal fluid and its REY characteristics. Similar mineralization styles found in the entire Black Forest (Schwinn and Markl, 2005) and positive Y anomalies are indicative of long migration distances of F-rich hydrothermal solutions and crustal fluid circulation on a larger scale (Bau and Dulski, 1995).
5.2 Genetic implications for the Tannenboden deposit
Despite the spatial proximity of about 1.5 km between the Finstergrund and Tannenboden deposits, the fluorite REY pattern collected at both sites gives evidence for two independent formation histories.
5.2.1 Geochemical evolution, fluorite mineralization stages and generations at the Tannenboden deposit
The Tannenboden patterns of groups VII and VI are identical within the total range of individual samples except for a missing positive Eu anomaly for group VII and the presence of one in group VI (Fig. 12). The same characteristics of fluorite REE pattern for the Tannenboden vein were published by Bau and Dulski (1995) who reported a pattern consistent with group VII, while Walter et al. (2018b) include a group VI pattern in their supplementary data. Contrary to the Finstergrund vein, the local variability in REE signatures and thus the evolution of fluorite formation at the Tannenboden deposit is covered by two steps only. Analogous to the argument of thermochemical oxidation of Eu2+ to Eu3+ outlined for the Finstergrund deposit after Sverjensky (1984), Bilal (1991), Möller et al. (1998), Möller (2000), and Schwinn and Markl (2005), group VII fluorites precipitated at temperatures above 200 ∘C, whereas group VI fluorites formed below 200 ∘C. The following formation order is consequently implied: VII → VI. A single fluid mobilization event for the entire Tannenboden deposit is concluded, since the identified fluorite groups are genetically directly linked by cooling. This is supported by the La Ho vs. Y Ho diagram where group VII and VI fluorites are undistinguishable. Scharrer et al. (2021) recently published microthermometry data on the main ore stage of three unconformity-related vein systems in the Black Forest including the Tannenboden and Anton deposits from the Wieden district. Pressure-corrected vein formation temperatures of 100–170 ∘C (on average 140 ∘C), fluid reservoir temperatures from Na–K–Ca thermometers of approx. 250 ∘C and a total salinity of 22.2 wt %–25.7 wt % NaCl + CaCl2 are reported for both Tannenboden and Anton. Linear fluid mixing trends between a CaCl2- and an NaCl-rich fluid endmember are observed for all investigated locations. Binary fluid mixing aided by significant cooling during ascent is concluded as the most likely formation mechanism of quartz–barite–fluorite veins (Scharrer et al., 2021). The single Tannenboden fluorite sample from Walter et al. (2018b) whose REE pattern is representative of group VI was dated to 75±38 Ma using Sm Nd geochronology. In addition, primary fluid inclusions display a salinity of 25.5 wt %–25.8 wt % NaCl + CaCl2 and a homogenization temperature of 115–135 ∘C. The high uncertainty of the Sm Nd age does not allow us to assign group VI fluorites unambiguously to either the Jurassic–Cretaceous or post-Cretaceous period of hydrothermal activity in the Black Forest as salinity and formation temperature constraints fit both periods (Walter et al., 2016). The relative formation temperatures indicated by the absence and presence of the positive Eu anomaly in group VII and VI from REY patterns in this study, respectively, are in agreement with the fluid inclusion data. Thus, group VI corresponds to the main ore stage formed after significant cooling < 200 ∘C. The rarely observed fluorites of group VII (three samples in total), however, indicate that small volumes of a fluid saturated with respect to fluorite must have resided at the palaeodepth of the Tannenboden deposit already at a time when temperatures exceeded 200 ∘C. It should be further noted that the La Ho vs. Y Ho plot captures fluid mixing only if the element ratios are significantly modified in comparison with other fluorite precipitation events.
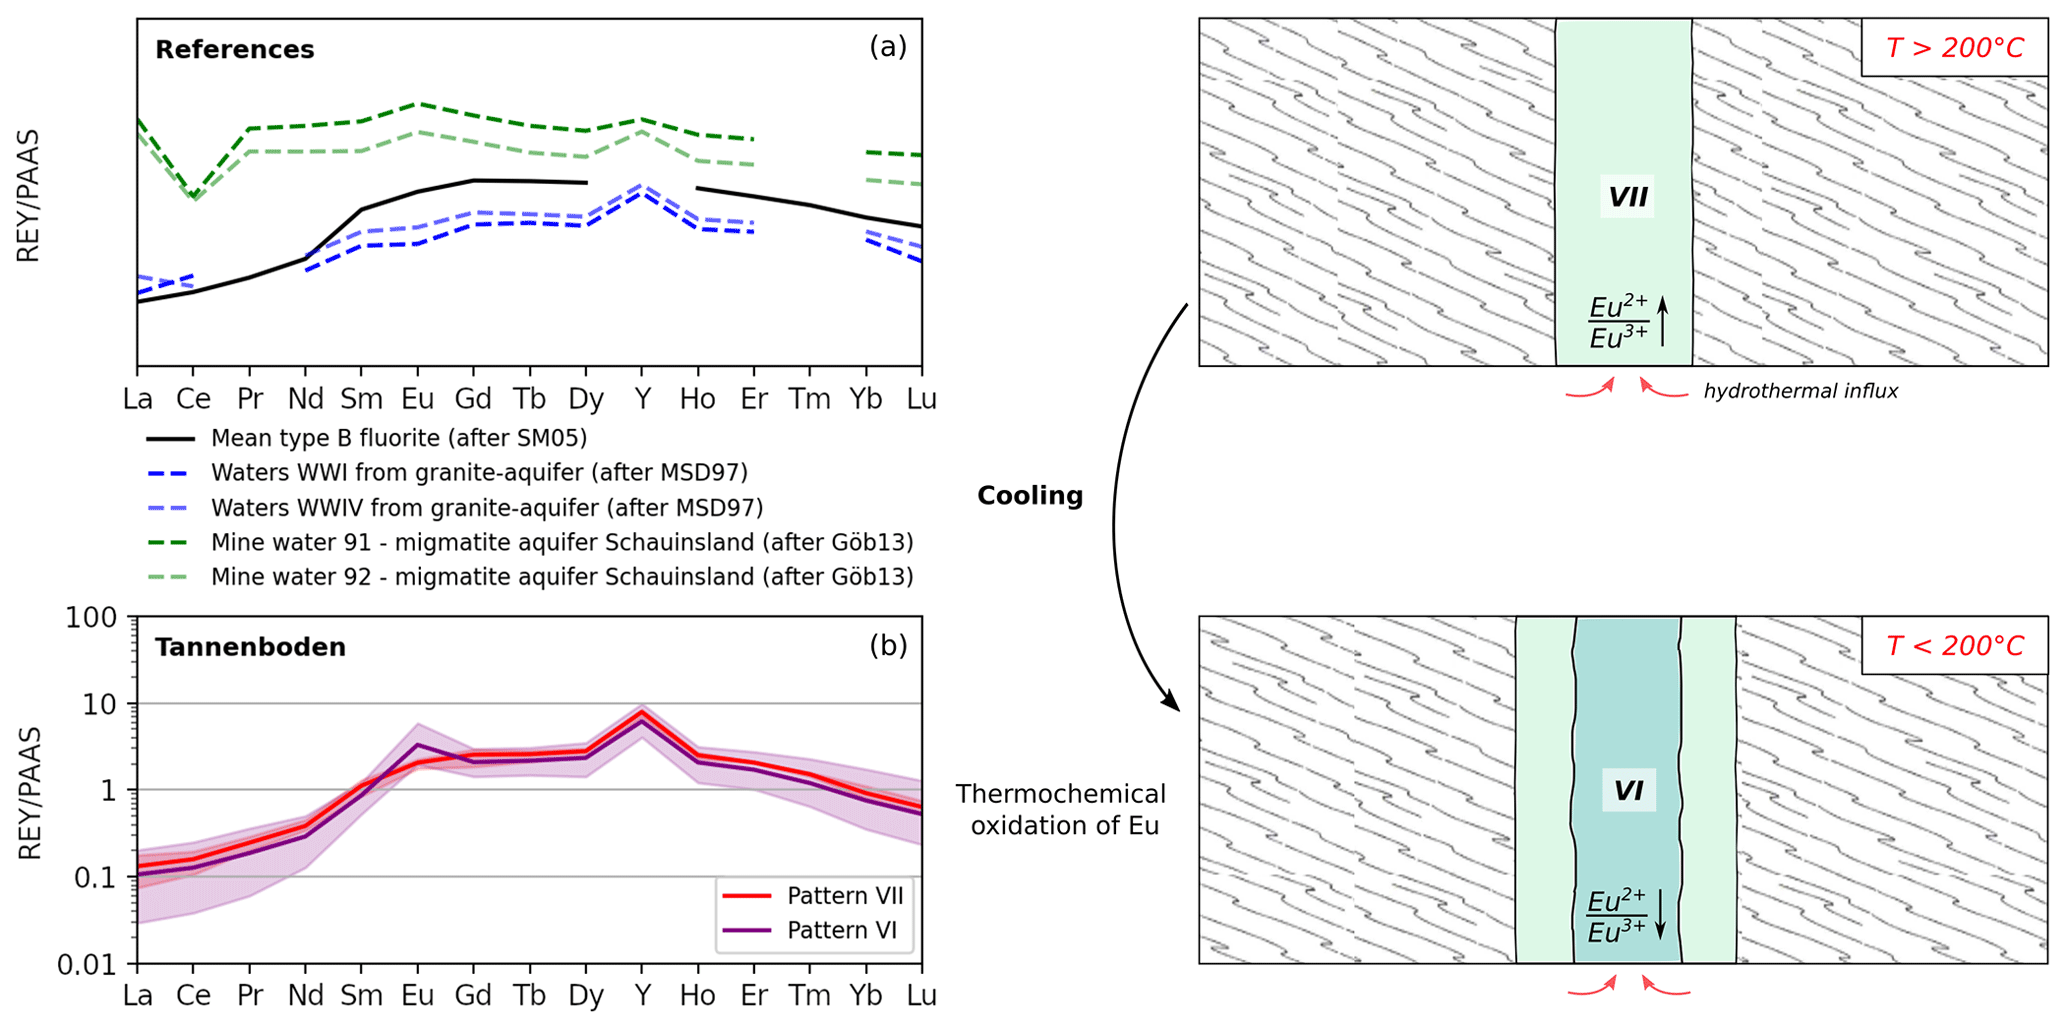
Figure 12Physico-chemical evolution of the Tannenboden deposit. On the left: direct comparison between chronologically successive REY patterns in addition to reference patterns with respect to the fluid's source aquifer lithology (SM05: Schwinn and Markl, 2005; MSD97: Möller et al., 1997; Göb13: Göb et al., 2013). On the right: graphical sketch of the corresponding fluorite mineralization sequence.
5.2.2 Fluid source aquifer related to the Tannenboden deposit
At first sight, the fluorite REY pattern of the Tannenboden deposit resembles the granite-related type B fluorite after Schwinn and Markl (2005) regarding the roof-shaped pattern, the strong depletion in HREEs and the missing Eu anomaly in group VII (Fig. 12a). However, the positive Eu anomaly featured by group VI is in contradiction with the REY patterns of waters known to be derived from granitic aquifers (Möller et al., 1997). Especially felsic rocks tend to form even negative Eu anomalies due to the partitioning of Eu into feldspars at igneous conditions and segregation in the magma chamber related to fractional crystallization (Möller et al., 1998; Philpotts and Ague, 2009). Assuming the thermochemical relationship with respect to the redox behaviour of Eu between groups VII and VI is correct, a granite-derived hydrothermal fluid that did not inherit a positive Eu anomaly from its aquifer rock at elevated temperatures can equally not form one at lower temperatures. For this reason, either a granite-related source fluid with untypical REY pattern yielding a positive Eu anomaly and depleted HREEs or an alternative source aquifer lithology not regarded in the provenance classification for post-Variscan hydrothermal fluorite veins by Schwinn and Markl (2005), i.e. type A (gneiss-related) vs. type B (granite-related), is required.
Published geochemical data on the REE signature of granites from the central and southern Black Forest are surprisingly scarce. The most comprehensive compilation is given by Emmermann et al. (1975) but coverage of the REE spectrum remains incomplete. The lithologically complex “Randgranit” of the northward-dipping BLZ is likely to interfere with the hydrothermal root zone of the Wieden mining district. The REE pattern of the porphyroclastic metagranites as part of the Variscan Rand Granite association (Altherr et al., 2019) shows slightly positive Eu anomalies if normalized to PAAS. However, as the REE patterns of natural waters compared to their aquifer rocks commonly differ except for some source-related features (Möller et al., 1997; Schwinn and Markl, 2005), the compilation of trace element compositions of mineral, thermal and mine waters from southwest Germany (Göb et al., 2013) is the most promising account. None of the granite-related waters from the central and southern Black Forest show a positive Eu anomaly and depleted HREEs if normalized to PAAS. The best match is obtained from mine waters in migmatite from the Schauinsland mine near Freiburg (Fig. 12a) which are characterized by a positive Eu anomaly and a negative trend for the HREEs. The missing roof-shaped pattern linked to a strong enrichment in LREEs may be related to the recent influence of shallow meteoric waters (Göb et al., 2013). Likewise, the displayed negative Ce anomaly is typical of oxidized surface waters at low-temperature conditions because Ce4+ is immobile relative to Ce3+ and preferentially depleted by adsorption (Möller et al., 1998; Möller, 2000; Göb et al., 2013). For deep crustal-derived fluids without meteoric influence, a roof-shaped pattern should be attained. Moreover, migmatites situated in closer proximity to the Wieden mining district exist within the southern Black Forest gneiss complex (Fig. 1).
An alternative explanation with respect to the mismatch of the Tannenboden REY pattern with granite-related type B fluorites independent from the source aquifer cannot be excluded. The fractionation of LREEs and HREEs during fluid migration is subject to competing complexation and sorption processes. Effective metal complexation relies on fluid salinity, temperature, pH, f(O2) and the availability of complexing ligands, whereas sorption is controlled by charge density. The REE charge density increases from LREEs to HREEs due to decreasing ionic size leading to elevated adsorption affinity of HREEs (Bau and Möller, 1992; Bau, 1991). A low-salinity, ligand-depleted fluid at low pH should be subject to intensified HREE sorption and depletion (Schwinn and Markl, 2005). A low-salinity hydrothermal fluid derived from a granitic aquifer may thus hypothetically produce a positive Eu anomaly below 200 ∘C and an HREE-depleted pattern during fluid migration. However, in that case, the MREEs would be expected to show a negative trend in alignment with the HREEs which is not observed for the fluorite groups VII and VI from the Tannenboden deposit.
5.3 Updated genetic model of the Wieden mining district and implications for a tectonic control of multistage fluorite mineralization
The sequence of fluorite mineralization and the genetic evolution of the Finstergrund and Tannenboden deposits suggested on the basis of the identified REY patterns in this study matches the previous mineralization episodes described by Werner et al. (2020) in parts well but differs in some characteristics of the precipitated assemblages and fluorite colours. Both studies conclude a total of three post-Variscan fluid mobilization events in the lithosphere related to hydrothermal fluorite vein formation. However, no investigation has previously been undertaken to study the genetic evolution of the Finstergrund and Tannenboden deposits independently. An overall genetic model for the entire Wieden mining district is commonly assumed. Likewise, other studies such as Lüders (1994) conclude the same fluid reservoir for fluorite-forming hydrothermal solutions of different deposits on the basis of a few samples. The present study provides evidence for independent formation histories and separate source aquifers of the Finstergrund and Tannenboden deposits despite their spatial proximity. The well-known mineralogical differences between both deposits, i.e. the significant enrichment in barite, as well as sphalerite, of the Tannenboden vein compared to Finstergrund (Werner et al., 2020), equally indicate different hydrothermal origins. Complete coverage of all precipitation events cannot be ensured, but the major ones are likely to be covered as sampling targeted locations of fluorite precipitation sequences.
As fluid mobilization in the lithosphere is triggered by renewed tectonic activity (Sibson et al., 1975), the differing number of fluorite generations in the Finstergrund and Tannenboden deposits are likely related to differences in the history of tectonic reactivation of their main faults. Fluid mobilization at the Tannenboden deposit is accompanied by brecciation of the paragneiss as a result of hydraulic fracturing of the country rock and points to initial dextral strike-slip tectonics. An equally clear indication is not known for the Finstergrund deposit (Metz et al., 1957) but may be hidden in the inaccessible parts of the mine. Fluorite mineralization in the latter is linked to subsequent extensional tectonics and the east–west oriented widening of the linear, fault-related pore space in successive steps (Werner et al., 2020). Crustal-scale fracturing of the basement, however, is required in order to tap deep-seated fluid reservoirs. Initial strike-slip tectonics thus appear likely for both deposits to have mobilized fluids in the first event. Independent radiometric dating of the oldest fluorite generation points to a more or less simultaneous onset of vein formation in the Late Jurassic–Early Cretaceous at both deposits. For the Tannenboden deposit, K Ar dating of illite provided an average age of 151 Ma (Werner and Franzke, 2001), while an age range of 129–186 Ma (157 Ma on average) was determined by Werner et al. (2020) for the Finstergrund deposit. The Sm Nd age of 75±38 Ma for group VI fluorite from Walter et al. (2018b) for the Tannenboden vein thus represents a younger vein formation stage. For these reasons, a simultaneous onset of initial fluid mobilization and first-generation fluorite precipitation is suggested for both deposits. The different subsequent vein evolution indicated by the identified REY fluorite groups between both deposits most likely results from different mechanical responses of the gneiss host rock. This may be texturally controlled as a lateral opening of the vein is most effective where the fault and gneiss foliation meet perpendicular, as is the case with respect to the Finstergrund deposit (Werner and Franzke, 1994). Another factor in terms of unequal stress accommodation between both veins may have been the existence of clay-rich cataclastic zones that are particularly abundant and thick in the Finstergrund deposit with up to 20 m each (Werner and Markl, 2020). The following summary attempts to propose a new genetic model for the Wieden mining district.
Post-Variscan strike-slip tectonics cause deep-reaching, linear crustal faults of the order of 5–10 km depth triggering the onset of fluorite vein formation. Metamorphic fluids or deep penetrated modified brines at temperatures of at least 250 ∘C stored in the pore space are thought to be consequently mobilized along decreasing pressure gradients. Mineralization is triggered either by supersaturation with respect to fluorite due to decreasing solubilities in the course of temperature and pressure decline or most likely by mixing between fluids tapped from different reservoirs in the basement aided by cooling. Initial mineralization at the Tannenboden and Finstergrund deposits occurs above 200 ∘C and most likely continued simultaneously towards temperatures as low as 100 ∘C in the Late Jurassic–Early Cretaceous (Scharrer et al., 2021). Hydrothermal activity at the Tannenboden deposit stops at this point and is proceeded solely at the Finstergrund deposit. In the latter, extensional tectonics open up the void space during at least two additional episodes around the Late Cretaceous–Early Paleogene and in the Neogene (Walter et al., 2018b; Werner et al., 2020) allowing for renewed flushing and the stepwise formation of a multi-generational fluorite vein. Regarding the Wieden mining district as a whole, this interpretation implies a change in the fluid percolation network of the Wieden vein system over time as the Tannenboden deposit apparently becomes disconnected from further fluid influx. Two distinct fluorite vein formation histories result for the Tannenboden and Finstergrund deposits.
On the basis of REY patterns only, the initial fluorite generations (groups VII and VI for the Tannenboden deposit as well as groups III and I for the Finstergrund deposit) cannot unambiguously be attributed to the same fluid mobilization event and reservoirs. To resolve these questions, isotope data (e.g. Sr, Nd) on fluorites from both deposits may yield fingerprints of shared or distinct source reservoirs of the primary ore-forming fluid. Published studies containing isotope characteristics from the Wieden district comprise three analyses from the Tannenboden deposit on galena, sphalerite and pyrite (van Gehlen et al., 1962), as well as one sample from the Anton vein on calcite (Schwinn et al., 2006) only. Equally, the chronological order established from the fluorite REY groups is interpretative. Direct radiometric ages (e.g. Sm Nd) of fluorites from the individual groups are required but currently not available except for a single data point for group VI fluorites from the Tannenboden vein (Walter et al., 2018b). Other existing ages are either indirect estimates on illite (Werner and Franzke, 2001; Werner et al., 2020) or originating from other fluorite veins (Walter et al., 2018b; Scharrer et al., 2021). The same problem persists with respect to published microthermometrical fluid inclusion data. Except for the single sample from the Tannenboden vein studied by Walter et al. (2018b), the remaining data record of fluorite-derived fluid inclusions relates to either other hydrothermal veins (Burisch et al., 2016; Walter et al., 2016, 2017, 2018a, b, 2019; Scharrer et al., 2021) or generalized data for the entire Wieden district without distinguishing between the individual fluorite veins (Scharrer et al., 2021). In addition, fluorite data from external sources would have to be published in combination with their REY pattern to be matched coherently with the presented fluorite REY groups of this study.
Complementary imaging techniques such as cathodoluminescence need to be applied in the future in order to exclude erroneous fluorite mineralization stages from misled interpretations of sector-zoned crystals where preferential partitioning of the REEs has been shown to lead to heterogeneous REE distribution (Bosze and Rakovan, 2002; Baele et al., 2012). Based on the sampling approach guided by field-scale observations and a focus on fluorite precipitation sequences, the consistency between precipitation sequences and the chronology of interpreted fluorite REY patterns (Fig. 6), the large number of samples per most fluorite groups (Fig. 4), the overall agreement with Werner et al. (2020) in terms of fluorite-precipitating fluid generations, and the optical microscopic inspection of each sample, the impact of sector zonation in fluorite on this study is expected to be limited. After demonstrating the local variability in fluorite REY geochemistry at the Tannenboden and in particular the Finstergrund vein with three apparent fluorite generations indicative of a multi-stage formation process, radiometric ages, isotope characteristics and fluid inclusion microthermometry of each identified fluorite REY group need to be acquired. These data are needed to provide evidence for separated fluid source reservoirs of the Tannenboden and Finstergrund deposits and to verify the chronology of genetic stages established on the basis of interpreted fluorite REY patterns. Furthermore, such data are required to set the detailed insights gained about multi-stage fluorite formation at the local scale into relation with the large-scale basement brine evolution of the Black Forest district (Walter et al., 2016, 2017, 2018a, b, 2019; Scharrer et al., 2021). The spatial proximity of approx. 1.5 km and yet clearly distinguished REY patterns between the Tannenboden and Finstergrund deposits additionally raise the question of how frequently changes in lithospheric fluid percolation networks occur and if even coexisting percolation networks without significant mixing are possible to develop on this spatial scale. More local studies are required that examine the hydrothermal vein formation history of individual deposits in detail to improve the understanding of spatial diversity in lithospheric fluid–rock interaction processes.
The Black Forest hosts a wide range of hydrothermal mineralization (Werner and Dennert, 2004; Markl, 2017). Previous studies presented extensive geochemical screening of REE trace element systematics in hydrothermal fluorite (Schwinn and Markl, 2005), as well as mineral, thermal, mine and surface waters (Göb et al., 2013) on a larger scale of the entire Black Forest. They linked REE patterns of hydrothermal fluids and waters to source aquifer rocks (Möller et al., 1997; Schwinn and Markl, 2005). Contrary to previous research that fails to document the geochemical diversity locally found on the scale of individual hydrothermal veins, this study aims at investigating fluorite precipitation events in only two nearby deposits. For this purpose, the REY patterns of over 70 fluorite samples from the Finstergrund and Tannenboden deposits in the Wieden mining district (southern Black Forest) were collected. Classification of all individual patterns by manual grouping, geochemical discrimination and the application of λ coefficients (O'Neill, 2016) leads to the identification of seven fluorite groups representing three different fluid mobilization events in total. Independent formation histories for the Finstergrund and Tannenboden deposits are suggested as fluorite REY patterns from both deposits are unambiguously distinguished by their HREE depletion, in addition to the known differences in tectonic controls between both deposits. Establishing a relative sequence of formation among identified group patterns by geologic field relationships and crystal zoning provides a tool to unravel the physico-chemical processes between individual mineralization events from REY patterns. Five mineralization steps from three fluorite generations are identified for the Finstergrund deposit that are chronologically linked to first generation: precipitation above 200 ∘C (group III), below 200 ∘C (group I) and fractional crystallization (group IV); second generation: remobilization (group II); and third generation: meteoric water interaction (group V). The hydrothermal fluid from which the fluorites at the Finstergrund deposit have been precipitated is suggested to be derived from gneissic aquifer rocks (cf., Schwinn and Markl, 2005; Möller et al., 1997). Only two mineralization steps from the same fluid mobilization event or generation are identified for the Tannenboden deposit starting with fluorite precipitation above 200 ∘C (group VII) and subsequent cooling below 200 ∘C (group VI). The fluid's lithological source aquifer remains unclear. Important features include a positive Eu anomaly at temperatures below 200 ∘C and strong depletion of HREEs which contradict both a gneiss- or granite-related aquifer typically suggested for hydrothermal fluorites by Schwinn and Markl (2005). The best matching alternative source aquifer lithology found is given by migmatites (Göb et al., 2013). Finally, a new genetic model is suggested for the Wieden mining district that argues for the termination of hydrothermal activity at the Tannenboden deposit after the first fluid mobilization event.
This study serves as an example for the application of extensive, deposit-scale REE geochemistry to unravel locally differing, long-term, multistage fluorite vein mineralization histories. Spatial proximity between hydrothermal veins is insufficient as an argument for the same genetic origin. The geochemical evolution of multistage fluorite mineralization, as exemplified by the Tannenboden and Finstergrund deposits in combination with other fluorite mineralization in the Black Forest, provides unique insights into the lithospheric origin and precipitation behaviour of fluorite by various fluid–rock interaction processes occurring in large hydrothermal systems. The local diversity of REE patterns emphasizes, however, the need for detailed investigations of individual hydrothermal vein deposits.
Table A1PAAS-normalized (following McLennan, 1989) sample averages (G: fluorite group; n: number of analysis).
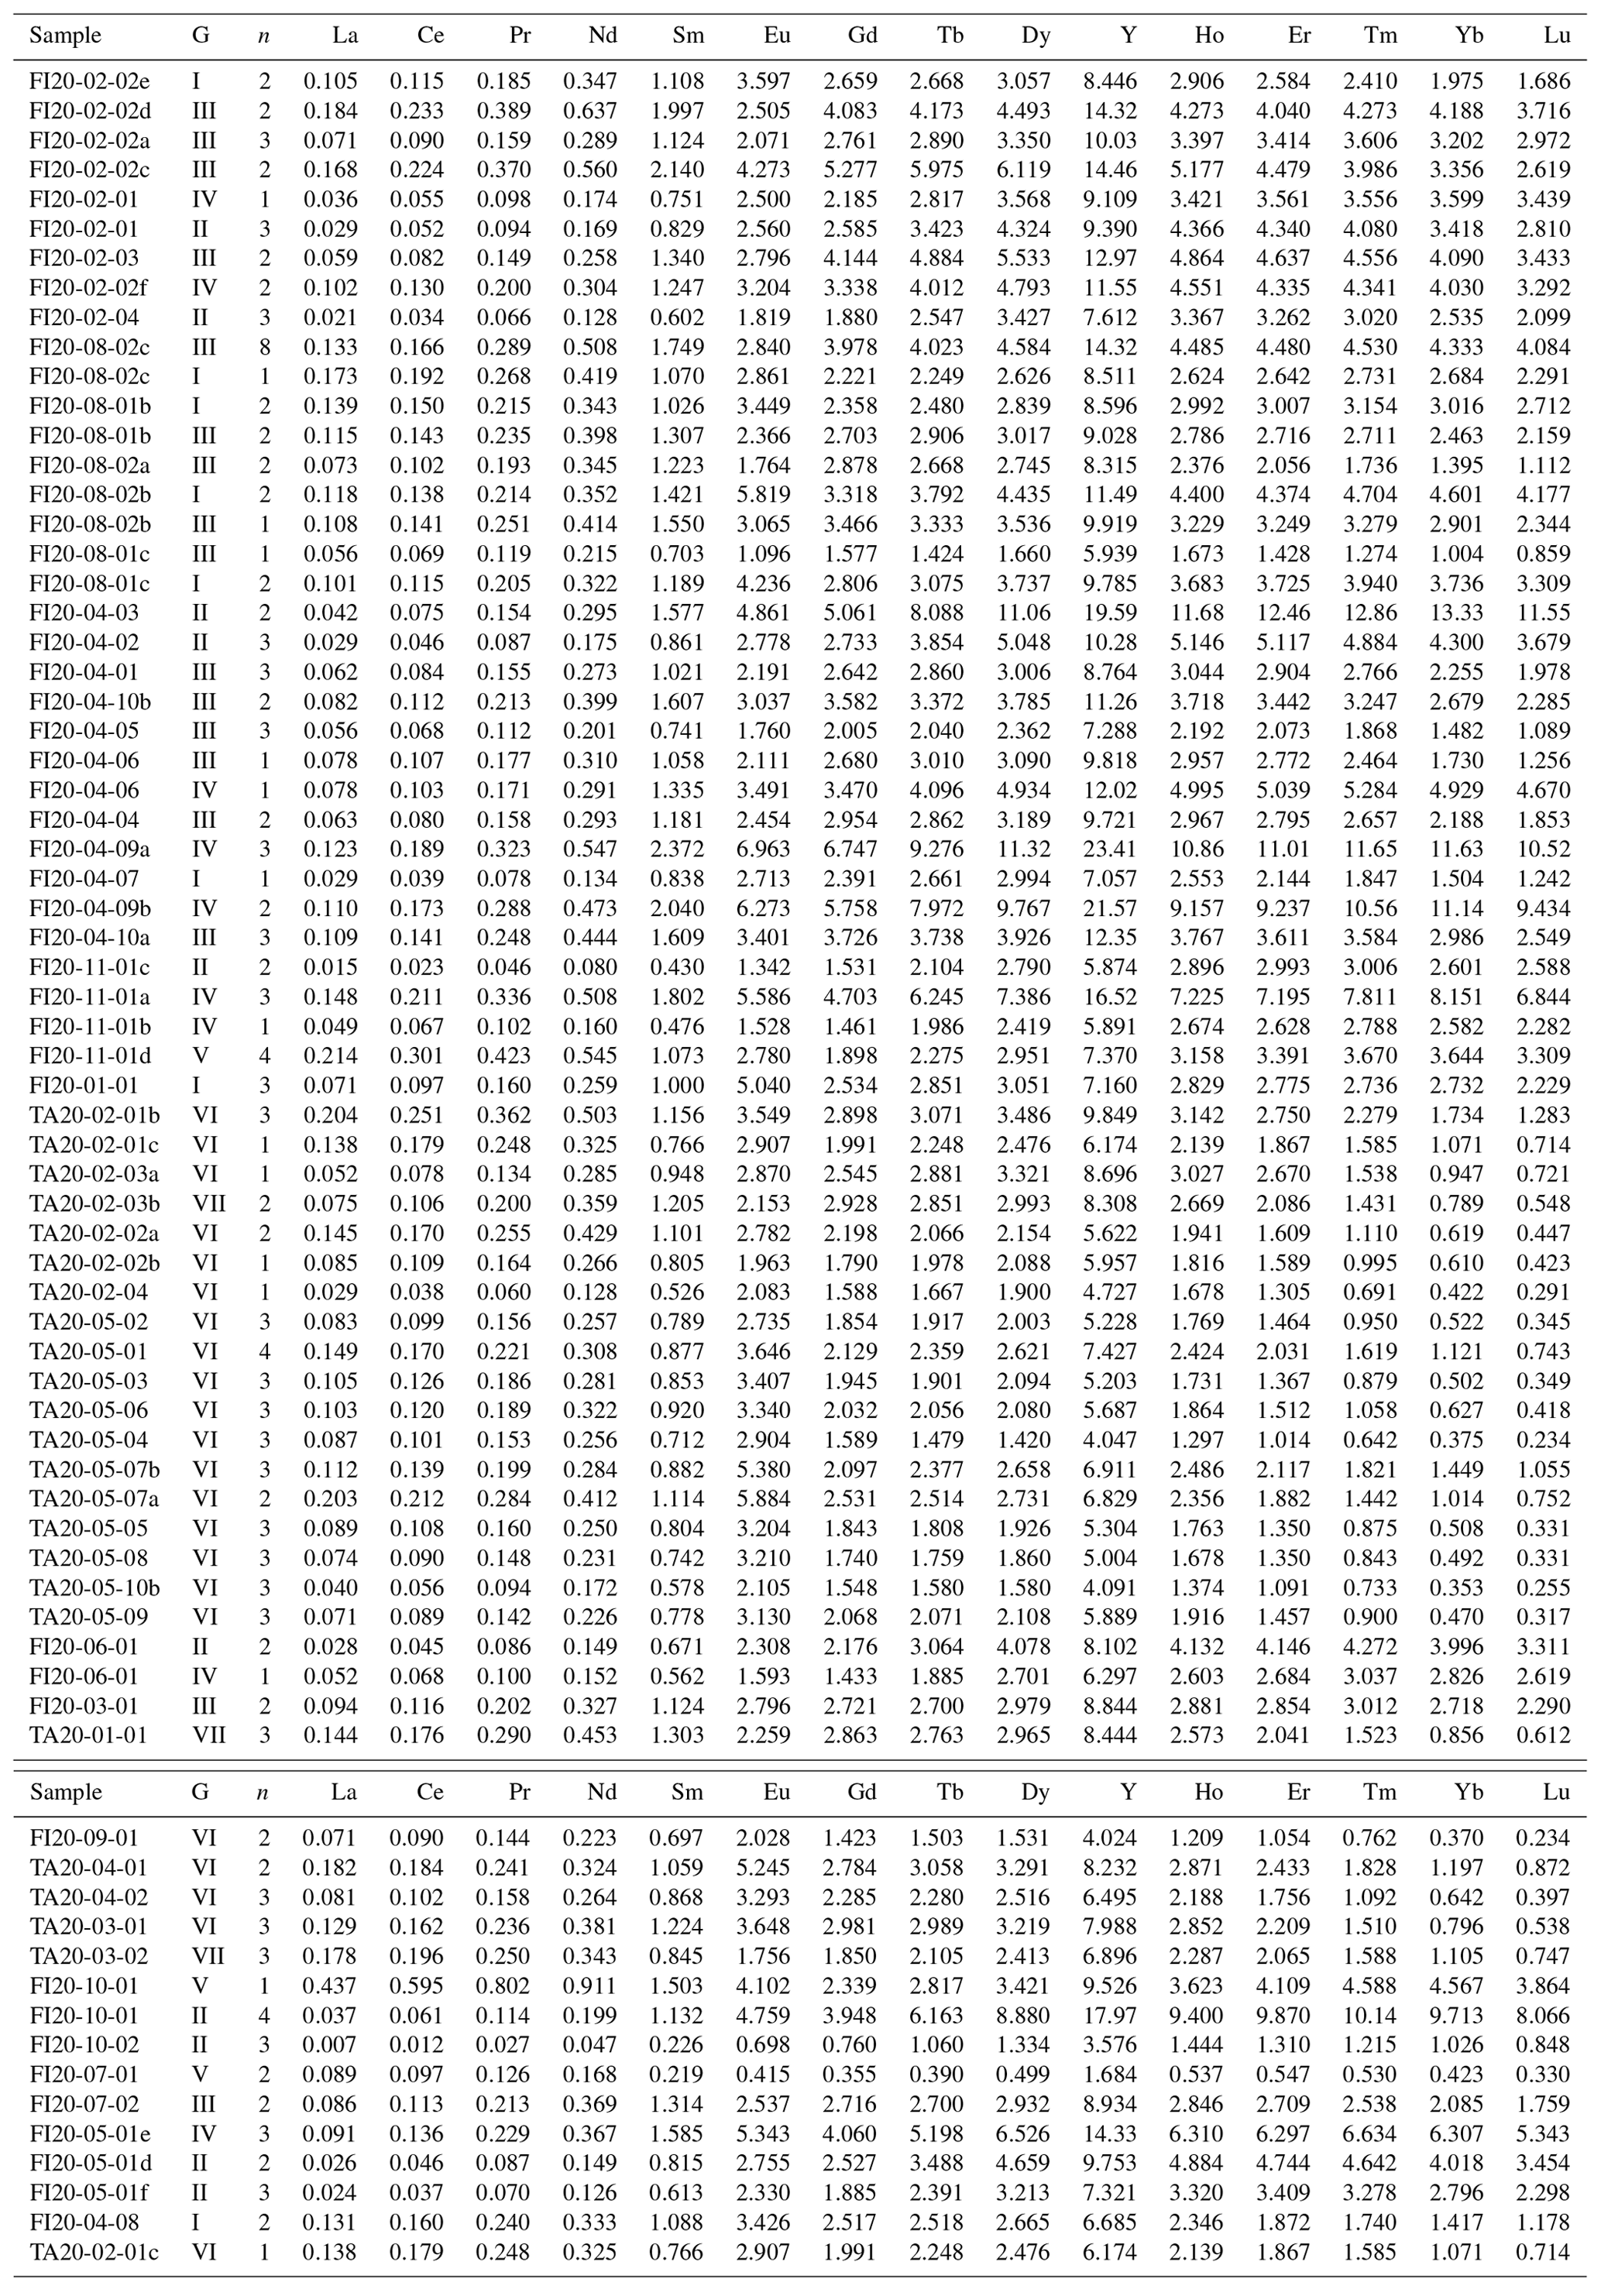
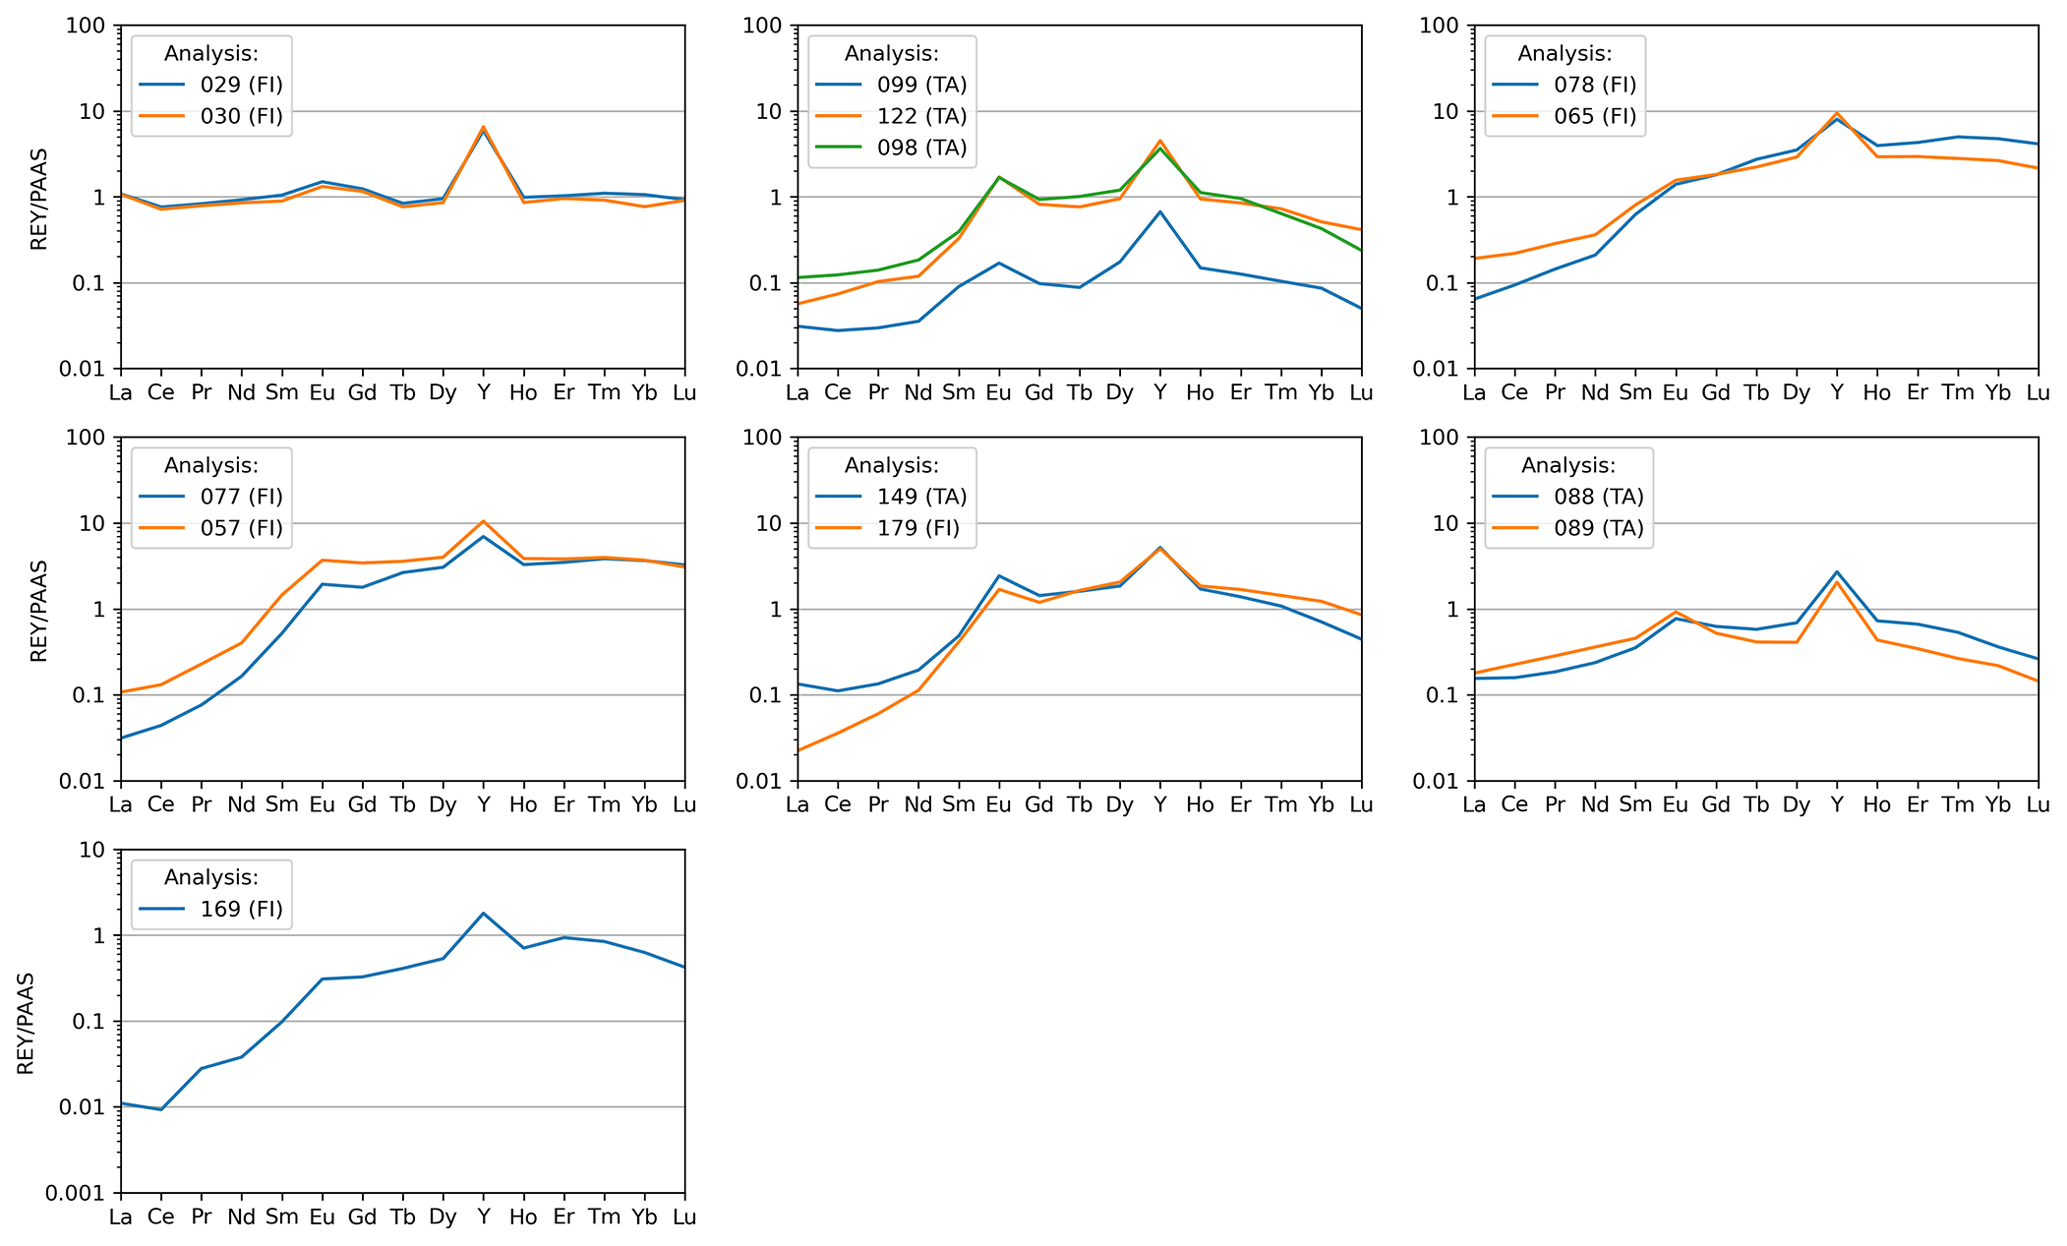
Figure B1Unmatched and rejected patterns from individual analyses with respect to the identified fluorite REY groups. FI: Finstergrund deposit; TA: Tannenboden deposit.
LA-ICP-MS raw data and processed REE data underlying this research are accessible via the Deep-time Digital Earth Data Publisher and Repository, DDE DPR (https://doi.org/10.12297/dpr.dde.202305.1, Hintzen, 2023).
RH, WW, MH and LAF participated in the sampling campaign. RH performed the sample treatment and preparation for analysis. LA-ICP-MS was externally carried out under the responsibility of RK. The formal data investigation and interpretation were performed by RH under the guidance of LAF. Data visualization and writing of the initial manuscript were done by RH. All co-authors contributed to the manuscript by critical review and commentary. LF supervised the overall research activity in collaboration with WW. The project was launched on the initiative of LAF, MH and WW.
The contact author has declared that none of the authors has any competing interests.
Publisher’s note: Copernicus Publications remains neutral with regard to jurisdictional claims in published maps and institutional affiliations.
Many thanks to the volunteers of the mining association “Bergmannsverein Finstergrund Wieden e.V.”, as well as the local authority, for access permission and safe guidance during the sample campaigns in the Finstergrund and Tannenboden deposits. We further thank the chair of the geochemistry section of the Institute of Earth and Environmental Sciences at the University of Freiburg, Wolfgang Siebel, for financial support and Helene Brätz from the Geozentrum Nordbayern at the Friedrich-Alexander University for performing the LA-ICP-MS analysis. The technical staff of the former institution, Melanie Schrage and Gordon Mette, are thanked for assistance in sample preparation. The reviews of three anonymous reviewers helped to improve the quality of this paper. We acknowledge support by the Open Access Publication Fund of the University of Freiburg in the realm of the National Opt-In Konsortium “Copernicus Publications”.
This open-access publication was funded by the University of Freiburg.
This paper was edited by Rucheng Wang and reviewed by three anonymous referees.
Altherr, R., Hanel, M., Schwarz, W. H., and Wimmenauer, W.: Petrology and U-Pb zircon age of the Variscan porphyroclastic Rand Granite at the southeastern margin of the Central Schwarzwald Gneiss Complex (Germany), Int. J. Earth Sci., 108, 1879–1895, https://doi.org/10.1007/s00531-019-01738-2, 2019.
Baele, J.-M., Monin, L., Navez, J., and André, L.: Systematic REE partitioning in cubo-dodecahedral fluorite from Belgium revealed by cathodoluminescence spectral imaging and laser ablation-ICP-MS, in: Proceedings of the 10th International Congress for Applied Mineralogy (ICAM), edited by: Broekmans, M. A. T. M., Springer Berlin, Heidelberg, 23–30, https://doi.org/10.1007/978-3-642-27682-8, 2012.
Bau, M.: Rare-earth element mobility during hydrothermal and metamorphic fluid-rock interaction and the significance of the oxidation state of europium, Chem. Geol., 93, 219–230, https://doi.org/10.1016/0009-2541(91)90115-8, 1991.
Bau, M. and Dulski, P.: Comparative study of yttrium and rare-earth element behaviours in fluorine-rich hydrothermal fluids, Contrib. Mineral. Petrol., 119, 213–223, https://doi.org/10.1007/BF00307282, 1995.
Bau, M. and Möller, P.: Rare earth element fractionation in metamorphogenic hydrothermal calcite, magnesite and siderite, Mineral. Petrol., 45, 231–246, https://doi.org/10.1007/BF01163114, 1992.
Bilal, B. A.: Thermodynamic study of Eu3+ Eu2+ redox reaction in aqueous solutions at elevated temperatures and pressures by means of cyclic voltammetry, J. Phys. Sci., 46a, 1108–1116, https://doi.org/10.1515/zna-1991-1216, 1991.
Bill, H. and Calas, G.: Colour centers, associated rare-earth ions and the origin of coloration in natural fluorites, Phys. Chem. Mineral., 3, 117–131, https://doi.org/10.1007/BF00308116, 1978.
Bosze, S. and Rakovan, J.: Surface-structure-controlled sectoral zoning oft he rare earth elements in fluorite from Long Lake, New York, and Bingham, New Mexico, USA, Geochim. Cosmochim. Ac., 66, 997–1009, https://doi.org/10.1016/S0016-7037(01)00822-5, 2002.
Bültemann, W.-D.: Die Uranlagerstätte “Krunkelbach” bei Menzenschwand, Hochschwarzwald und ihr geologisch-lagerstättenkundlicher Rahmen, Z. Deutsch. Geol. Ges., 130, 597–618, https://doi.org/10.1127/zdgg/130/1979/597, 1979.
Burisch, M., Marks, M., Nowak, M., and Markl, G.: The effect of temperature and cataclastic deformation on the composition of upper crustal fluids – An experimental approach, Chem. Geol., 433, 24–35, https://doi.org/10.1016/j.chemgeo.2016.03.031, 2016.
Burisch, M., Walter, B. F., Gerdes, A., Lanz, M., and Markl, G.: Late-stage anhydrite-gypsum-siderite-dolomite-calcite assemblages record the transition from a deep to a shallow hydrothermal system in the Schwarzwald mining district, SW Germany, Geochim. Cosmochim. Ac., 223, 259–278, https://doi.org/10.1016/j.gca.2017.12.002, 2018.
Calas, G.: Étude de la coloration bleue de quelques fluorites naturelles, Bull. Soc. Franc. Minéral. Crist., 95, 470–474, https://doi.org/10.3406/bulmi.1972.6711, 1972.
Chesley, J. T., Halliday, A. N., and Scrivener, R. C.: Samarium-neodymium direct dating of fluorite mineralization, Science, 252, 949–951, https://doi.org/10.1126/science.252.5008.949, 1991.
Debruyne, D., Hulsbosch, N., and Muchez, P.: Unraveling rare earth element signatures in hydrothermal carbonate minerals using a source–sink system, Ore Geol. Rev., 72, 232–252, https://doi.org/10.1016/j.oregeorev.2015.07.022,2016.
Emmermann, R., Daieva, L., and Schneider, J.: Petrologic Significance of Rare Earths Distribution in Granites, Contrib. Mineral. Petrol., 52, 267–283, https://doi.org/10.1007/BF00401457, 1975.
Etheridge, M. A., Wall, V. J., Cox, S. F., and Vernon, R. H.: High fluid pressures during regional metamorphism and deformation: Implications for mass transport and deformation mechanisms, J. Geophys. Res.-Sol. Ea., 89, 4344–4358, https://doi.org/10.1029/JB089iB06p04344, 1984.
Franzke, H. J. and Lüders, V.: Formation of hydrothermal fluorite deposits in the southern Black Forest (S.W. Germany), Part II: Geochemical features, in: Current Research in Geology Applied to Ore Deposits, edited by: Fenoll-Hach, A., Torres-Ruiz, J., and Gervilla, F., University of Granada, 739–742, ISBN 84-338-1772-8, 1993.
Gagnon, J. E., Samson, I. M., Fryer, B. J., and Williams-Jones, A. E.: Compositional heterogeneity in fluorite and the genesis of fluorite deposits: insights from LA–ICP–MS analysis, Can. Mineral., 41, 365–382, https://doi.org/10.2113/gscanmin.41.2.365, 2003.
Göb, S., Loges, A., Nolde, N., Bau, M., Jacob, D. E., and Markl, G.: Major and trace element compositions (including REE) of mineral, thermal, mine and surface waters in SW Germany and implications for water-rock interaction, Appl. Geochem., 33, 127–152, https://doi.org/10.1016/j.apgeochem.2013.02.006, 2013.
Hanel, M., Kessler, G., Sawatzki, G., and Wimmenauer, W.: Schwarzwald, in: Stratigraphie von Deutschland II. Ordovizium, Kambrium, Vendium, Riphäikum, edited by: Deutsche Stratigraphische Kommission, Courier Forschungsinstitut Senckenberg, 234, 13–64, ISBN 978-3-510-61332-8, 2001.
Hauck, M.: Bergbau- und Fördertechnik auf den Wiedener Gruben, in: Lagerstätten und Bergbau bei Wieden im Südschwarzwald unter besonderer Berücksichtigung der Grube Finstergrund (Der Erzgräber, 35), edited by: Verein der Freunde von Mineralien und Bergbau Oberwolfach e.V., 117–136, ISSN 2698-4385, 2020.
Hintzen, R.: REE data of hydrothermal fluorite from the Finstergrund & Tannenboden veins (Wieden district, Black Forest, Germany), DDE DPR [data set], https://doi.org/10.12297/dpr.dde.202305.1, 2023.
Kalt, A., Altherr, R., and Hanel, M.: The Variscan Basement of the Schwarzwald, Eur. J. Mineral., Beihefte 12, 1–43, 2000.
Loges, A., Migdisov, A. A., Wagner, T., Williams-Jones, A. E., and Markl, G.: An experimental study of the aqueous solubility and speciation of Y(III) fluoride at temperatures up to 250 ∘C, Geochim. Cosmochim. Ac., 123, 403–415, https://doi.org/10.1016/j.gca.2013.07.031, 2013.
Lüders, V.: Geochemische Untersuchungen an Gangartmineralen aus dem Bergbaurevier Freiamt – Sexau und dem Badenweiler – Quarzriff, Schwarzwald, in: Die Erz- und Mineralgänge im alten Bergbaurevier Freiamt – Sexau, Mittlerer Schwarzwald, edited by: Storch, D. H., and Werner, W., Abh. Geol. Landesamt Baden-Württemberg, 14, 173–191, ISSN 0408-1552, 1994.
Mankopf, N. R. and Lippolt, H. J.: 4He-geochemische Belege für ein permotriassisches Alter des Roteisenerzes des Quarz-Hämatit-Baryt-Ganges westlich Obersexau im Brettental, Mittlerer Schwarzwald, Jahresheft des Geologischen Landesamt Baden-Württemberg, 37, 25–48, ISSN 0408-1560, 1997.
Markl, G.: Südlicher Schwarzwald, in: Schwarzwald: Lagerstätten und Mineralien aus vier Jahrhunderten, Vol. 4, Bode Verlag GmbH, Salzhemmendorf-Lauenstein, 880 pp., ISBN 978-3-942-588232, 2017.
McLennan, S. M.: Rare Earth Elements in sedimentary rocks. Influence of provenance and sedimentary processes, in: Geochemistry and mineralogy of rare earth elements, Reviews in mineralogy, Vol. 21, edited by: Lipin, B. R. and McKay, G. A., Mineralogical Society of America, Washington, 169–200, https://doi.org/10.1017/S0016756800021944, 1989.
Metz, R., Richter, M., and Schürenberg, H.: Die Blei-Zink-Erzgänge des Schwarzwaldes, in: Beihefte zum Geologischen Jahrbuch, Vol. 29, Amt für Bodenforschung, Hannover, 277 pp., 1957.
Migdisov, A. A. and Williams-Jones, A. E.: Hydrothermal transport and deposition of the rare earth elements by fluorine-bearing aqueous liquids, Mineral. Depos., 49, 987–997, https://doi.org/10.1007/s00126-014-0554-z, 2014.
Möller, P.: REE fractionation in hydrothermal fluorite and calcite, Source, transport and deposition of metals, in: 25 years Society for Geology applied to Mineral Deposits, edited by: Pagel, M. and Leroy, J. L., Balkema, Rotterdam, 91–94, 1991.
Möller, P.: Rare Earth Elements and Yttrium as Geochemical Indicators of the Source of Mineral and Thermal Waters, in: Hydrogeology of Crystalline Rocks, edited by: Stober, I., and Bucher, K., Springer, Dordrecht, 227–246, https://doi.org/10.1007/978-94-017-1816-5_10, 2000.
Möller, P., Maus, H., and Gundlach, H.: Die Entwicklung von Flußspatmineralisationen im Bereich des Schwarzwaldes, Jahresheft des Geologischen Landesamtes Baden-Württemberg, 24, 35–70, ISSN 0408-1560, 1982.
Möller, P., Stober, I., and Dulski, P.: Seltenerdelement-, Yttrium-Gehalte und Bleiisotope in Thermal- und Mineralwässern des Schwarzwaldes, Zeitschrift der Fachsektion Hydrogeologie, 3, 118–132, https://doi.org/10.1007/s767-1997-8533-0, 1997.
Möller, P., Bau, M., Dulski, P., and Lüders, V.: REE and yttrium fractionation in fluorite and their bearing on fluorite formation, in: Proc. 9th Quadr. IAGOD Symp., 12–18 August 1994, Beijing, China, article no. 48, edited by: Hagni, E. D., Schweizerbart, Stuttgart, 575–592, ISBN 978-3-510-65180-1, 1998.
Nadoll, P., Rehm, M., Duschl, F., Klemd, R., Kraemer, D., and Sośnicka, M.: REY and Trace Element Chemistry of Fluorite from Post-Variscan Hydrothermal veins in Paleozoic Units of the North German Basin, Geosciences, 8, 283, https://doi.org/10.3390/geosciences8080283, 2018.
Naldrett, D. L., Lachaine, A., and Naldrett, S. N.: Rare-earth elements, thermal history, and the colour of natural fluorites, Can. J. Earth Sci., 24, 2082–2088, https://doi.org/10.1139/e87-197, 1987.
Nelson, B. J., Wood, S. A., and Osiensky, J. L.: Partitioning of REE between solution and particulate matter in natural waters: a filtration study, J. Sol. State Chem., 171, 51–56, https://doi.org/10.1016/S0022-4596(02)00145-7, 2003.
O'Neill, H. St. C.: The Smoothness and Shapes of Chondrite-normalized Rare Earth Element Patterns in Basalts, J. Petrol., 57, 1463–1508, https://doi.org/10.1093/petrology/egw047, 2016.
Pearce, N. J. G., Perkins, W. T., Westgate, J. A., Gorton, M. P., Jackson, S. E, Neal, C. R, and Chenery, S. P.: A compilation of new and published major and trace element data for NIST SRM 610 and NIST SRM 612 glass reference materials, Geostand. Newsl., 21, 115–144, https://doi.org/10.1111/j.1751-908X.1997.tb00538.x, 1997.
Perry, E. and Gysi, A. P.: Hydrothermal calcite-fluid REE partitioning experiments at 200 ∘C and saturated water vapor pressure, Geochim. Cosmochim. Ac., 286, 177–197, https://doi.org/10.1016/j.gca.2020.07.018, 2020.
Philpotts, A. R. and Ague, J. J.: Principles of Igneous and Metamorphic Petrology, 2nd Edn., Cambridge University Press, Cambridge, 667 pp., ISBN 0521880068, 2009.
Richardson, C. K. and Holland, H.: The solubility of fluorite in hydrothermal solutions, an experimental study, Geochim. Cosmochim. Ac., 43, 1313–1325, https://doi.org/10.1016/0016-7037(79)90121-2, 1979.
Schaltegger, U.: U-Pb geochronology of the Southern Black Forest Batholith (Central Variscan Belt): timing of exhumation and granite emplacement, Int. J. Earth Sci., 88, 814–828, https://doi.org/10.1007/s005310050308, 2000.
Scharrer, M., Reich, R., Fusswinkel, T., Walter, B. F., and Markl, G.: Basement aquifer evolution and the formation of unconformity-related hydrothermal vein deposits: LA-ICP-MS analyses of single fluid inclusions in fluorite from SW Germany, Chem. Geol., 575, 1–19, https://doi.org/10.1016/j.chemgeo.2021.120260, 2021.
Schwinn, G. and Markl, G.: REE systematics in hydrothermal fluorite, Chem. Geol., 216, 225–248, https://doi.org/10.1016/j.chemgeo.2004.11.012, 2005.
Shannon, R. D.: Revised effective ionic radii and systematic studies of interatomic distances in halides and chalcogenides, Acta Crystallogr. A, 32, 751–767, https://doi.org/10.1107/S0567739476001551, 1976.
Sholkovitz, E. R.: Chemical evolution of rare earth elements: fractionation between colloidal and solution phases of filtered river water, Earth Planet. Sc. Lett., 114, 77–84, https://doi.org/10.1016/0012-821X(92)90152-L, 1992.
Smith, M. P., Henderson, P., and Campbell, L. S.: Fractionation of the REE during hydrothermal processes: constraints from the Bayan Obo Fe-REE-Nb deposit, Inner Mongolia, China, Geochim. Cosmochim. Ac., 64, 3141–3160, https://doi.org/10.1016/S0016-7037(00)00416-6, 2000.
Sibson, R. H.: Earthquake rupturing as a mineralizing agent in hydrothermal systems, Geol., 15, 701–704, https://doi.org/10.1130/0091-7613(1987)15<701:ERAAMA>2.0.CO;2, 1987.
Sibson, R. H., Moore, J. Mc. M., and Rankin, A. H.: Seismic pumping – a hydrothermal fluid transport mechanism, J. Geol. Soc., 131, 653–659, https://doi.org/10.1144/gsjgs.131.6.0653, 1975.
Sibson, R. H., Robert, F., and Poulsen, K. H.: High-angle reverse faults, fluid-pressure cycling, and mesothermal gold-quartz deposits, Geology, 16, 551–555, https://doi.org/10.1130/0091-7613(1988)016<0551:HARFFP>2.3.CO;2, 1988.
Sverjensky, D. A.: Europium redox equilibria in aqueous solution, Earth Planet. Sc. Lett., 67, 70–78, https://doi.org/10.1016/0012-821X(84)90039-6, 1984.
van Achterbergh, E., Ryan, C. G., and Griffin, W. L.: GLITTER, Version 4.4.4, On-line Interactive Data Reduction for LA ICPMS, Macquarie Research Ltd., 9th Annual V. M. Goldschmidt Conference, 22–27 August 1999, Cambridge, 7215, 20000108923, 2000.
van Gehlen, K., Nielsen, H., and Ricke, W.: S-Isotopen-Verhältnisse in Baryt und Sulphiden aus hydrothermalen Gängen im Schwarzwald und jüngeren Barytgängen in Süddeutschland und ihre genetische Bedeutung, Geochim. Cosmochim. Ac., 26, 1189–1207, https://doi.org/10.1016/0016-7037(62)90051-0, 1962.
Walker, J. B. and Choppin, G. R.: Thermodynamic parameters of fluoride complexes of the lanthanides, Adv. Chem., 71, 127–140, https://doi.org/10.1021/ba-1967-0071.ch010, 1967.
Walter, B. F., Burisch, M., and Markl, G.: Long-term chemical evolution and modification of continental basement brines – a field study from the Schwarzwald, SW Germany, Geofluids, 16, 604–623, https://doi.org/10.1111/gfl.12167, 2016.
Walter, B. F., Burisch, M., Marks, M. A. W., and Markl, G.: Major element composition of fluid inclusions from hydrothermal vein-type deposits record eroded sedimentary units in the Schwarzwald district, SW Germany, Mineral. Depos., 52, 1191–2004, https://doi.org/10.1007/s00126-017-0719-7, 2017.
Walter, B. F., Burisch, M., Fusswinkel, T., Marks, M. A. W., Steele-MacInnis, M., Wälle, M., Apukhtina, O., and Markl, G.: Multi-reservoir fluid mixing processes in rift-related hydrothermal veins, Schwarzwald, SW-Germany, J. Geochem. Explor., 186, 158–186, https://doi.org/10.1016/j.gexplo.2017.12.004, 2018a.
Walter, B. F., Gerdes, A., Kleinhanns, I., Dunkl, I., Eynatten, H. von, Kreissl, S., and Markl, G.: The connection between hydrothermal fluids, mineralisation, tectonics and magmatism in a continental rift setting: Fluorite Sm-Nd and hematite and carbonate U-Pb geochronology from the Rhinegraben, SW Germany, Geochim. Cosmochim. Ac., 240, 11–42, https://doi.org/10.1016/j.gca.2018.08.012, 2018b.
Walter, B. F., Kortenbruck, P., Scharrer, M., Zeitvogel, C., Wälle, M., Mertz-Kraus, R., and Markl, G.: Chemical evolution of ore-forming brines – Basement leaching, metal provenance, and the redox link between barren and ore-bearing hydrothermal veins. A case study from the Schwarzwald mining district in SW-Germany, Chem. Geol., 506, 126–148, https://doi.org/10.1016/j.chemgeo.2018.12.038, 2019.
Werner, W.: Mineralische Rohstoffe, in: Erläuterungen zum Blatt 8113 Todtnau, edited by: Hann, P., and Zedler, H., Landesamt für Geologie, Rohstoffe und Bergbau LGRB, Freiburg i. Br., 98–115, ISSN 0945-9170, 2011.
Werner, W. and Dennert, V.: Lagerstätten und Bergbau im Schwarzwald: ein Führer unter besonderer Berücksichtigung der für die Öffentlichkeit zugänglichen Bergwerke, Landesamt für Geologie, Rohstoffe und Bergbau (LGRB), Freiburg i. Br., 334 pp., ISBN 3-00-014636-9, 2004.
Werner, W. and Franzke, H. J.: Tektonik und Mineralisation der Hydrothermalgänge am Schwarzwaldrand im Bergbaurevier Freiamt-Sexau, Abh. Geol. Landesamt Baden-Württ., 14, 27–98, 1994.
Werner, W. and Franzke, H. J.: Postvariszische bis neogene Bruchtektonik und Mineralisation im südlichen Zentralschwarzwald, in: Z. Deutsch. Geol. Ges., 152, 405–437, https://doi.org/10.1127/zdgg/152/2001/405, 2001.
Werner, W. and Markl, G.: Geologisch-tektonische und lagerstättengeologische Übersicht, in: Lagerstätten und Bergbau bei Wieden im Südschwarzwald unter besonderer Berücksichtigung der Grube Finstergrund, edited by: Verein der Freunde von Mineralien und Bergbau Oberwolfach e.V., Der Erzgräber, 35, 11–27, ISSN 2698-4385, 2020.
Werner, W., Markl, G., and Steen, H.: Lagerstätteninhalt und Entstehung der Gänge bei Wieden, in: Lagerstätten und Bergbau bei Wieden im Südschwarzwald unter besonderer Berücksichtigung der Grube Finstergrund, edited by: Verein der Freunde von Mineralien und Bergbau Oberwolfach e.V., Der Erzgräber, 35, 28–45, ISSN 2698-4385, 2020.
Zhang, W., Zhou, L., Tang, H., Li, H., Song, W., and Chen, Z.: Modeling geochemical factors controlling fluorite concentration in groundwater, Arab. J. Geosci., 8, 9133–9147, https://doi.org/10.1007/s12517-015-1933-1, 2015.
Ziegler, P. A. and Dèzes, P.: Cenozoic uplift of Variscan Massifs in the Alpine foreland: Timing and controlling mechanisms, Glob. Planet. Change, 58, 237–269, https://doi.org/10.1016/j.gloplacha.2006.12.004, 2007.