the Creative Commons Attribution 4.0 License.
the Creative Commons Attribution 4.0 License.
 | 02 May 2023
Equilibrium and kinetic approaches to understand the occurrence of the uncommon chloritoid + biotite assemblage
Chiara Groppo
Franco Rolfo
The coexistence of chloritoid and biotite in medium-pressure Barrovian terranes is quite uncommon, and the parameters controlling their equilibrium relations are still controversial. Various studies have already investigated the influence of pressure (P), temperature (T), bulk rock (X bulk) and fluid (X fluid) compositions on the stability of this assemblage. Here we apply forward thermodynamic modelling on amphibolite-facies metapelites from the upper portion of the Lesser Himalayan Sequence (eastern Nepal Himalaya) to test which parameters mostly influence the stability of the chloritoid + biotite assemblage. P–T isochemical phase diagrams calculated in the MnNKCFMASHTO system fail in reproducing the coexistence of chloritoid and biotite, predicting biotite appearance at higher temperatures than chloritoid breakdown. Neither the fluid composition (i.e. reduced H2O activity due to the presence of CO2) nor a more oxidated state of the system favours their coexistence, while slightly H2O-undersaturated conditions expand the biotite stability field toward lower temperatures, allowing the development of the chloritoid + biotite assemblage. Kinetic factors could have further contributed to the stability of this assemblage: thermal overstepping of the chloritoid-consuming and staurolite-producing reaction, induced by the difficulty in the staurolite nucleation and/or by the sluggishness of chloritoid dissolution, could have enhanced the metastable persistence of chloritoid at temperatures compatible with the presence of biotite. Being the kinetics efficiency intrinsically linked to the degree of fluid availability, the two factors (i.e. H2O-undersaturated conditions and kinetics of the chloritoid-consuming reaction) were likely complementary rather than mutually exclusive.
- Article
(8181 KB) - Full-text XML
-
Supplement
(2753 KB) - BibTeX
- EndNote


In the last 20 years, the progressive improvement of thermodynamic datasets coupled with the availability of efficient software led to an exponential increase of forward thermodynamic modelling studies aimed at unravelling the metamorphic evolution of orogens (e.g. Powell et al., 2005; Spear et al., 2016; Lanari and Duesterhoeft, 2019, and references therein). In this framework, the pelitic system remains, by far, the most investigated, due to its tendency to develop low-variant mineral assemblages. Aluminous metapelites are especially suitable for petrologic modelling because their bulk compositions favour the growth of Al-rich index minerals such as chlorite, chloritoid, garnet, staurolite and kyanite sillimanite (White et al., 2014). Among these minerals, chloritoid is quite common in Fe-rich metapelites and is often associated with chlorite, muscovite, ± garnet ± staurolite ± kyanite. The chloritoid + biotite ± garnet assemblage is, instead, relatively rare. The coexistence of these phases in regional metamorphic terranes is uncommon (e.g. Hoschek, 1969; Bushmin and Glebovitsky, 2008). Few occurrences of the chloritoid + biotite ± garnet assemblage have been reported from different settings: (i) contact metamorphic settings (Okuyama-Kusunose, 1994; Pitra and Guiraud, 1996; Ahn and Nakamura, 2000; Waters and Lovregrove, 2002; Saki et al., 2021), (ii) low-pressure regional metamorphic Barrovian sequences (> 30 ∘C km−1; Baltatzis and Wood, 1977; Wang and Spear, 1991; Droop and Harte, 1995; Whitney et al., 1996), and (iii) more rarely, medium-pressure regional metamorphic Barrovian sequences (25–30 ∘C km−1; Droop and Harte, 1995; Sengupta, 2012).
Several studies (Hoschek, 1969; Baltatzis, 1979; Hiroi, 1983; Bickle and Archibald, 1984; Wang and Spear, 1991; Droop and Harte, 1995; Sengupta, 2012; Saki et al., 2021) have investigated how the stability of the chloritoid + biotite assemblage could be enhanced by different parameters, among which are (i) pressure (P) and temperature (T) conditions, (ii) bulk rock composition, and (iii) fluid composition. These studies are all based on the principles of equilibrium thermodynamics, i.e. on the assumption that each mineral grew in equilibrium with its surroundings, and thus its composition reflects the P–T conditions of its growth (e.g. Guiraud et al., 2001; Powell et al., 2005; Powell and Holland, 2008). They highlight the following points.
- i.
Low-pressure conditions (P<6 kbar) favour the stability of the chloritoid + biotite assemblage, because the slope (dP dT) of the biotite-in reaction is less steep than that of the chloritoid-out reaction (Wang and Spear, 1991), resulting in their intersection at P<6 kbar (White et al., 2014). The coexistence of chloritoid + biotite is therefore more easily explained in low-P contact metamorphic environments.
- ii.
Bulk compositions richer in Fe and Al than the average favour the chloritoid + biotite (+ garnet) assemblage. The influence of minor components, particularly of MnO, has also been considered, which mainly controls the garnet stability field (e.g. Sengupta, 2012; Saki et al., 2021);
- iii.
The fluid composition can also influence the chloritoid + biotite assemblage stability, as recently discussed by Saki et al. (2021). These authors demonstrated that the chloritoid + biotite assemblage is stable at progressively lower H2O activities (down to aH2O ∼0.25) with decreasing temperature. However, their study is limited to P≤6 kbar.
Going beyond the equilibrium paradigm, kinetic factors have been alternatively considered to explain the (metastable) persistence of chloritoid outside its equilibrium stability field (e.g. at temperatures consistent with the stability of biotite). Studying the metapelites from the Bushveld aureole, Waters and Lovegrove (2002) identified a delayed nucleation of staurolite at the expense of chloritoid (i.e. thermal overstepping of the chloritoid-consuming and staurolite-producing reaction) due to a combination of sluggish staurolite nucleation and relative unreactivity of precursor chloritoid porphyroblasts. In this framework, the crucial parameter is the reaction affinity, i.e. the energetic driving force for nucleation as defined by Pattison and Tinkham (2009, and references therein). Reaction affinity is especially low for reactions that release little or no H2O (Pattison and Tinkham, 2009; Pattison et al., 2011); thermal overstepping of these reactions is expected to be significant, resulting in delayed nucleation of the products porphyroblasts and consumption of the reactant phases, with respect to the equilibrium predictions.
In this study, we report the coexistence of chloritoid + biotite in metapelites from the upper portion of the Lesser Himalayan Sequence of eastern Nepal, which experienced a medium-pressure Barrovian prograde metamorphism during the Himalayan orogenic cycle (e.g. Goscombe et al., 2018; Groppo et al., 2023). A detailed microstructural, mineral chemical and thermodynamic modelling study is presented for two samples, in order to investigate (i) how intensive and/or extensive variables have influenced the development of this uncommon assemblage in the framework of the equilibrium paradigm and (ii) if (and how) the coexistence of chloritoid and biotite could have been controlled by kinetic factors rather than by (or in addition to) equilibrium thermodynamics.
Our results highlight the possibility that metapelites can attain conditions of slight H2O undersaturation during prograde metamorphism, in contrast to the common assumption of H2O-saturated conditions. In the framework of equilibrium thermodynamics, H2O undersaturation may well explain the observed coexistence of chloritoid and biotite. Alternatively, emphasizing the role of kinetics, the coexistence of chloritoid and biotite could be explained through thermal overstepping of the chloritoid-consuming reaction. We suggest that the two factors might have been complementary.
The metamorphic core of the Himalayan belt consists of two juxtaposed tectono-metamorphic units: the Lesser Himalayan Sequence (LHS) and the Greater Himalayan Sequence (GHS) (Gansser, 1964; Kohn, 2014; Dhital, 2015; Martin, 2017a; Waters, 2019; Fig. 1). Both units mainly consist of a thick sedimentary sequence deposited on the passive northern margin of the Indian Plate during the Proterozoic, which experienced Barrovian metamorphism during the Himalayan orogenic cycle (Le Fort, 1975; Upreti, 1999; Hodges, 2000; Yin, 2006). The LHS is tectonically interposed between the underlying Siwalik Group (molasse) to the south and the overlying GHS to the north (Hodges, 2000; DeCelles et al., 2000), from which it is separated by the Main Boundary Thrust (MBT) and the Main Central Thrust (MCT), respectively (Heim and Gansser, 1939; Valdiya, 1980; Yin and Harrison, 2000; Fig. 1a, b). Although the precise location of the MCT is still controversial due to the different criteria used to define it (e.g. Yin, 2006; Searle et al., 2008; Martin, 2017b; Rapa et al., 2018), it is commonly accepted that the MCT is a broad high-strain shear zone (i.e. Main Central Thrust Zone, MCTZ; Groppo et al., 2010; Larson et al., 2015), involving both the upper portion of the LHS (Upper-LHS) and the lower portion of the GHS.
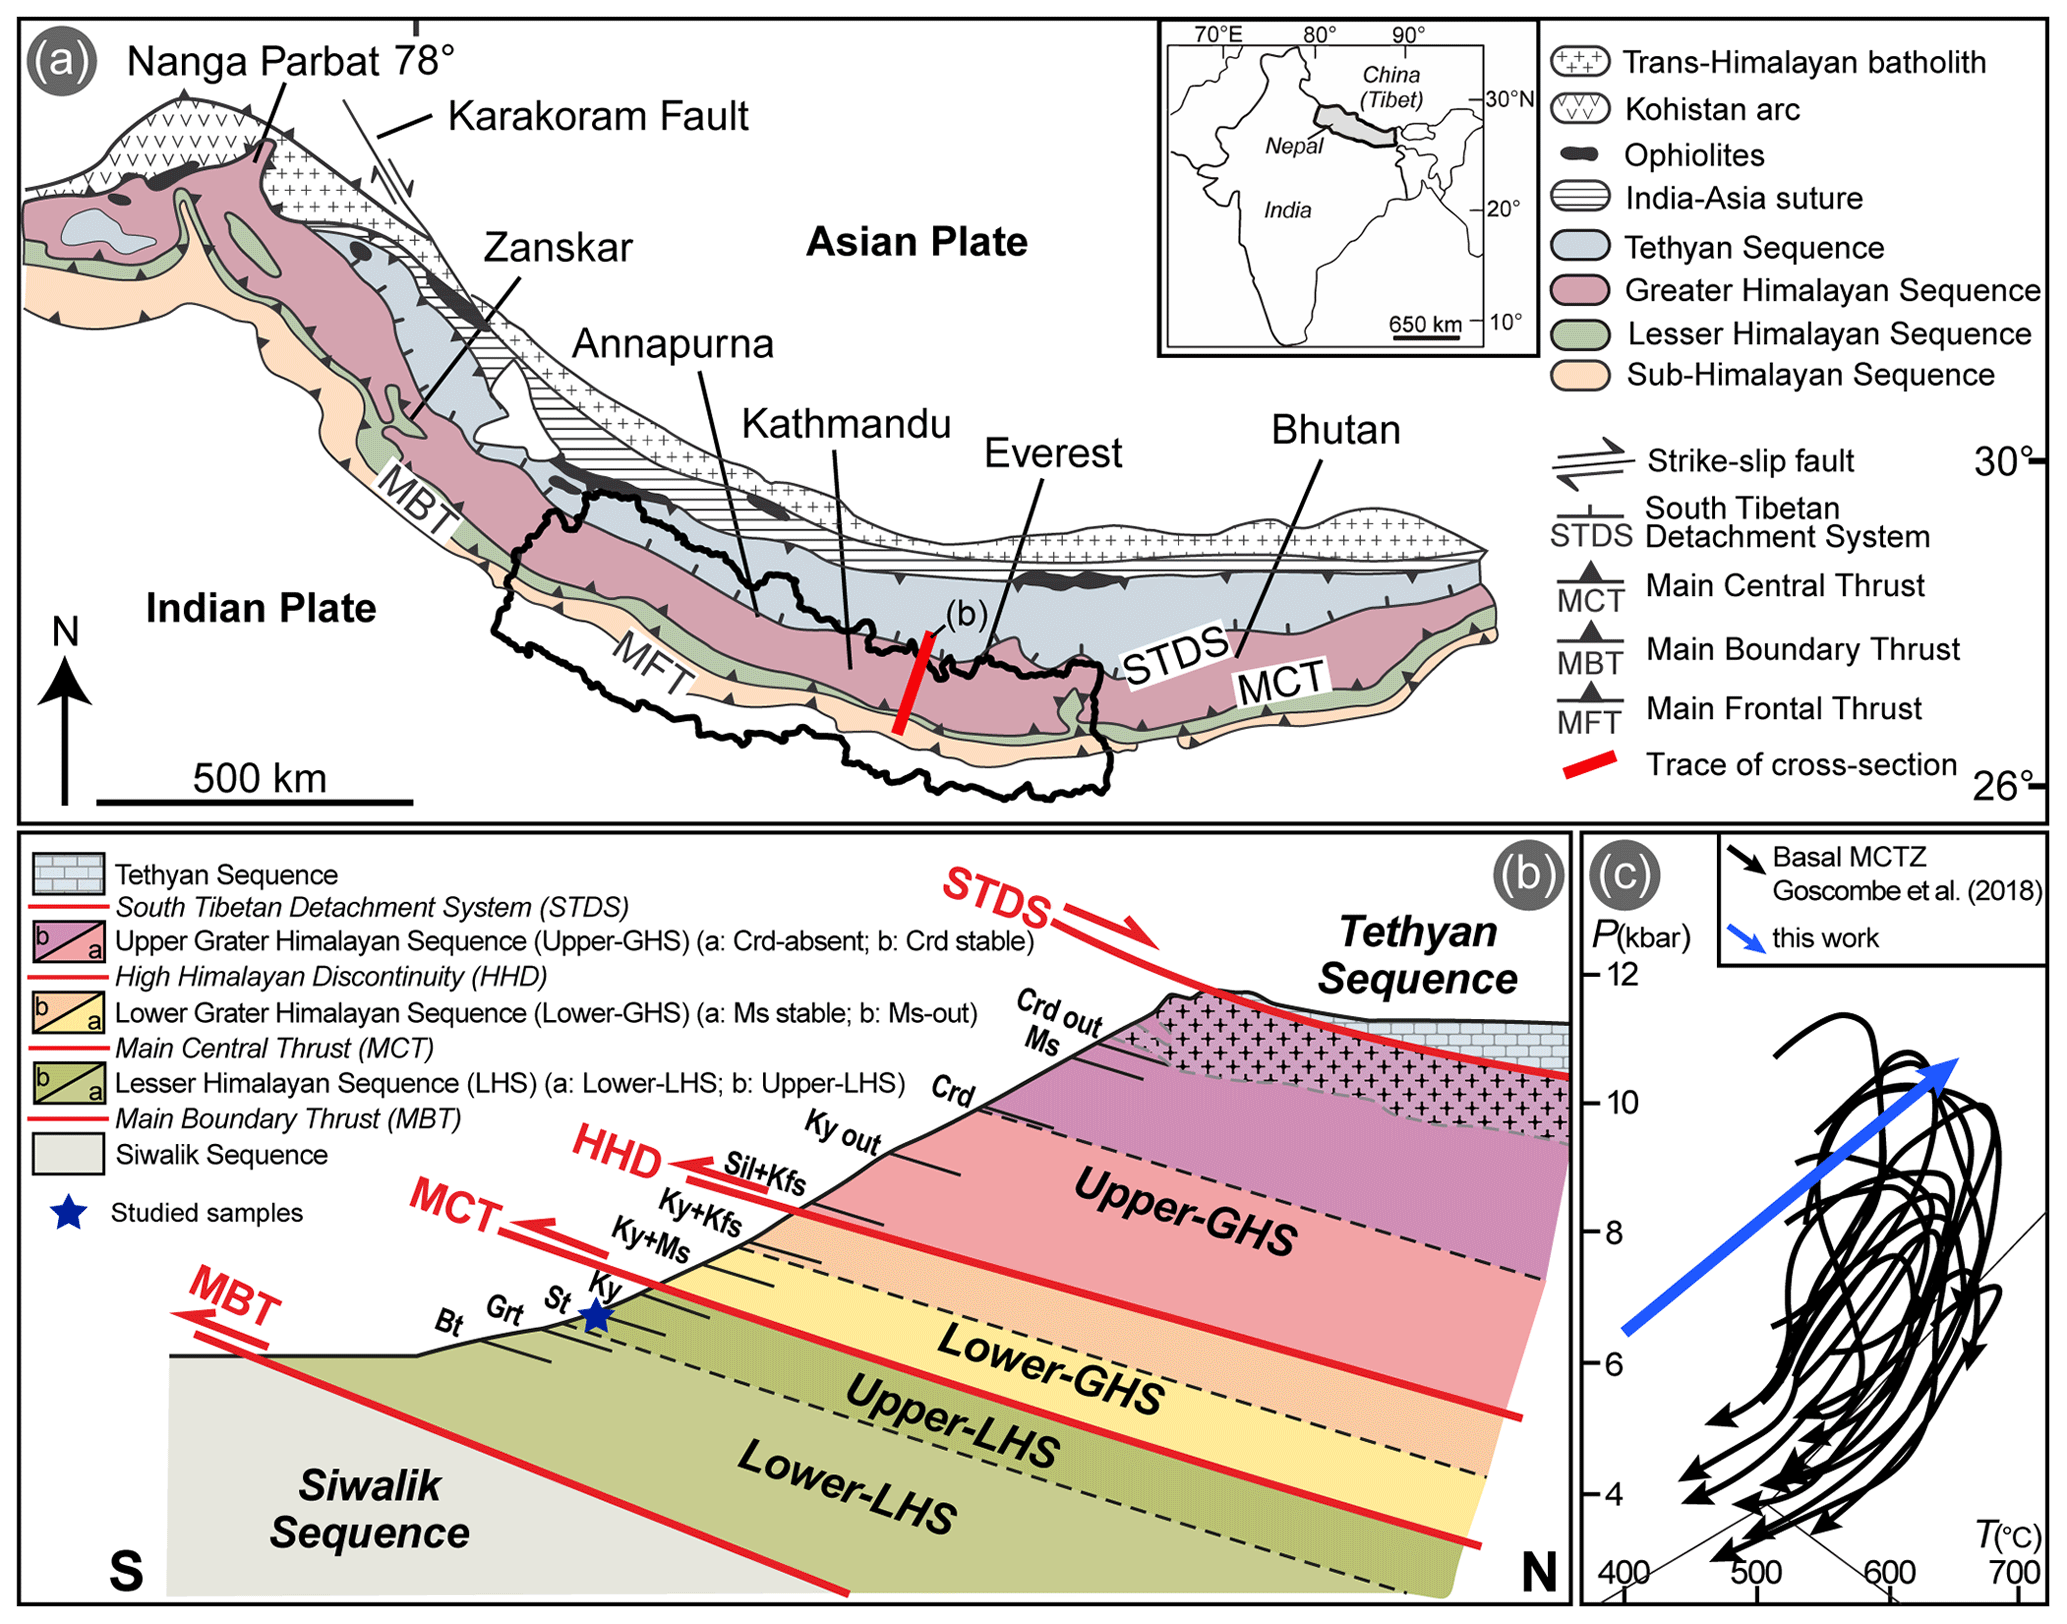
Figure 1(a) Geological sketch map of the Himalayan belt (modified after Yakymchuk and Godin, 2012), with its geographic location. Nepal boundaries have been highlighted. (b) Not-to-scale NE–SW simplified geological cross section across the Himalayan belt highlighting the internal subdivisions of the LHS and GHS, as well as the presence of index minerals indicating the inverse metamorphic gradient. (c) P–T paths for the basal MCTZ (modified from Goscombe et al., 2018), characterized by amphibolite-facies prograde metamorphism. The blue arrow represents the thermobaric gradient used in this work for the calculation of P/T–X phase diagrams.
The LHS is conventionally divided into two complexes characterized by distinct lithological associations: the Lower-LHS (Lower Nawakot Unit of Stöcklin, 1980) dominated by siliciclastic rocks and the Upper-LHS (Upper Nawakot Unit of Stöcklin, 1980) consisting of both carbonatic and siliciclastic rocks. U–Pb dating of detrital zircons constrains the depositional age of the Lower-LHS to the Paleoproterozoic (Parrish and Hodges, 1996; DeCelles et al., 2000; Martin et al., 2005, 2011; Sakai et al., 2013), whereas a Mesoproterozoic age is proposed for the Upper-LHS sequence (e.g. DeCelles et al., 2001; Martin et al., 2005, 2011). The Lower-LHS and the Upper-LHS sequences contain laterally continuous granitic orthogneiss bodies (Ulleri Fm.; Robinson et al., 2001; Upreti et al., 2003; Kohn et al., 2010; Larson et al., 2019), whose protoliths have been dated at 1800–1850 Ma (Robinson et al., 2001; Larson et al., 2019). The LHS is characterized by a structurally upward increase in the metamorphic grade (e.g. Le Fort, 1975; Stöcklin, 1980; Pêcher, 1989), which defines a typical Barrovian inverted metamorphic gradient (Fig. 1b). Comprehensive reviews of the variations in peak P–T conditions registered by the inverted metamorphic LHS sequence from the lower to the upper structural levels, and along-strike from western to eastern Nepal, are provided by Kohn (2014), Goscombe et al. (2018) and Groppo et al. (2023). Peak metamorphic ages decrease from ∼ 10–13 Ma in the Upper-LHS to ∼ 3–5 Ma in the Lower-LHS (Kohn, 2014, and references therein).
The two studied samples (19a-2a and 19a-4) have been collected from the Upper-LHS in the Arun Valley, eastern Nepal, where the LHS is exposed in the core of a large antiformal tectonic window (Schelling, 1992; Lombardo et al., 1993; Dhital, 2015). Both samples come from the eastern limb of the antiform, less than 3 km apart from each other. An overview of the peak P–T conditions and metamorphic evolution experienced by the Upper-LHS lithologies in this area is provided by Goscombe et al. (2006), Groppo et al. (2009) and Rolfo et al. (2014). GPS coordinates for the two samples are 27∘09′00.6′′ N, 87∘17′27.4′′ E, 350 m a.s.l., for sample 19a-2a and 27∘08′32.7′′ N, 87∘19′02.7′′ E, 470 m a.s.l., for sample 19a-4.
3.1 Petrography and mineral chemistry
Petrographic relations observed at the optical microscope were supported by investigations using a scanning electron microscope (SEM) JEOL JSM-IT300LV, equipped with an energy-dispersive spectrometer (EDS) Energy 200 System and an SSD X-Act3 detector (Oxford Inca Energy), hosted at the Department of Earth Sciences, University of Turin, Italy. High-resolution X-ray multispectral maps of the entire thin sections were acquired and processed with the Microanalysis Suite Issue 12, AZTEC Suite version 4.01. Operative conditions used for mapping are 15 kV accelerating voltage, 10 mm working distance, 1 µs process time, 500 ms pixel dwell time and 2.5 µm point step. The raw data were processed using the MultiSpec© software, classifying each pixel as its corresponding phase using a training routine to convert them into modal maps. Quantitative analyses of the rock-forming minerals were acquired and processed with the Microanalysis Suite Issue 12, INCA Suite version 4.01. Operative conditions are 15 kV accelerating voltage, 10 mm working distance, 1 µs process time and 15 s counting time. All the analyses were recalculated using the NORM software (Ulmer, 1986) and plotted using the IGPET software (Carr and Gazel, 2017). Fe2O3 content was recalculated based on stoichiometry and charge balance during NORM recalculation. XMg of chloritoid, biotite, chlorite and staurolite is defined as Mg (Mg + Fe2+), while for garnet XMg is defined as Mg (Mg + FeCa+Mn), and XCa and XMn are defined accordingly. Mineral abbreviations are from Whitney and Evans (2010). A non-numerical progression for the definition of the main foliation has been used (i.e. Sm−1, Sm), where Sm is the main foliation and “−1” denotes an earlier foliation with respect to Sm.
3.2 Thermodynamic modelling
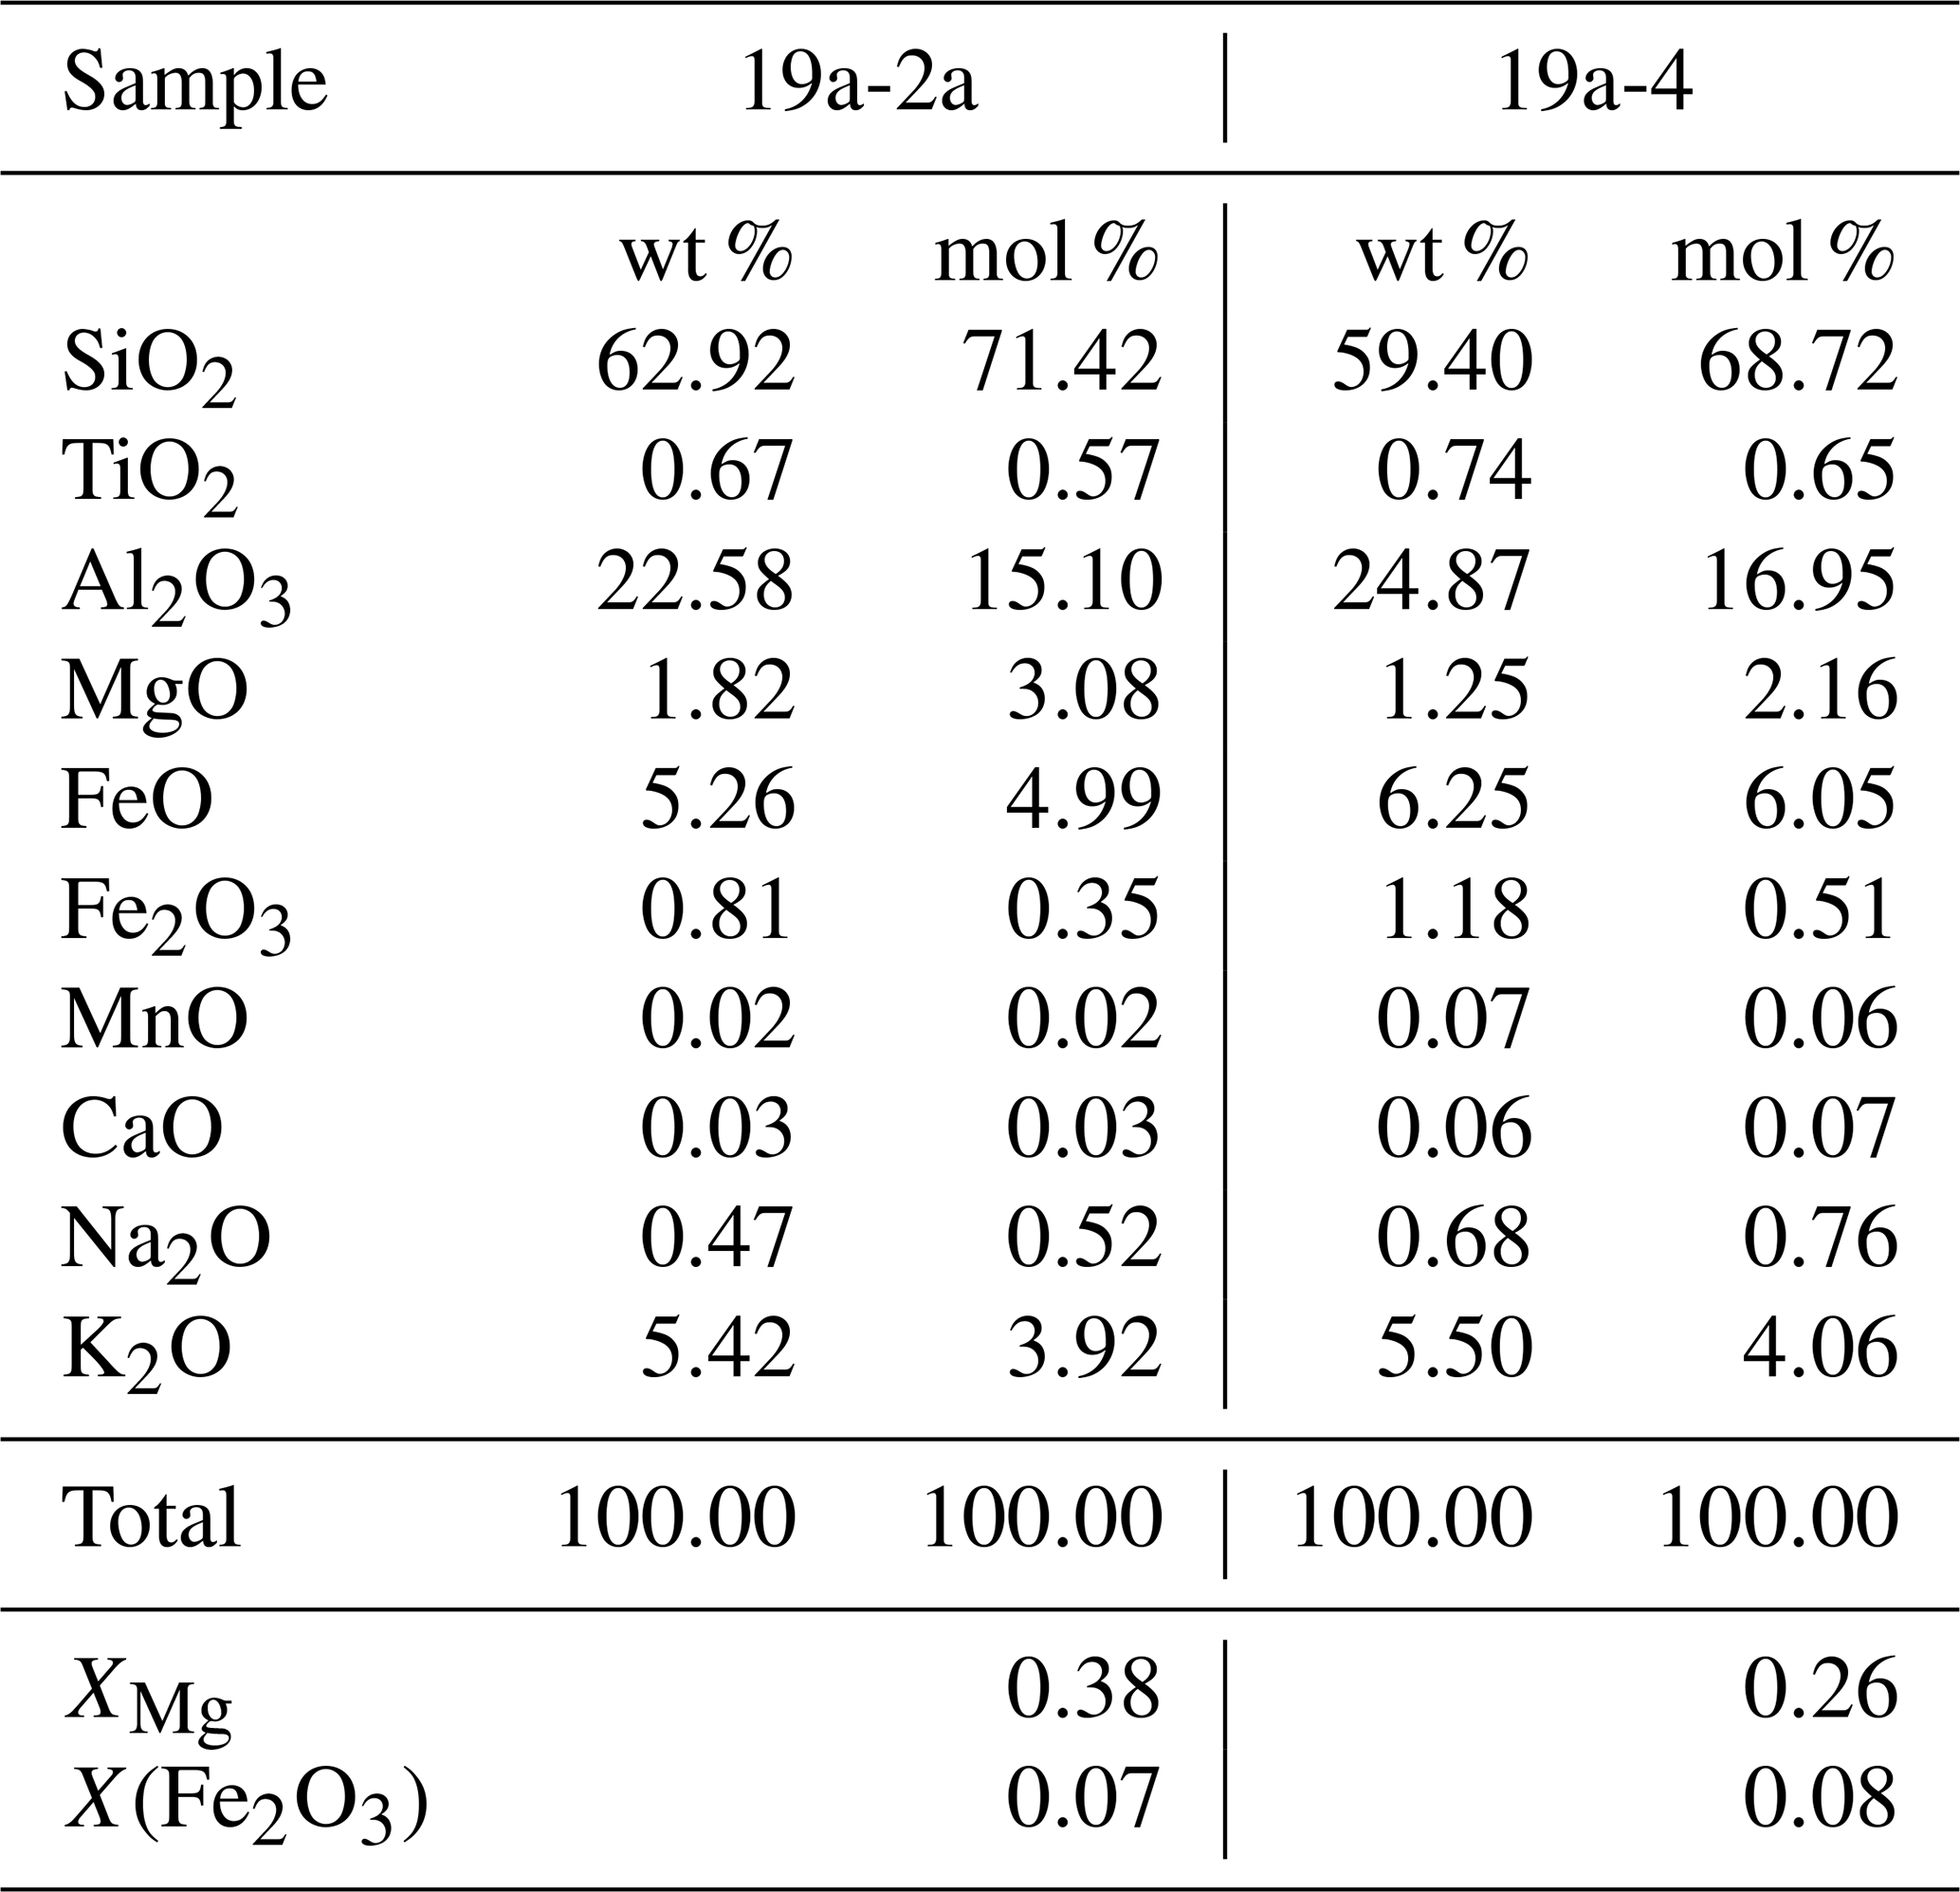
Bulk rock compositions of the two samples were calculated by combining the estimated mineral modes with mineral chemistry and considering the molar volumes of each phase. More specifically, molar volumes of each mineral (data from Holland and Powell, 2011) were used to convert the observed mineral modes (vol %) in mole percent (mol %) of each phase. The measured mineral compositions (mol % of each end-member) were then used to convert the mol % of each phase into mol % of each oxide component (all the details are provided in the Supplement Table S1). Bulk rock XMg is defined as MgO (MgO + FeO), whereas bulk rock X(Fe2O3) is defined as Fe2O3 (FeO + Fe2O3). All the isochemical phase diagrams were calculated in the MnNKCFMASHTO (MnO–Na2O–K2O–CaO–FeO–MgO–Al2O3–SiO2–H2O–TiO2–Fe2O3) system using Perple_X 6.9.0 (Connolly, 1990, 2009). The internally consistent thermodynamic dataset of Holland and Powell (1998) (ds55) and the equation of state for the binary H2O-CO2 fluid of Holland and Powell (1998) were used. The following solid solution models were considered: biotite (White et al., 2007), chloritoid, garnet, staurolite (Holland and Powell, 1998), chlorite (Holland et al., 1998), cordierite (Mg–Fe ideal model), white mica (Coggon and Holland, 2002), feldspar (Fuhrman and Lindsley, 1988), ilmenite (White et al., 2000, modified as described by White et al., 2014) and epidote (Holland and Powell, 1998). A pure aqueous fluid (aH2O = 1) was considered as excess phase, except where explicitly indicated (i.e. P/T–aH2O and P/T–M(H2O) phase diagrams).
The P/T–aH2O, P/T–X(Fe2O3) and P/T–M(H2O) phase diagrams were calculated along a thermobaric gradient defined as P(bar) = 17 T(K) − 5065, which fit with the prograde P–T evolution of the Upper-LHS (Goscombe et al., 2018; Tamang et al., 2023; Fig. 1c). For the P/T–aH2O phase diagrams, the water activity was considered as a compositional parameter and lowered by adding CO2 in the fluid (i.e. increasing XCO2= CO2 (H2O + CO2) values) and assuming an ideal a=X relation. For this last computation, the carbonate (i.e. Ca–Mg–Mn–Fe carbonate: Massonne, 2010) and dolomite–ankerite (Holland and Powell, 1998) solution models were added. In the P/T–M(H2O) phase diagrams, the extensive variable M(H2O) is the mol % of H2O in the bulk composition, ranging in the interval 5.00–20.00 mol %.
In order to test the possible influence of different thermodynamic databases on the stability of the chloritoid + biotite assemblage, the same isochemical phase diagrams were also calculated using the internally consistent thermodynamic dataset of Holland and Powell (2011) (ds62) and the related solid solution models (chlorite, white mica, biotite, chloritoid, garnet, staurolite, cordierite, ilmenite: White et al., 2014; feldspar: Fuhrman and Lindsley, 1988; epidote: Holland and Powell, 2011). The general topologies of the phase diagrams calculated using the ds55 and ds62 databases are similar, as well as the behaviour of the chloritoid-out (Cld-out) and biotite-in (Bt-in) reactions; however, the results obtained using the ds62 database are less satisfactory concerning the modelling of accessory minerals (e.g. magnetite) and the isopleth intersection. For this reason, the results obtained using the ds55 database are reported here, whereas those obtained using the ds62 database are provided in the Supplement.
The two studied samples (19a-2a and 19a-4) are muscovite + biotite + chloritoid + garnet + staurolite ± chlorite schists, characterized by the occurrence of the uncommon assemblage chloritoid + biotite + garnet (Figs. 2, 3). Blastesis–deformation relationships inferred for the two samples are summarized in Fig. 4. The full dataset of mineral chemical data for the main phases is reported in the Supplement (Tables S2, S3). Compositional diagrams for garnet and chloritoid are reported in Fig. 5, whereas those for muscovite, biotite, chlorite, staurolite and ilmenite are reported in the Supplement (Figs. S1, S2). Figure S2 also includes the compositional profiles measured on garnet porphyroblasts.
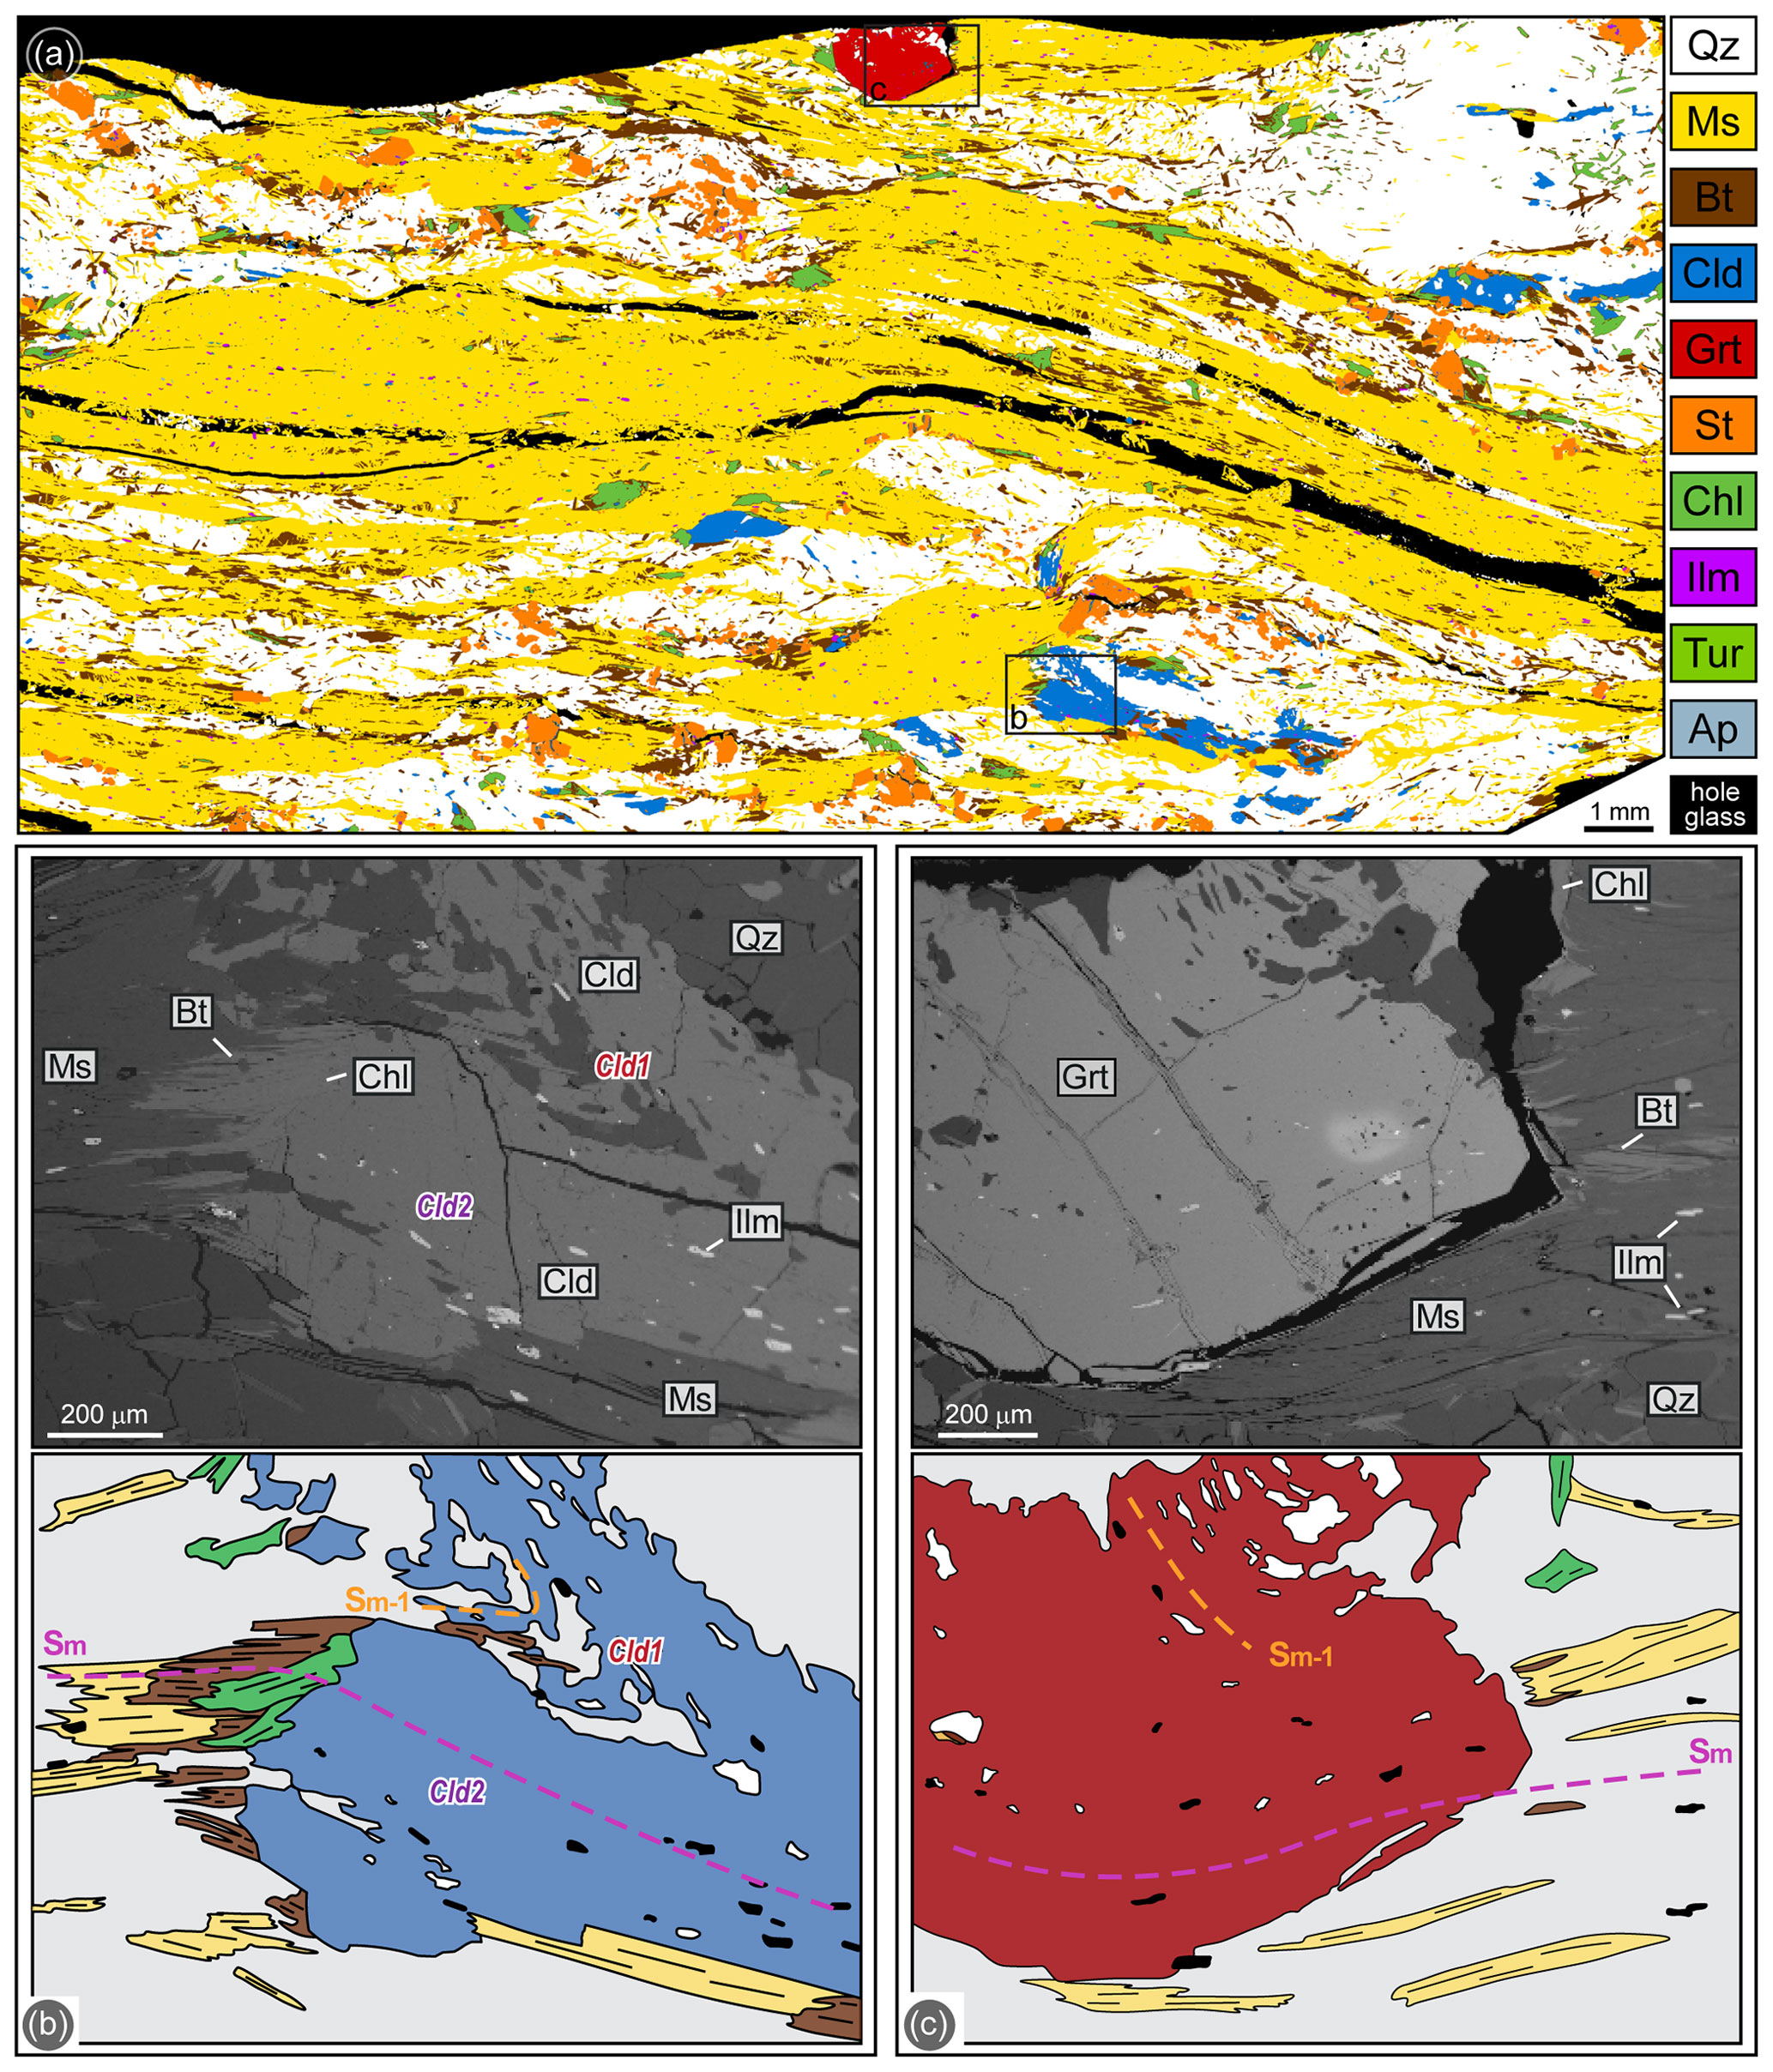
Figure 2(a) Processed high-resolution multispectral map of sample 19a-2a. (b) Chloritoid porphyroblast preserving an internal Sm−1 foliation in the core (Cld1) and an internal Sm foliation parallel to the external one (Cld2), supporting its multistadial growth. Chlorite grows statically on the Sm, replacing both chloritoid and biotite (back-scattered electron image, BSE, and redrawn sketch of the microphotograph). (c) Garnet porphyroblast showing an internal foliation parallel to the external Sm, while preserving an inclusion trail discordant with the Sm interpreted as Sm−1 (BSE image and redrawn sketch of the microphotograph). The grey matrix in the redrawn sketches in (b) and (c) mostly consists of muscovite.
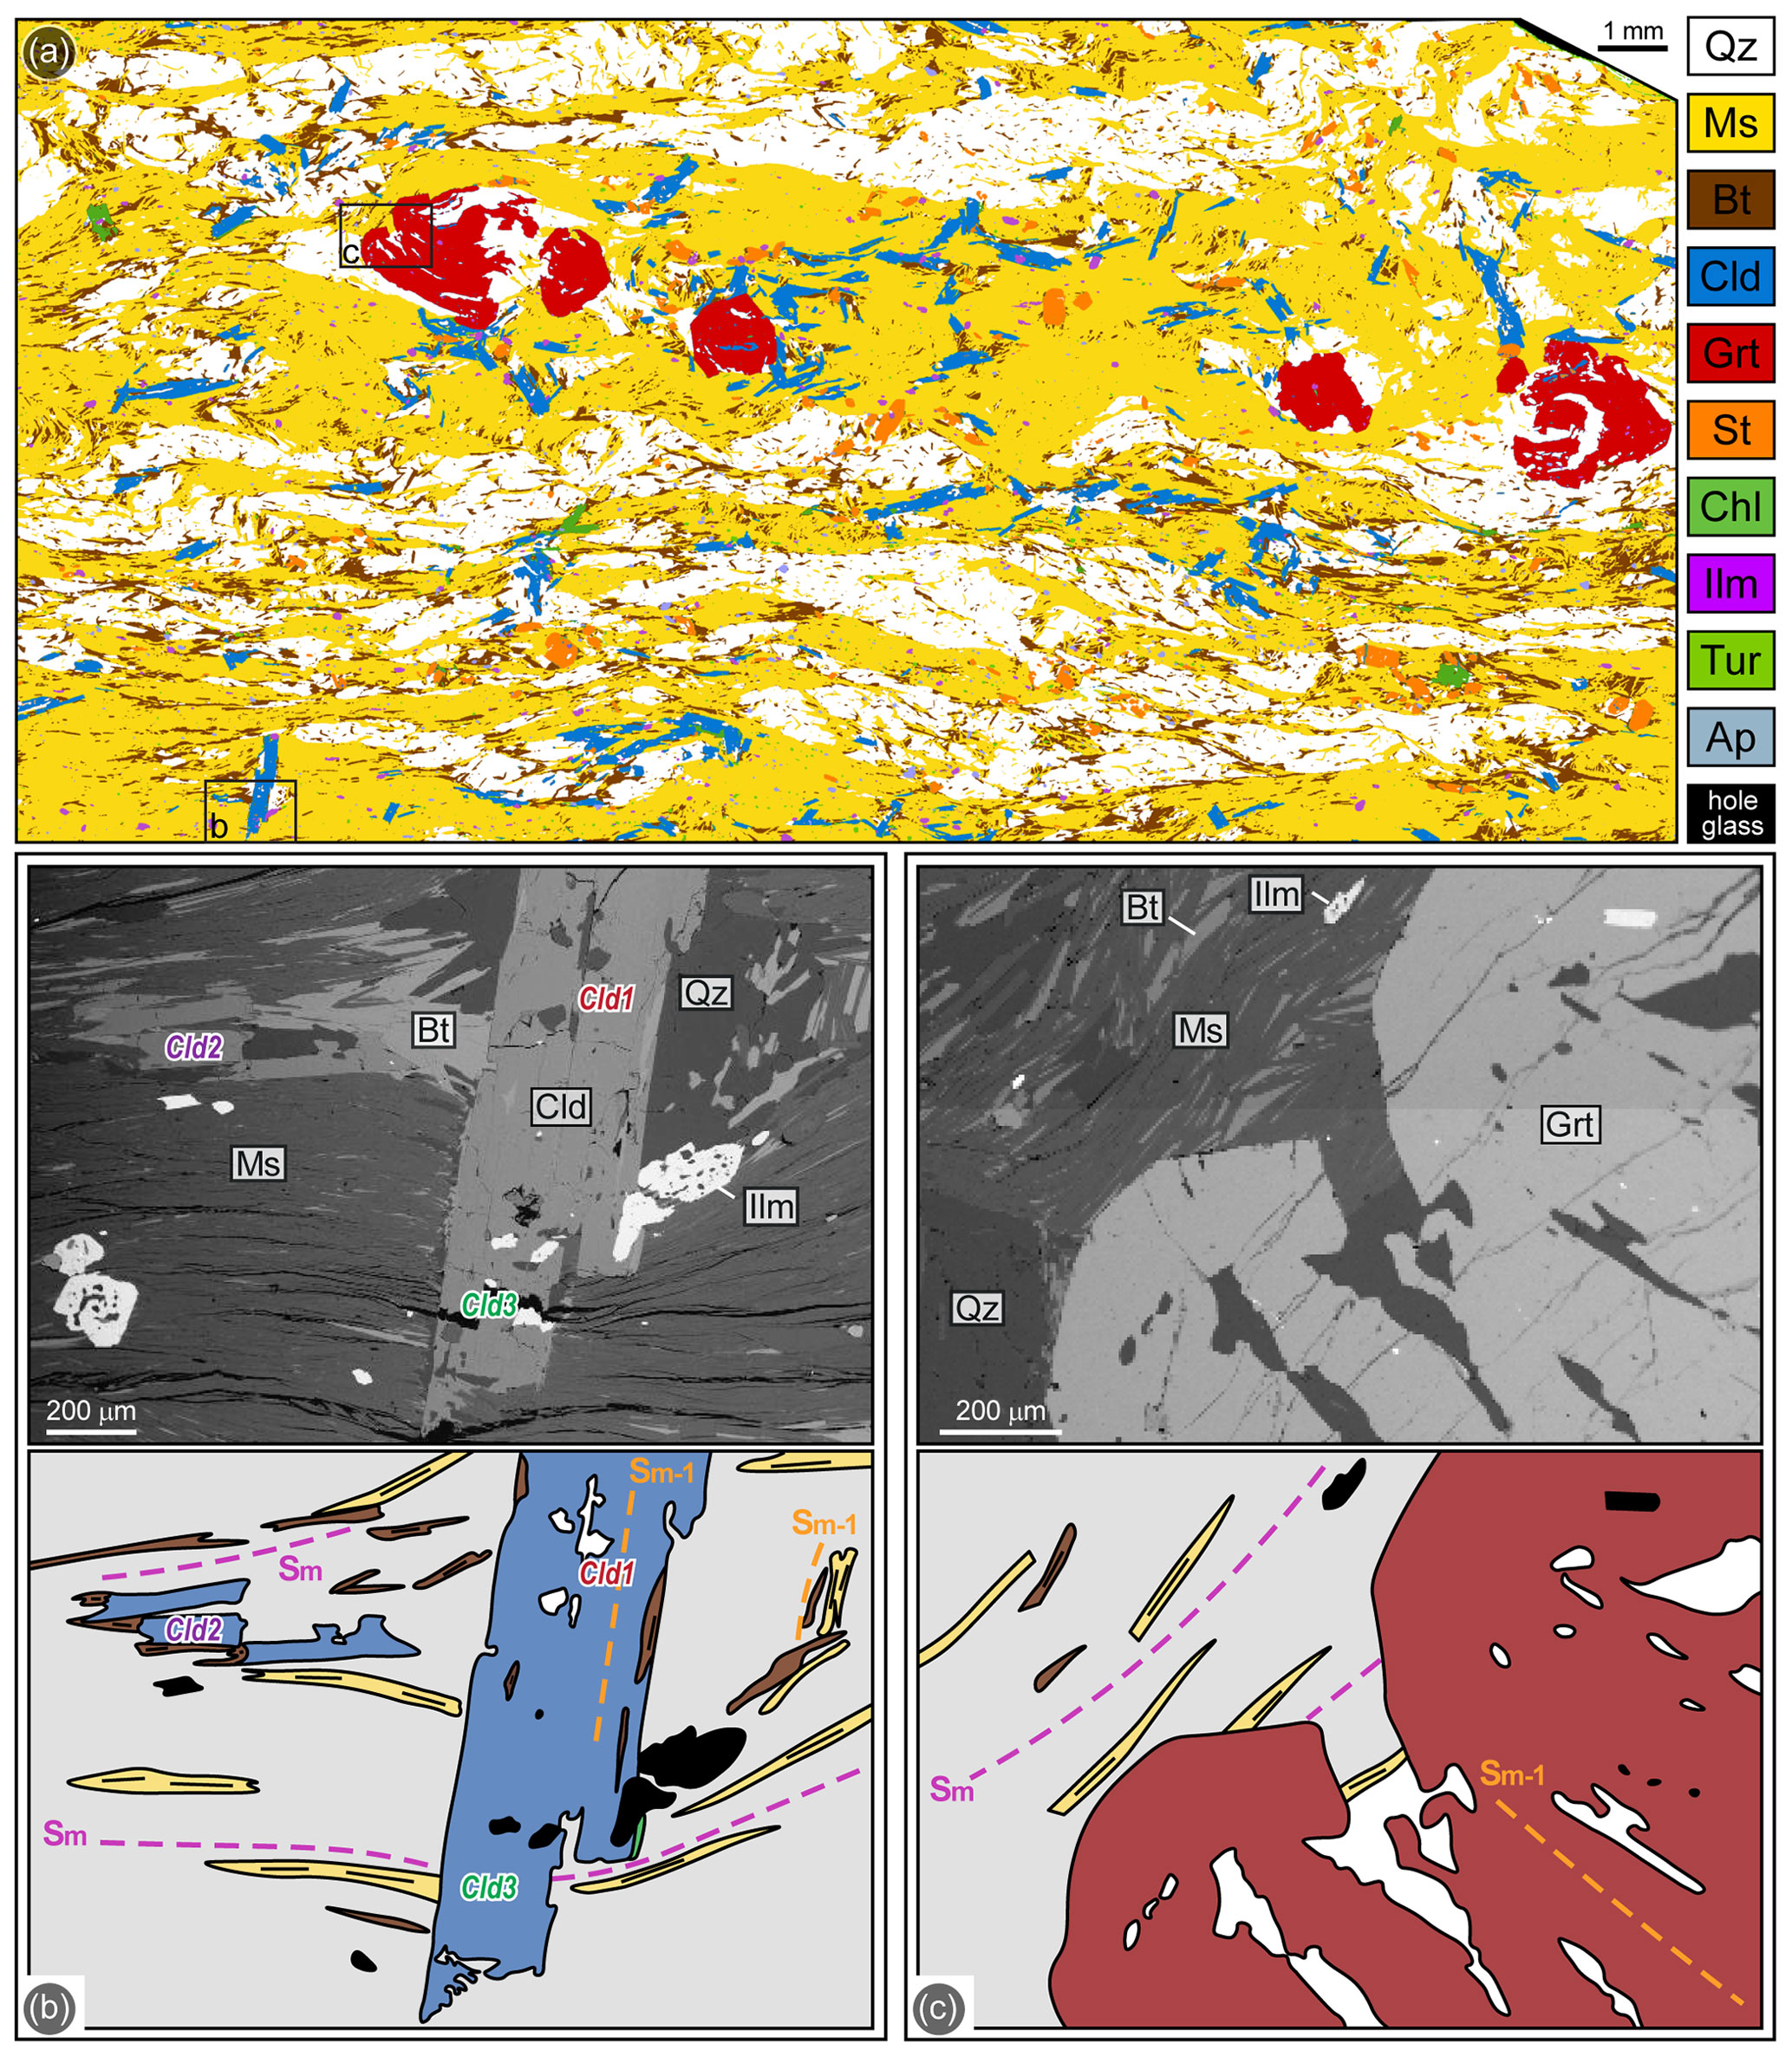
Figure 3(a) Processed high-resolution multispectral map of sample 19a-4. (b) Chloritoid porphyroblasts growing from pre-kinematic (Cld1) to syn-kinematic (Cld2) and post-kinematic (Cld3) with respect to the Sm. The pre-kinematic generation wrapped by the Sm (Cld1) includes the Sm−1, the syn-kinematic generation (Cld2) grows along the main foliation Sm and the post-kinematic generation (Cld3) statically overgrows the Sm. The pre- and syn-kinematic generations are coeval with biotite (BSE image and redrawn sketch of the microphotograph). (c) Garnet porphyroblast showing a pre-kinematic core including the Sm−1 discordant with respect to the Sm, and a post-kinematic rim growing statically on the Sm (BSE image and redrawn sketch of the microphotograph). The grey matrix in the redrawn sketches in panels (b) and (c) mainly consists of muscovite.
4.1 Sample 19a-2a
In sample 19a-2a, the main foliation (Sm) is defined by muscovite and biotite (Fig. 2a). The modal composition is muscovite (44.5 %), quartz (35.5 %), biotite (13 %), staurolite (2.5 %), chloritoid (2 %), chlorite (2 %) and garnet (0.5 %), with ilmenite as the main accessory mineral and few crystals of allanitic epidote, tourmaline, apatite and relict rutile (< 0.5 % in total). Garnet, chloritoid and staurolite occur as porphyroblasts from equal to more than 1 mm in size (Fig. 2a). Chloritoid porphyroblasts are partially wrapped around by the main schistosity (Cld1) and sometimes include an Sm−1 foliation defined by quartz, muscovite, biotite and ilmenite (Fig. 2b). Most chloritoid is, however, aligned with the Sm (Cld2), showing an internal foliation defined by quartz, muscovite, biotite, ilmenite and epidote, which is continuous with the external Sm (Fig. 2b). These relations suggest that chloritoid grew during the development of both the Sm−1 (Cld1) and the Sm (Cld2) (Figs. 2b, 4). Garnet porphyroblasts show the same relations with Sm−1 and Sm foliations as chloritoid (Fig. 2c). Therefore, the whole chloritoid + biotite + garnet assemblage is interpreted as syn-kinematic with respect to both Sm−1 and Sm (Fig. 4). Rutile relicts have been rarely recognized in the core of the ilmenite inclusions within chloritoid. Chlorite is a late phase and is texturally associated with staurolite, both growing statically on the Sm and replacing chloritoid, biotite and garnet (Fig. 2b, c). Rare flakes of muscovite post-kinematic with respect to the Sm are also recognized.

Figure 4Blastesis–deformation relationships for the two studied samples. Biotite, chloritoid and garnet have been highlighted with brown, light blue and red lines, respectively, to emphasize their inferred equilibrium relations. Δ refers to a static episode of blastesis, opposite to the two episodes of blastesis related to the development of Sm and Sm−1.
Muscovite and biotite are homogeneous in composition (Fig. S1), independently from their microstructural position; muscovite has Si = 3.05–3.10 a.p.f.u. (atoms per formula unit) and Al = 2.75–2.83 a.p.f.u.; and biotite has XMg=0.37–0.50, Al = 0.60–0.79 a.p.f.u. and is classified as siderophyllite. Chloritoid is unzoned, with XMg in the range 0.14–0.16 (Fig. 5). Garnet is very slightly zoned (Figs. 5, S2): its XMg increases from the core (XMg=0.081–0.085) to the mantle (XMg=0.084–0.092) and then decreases toward the rim (XMg=0.073–0.081); XCa continuously decreases from the core (XCa=0.052–0.060) through the mantle (XCa=0.050–0.053) to the rim (XCa=0.046–0.048); XMn decreases from the core (XMn=0.031–0.035) to the mantle (XMn=0.024–0.027) and then increases toward the rim (XMn=0.030–0.035). Staurolite has XMg = 0.11–0.14 and its Ti content ranges between 0.00 and 0.06 a.p.f.u. Chlorite is classified as ripidolite and has XMg=0.40–0.41.
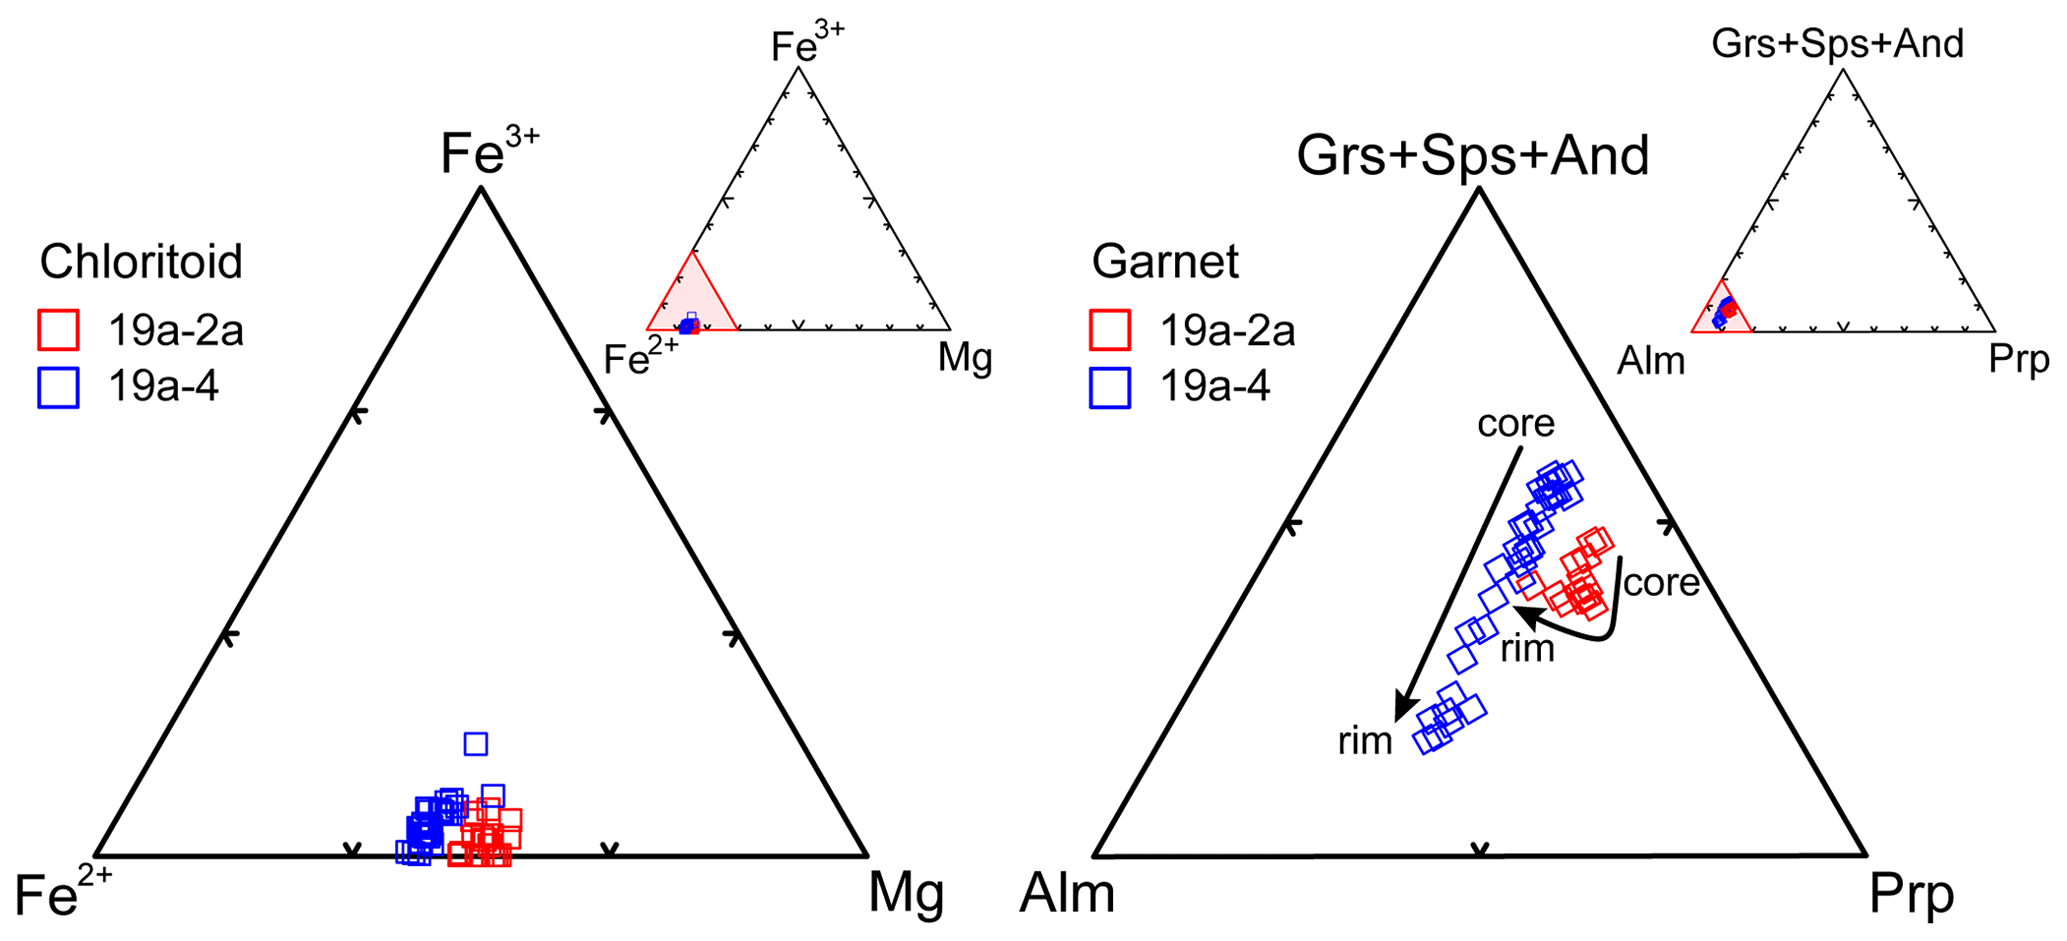
Figure 5Chemical compositions of chloritoid and garnet from both samples plotted in the Fe2+–Mg–Fe3+ and Alm–Prp–(Grs + Sps + And) diagrams, respectively. The black arrows represent the garnet slight zoning from core to rim.
4.2 Sample 19a-4
In sample 19a-4 the main foliation (Sm) is defined by muscovite and biotite (Fig. 3a). The modal composition is muscovite (50 %), quartz (30 %), biotite (10 %), chloritoid (4.5 %), garnet (3 %), staurolite (2 %) and minor chlorite (0.5 %), with ilmenite, tourmaline and apatite as the main accessory minerals and minor allanitic epidote (< 0.5 % in total). Garnet and chloritoid occur as porphyroblasts from pluri-millimetre to millimetre in size, while staurolite porphyroblasts are sub-millimetre in size (Fig. 3a). Chloritoid shows a multi-stadial growth. The first generation of chloritoid (Cld1) is wrapped by the main schistosity and includes quartz, biotite, tourmaline and ilmenite, defining an Sm−1 discordant with respect to the Sm (Fig. 3b). Rare porphyroblasts (Cld2) grew along the Sm (Fig. 3b), and a more abundant chloritoid generation (Cld3) statically overgrows the main foliation, either in continuity with the first generation (Fig. 3b) or as new grains (Fig. 3a). Thus, the growth of chloritoid is interpreted as syn-kinematic with respect to both Sm−1 and Sm foliations, and also as post-kinematic with respect to Sm (Fig. 4). A multi-stadial growth also characterizes garnet porphyroblasts (Fig. 3c): the core includes an internal foliation defined by quartz and ilmenite discordant with respect to the Sm, while the rim statically overgrows the Sm and is, therefore, post-kinematic and coeval with the third generation of chloritoid (Cld3) and with staurolite (Fig. 3a). The static garnet rims also include chloritoid, either previous or contemporaneous to its growth (Fig. 3a). Chlorite is a late phase and is texturally associated with staurolite, Cld3 and garnet rims, all growing statically on the Sm. Therefore, the chloritoid + biotite + garnet assemblage was stable during the development of both Sm−1 (Cld1 + Grt core + Bt) and Sm (Cld2 + Grt mantle + Bt), whereas garnet rims, Cld2, staurolite and chlorite did not grow together with biotite.
Muscovite has an homogeneous composition with Si = 3.05–3.10 and Al = 2.72–2.85 a.p.f.u., save for the post-kinematic flakes, which have Si = 3.00 and Al = 2.40 a.p.f.u. (Fig. S1). Biotite has XMg = 0.30–0.41 and Al = 0.46–0.58 a.p.f.u. (Fig. S1) and can be classified as siderophyllite and annite. The three generations of chloritoid do not differ significantly in composition (Fig. 5); they all have XMg=0.11–0.15. Garnet is slightly zoned (Fig. 5): its XMg increases from core (XMg=0.061–0.069) to rim (XMg=0.066–0.076); XCa and XMn decrease from core (XCa=0.037–0.060; XMn=0.029–0.059) to rim (XCa=0.013–0.025; XMn=0.021–0.034). Staurolite has XMg=0.09–0.13 and Ti = 0.00–0.06 a.p.f.u. Chlorite is classified as ripidolite and has XMg mostly in the range 0.36–0.37.
The forward thermodynamic modelling approach has been applied to both samples using the bulk compositions reported in Table 1. Sample 19a-4 is richer in Fe than sample 19a-2a, with XMg=0.26, X(Fe2O3)=0.08 and XMg=0.38, X(Fe2O3) =0.07, respectively.
5.1 Influence of pressure and temperature on the stability of chloritoid + biotite assemblage
The P–T isochemical phase diagrams calculated with excess fluid as pure H2O for samples 19a-2a and 19a-4 show very similar topologies, dominated by four- and five-variant fields, with minor two-, three- and six-variant fields (Fig. 6a, b). The same phase diagram and relative compositional isopleths calculated with ds62 for sample 19a-2a are reported in the Supplement (Fig. S3a, b). The chloritoid-out and biotite-in boundaries have a steep dP dT slope, with biotite mostly appearing at higher T with respect to chloritoid disappearance. The modelled compositional isopleths of garnet (XMg, XCa, XMn) corresponding to its measured composition (Fig. 6c, d) constrain its growth at T=550–570 ∘C in both samples, whereas chloritoid isopleths (XMg) indicate slightly lower temperatures. At these conditions, garnet and chloritoid are predicted to occur in equilibrium with chlorite but not with biotite. A narrow (i.e. extending over a T interval smaller than 20 ∘C) tri-variant chloritoid + biotite + garnet-bearing field is apparently modelled for sample 19a-4 (Fig. 6b) only at P<8 kbar; however, narrow fields in phase diagrams are generally not robust, which makes this prediction quite uncertain. Moreover, P<8 kbar is lower than that inferred for the prograde evolution of the Upper-LHS (e.g. Goscombe et al., 2018; Tamang et al., 2023), thus implying that the calculated P–T isochemical phase diagrams fail in predicting the coexistence of chloritoid + biotite + garnet for both of the samples.

Figure 6P–T isochemical phase diagrams modelled for (a) sample 19a-2a and (b) sample 19a-4, using the bulk compositions reported in Table 1. The chloritoid-out and the biotite-in reaction curves are highlighted in light blue and brown, respectively. The dashed white line indicates the thermobaric gradient used in the following phase diagrams. Compositional isopleths for chloritoid and garnet have been plotted for (c) sample 19a-2a and (d) sample 19a-4.
5.2 Influence of fluid composition and oxidation state on the stability of chloritoid + biotite assemblage
To test whether the fluid composition can influence the stability of the considered assemblage, P/T–aH2O phase diagrams have been calculated along a thermobaric gradient consistent with the prograde evolution of the Upper-LHS. The obtained phase diagrams (Figs. 7a, S4a) show that, with decreasing aH2O due to the presence of CO2, i.e. with increasing XCO2 in the fluid, chloritoid and biotite are stable at slightly lower temperatures. However, the chloritoid-out and the biotite-in boundaries do not intersect, and at aH2O ∼ 0.80–0.85 they further diverge, making their coexistence even less probable. The P/T–aH2O phase diagram calculated with ds62 for sample 19a-2a is reported in the Supplement (Fig. S3c).
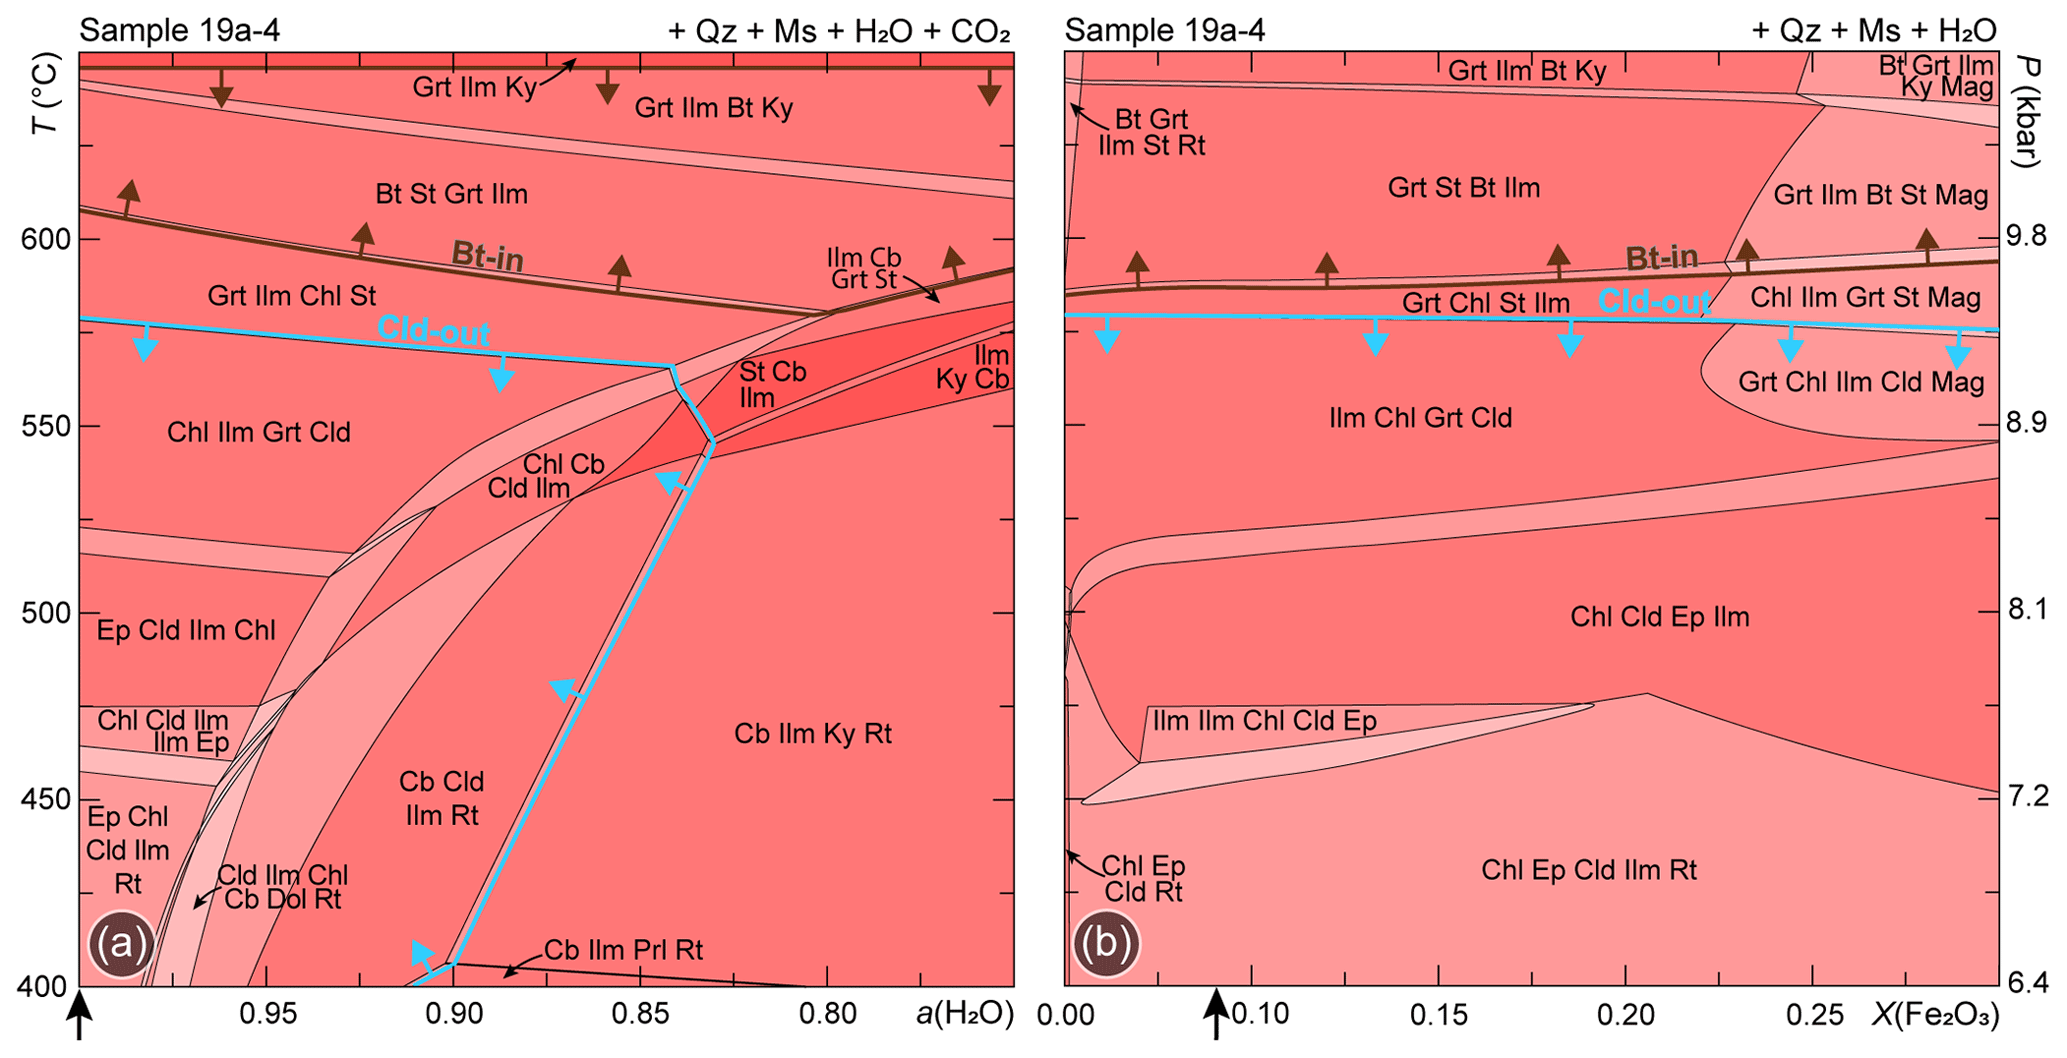
Figure 7(a) P/T–aH2O and (b) P/T–X(Fe2O3) phase diagrams modelled for sample 19a-4, along the thermobaric gradient reported in Fig. 1c. The chloritoid-out and the biotite-in reaction curves are highlighted in light blue and brown, respectively. The black arrows indicate the aH2O and X(Fe2O3) conditions at which the P–T isochemical phase diagrams have been calculated. See Fig. S4 for the same phase diagrams calculated for sample 19a-2a.
P/T–X(Fe2O3) phase diagrams have been calculated along the same thermobaric gradient to check the influence of the oxidation state of the system on the stability of the chloritoid + biotite assemblage. The obtained results (Figs. 7b, S4b) show that, with increasing X(Fe2O3), which indirectly increases the bulk rock XMg, the chloritoid-out and the biotite-in curves tend to diverge slightly. Therefore, they never intersect in the investigated P–T–X field of interest. The P/T–X(Fe2O3) phase diagram calculated with ds62 for sample 19a-2a is reported in the Supplement (Fig. S3d). These results demonstrate that both the presence of a CO2-bearing fluid and the oxidation state of the system play a negligible role in controlling the stability of the observed assemblage.
5.3 Influence of H2O content on the stability of the chloritoid + biotite assemblage
P/T–M(H2O) phase diagrams have been calculated to investigate the influence of different degrees of H2O saturation, i.e. of the available H2O content within the rock, on the stability of the studied assemblage. The H2O content in the bulk compositions was fixed in the interval M(H2O) = 5.00 mol %–20.00 mol %, which allows modelling of both H2O-undersaturated and H2O-saturated conditions in the P–T range of interest. The same phase diagram and relative compositional isopleth calculated with ds62 for sample 19a-2a are reported in the Supplement (Fig. S3e, f). The shape of the H2O saturation boundary is similar in both calculated phase diagrams (Figs. 8, S5); the amount of H2O necessary to saturate the system decreases at increasing P–T conditions, from ∼ 16 mol % at 400 ∘C to ∼ 9 mol % at 700 ∘C, consistent with dehydration during prograde metamorphism. The chloritoid-out and the biotite-in curves behave differently in the H2O-saturated and H2O-undersaturated fields (Fig. 8a): (i) at H2O-saturated conditions, chloritoid is predicted to disappear at lower temperatures than the appearance of biotite, consistently with the results of the P–T isochemical phase diagrams calculated with H2O in excess (Fig. 6); (ii) at H2O-undersaturated conditions, i.e. with H2O content not sufficient to form a free-fluid phase, the chloritoid-out and the biotite-in boundaries intersect, so that numerous fields containing both chloritoid and biotite are predicted to occur in the P–T range of interest. These fields are constrained in the interval M(H2O) = 8.5 mol %–14.5 mol % for sample 19a-2a (Fig. S5a) and M(H2O) = 10.5 mol %–15.5 mol % for sample 19a-4 (Fig. 8a), at T<560–570 ∘C.
Compositional isopleths have been calculated for the main phases to further constrain P/T–M(H2O) conditions of their growth (Fig. 8b). Garnet, chloritoid and biotite isopleths corresponding to their measured compositions systematically converge at H2O-undersaturated conditions. For sample 19a-2a (Fig. S5b), these isopleths converge in the biotite + chlorite + chloritoid + garnet + ilmenite field assemblage, modelled at M(H2O) = 13.0–14.5 mol % and T=500–550 ∘C. For sample 19a-4 (Fig. 8b), the same isopleths intersect in the same field, tightly constraining M(H2O) at 14.5–15.0 mol %, and T= 520–540 ∘C.
6.1 The equilibrium perspective
The detailed petrographic and microstructural analysis performed on the studied samples from the Upper-LHS highlights the coexistence of chloritoid, biotite and garnet during the development of both the Sm−1 and the Sm. In the framework of the equilibrium paradigm, the thermodynamic modelling approach, based on the principles of equilibrium thermodynamics, was used to investigate the role played by intensive and extensive parameters in controlling the stability of the chloritoid + biotite assemblage. The modelled P–T isochemical phase diagrams calculated assuming that a pure H2O fluid was present in excess predict biotite stability at higher temperatures than the chloritoid breakdown. The only exception is for sample 19a-4 at P<8 kbar, which is, however, possibly not meaningful and, in any case, not consistent with (i.e. lower than) the P conditions inferred for the prograde evolution of the Upper-LHS (e.g. Goscombe et al., 2018; Tamang et al., 2023). Thus, the modelled phase diagram topologies and the slope (dP dT) of the chloritoid-out and biotite-in curves predict the possible coexistence of chloritoid + biotite in low-pressure regional Barrovian or contact metamorphic settings (e.g. Wang and Spear, 1991; Droop and Harte, 1995; Saki et al., 2021) but fail in explaining the occurrence of this assemblage at higher-pressure conditions. The possible influence of bulk rock (i.e. oxidation state) and fluid (XCO2) compositional parameters on the stability of the chloritoid + biotite assemblage was tested through the calculation of P/T–aH2O and P/T–XFe2O3 phase diagrams (see also Forshaw and Pattison, 2021, for a discussion on the role of Fe3+ in metapelites). The obtained results show that neither the presence of CO2 in the fluid nor a more oxidated state of the system favours the stability of this mineral assemblage, predicting instead the divergence of the chloritoid-out and biotite-in curves. These results question the initial assumption of excess fluid conditions and suggest the need to investigate the role of H2O content (i.e. the degree of H2O saturation, M(H2O) in mol %) in favouring the coexistence of chloritoid + biotite in medium-pressure amphibolite-facies metapelites. The modelled P/T–M(H2O) pseudosections show that H2O-undersaturated conditions, i.e. a H2O content in the system not sufficient to form a free-fluid phase, enhance the biotite stability toward lower temperatures, allowing the prediction of chloritoid + biotite + garnet stability fields along the prograde Upper-LHS thermobaric gradient. Additional constraints are given by the compositional isopleths modelled for the three phases, which systematically converge at slightly H2O-undersaturated conditions (Fig. 8b).
So far, the influence of the degree of H2O content on the stability of specific mineral assemblages has been mostly investigated for ortho-derived, mafic or polymetamorphic rocks (e.g. Guiraud et al., 2001; Powell et al., 2005; Banerjee et al., 2019; Ceccato et al., 2020, 2021; Tursi et al., 2021). Low- to medium-grade metapelites have been, instead, generally treated as dominated by H2O-saturated conditions, because aqueous fluids are generally produced through prograde dehydration reactions (Thompson, 1983). However, the pioneering works of Fyfe et al. (1978) and Thompson (1983) first suggested the possibility that fluid may not saturate the grain boundaries even at middle crustal conditions. Once a specific threshold is reached, the H2O released by prograde dehydration reactions may escape from the system, preventing the persistence of a free-fluid phase saturating the grain boundaries (i.e. fluid-absent metamorphism as opposed to fluid-present metamorphism characterized by grain boundary saturation; Thompson, 1983). Thompson (1983) also argued that if the volatile release rate is slow, the fluid components may escape by diffusion, thus not saturating the grain boundaries (Walther and Orville, 1982). On the contrary, if the volatile release rate is fast, fluid saturation may occur, but because of the reaction-enhanced permeability (Fyfe et al., 1978; Ceccato et al., 2021), the fluid phase can easily escape from the system. The actual rate of volatile production may proceed unevenly (Pattison and Tinkham, 2009; Pattison et al., 2011), causing a possible alternation of fluid-present and fluid-absent metamorphism (Thompson, 1983). This could be the case for the studied metapelites, because it is unlikely that H2O-undersaturated conditions were attained during the whole prograde metamorphic evolution. It is worth noting that the studied samples have been collected from the Upper-LHS, i.e. from the lower part of the Main Central Thrust Zone, an orogen-scale, high-strain shear zone that can be followed along the entire length of the Himalayan belt. The development of ductile shear zones may be enhanced by the presence of fluids but may also redistribute fluids, allowing the attainment of transient H2O-saturated and H2O-undersaturated conditions thanks to deformation-driven fluid channelling (e.g. Thompson, 1983; Connolly, 1997; Getsinger et al., 2013; Tursi et al., 2021; Tursi, 2022).
6.2 The kinetics perspective
The presence or absence of a free-fluid phase in a metamorphic system has important implications for the reaction kinetics (Ridley and Thompson, 1986; Rubie, 1986, 1998; Waters and Lovegrove, 2002; Pattison and Tinkham, 2009), because the presence of fluid lowers the kinetic barriers to nucleation and growth and therefore the degree of thermal overstepping of mineral reactions. The extent of thermal overstepping for a specific reaction is related to the reaction affinity A (i.e. the Gibbs free-energy difference between the thermodynamically stable, but not-yet-crystallized, products and the metastable reactants; Pattison and Tinkham, 2009), according to the relation (Pattison et al., 2011; Spear and Pattison, 2017), where ΔT is the overstep in temperature and ΔS is the entropy difference between the products and the reactants. Mineral reactions that release significant quantities of H2O have a higher reaction affinity than those that release small amounts of H2O (Pattison and Tinkham, 2009; Pattison et al., 2011). Consequently, a larger thermal overstepping is expected for reactions which release little or no H2O, compared to those that produce large H2O amounts.
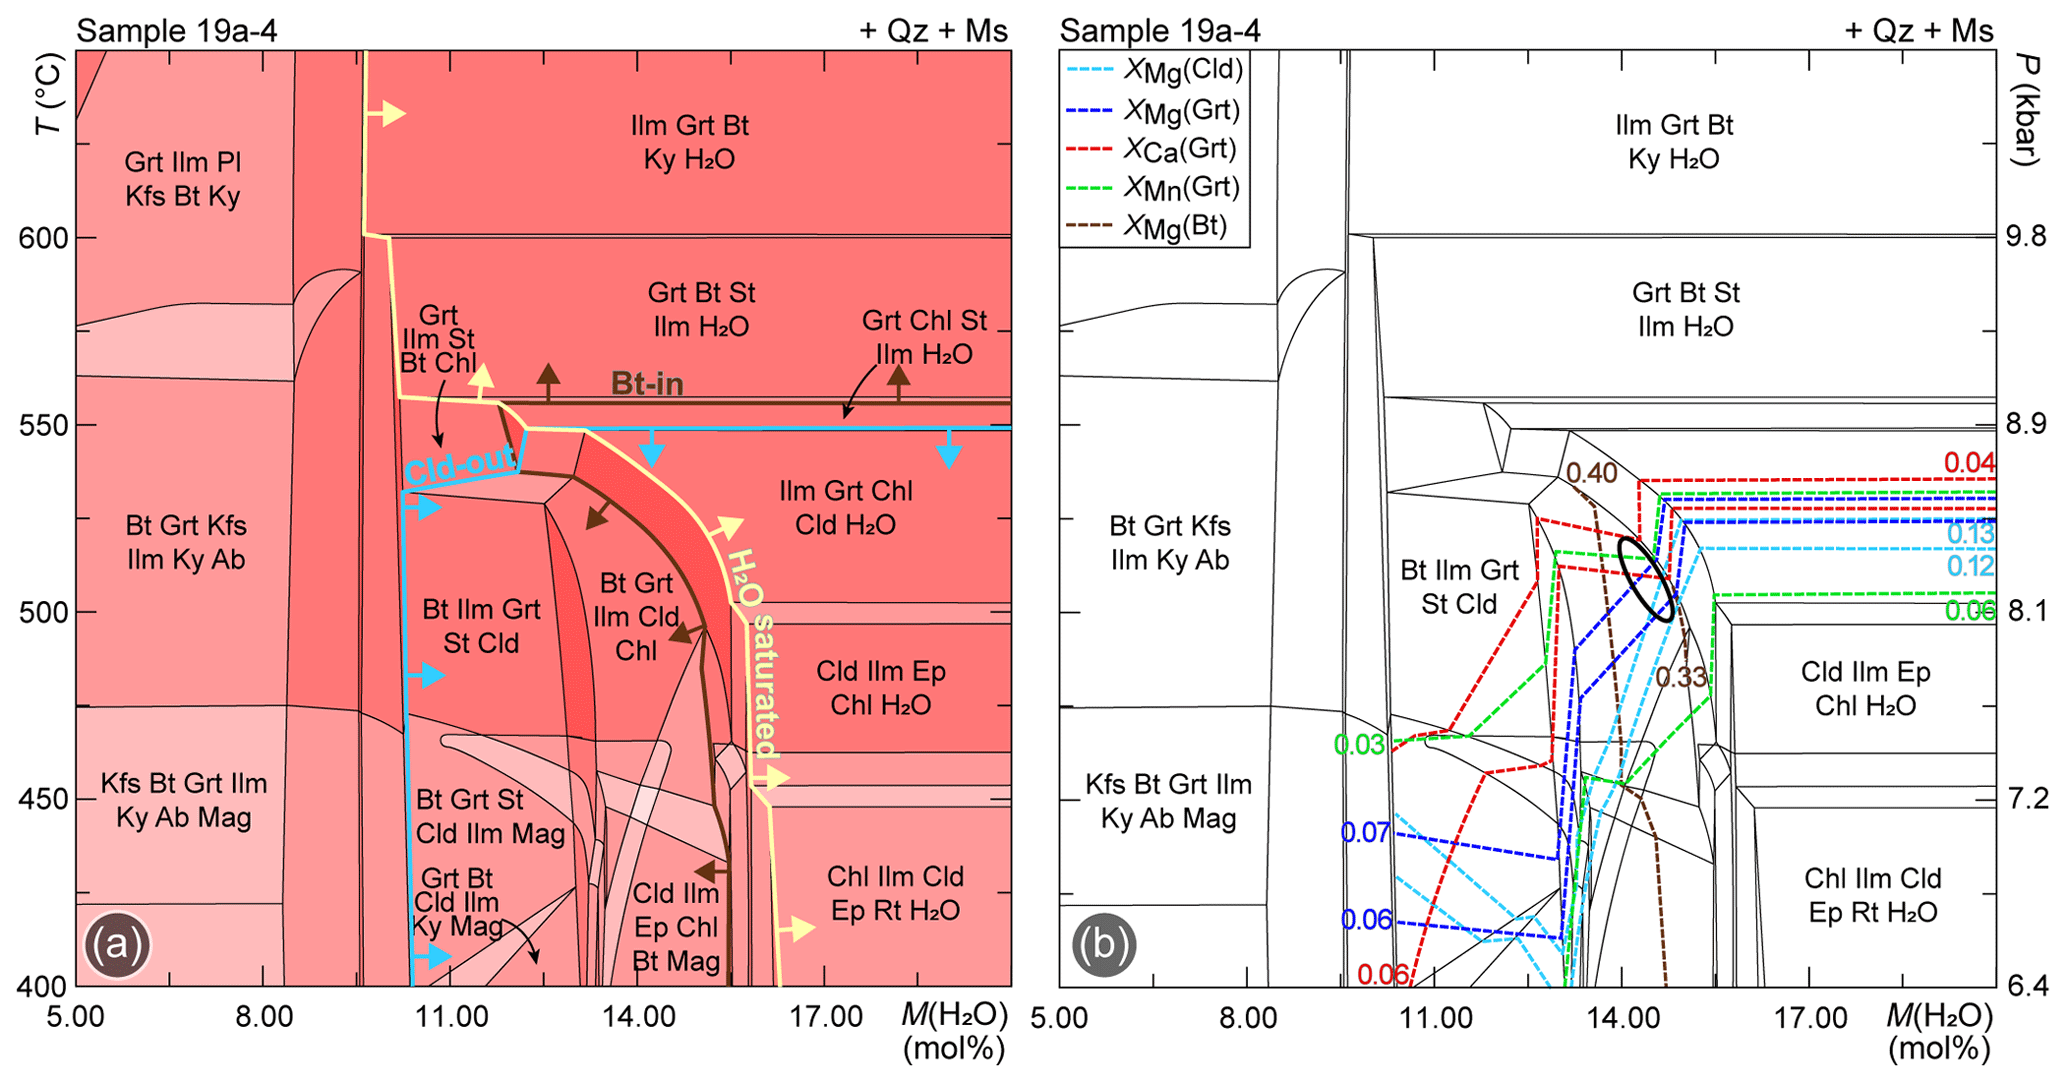
Figure 8(a) P/T–M(H2O) phase diagram modelled for sample 19a-4, along the thermobaric gradient reported in Fig. 1c. The chloritoid-out and the biotite-in reaction curves are highlighted in light blue and brown, respectively. The yellow line separates H2O-saturated from H2O-undersaturated conditions. (b) Compositional isopleths for chloritoid, garnet and biotite plotted for sample 19a-4. The black ellipse shows the constrained conditions based on the intersection of compositional isopleths. See Fig. S5 for sample 19a-2a.
To test the possible role of kinetics for the coexistence of chloritoid + biotite, we have calculated the reaction affinity for the two reactions relevant to the discussion: (i) the chloritoid-consuming reaction (i.e. Cld-out and St-in) and (ii) the biotite-producing reaction (i.e. Chl-out and Bt-in), following the approach of Waters and Lovegrove (2002). This approach estimates the reaction affinity using simplified end-member reaction entropies, normalized per mole of oxygen in the product phase. The Cld-out and Bt-in reactions have been stoichiometrically balanced using a least-square method (freeware application available on demand; Godard, 2009) as follows:
Thus, the chloritoid-consuming and the biotite-forming reactions both produce staurolite as the main product porphyroblast. The entropy changes (ΔS) of the reactions have been calculated at 9.4 kbar and 575 ∘C using the thermodynamic data of Holland and Powell (1998) and averaging the values for the Fe and Mg end-member reactions. Reaction affinity vs. temperature for the two reactions at 9.4 kbar is illustrated in Fig. 9. Assuming A = 400 J per mole of oxygen in product porphyroblasts as the energy barrier to nucleation and growth for staurolite (Waters and Lovegrove, 2002), we identify a larger degree of overstepping for the chloritoid-consuming, staurolite-forming Reaction (1) (ΔT ∼ 70 ∘C) than for the chlorite-consuming, biotite-forming Reaction (2) (ΔT ∼ 30 ∘C) (Fig. 9). The larger thermal overstepping for Reaction (1) is explained by the low amount of released H2O when compared to Reaction (2). This would result in the appearance of biotite at temperatures about 40 ∘C lower than the breakdown of chloritoid, allowing the formation of the chloritoid + biotite (+ garnet) assemblage at ∼ 615 ∘C (i.e. at temperatures slightly higher than those predicted by the thermodynamic modelling approach).
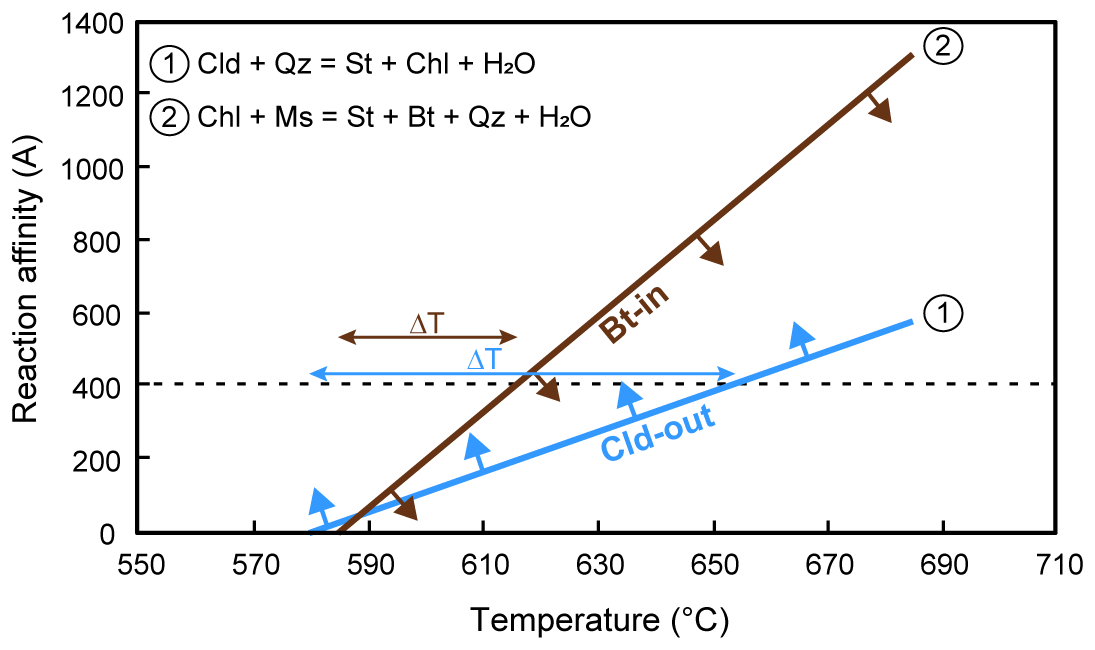
Figure 9Reaction affinity vs. temperature (A−T) for the chloritoid-consuming and the biotite-forming reactions, calculated per mole of oxygen in the product porphyroblasts (staurolite).
In this paper, our detailed microstructural, petrographic and forward modelling study on two metapelites characterized by the uncommon chloritoid + biotite + garnet assemblage supports the following conclusions.
-
Most of the intensive (P, T) and extensive (fluid composition, oxidation state of the system) tested parameters have little to no influence on the formation of the chloritoid + biotite + garnet assemblage.
-
Slightly H2O-undersaturated conditions favour the coexistence of chloritoid + biotite (+ garnet), mainly influencing the position of the biotite-in reaction and its overall stability. This suggests the possibility that the studied metapelites can have attained transient H2O-saturated and H2O-undersaturated conditions during prograde metamorphism, possibly induced by deformation-driven fluid channelling during ductile shearing within the MCTZ.
-
Kinetic factors can also control the coexistence of chloritoid + biotite. The chloritoid-consuming reaction has a lower reaction affinity and therefore a larger thermal overstepping and a sluggish consumption of chloritoid porphyroblasts compared to the biotite-producing reaction.
-
Both equilibrium- and kinetics-related factors likely play a role in controlling the stability of the chloritoid + biotite (+ garnet) assemblage, being the efficiency of reaction kinetics intrinsically linked to the degree of fluid availability.
The authors declare that all data supporting the findings of this study are available within the article and the Supplement. The thermodynamic database and solution models used for thermodynamic modelling are available on the Perple_X website (https://www.perplex.ethz.ch/, Connolly, 1990, 2009).
The Supplement includes the following tables and figures.
-
Table S1: Excel spreadsheets reporting the conversion from mineral modes (vol %) to mole percent (mol %) of each phase and ultimately to mol % of each oxide component.
-
Table S2: Excel spreadsheets reporting the whole dataset of compositional data acquired for the main phases of sample 19a-2a.
-
Table S3: Excel spreadsheets reporting the whole dataset of compositional data acquired for the main phases of sample 19a-4.
-
Figure S1: compositional diagrams for white mica, biotite and chlorite.
-
Figure S2: garnet compositional profiles and compositional diagrams for staurolite and ilmenite.
-
Figure S3: phase diagrams calculated with the ds62 database for sample 19a-2a. (a) P–T isochemical phase diagram and (b) relative compositional isopleths; (c) P/T–aH2O and (d) P/T–X(Fe2O3) phase diagrams; (e) P/T–M(H2O) phase diagram and (f) relative compositional isopleths.
-
Figure S4: (a) P/T–aH2O and (b) P/T–X(Fe2O3) phase diagrams modelled for sample 19a-2a.
-
Figure S5: P/T–M(H2O) phase diagram modelled for sample 19a-2a.
The supplement related to this article is available online at: https://doi.org/10.5194/ejm-35-305-2023-supplement.
All authors jointly conceived the study. CG and FR collected the samples. SN performed the thermodynamic modelling and interpreted the results in the framework of her MSc thesis under the supervision of CG. All authors discussed the results from a kinetic perspective. All authors participated in writing the paper.
At least one of the (co-)authors is a member of the editorial board of European Journal of Mineralogy. The peer-review process was guided by an independent editor, and the authors also have no other competing interests to declare.
Publisher’s note: Copernicus Publications remains neutral with regard to jurisdictional claims in published maps and institutional affiliations.
We are thankful to David Pattison and an anonymous reviewer for their thorough reviews, which significantly improved the initial version of the manuscript, and to the editor Riccardo Tribuzio and chief editor Elisabetta Rampone for editorial handling.
The studied samples were collected during a field campaign in eastern Nepal, which was funded by the Italian Ministry of University and Research (MIUR) (Ricerca di Base funds: ROLF_FFABR_17_01 and GROC_FFABR_17_01). Laboratory work was funded by the MIUR (PRIN2017, project no. 2017LMNLAW) and by the University of Turin (Ricerca Locale, ex-60 % 2020 funds: GROC_RILO_21_01).
This paper was edited by Riccardo Tribuzio and reviewed by David Pattison and one anonymous referee.
Ahn, K. S. and Nakamura, Y.: The natural reaction muscovite + chlorite + chloritoid = andalusite + biotite + quartz + H2O and a new petrogenetic grid, Geosci. J., 4, 25–39, https://doi.org/10.1007/BF02910211, 2000.
Baltatzis, E.: Distribution of Fe and Mg between garnet and biotite in Scottish Barrovian metamorphic zones, Mineral. Mag., 43, 155–157, https://doi.org/10.1180/minmag.1979.043.325.16, 1979.
Baltatzis, E. and Wood, B. J.: The occurrence of paragonite in chloritoid schists from Stonehaven, Scotland, Mineral. Mag., 41, 211–216, https://doi.org/10.1180/minmag.1977.041.318.08, 1977.
Banerjee, M., Dutta, U., Anand, R., and Atlas, Z. D.: Insights on the process of two-stage coronae formation at olivine-plagioclase contact in mafic dyke from Palghat Cauvery Shear Zone, southern India, Mineral. Petrol., 113, 625–649, https://doi.org/10.1007/s00710-019-00674-y, 2019.
Bickle, M. J. and Archibald, N. J.: Chloritoid and staurolite stability: implications for metamorphism in the Archaean Yilgarn Block, western Australia, J. Metamorph. Geol., 2, 179–203, https://doi.org/10.1111/j.1525-1314.1984.tb00295.x, 1984.
Bushmin, S. and Glebovitsky, V. A.: Scheme of Mineral Facies of Metamorphic Rocks, Geol. Ore Deposits, 50, 659–669, https://doi.org/10.1134/S1075701508080011, 2008.
Carr, M. and Gazel, E.: Igpet software for modeling igneous processes: examples of application using the open educational version, Mineral. Petrol., 111, 283–289, https://doi.org/10.1007/s00710-016-0473-z, 2016.
Ceccato, A., Goncalves, P., and Pennacchioni, G.: Temperature, fluid content and rheology of localized ductile shear zones in subsolidus cooling plutons, J. Metamorph. Geol., 38, 881–903, https://doi.org/10.1111/jmg.12553, 2020.
Ceccato, A., Viola, G., Tartaglia, G., and Antonellini, M.: In–situ quantification of mechanical and permeability properties on outcrop analogues of offshore fractured and weathered crystalline basement: Examples from the Rolvsnes granodiorite, Bømlo, Norway, Mar. Pet. Geol., 124, 104859, https://doi.org/10.1016/j.marpetgeo.2020.104859, 2021.
Coggon, R. and Holland, T. J. B.: Mixing properties of phengitic micas and revised garnet–phengite thermobarometers, J. Metamorph. Geol., 20, 683–696, https://doi.org/10.1046/j.1525-1314.2002.00395.x, 2002.
Connolly, J. A. D.: Multivariate phase diagrams: An algorithm based on generalized thermodynamics, Am. J. Sci., 290, 666–718, https://doi.org/10.2475/ajs.290.6.666, 1990.
Connolly, J. A. D.: Devolatilization-generated fluid pressure and deformation-propagated fluid flow during prograde regional metamorphism, J. Geophys. Res.-Earth, 102, 18149–18173, https://doi.org/10.1029/97jb00731, 1997.
Connolly, J. A. D.: The geodynamic equation of state: what and how, Geochem. Geophy. Geosy., 10, Q10014, https://doi.org/10.1029/2009GC002540, 2009.
DeCelles, P. G., Gehrels, G. E., Quade, J., Lareau, B., and Spurlin, M.: Tectonic implications of U-Pb zircon ages of the Himalayan Orogenic Belt in Nepal, Science, 288, 497–499, https://doi.org/10.1126/science.288.5465.497, 2000.
DeCelles, P. G., Robinson, D. M., Quade, J., Ojha, T. P., Garzione, C. N., Copeland, P., and Upreti, B. N.: Stratigraphy, structure, and tectonic evolution of the Himalayan fold-thrust belt in western Nepal, Tectonics, 20, 487–509, https://doi.org/10.1029/2000TC001226, 2001.
Dhital, M. R.: Geology of the Nepal Himalaya: Regional Perspective of the Classic Collided Orogen, Springer, 498 pp., ISBN 978-3-319-02495-0, https://doi.org/10.1007/978-3-319-02496-7, 2015.
Droop, G. T. R. and Harte, B.: The effect of Mn on the phase relations of medium grade pelites: constraints from natural assemblages on petrogenetic grid topology, J. Petrol., 36, 1549–1578, https://doi.org/10.1093/oxfordjournals.petrology.a037265, 1995.
Fyfe, W. S., Price, N. J., and Thompson, A. B.: Fluids in the Earth's Crust: their significance in metamorphic, tectonic, and chemical transport processes, Elsevier Scientific Pub., 372 pp., ISBN 0444416366, 1978.
Forshaw, J. B. and Pattison, D. R. M.: Ferrous/Ferric (Fe2+/Fe3+) partitioning among silicates in metasedimentary rocks, Contrib. Mineral. Petrol., 176, 63, https://doi.org/10.1007/s00410-021-01814-4, 2021.
Fuhrman, M. L. and Lindsley, D. H.: Ternary-Feldspar Modeling and Thermometry, Am. Mineral., 73, 201–215, 1988.
Gansser, A.: Geology of the Himalayas, Interscience Publishers, London, 289 pp., ISBN 0835798984, 1964.
Getsinger, A. J., Hirth, G., Stünitz, H., and Goergen, E. T.: Influence of water on rheology and strain localization in the lower continental crust, Geochem. Geophy. Geosy., 14, 2247–2264, https://doi.org/10.1002/ggge.20148, 2013.
Godard, G.: Two orogenic cycles in eclogite-facies gneisses of the Southern Armorican Massif (France), Eur. J. Mineral., 21, 1173–1190, https://doi.org/10.1127/0935-1221/2009/0021-1984, 2009.
Goscombe, B., Gray, D., and Hand, M.: Crustal architecture of the Himalayan metamorphic front in eastern Nepal, Gondwana Res., 10, 232–255, https://doi.org/10.1016/j.gr.2006.05.003, 2006.
Goscombe, B., Gray, D., and Foster, D. A.: Metamorphic response to collision in the Central Himalayan Orogen, Gondwana Res., 57, 191–265, https://doi.org/10.1016/j.gr.2018.02.002, 2018.
Groppo, C., Rolfo, F., and Lombardo, B.: P-T evolution across the Main Central Thrust Zone (Eastern Nepal): hidden discontinuities revealed by petrology, J. Petrol., 50, 1149–1180, https://doi.org/10.1093/petrology/egp036, 2009.
Groppo, C., Rubatto, D., Rolfo, F., and Lombardo B.: Early Oligocene partial melting in the Main Central Thrust Zone (Arun valley, eastern Nepal Himalaya), Lithos, 118, 287–301, https://doi.org/10.1016/J.LITHOS.2010.05.003, 2010.
Groppo, C., Rolfo, F., Tamang, S., and Mosca, P.: Lithostratigraphy, Petrography and Metamorphism of the Lesser Himalayan Sequence, in: Himalaya, Dynamics of a Giant, edited by: Cattin, R. and Epard, J. L., 2, ISTE Ltd., in press, 2023.
Guiraud, M., Powell, R., and Rebay, G.: H2O in metamorphism and unexpected behaviour in the preservation of metamorphic assemblages, J. Metamorph. Geol., 19, 445–454, https://doi.org/10.1046/j.0263-4929.2001.00320.x, 2001.
Heim, A. and Gansser, A.: Central Himalaya. Geologic Observations of the Swiss Expedition, Hindustan Publishing, 1939.
Hiroi, Y.: Progressive metamorphism of the Unazuki pelitic schists in the Hida terrane, central Japan, Contrib. Mineral. Petrol., 82, 334–350, https://doi.org/10.1007/BF00399711, 1983.
Hodges, K.: Tectonics of the Himalaya and southern Tibet from two perspectives, Geol. Soc. Am. Bull., 112, 324–350, https://doi.org/10.1130/0016-7606(2000)112<324:TOTHAS>2.0.CO;2, 2000.
Holland, T. J. B. and Powell, R.: An internally-consistent thermodynamic dataset for phases of petrological interest, J. Metamorph. Geol., 16, 309–344, https://doi.org/10.1111/j.1525-1314.1998.00140.x, 1998.
Holland, T., Baker, J., and Powell, R.: Mixing properties and activity-composition relationships of chlorites in the system MgO-FeO-Al2O3-SiO2-H2O, Eur. J. Mineral., 10, 395–406, https://doi.org/10.1127/ejm/10/3/0395, 1998.
Holland, T. J. B. and Powell, R.: An improved and extended internally consistent thermodynamic dataset for phases of petrological interest, involving a new equation of state for solids, J. Metamorph. Geol., 29, 333–383, https://doi.org/10.1111/j.1525-1314.2010.00923.x, 2011.
Hoschek, G.: The stability of staurolite and chloritoid and their significance in metamorphism of pelitic rocks, Contrib. Mineral. Petrol., 22, 208–232, https://doi.org/10.1007/BF00387954, 1969.
Kohn, M. J.: Himalayan metamorphism and its tectonic implications, Annu. Rev. Earth Pl. Sc. Lett., 42, 381–419, https://doi.org/10.1146/annurev-earth-060313-055005, 2014.
Kohn, M. J., Paul, S. K., and Corrie, S. L.: The lower Lesser Himalayan sequence: A Paleoproterozoic arc on the northern margin of the Indian plate, Geol. Soc. Am. Bull., 122, 323–335, https://doi.org/10.1130/B26587.1, 2010.
Lanari, P. and Duesterhoeft, E.: Modeling metamorphic rocks using equilibrium thermodynamics and internally consistent databases: Past achievements, problems and perspectives, J. Petrol., 60, 19–56, https://doi.org/10.1093/petrology/egy105, 2019.
Larson, K., Piercey, S., and Cottle, J.: Preservation of a Paleoproterozoic rifted margin in the Himalaya: Insight from the Ulleri-Phaplu-Melung orthogneiss, Geosci. Front., 10, 873–883, https://doi.org/10.1016/j.gsf.2017.05.010, 2019.
Larson, K. P., Ambrose, T. K., Webb, A. A. G., Cottle, J. M., and Shrestha, S.: Reconciling Himalayan midcrustal discontinuities: The Main Central thrust system, Earth Planet. Sc. Lett., 429, 139–146, https://doi.org/10.1016/j.epsl.2015.07.070, 2015.
Le Fort, P.: Himalaya: the collided range, Present knowledge of the continental arc, Am. J. Sci. A, 275, 1–44, 1975.
Lombardo, B., Pertusati, P., and Borghi, A.: Geology and tectono-magmatic evolution of the eastern Himalaya along the Chomolungma–Makalu transect, in: Himalayan Tectonics, edited by: Treloar, P. J. and Searle, M. P., Geol. Soc. Spec. Publ., 74, 341–355, https://doi.org/10.1144/GSL.SP.1993.074.01.23, 1993.
Martin, A. J.: A review of Himalayan stratigraphy, magmatism, and structure, Gondwana Res., 49, 42–80, https://doi.org/10.1016/j.gr.2017.04.031, 2017a.
Martin, A. J.: A review of definitions of the Himalayan Main Central Thrust, Int. J. Earth Sci., 106, 2131–2145, https://doi.org/10.1007/s00531-016-1419-8, 2017b.
Martin, A. J., DeCelles, P. G., Gehrels, G. H., Patchett, P. J., and Isachsen, C.: Isotopic and structural constraints on the location of the Main Central Thrust in the Annapurna Range, central Nepal Himalaya, Geol. Soc. Am. Bull., 117, 926–944, https://doi.org/10.1130/B25646.1, 2005.
Martin, A. J., Burgya, K. D., Kaufmanb, A. J., and Gehrels, G. E.: Stratigraphic and tectonic implications of field and isotopic constraints on depositional ages of Proterozoic Lesser Himalayan rocks in central Nepal, Precambrian Res., 185, 1–17, https://doi.org/10.1016/j.precamres.2010.11.003, 2011.
Massonne, H. J.: Phase relations and dehydration behaviour of calcareous sediments at very-low to low grade metamorphic conditions, Period. Mineral., 79, 21–43, https://doi.org/10.2451/2010PM0008, 2010.
Okuyama-Kusunose, Y.: Phase relations in andalusite-sillimanite type Fe-rich aluminous metapelites: Tono contact metamorphic aureole, northeast Japan, J. Metamorph. Geol., 12, 153–168, https://doi.org/10.1111/j.1525-1314.1994.tb00011.x, 1994.
Parrish, R. R. and Hodges, K. V.: Isotopic constraints on the age and provenance of the Lesser and Greater Himalayan sequences, Nepalese Himalaya, Geol. Soc. Am. Bull., 108, 904–911, https://doi.org/10.1130/0016-7606(1996)108<0904:ICOTAA>2.3.CO;2, 1996.
Pattison, D. R. M. and Tinkham, D. K.: Interplay between equilibrium and kinetics in prograde metamorphism of pelites: an example from the Nelson aureole, British Columbia, J. Metamorph. Geol., 27, 249–279, https://doi.org/10.1111/j.1525-1314.2009.00816.x, 2009.
Pattison, D. R. M., de Capitani, C., and Gaidies, F.: Petrological consequences of variations in metamorphic reaction affinity, J. Metamorph. Geol., 29, 953–977, https://doi.org/10.1111/j.1525-1314.2011.00950.x, 2011.
Pêcher, A.: The metamorphism in Central Himalaya, J. Metamorph. Geol., 7, 31–41, https://doi.org/10.1111/j.1525-1314.1989.tb00573.x, 1989.
Pitra, P. and Guiraud, M.: Probable anticlockwise P−T evolution in extending crust: Hlinsko region, Bohemian Massif, J. Metamorph. Geol., 14, 49–60, https://doi.org/10.1111/j.1525-1314.1996.t01-1-00049.x, 1996.
Powell, R. and Holland, T. J. B.: On thermobarometry, J. Metamorph. Geol., 26, 155–179, https://doi.org/10.1111/j.1525-1314.2007.00756.x, 2008.
Powell, R., Guiraud, M., and White, R. W.: Truth and beauty in metamorphic phase-equilibria: Conjugate variables and phase diagrams, Can. Mineral., 43, 21–33, https://doi.org/10.2113/gscanmin.43.1.21, 2005.
Rapa, G., Mosca, P., Groppo, C., and Rolfo, F.: Detection of tectonometamorphic discontinuities within the Himalayan orogen: structural and petrological constraints from the Rasuwa District, Central Nepal Himalaya, J. Asian Earth Sci., 158, 266–286, https://doi.org/10.1016/J.JSEAES.2018.02.021, 2018.
Ridley, J. and Thompson, A. B.: The Role of Mineral Kinetics in the Development of Metamorphic Microtextures, in: Fluid-Rock Interactions during Metamorphism, Advances in Physical Geochemistry, Vol 5., edited by: Walther, J. V. and Wood, B. J., Springer New York, ISBN 978-1-4612-9351-4, https://doi.org/10.1007/978-1-4612-4896-5_7, 1986.
Robinson, D. M., DeCelles, P. G., Patchett, P. J., and Garzione, C. N.: The kinematic history of the Nepalese Himalaya interpreted from Nd isotopes, Earth Planet. Sc. Lett., 192, 507–521, https://doi.org/10.1016/S0012-821X(01)00451-4, 2001.
Rolfo, F., Groppo, C., and Mosca, P.: Petrological constraints of the “Channel Flow” model in eastern Nepal, in: Tectonics of the Himalaya, edited by: Mukherjee, S., Carosi, R., van der Beek, P. A., Mukherjee, B. K., and Robinson, D. M., Geol. Soc. Lond. Special Publ., 412, 177–197, https://doi.org/10.1144/SP412.4, 2015.
Rubie, D. C.: The catalysis of mineral reactions by water and restrictions on the presence of aqueous fluid during metamorphism, Mineral. Mag., 50, 399–415, https://doi.org/10.1180/minmag.1986.050.357.05, 1986.
Rubie, D. C.: Disequilibrium during metamorphism: the role of nucleation kinetics, Geol. Soc. Spec. Publ., 138, 199–214, https://doi.org/10.1144/GSL.SP.1996.138.01.12, 1998.
Sakai, H., Iwano, H., Danhara, T., Takigami, Y., Rai, S. M., Upreti, B. N., and Hirata, T.: Rift-related origin of the Paleoproterozoic Kuncha Formation, and cooling history of the Kuncha nappe and Taplejung granites, eastern Nepal Lesser Himalaya: A multichronological approach, Island Arc, 22, 338–360, https://doi.org/10.1111/iar.12021, 2013.
Saki, A., Miri, M., and Oberhänsli, R.: Pseudosection modelling of the Precambrian meta-pelites from the Poshtuk area, NW Iran, Period. Mineral., 90, 325–340, https://doi.org/10.13133/2239-1002/16632, 2021.
Schelling, D.: The tectonostratigraphy and structure of the eastern Nepal Himalaya, Tectonics, 11, 925–943, https://doi.org/10.1029/92TC00213, 1992.
Searle, M. P., Law, R. D., Godin, L., Larson, K. P., Streule, M. J., Cottle, J. M, and Jessup, M. J.: Defining the Himalayan Main Central Thrust in Nepal, J. Geol. Soc. Lond., 165, 523–534, https://doi.org/10.1144/0016-76492007-081, 2008.
Sengupta, N.: Stability of chloritoid + biotite-bearing assemblages in some meta-pelites from the Palaeoproterozoic Singhbhum Shear Zone, eastern India and their implications, Geol. Soc. Spec. Publ., 365, 91–116, https://doi.org/10.1144/SP365.6, 2012.
Spear, F. S. and Pattison, D. R. M.: The implications of overstepping for metamorphic assemblage diagrams (MADs), Chem. Geol., 457, 38–46, https://doi.org/10.1016/j.chemgeo.2017.03.011, 2017.
Spear, F. S., Pattison, D. R. M., and Cheney, J. T.: The metamorphosis of metamorphic petrology, in: The Web of Geological Sciences: Advances, Impacts, and Interactions II, edited by: Bickford, M. E., Spec. Pap. Geol. Soc. Am., 523, https://doi.org/10.1130/2016.2523(02), 2016.
Stöcklin, J.: Geology of Nepal and its regional frame, J. Geol. Soc. Lond., 137, 1–34, https://doi.org/10.1144/gsjgs.137.1.0001, 1980.
Tamang, S., Groppo, C., Girault, F., and Rolfo, F.: Implications of garnet nucleation overstepping for the P−T evolution of the Lesser Himalayan Sequence of central Nepal, J. Metamorph. Geol., 41, 271–297, https://doi.org/10.1111/jmg.12695, 2023.
Thompson, A. B.: Fluid-absent metamorphism, J. Geol. Soc., 140, 533–547, https://doi.org/10.1144/gsjgs.140.4.0533, 1983.
Tursi, F.: The key role of µH2O gradients in deciphering microstructures and mineral assemblages of mylonites: examples from the Calabria polymetamorphic terrane, Mineral. Petrol., 116, 1–14, https://doi.org/10.1007/s00710-021-00766-8, 2022.
Tursi, F., Acquafredda, P., Festa, V., Fornelli, A., Langone, A., Micheletti, F., and Spiess, R.: What can high-P sheared orthogneisses tell us? An example from the Curinga–Girifalco Line (Calabria, southern Italy), J. Metamorph. Geol., 39, 919–944, https://doi.org/10.1111/jmg.12596, 2021.
Ulmer, P.: NORM – Program for cation and oxygen mineral norms. Computer Library, Institut für Mineralogie und Petrographie, ETH-Zentrum, ETH-Zentrum, Zürich, Switzerland, 1986.
Wang, P. and Spear, F. S.: A field and theoretical analysis of garnet + chlorite + chloritoid + biotite assemblages from the tristate (MA, CT, NY) area USA, Contrib. Mineral. Petrol., 106, 217–235, https://doi.org/10.1007/BF00306435, 1991.
Upreti, B. N.: An overview of the stratigraphy and tectonics of the Nepal Himalaya, J. Asian Earth Sci., 17, 577–606, https://doi.org/10.1016/S1367-9120(99)00047-4, 1999.
Upreti, B. N., Rai, S., Sakai, H., Koirala, D., and Takigami, Y.: Early Proterozoic granite of the Taplejung Window, far eastern Lesser Nepal Himalaya, J. Nepal Geol. Soc., 28, 9–18, https://doi.org/10.3126/jngs.v28i0.31720, 2003.
Valdiya, K. S.: Geology of the Kumaun Lesser Himalaya, Wadia Institute of Himalayan Geology, Dehradun, India, 289 pp., 1980.
Walther, J. V. and Orville, P. M.: Volatile production and transport in regional metamorphism, Contrib. Mineral. Petrol., 79, 252–257, https://doi.org/10.1007/BF00371516, 1982.
Waters, D. J.: Metamorphic constraints on the tectonic evolution of the High Himalaya in Nepal: the art of the possible, Geol. Soc. Spec. Publ., 483, 325–375, 2019.
Waters, D. J. and Lovegrove, D. P.: Assessing the extent of disequilibrium and overstepping of prograde metamorphic reactions in metapelites from the Bushveld Complex aureole, South Africa, J. Metamorph. Geol., 20, 135–149, https://doi.org/10.1046/j.0263-4929.2001.00350.x, 2002.
White, R. W., Powell, R., Holland, T. J. B, and Worley, B. A.: The effect of TiO2 and Fe2O3 on metapelitic assemblages at greenschist and amphibolite facies conditions: mineral equilibria calculations in the system K2O–FeO–MgO–Al2O3–SiO2–H2O–TiO2–Fe2O3, J. Metamorph. Geol., 18, 497–511, https://doi.org/10.1046/j.1525-1314.2000.00269.x, 2000.
White, R. W., Powell, R., and Holland, T. J. B.: Progress relating to calculation of partial melting equilibria for metapelites, J. Metamorph. Geol., 25, 511–527, https://doi.org/10.1111/j.1525-1314.2007.00711.x, 2007.
White, R. W., Powell, R., and Johnson, T. E.: The effect of Mn on mineral stability in meta-pelites revisited: new a−x relations for manganese-bearing minerals, J. Metamorph. Geol., 32, 809–828, https://doi.org/10.1111/jmg.12095, 2014.
Whitney, D. L. and Evans, B. W.: Abbreviations for names of rock-forming minerals, Am. Mineral., 95, 185–187, https://doi.org/10.2138/am.2010.3371, 2010.
Whitney, D. L., Mechum, T. A, Dilek, Y., and Kuehner, S. M.: Progressive metamorphism of pelitic rocks from protolith to granulite facies, Dutchess County, NewYork: Constraints on the timing of fluid infiltration during regional metamorphism, J. Metamorph. Geol., 14, 163–181, https://doi.org/10.1046/j.1525-1314.1996.05836.x, 1996.
Yakymchuk, C. and Godin, L.: Coupled role of deformation and metamorphism in the construction of inverted metamorphic sequences: An example from far-northwest Nepal, J. Metamorph. Geol., 30, 513–535, https://doi.org/10.1111/j.1525-1314.2012.00979.x, 2012.
Yin, A.: Cenozoic tectonic evolution of the Himalayan orogen as constrained by along-strike variation of structural geometry, exhumation history, and foreland sedimentation, Earth Sci. Rev., 76, 1–131, https://doi.org/10.1016/j.earscirev.2005.05.004, 2006.
Yin, A. and Harrison, T. M.: Geologic evolution of the Himalayan-Tibetan orogen, Annu. Rev. Earth Pl. Sc., 28, 211–280, https://doi.org/10.1146/annurev.earth.28.1.211, 2000.