the Creative Commons Attribution 4.0 License.
the Creative Commons Attribution 4.0 License.
 | 25 Apr 2023
Manganrockbridgeite, Mn2+2Fe3+3(PO4)3(OH)4(H2O), a new member of the rockbridgeite group, from the Hagendorf-Süd pegmatite, Oberpfalz, Bavaria
Ian E. Grey
Rupert Hochleitner
Anthony R. Kampf
Stephanie Boer
Colin M. MacRae
John D. Cashion
Christian Rewitzer
William G. Mumme
Manganrockbridgeite, MnFe(PO4)3(OH)4(H2O), is a new member of the rockbridgeite group, from the Hagendorf-Süd pegmatite, Oberpfalz, Bavaria. It occurs in association with frondelite, kenngottite, hureaulite and hematite. It forms compact intergrowths and clusters of shiny greenish black blades up to 200 µm long and 20 µm wide but only a few micrometres thick. The crystals are elongated on [100] and flattened on {001}, with perfect cleavage parallel to {001}. Individual thin blades are green in transmitted light and red under crossed polars. The calculated density is 3.40 g cm−3. Manganrockbridgeite is biaxial (), with α= 1.795(5), β= 1.805(calc), γ=1.815(5) (white light) and 2V(meas.) = 90(2)∘. The empirical formula from electron microprobe analyses, Mössbauer spectroscopy and crystal structure refinement is (MnFeFe)Σ1.92(Fe3+)2.88(PO4)3(OH)3.64(H2O)1.44. Manganrockbridgeite has monoclinic symmetry with space group P2 and unit-cell parameters a=5.198(2), b=16.944(5), c=7.451(3) Å, β=110.170(9)∘, V=616.0(4) Å3 and Z=2. The crystal structure was refined using both laboratory and synchrotron single-crystal diffraction data. Whereas other rockbridgeite-group minerals have orthorhombic symmetry with a statistical distribution of 50 % Fe3+ 50 % vacancies in M3-site octahedra forming face-shared chains along the 5.2 Å axis, monoclinic manganrockbridgeite has full ordering of Fe3+ and vacancies in alternate M3 sites along the 5.2 Å axis.
- Article
(9202 KB) - Full-text XML
-
Supplement
(465 KB) - BibTeX
- EndNote


The isostructural minerals rockbridgeite (Frondel, 1949) and frondelite (Lindberg, 1949) were determined by Lindberg (1949) to have B-centred orthorhombic symmetry, with a≈13.9, b≈17.0, c≈5.2 Å and with formulae M2+Fe(PO4)3(OH)5, where M= Fe for rockbridgeite and Mn for frondelite. The crystal structure for rockbridgeite in space group Bbmm was solved by Moore (1970) with the structural formula M1(M2)2(M3)2(PO4)3X5, X= OH, O, H2O. It contains linear trimers of face-shared octahedra, M2–M1–M2, that are connected into [010] chains by edge-sharing of the M2-centred octahedra, and into (100) planes by corner-sharing with PO4 tetrahedra. These planes alternate with (100) planes containing dimers of corner-connected M3-centred octahedra. The dimers share faces along the 5.2 Å axis with very short (2.6 Å) M3–M3 distances. This physically unreasonable situation is overcome by having statistical half-occupancy of the M3 sites. Moore (1970) reported that Fe3+ occurred at M3, while a mixture of Fe2+ and Fe3+ occurred at the M2 and M3 sites. In contrast, a more recent combined single-crystal structure refinement and Mössbauer study of a Mn-bearing rockbridgeite (Redhammer et al., 2006) showed that divalent cations were confined to the M2 site, and this was confirmed in a single-crystal structure refinement for plimerite, the Zn analogue of rockbridgeite, that showed Zn ordering at M2 (Elliott et al., 2009). Since there are two M2 cations per formula unit, we proposed a general formula for stoichiometric rockbridgeite-group minerals, A2B3(PO4)3(OH,H2O)5, where A corresponds to the M2 site and B to the M1 plus M3 sites. The formula and the establishment of the rockbridgeite group was approved by the IMA Commission on New Minerals, Nomenclature and Classification (CNMNC), as was the naming of a new member, ferrorockbridgeite, with dominant Fe2+ at M2 (Grey et al., 2019a). Subsequently a fully oxidised form of rockbridgeite, with 2Fe2+ replaced by 1.33 Fe vacancy at M2, was characterised and approved as a new member of the group, ferrirockbridgeite, (Fe)2(Fe3+)3(PO4)3(OH)4(H2O) (Grey et al., 2019b).
We report here the remaining member of the Fe2+–Fe3+–Mn2+ rockbridgeite-group, which has dominant Mn2+ at M2, manganrockbridgeite. In a recent study on new secondary mineral occurrences at the Hagendorf Süd pegmatite, Bavaria (Keck et al., 2022), it was identified as the greenish black matrix mineral underlying fibrous yellow tufts of the rare mineral kenngottite, MnFe(PO4)4(OH)6(H2O)2, and was flagged as a potential new mineral. It was subsequently fully characterised and the mineral and name have been approved by the IMA CNMNC (IMA 2022-122). The holotype Hagendorf specimen, Hag510, is in the Mineralogical State Collection, Munich, catalogue number MSM-38033. Portions of the holotype that were used for optical and single-crystal diffraction studies are deposited as a cotype in the collections of the Natural History Museum of Los Angeles County, 900 Exposition Boulevard, Los Angeles, CA 90007, USA, catalogue number 76281.
Manganrockbridgeite was identified in specimens collected in the 1970s by Erich Keck from the 76 m level of the Hagendorf-Süd pegmatite mine, Hagendorf, Oberpfalz, Bavaria, Germany (49∘39′1′′ N, 12∘27′35′′ E). The manganrockbridgeite-bearing specimen, Hag510, consists of densely packed greenish black laths of manganrockbridgeite intergrown with platelets of hematite and as radiating sprays of thin laths (Fig. 1). Zoning of some laths into frondelite occurs. Voids in the manganrockbridgeite are filled with pinkish intergrown crystals of hureaulite up to 5 mm. Open voids with coarse crystallised manganrockbridgeite and free platelets of hematite show clusters of yellowish to olive-green needles of kenngottite up to 0.1 mm (Fig. 2). Other associated minerals include quartz, correianevesite, tavorite, switzerite, bermanite, jahnsite-group-minerals, stewartite, laueite and pseudolaueite.
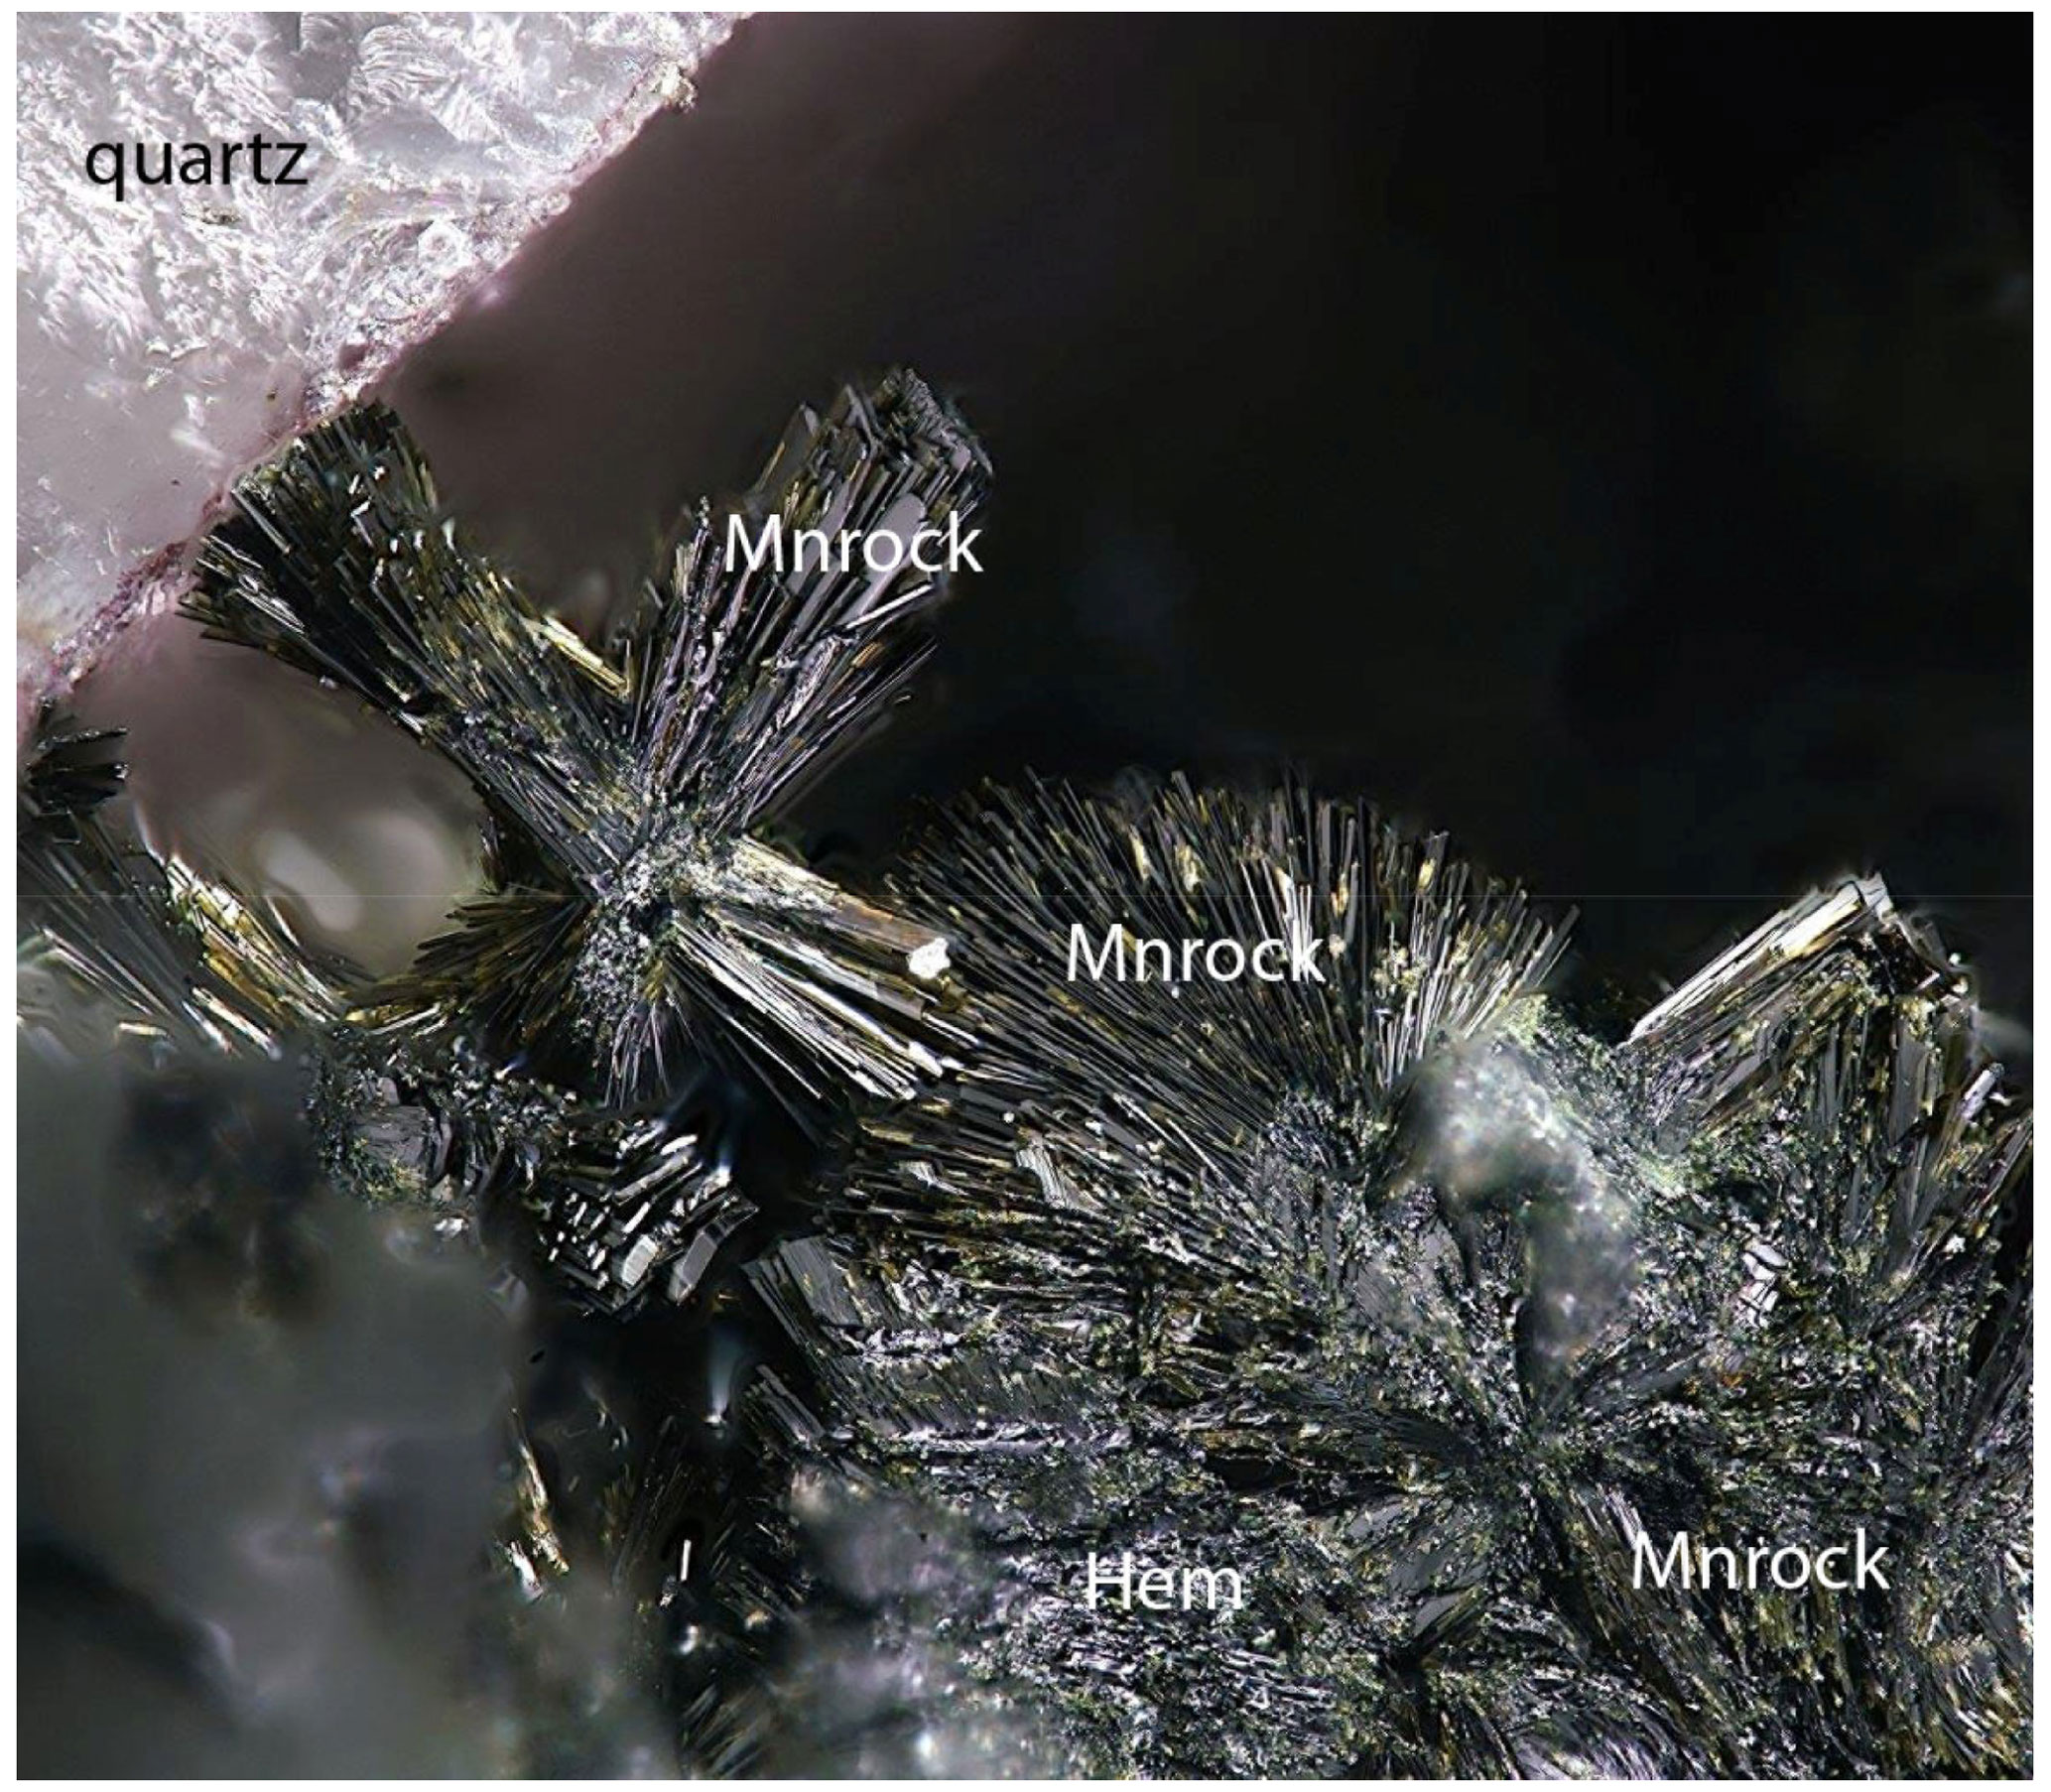
Figure 1Manganrockbridgeite laths. Field of view: 0.7 mm. Photo by Christian Rewitzer.
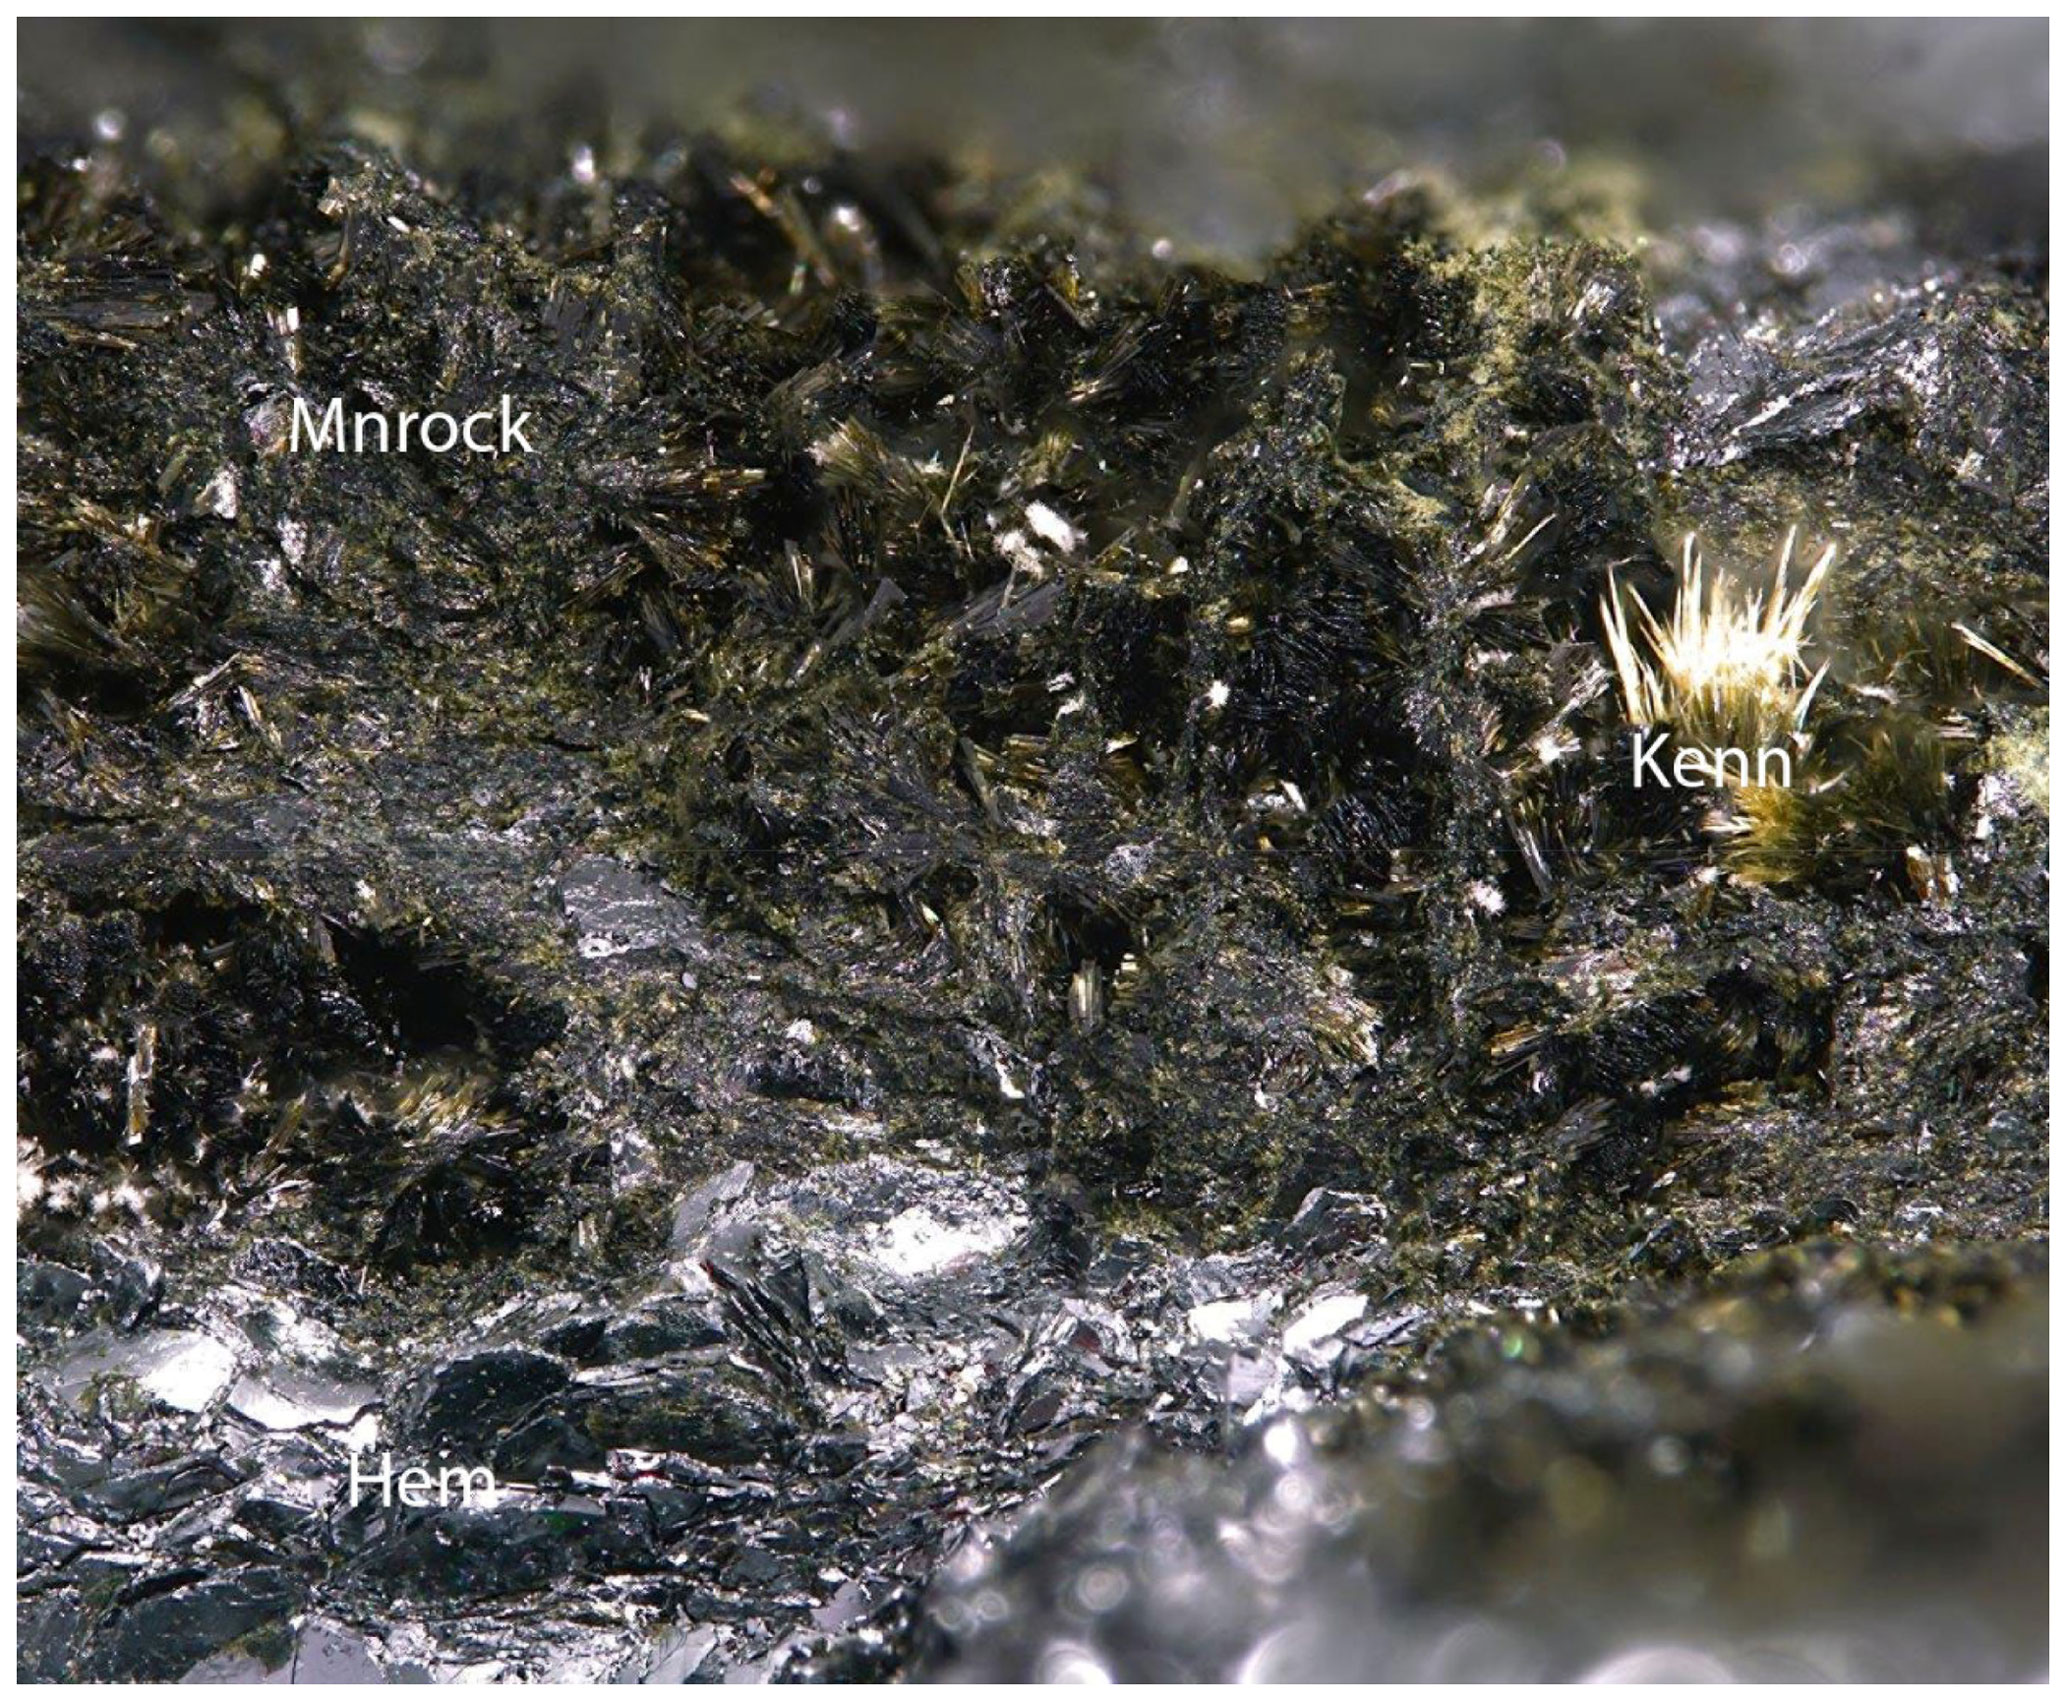
Figure 2Manganrockbridgeite associated with hematite and kenngottite. Field of view: 6 mm. Photo by Christian Rewitzer.
Manganrockbridgeite forms compact intergrowths and clusters of shiny greenish black blades that are up to 200 µm long and 20 µm wide but are only a few micrometres thick (Fig. 3). The crystals are elongated on [100] and flattened on {001}, with perfect cleavage parallel to {001}. Individual thin blades are green in transmitted light and red under crossed polars. The mineral has a greyish-green streak, and crystals have a vitreous to pearly lustre. The density was not measured because of finely intergrown hematite. The calculated density for the empirical formula and powder X-ray diffraction (PXRD) unit-cell volume is 3.40 g cm−3. Manganrockbridgeite crystals are biaxial (), with α=1.795(5), β=1.805(calc), γ=1.815(5) (white light) and 2V(meas.) = 90(2)∘ from extinction data using EXCALIBR (Gunter et al., 2004). Dispersion was extreme but the sense could not be determined. The optical orientation is X=b, Z=a.
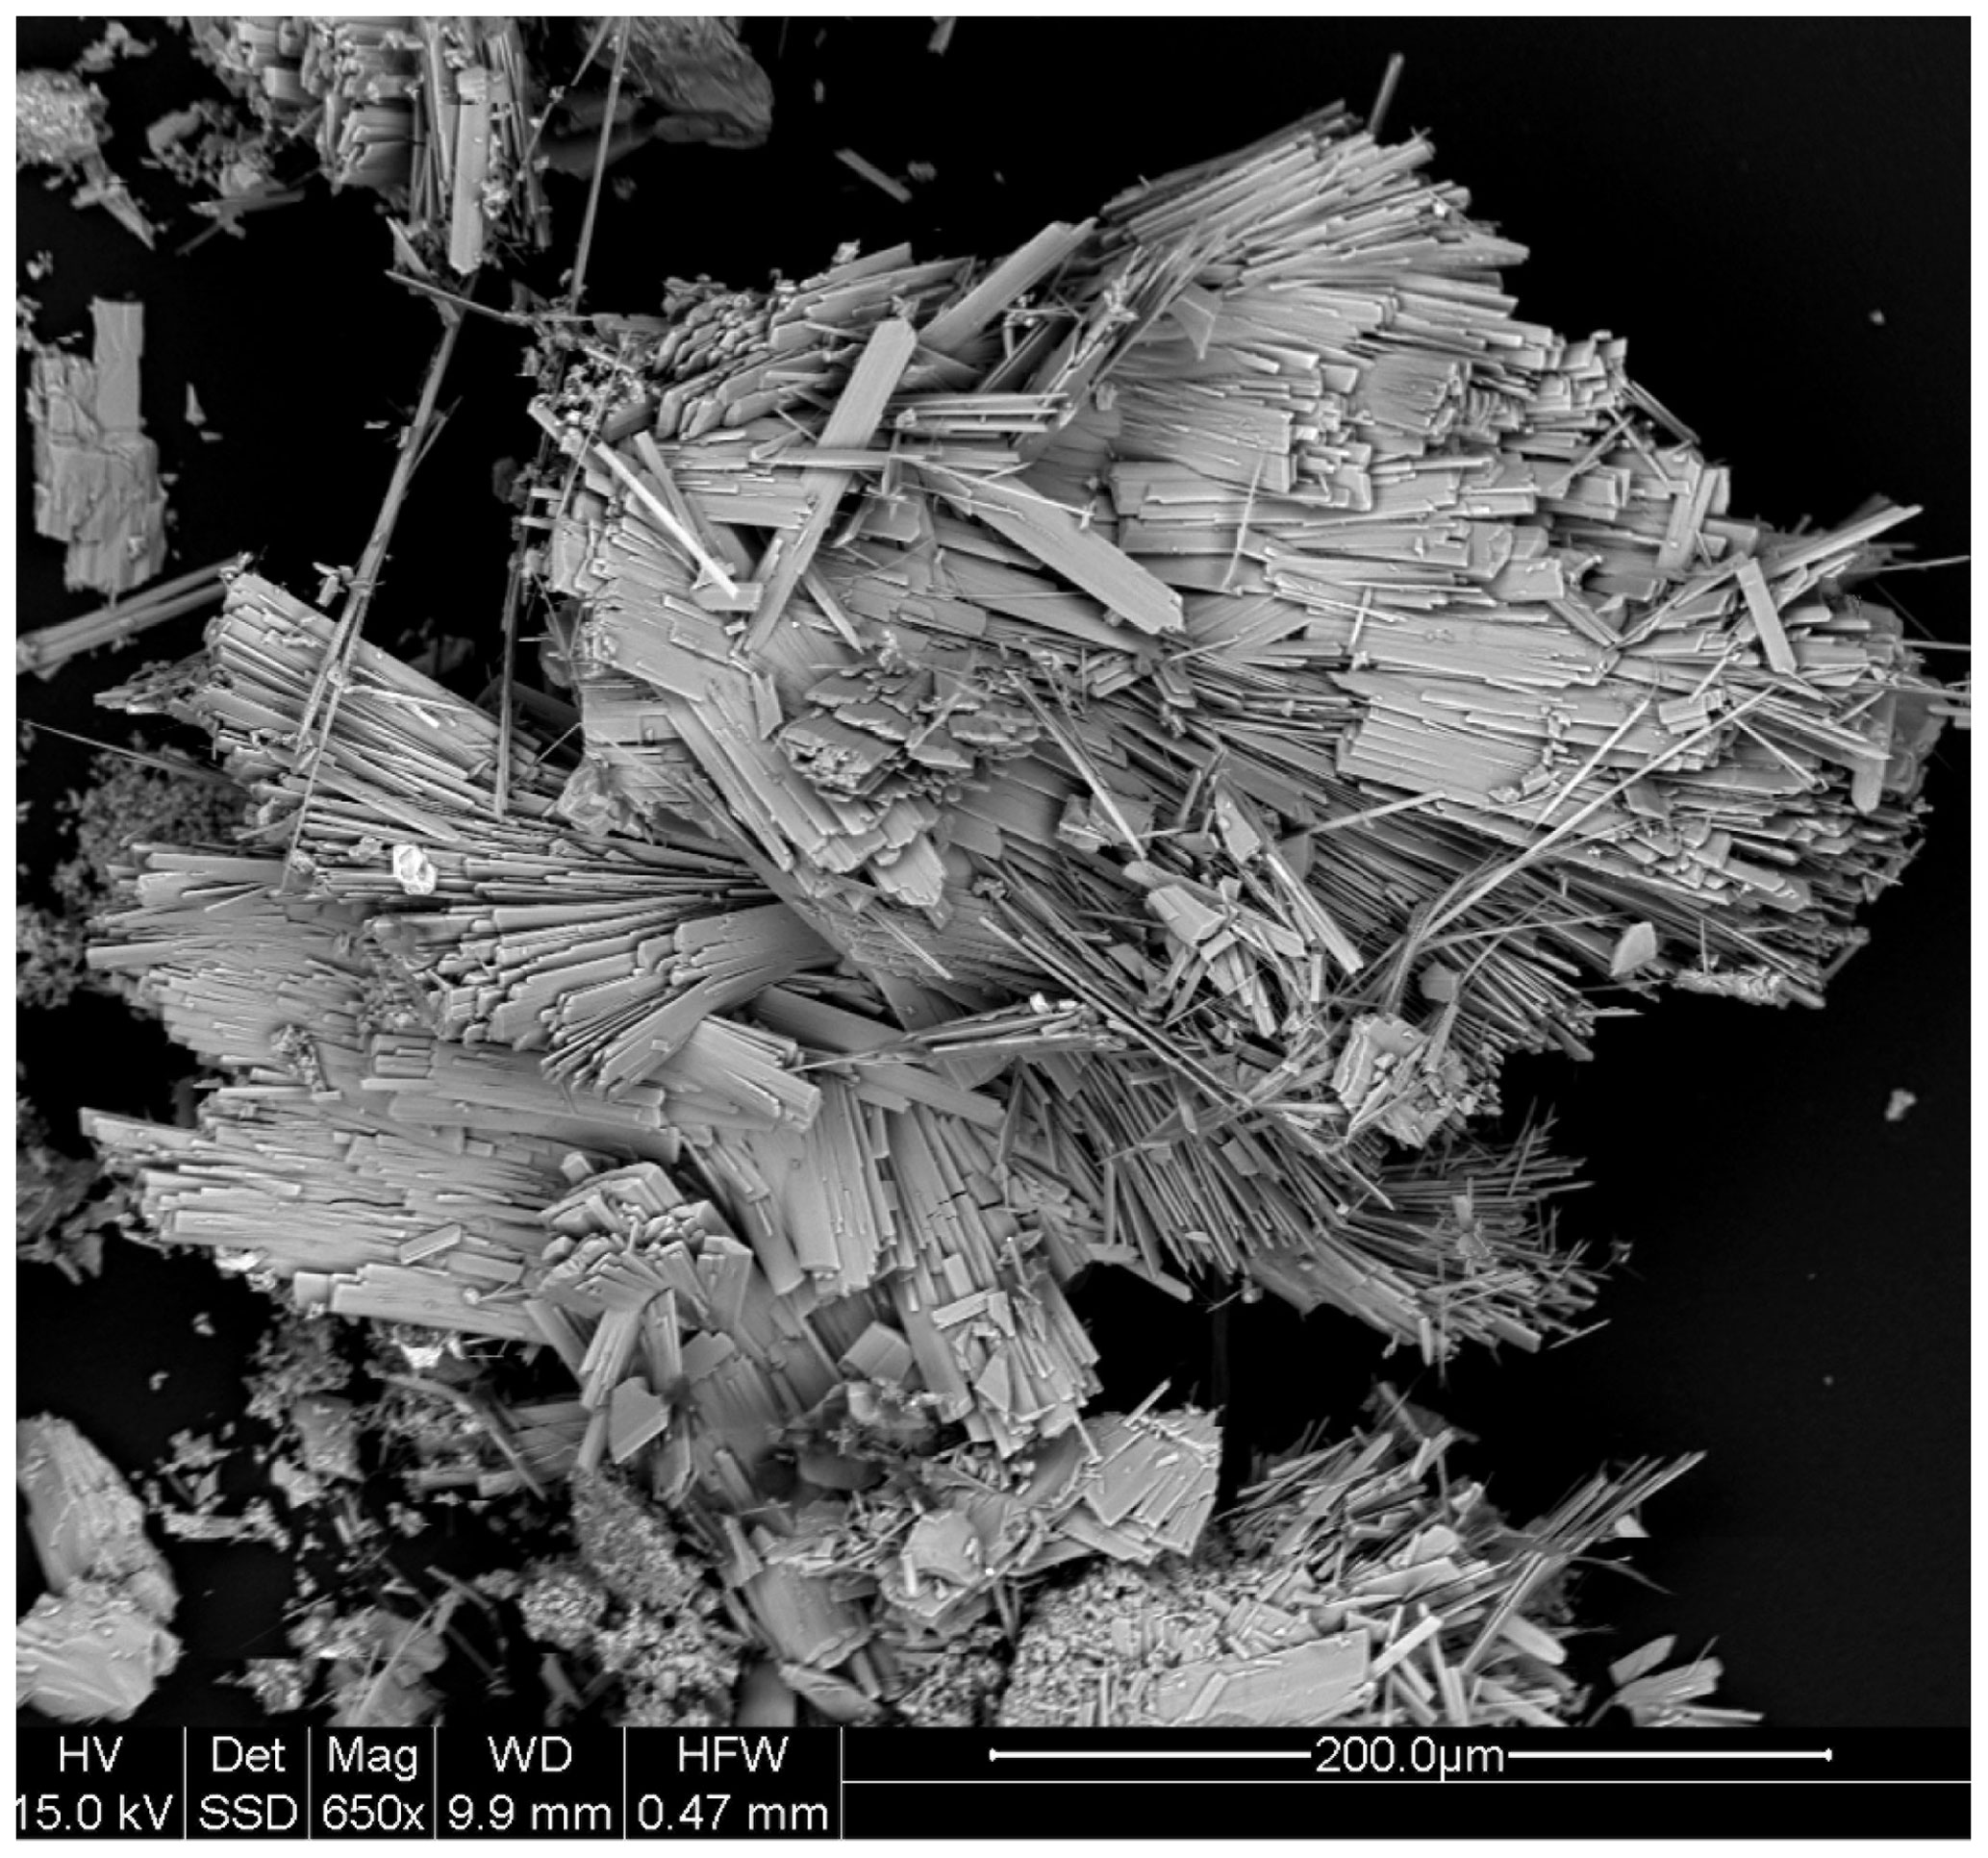
Figure 3Back-scattered electron image of manganrockbridgeite laths.
Pleochroism is X blue-green, Y yellow-brown, Z light yellow-brown; X>Y>Z. The extreme dispersion produces an intense red anomalous interference colour under crossed polars. The Gladstone–Dale compatibility index (Mandarino, 1981) is 1 − (KP KC)=0.054 (good) based upon the empirical formula, calculated density and the measured indices of refraction.
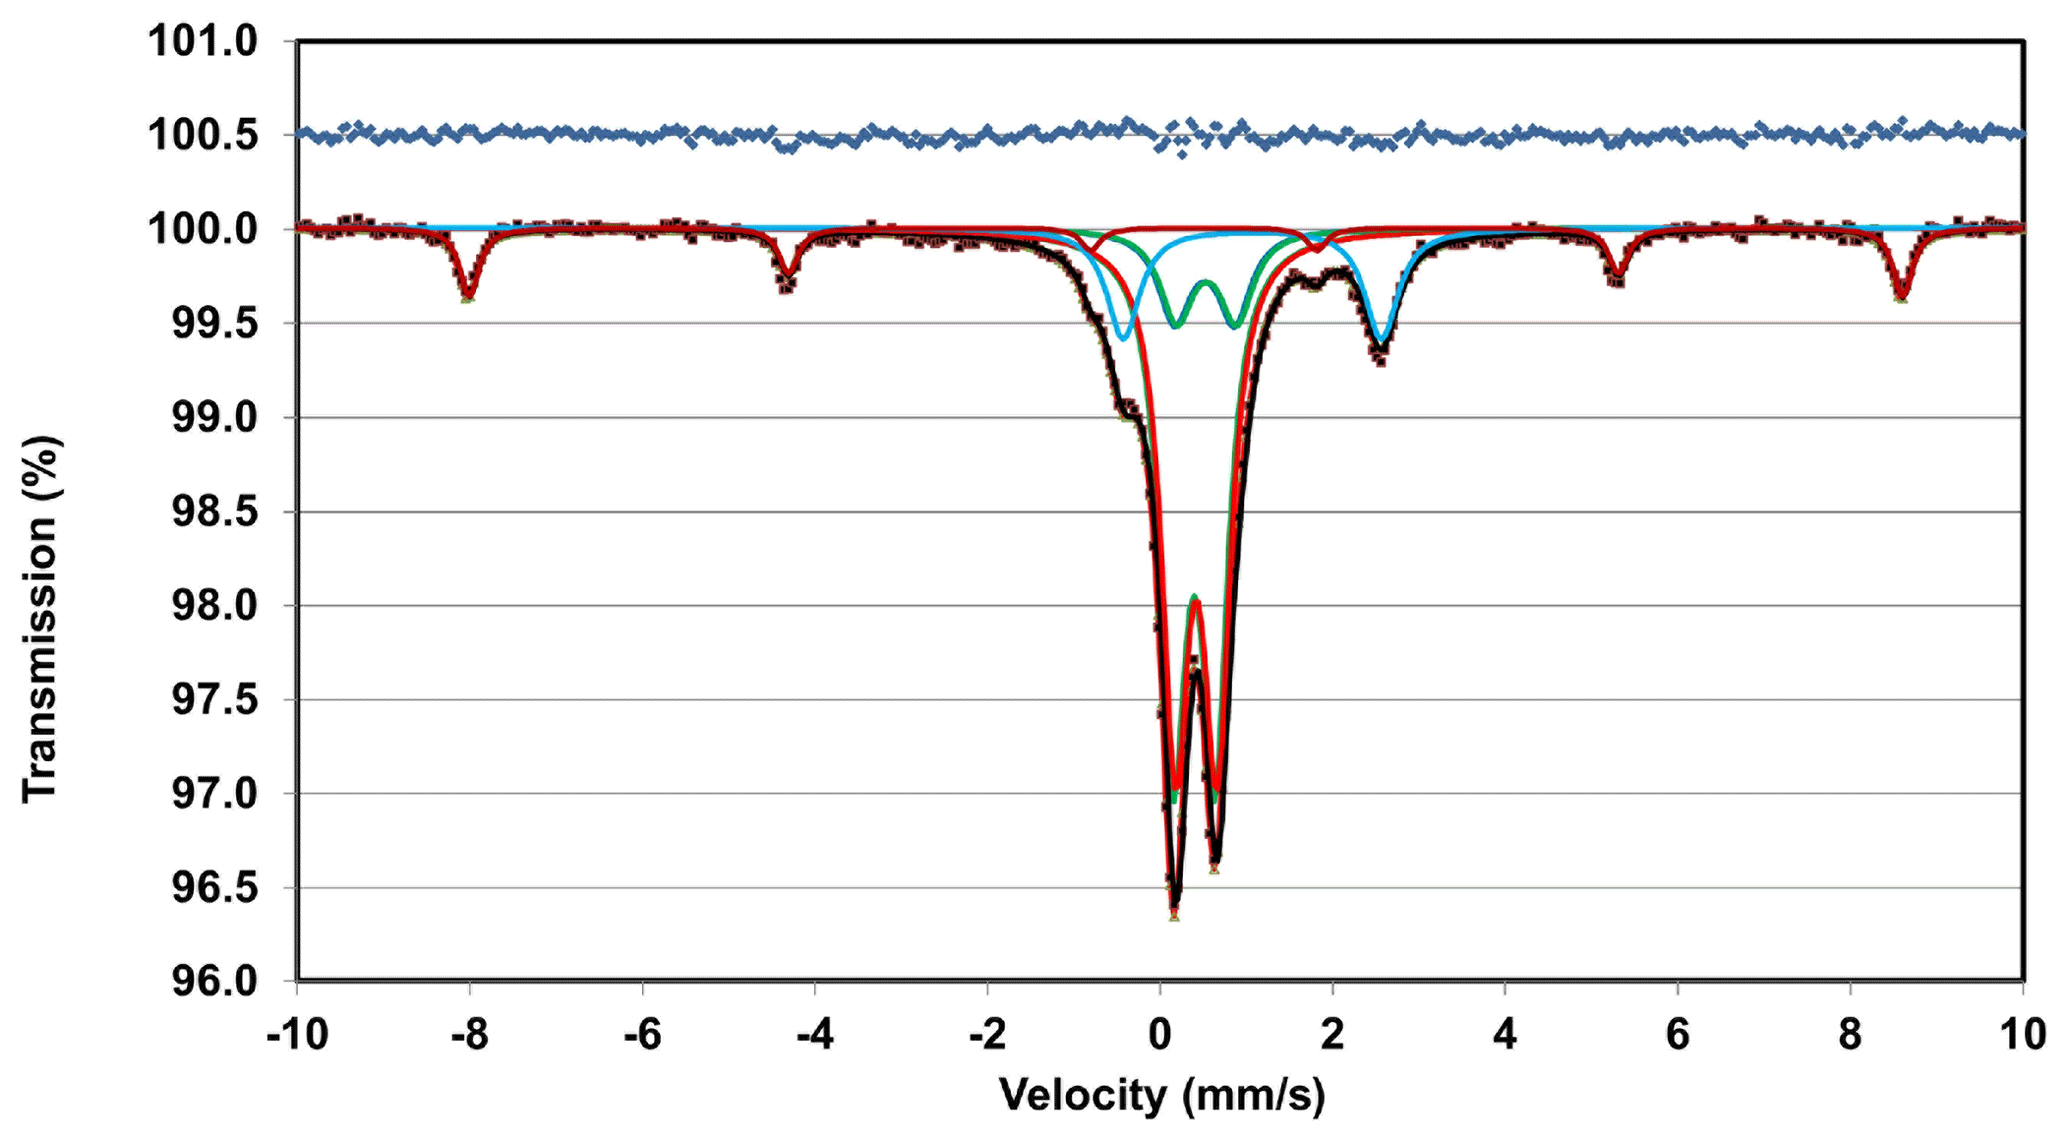
The Mössbauer spectrum for manganrockbridgeite was taken using a conventional constant acceleration drive with a symmetrical sawtooth waveform (Wissel). The source of 57Co in rhodium was maintained at room temperature. The spectrum is shown in Fig. 4. In addition to doublets due to manganrockbridgeite, the spectrum shows weak peaks of a sextet corresponding to hematite impurity. The amount of the impurity was determined by Rietveld quantitative analysis of the PXRD pattern for the powder used for the Mössbauer experiment, obtaining 94 wt % manganrockbridgeite plus 6 wt % of hematite impurity. The spectrum was fitted using three Lorentzian doublets for manganrockbridgeite (two for Fe3+ and one for Fe2+) plus sextet modelling of the hematite peaks. The ratio of the ferrous-to-ferric doublet areas for manganrockbridgeite gave 81.5 % Fe3+ to 18.5 % Fe2+. These values were used with the electron microprobe (EMP) analyses to establish the formula for manganrockbridgeite. The fitting parameters for the manganrockbridgeite doublets and the hematite sextet are given in Table 1. The doublet site assignments were made by analogy to the Mössbauer study of the closely related manganoan rockbridgeite (Redhammer et al., 2006).
Table 1Mössbauer parameters for manganrockbridgeite and hematite, isomer shift δ, quadrupole splitting Δ, half width at half maximum (HWHM), and relative areas of the doublets and sextet, A.
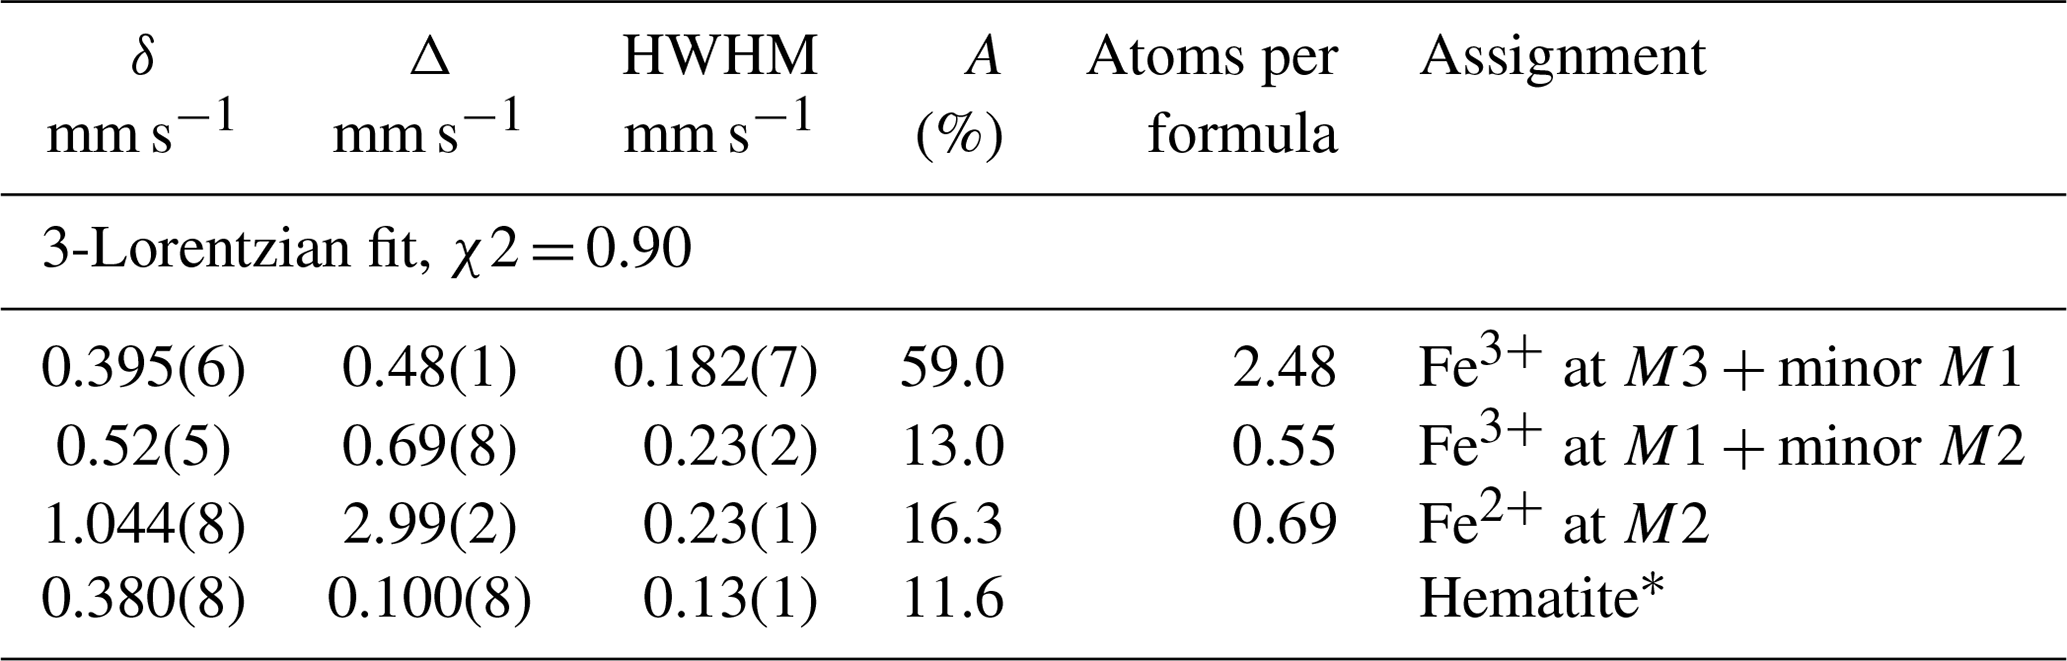
* Hyperfine field B=51.51(6) T.
Crystals of manganrockbridgeite were analysed using wavelength dispersive spectrometry on a JEOL JXA-8500F Hyperprobe operated at an accelerating voltage of 15 kV and a beam current of 4 nA. The beam was defocused to 5 µm for compact regions of crystals and to 2 µm for thin laths. A total of 30 analyses were made for Mn, Fe and P, each on a different region of the polished mount. Checks were made for the presence of other elements including Zn, Mg and Ca, but they were below detection limits. Analytical results are given in Table 2. The average FeO Fe2O3 ratio was determined from Mössbauer spectroscopy. The large standard deviations (SDs) for MnO and Fetotal expressed as Fe2O3 are due to Fe Mn substitution at the M2 site. This is shown in Fig. 5 by a plot of atoms of Mn versus atoms of Fe at site M2 (i.e. total Fe with 3Fe at M1 + M3 subtracted). The plot shows a negative correlation with a slope of −1. The results in Fig. 5 show [Mn] > [Fe] at the M2 site for all but 4 of the 30 analyses.
The analyses consistently show a metal-to-P atomic ratio less than the 1.67 required for the stoichiometric rockbridgeite composition, due to cation vacancies. Scaling the analyses to 3 P atoms, and with a uniform distribution of vacancies over the M1 to M3 sites, the empirical formula is (MnFeFe)Σ1.92(Fe3+)2.88(PO4)3(OH)3.64 (H2O)1.44, where the atoms in the first bracket occupy site M2 in the rockbridgeite-type structure and the atoms in the second bracket occupy the M1 and M3 sites (Grey et al., 2019a).

Figure 5Plot of EMP results as atoms per formula unit (apfu) of Mn versus [Fe]total−3 (i.e. total Fe with 3 Fe atoms at M1 + M3 sites subtracted).
The simplified formula is (Mn2+, Fe2+, Fe3+, □)2(Fe3+, □)3(PO4)3(OH, H2O)5, vacancy.
The ideal (end-member) formula is MnFe(PO4)3(OH)4(H2O).
The latter requires MnO 21.88, Fe2O3 36.95, P2O5 32.84, H2O 8.33, total 100.00 wt %.
6.1 Powder X-ray diffraction (PXRD)
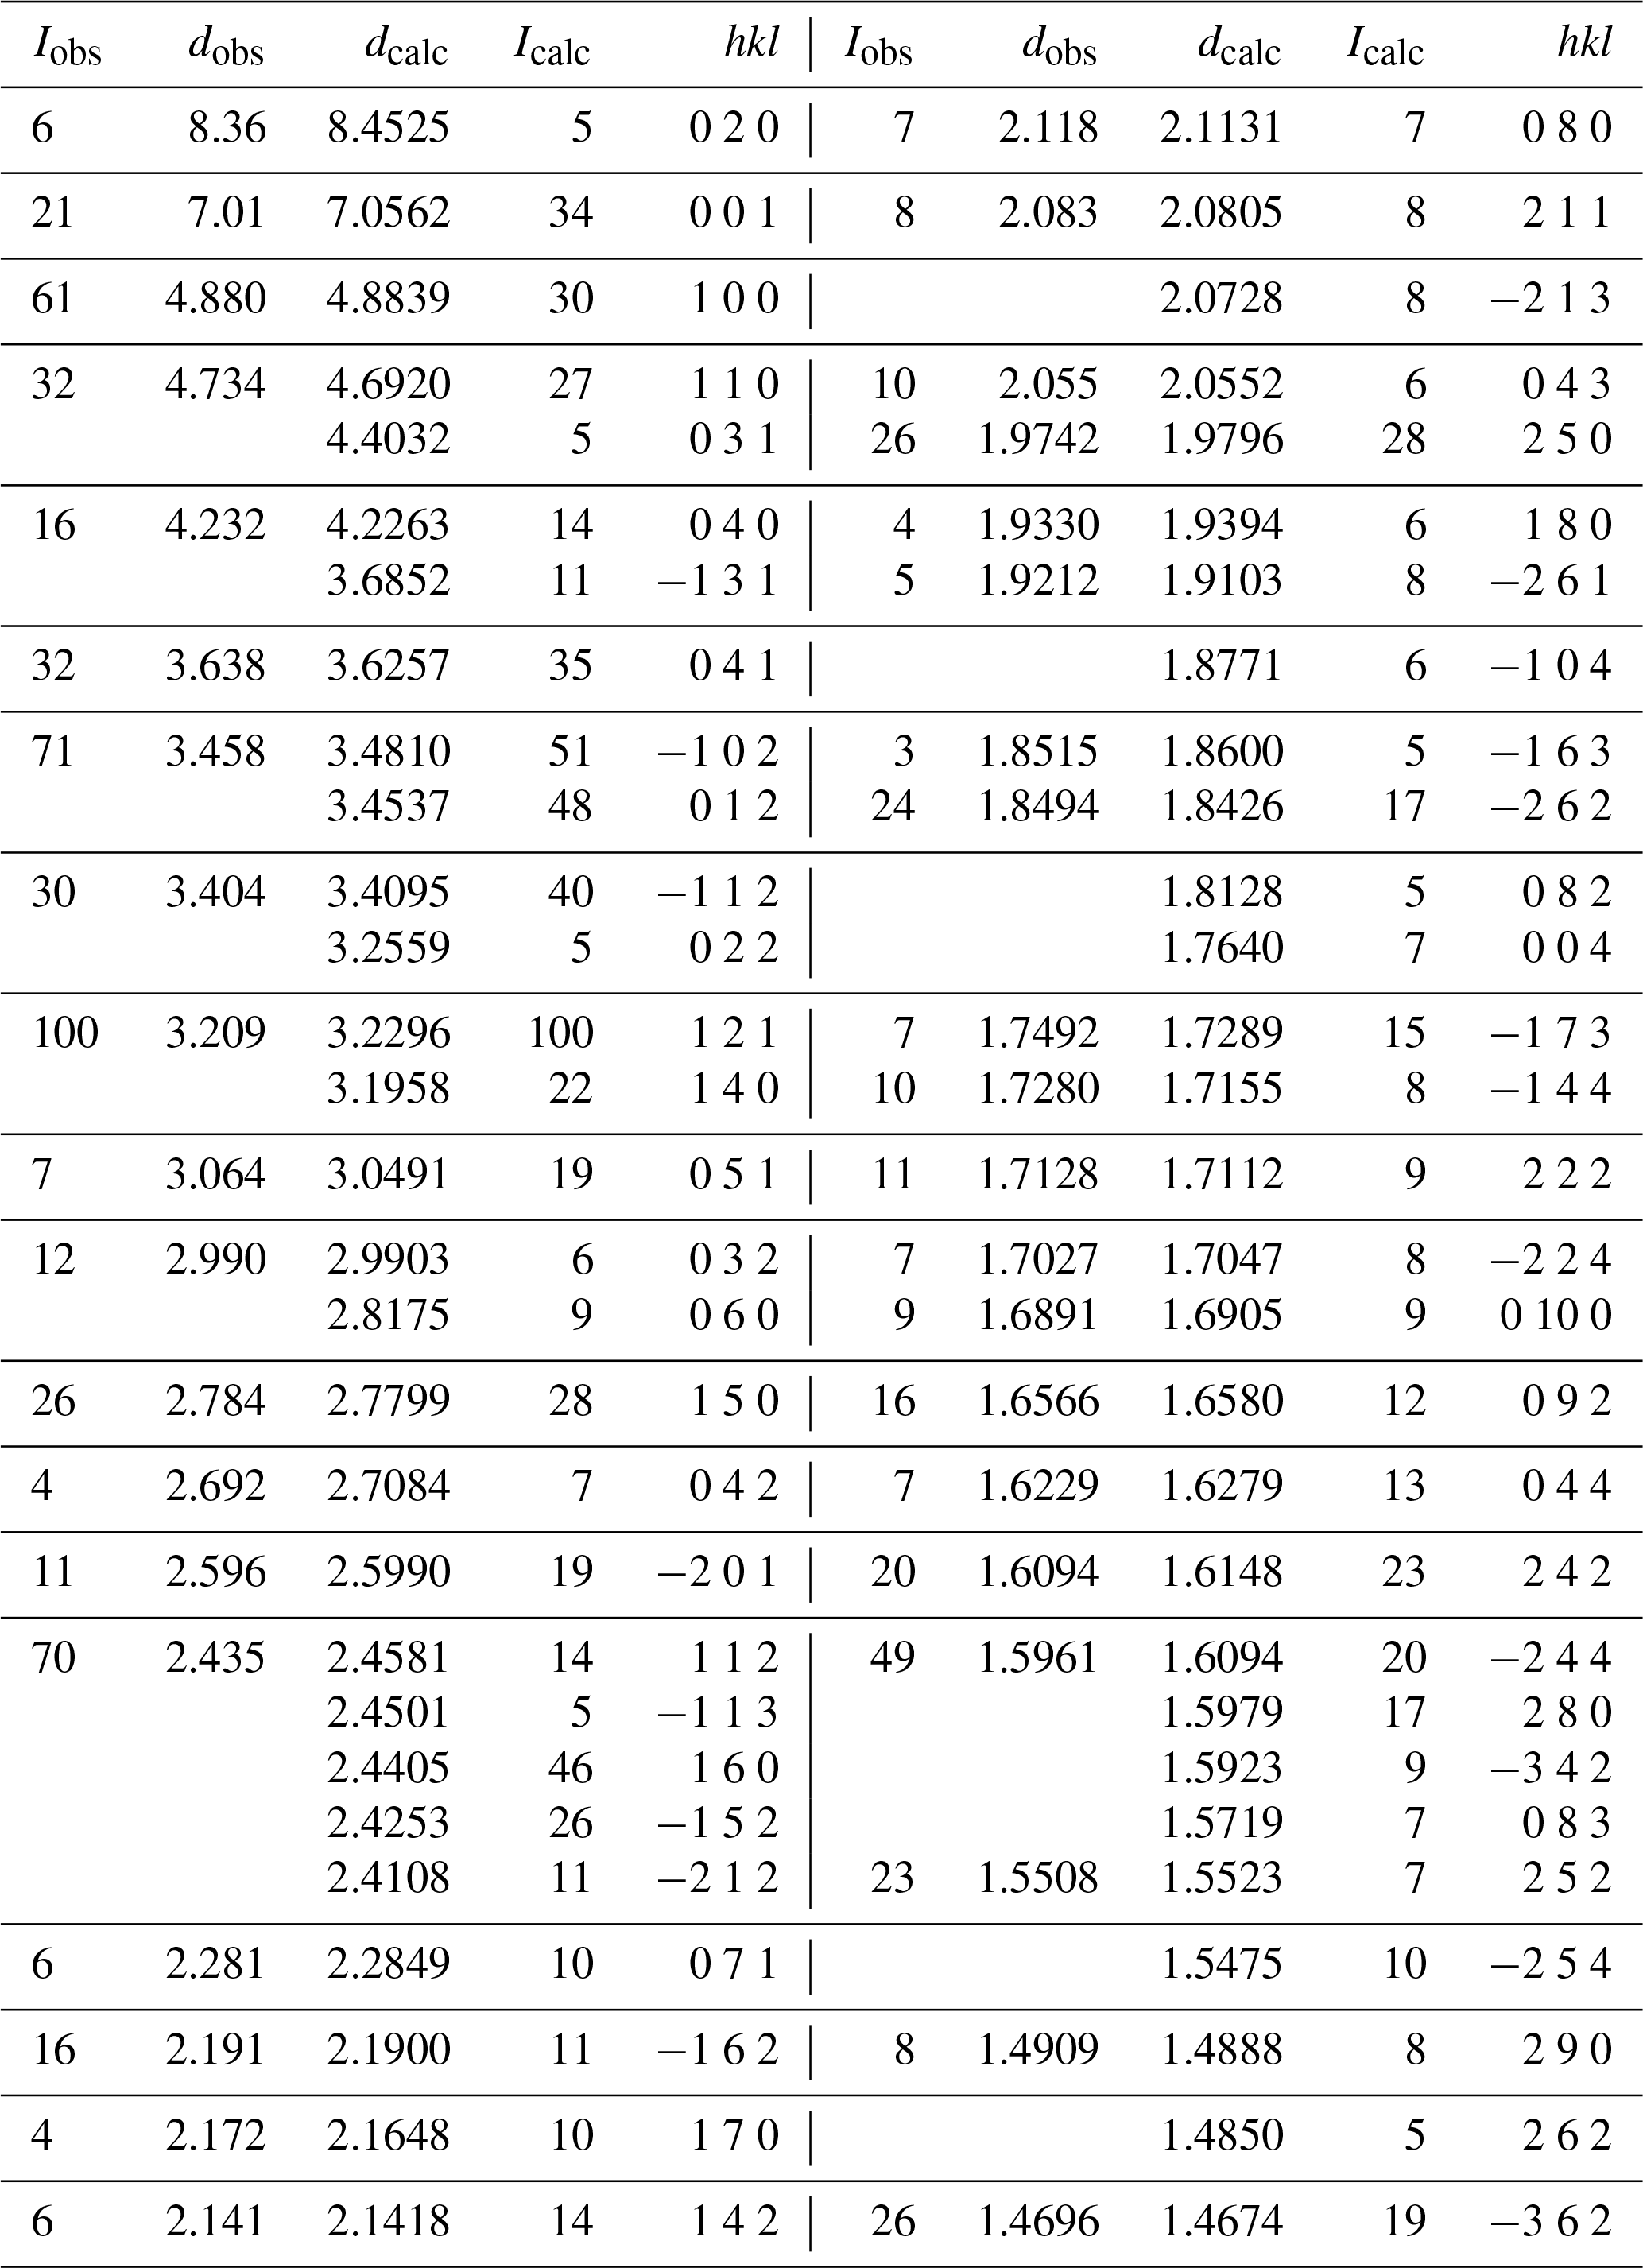
X-ray powder diffraction data were obtained using a Rigaku R-AXIS Rapid II curved imaging plate microdiffractometer, with monochromatised MoKα radiation (50 kV, 40 mA). A Gandolfi-like motion on the φ and ω axes was used to randomise the sample. Observed d values and intensities were derived by profile fitting using JADE Pro software. Data (in Å for MoKα) are given in Table 3. Unit cell parameters refined from the powder data in space group P2(#11) using JADE 2010 with whole pattern fitting are a=5.210(5), b=16.981(5), c=7.520(5) Å, β=110.73(4)∘ and V=622.2(8) Å3.
Table 2Analytical data (wt %) for manganrockbridgeite.
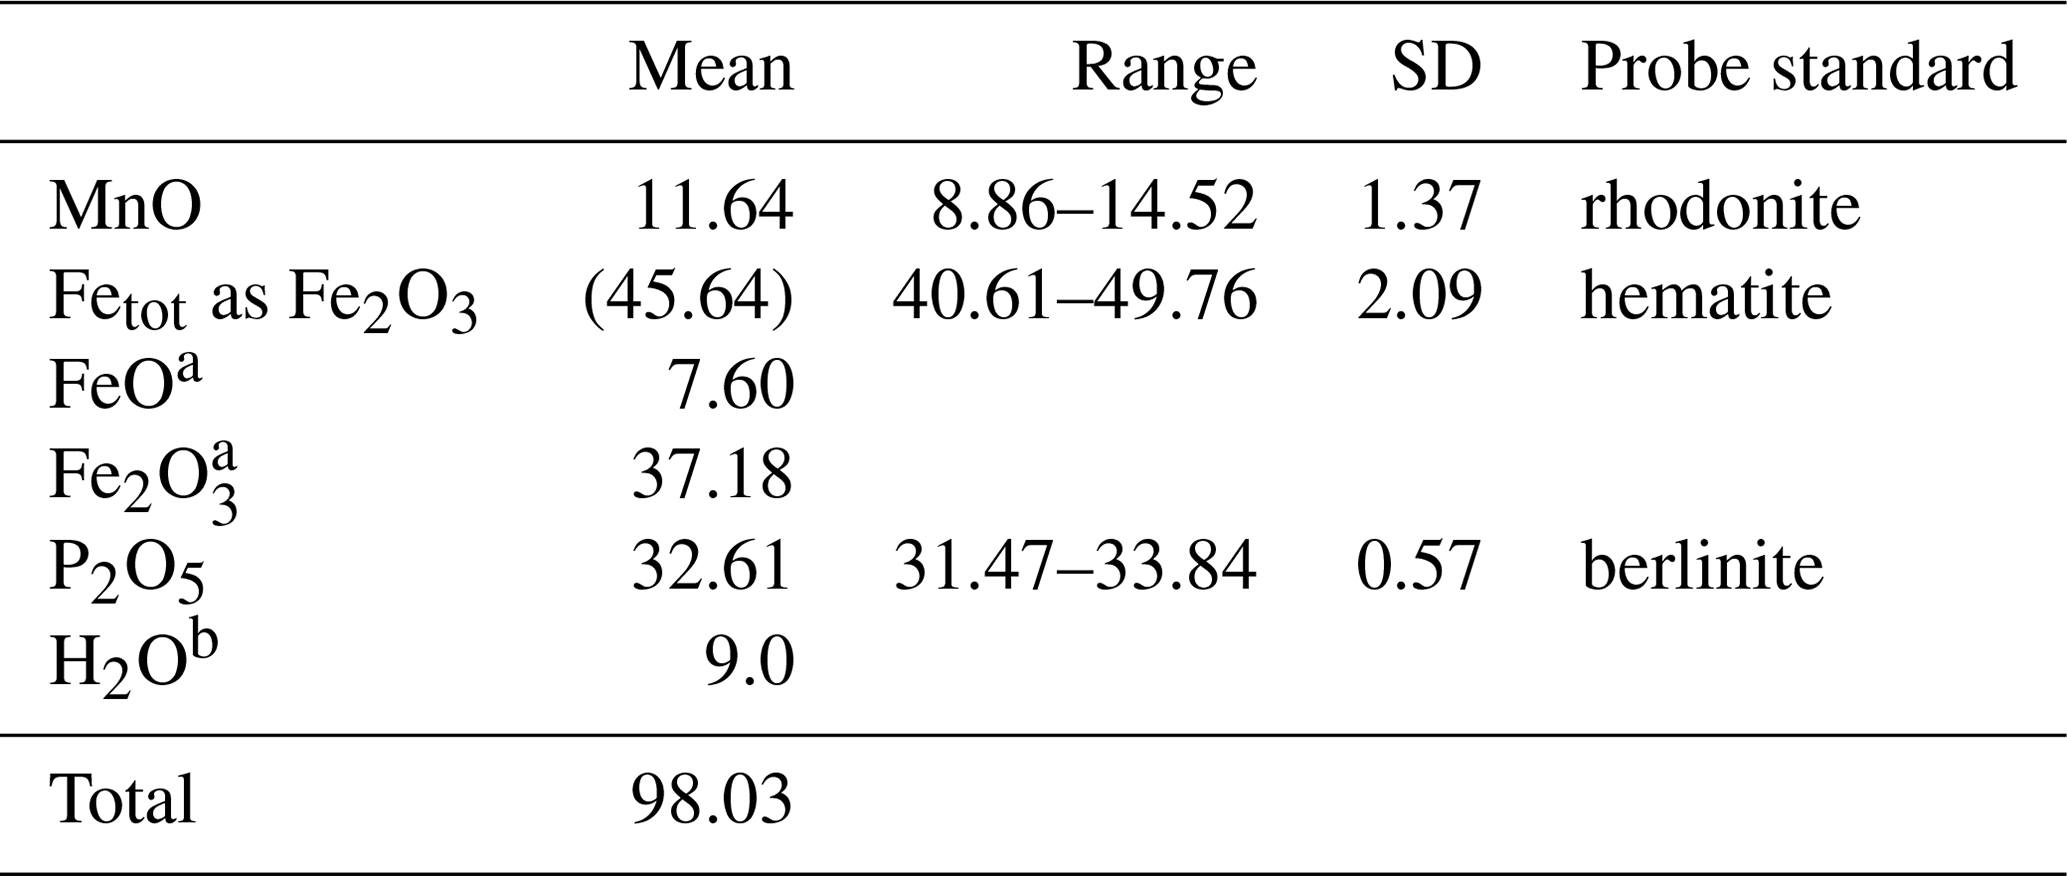
a Allocated based on Mössbauer spectroscopy. b Water based on the structure.
Table 3Powder X-ray data (d in Å) for manganrockbridgeite compared with those calculated from the structure. Only calculated lines with I≥4.5 are listed.
6.2 Single-crystal studies
A thin blade of manganrockbridgeite ( mm) was used for a data collection at ambient temperature on the same Rigaku diffractometer with the same radiation as used for the PXRD collect. The Rigaku CrystalClear software package was used for processing the diffraction data, including the application of an empirical absorption correction using the multi-scan method (Higashi, 2001). Due to the small crystal dimensions, the weak diffraction data were restricted to a resolution of 1.0 Å. A structural model for manganrockbridgeite in space group P2 was obtained using SHELXT (Sheldrick, 2015). The scattering curve for Fe was used for the M1 and M3 sites and that for Mn for the M2 site. Application of TWINROTMAT in WinGX (Farrugia, 1999) indicated that twinning by 2-fold rotation about c* was present. The twinning was implemented in JANA2006 (Petříček et al., 2014) and refinement with isotropic displacement parameters converged at wRobs=0.061 for 431 reflections with I>3σ(I). Further details of the data collection and refinement are given in Table 4. The refined fractional coordinates, isotropic displacement parameters, site occupancies and bond valence sums (BVSs) (Gagné and Hawthorne, 2015) are reported in Table 5. Polyhedral bond distances are given in Table 6.
Table 4Single-crystal X-ray data collection and refinement details.
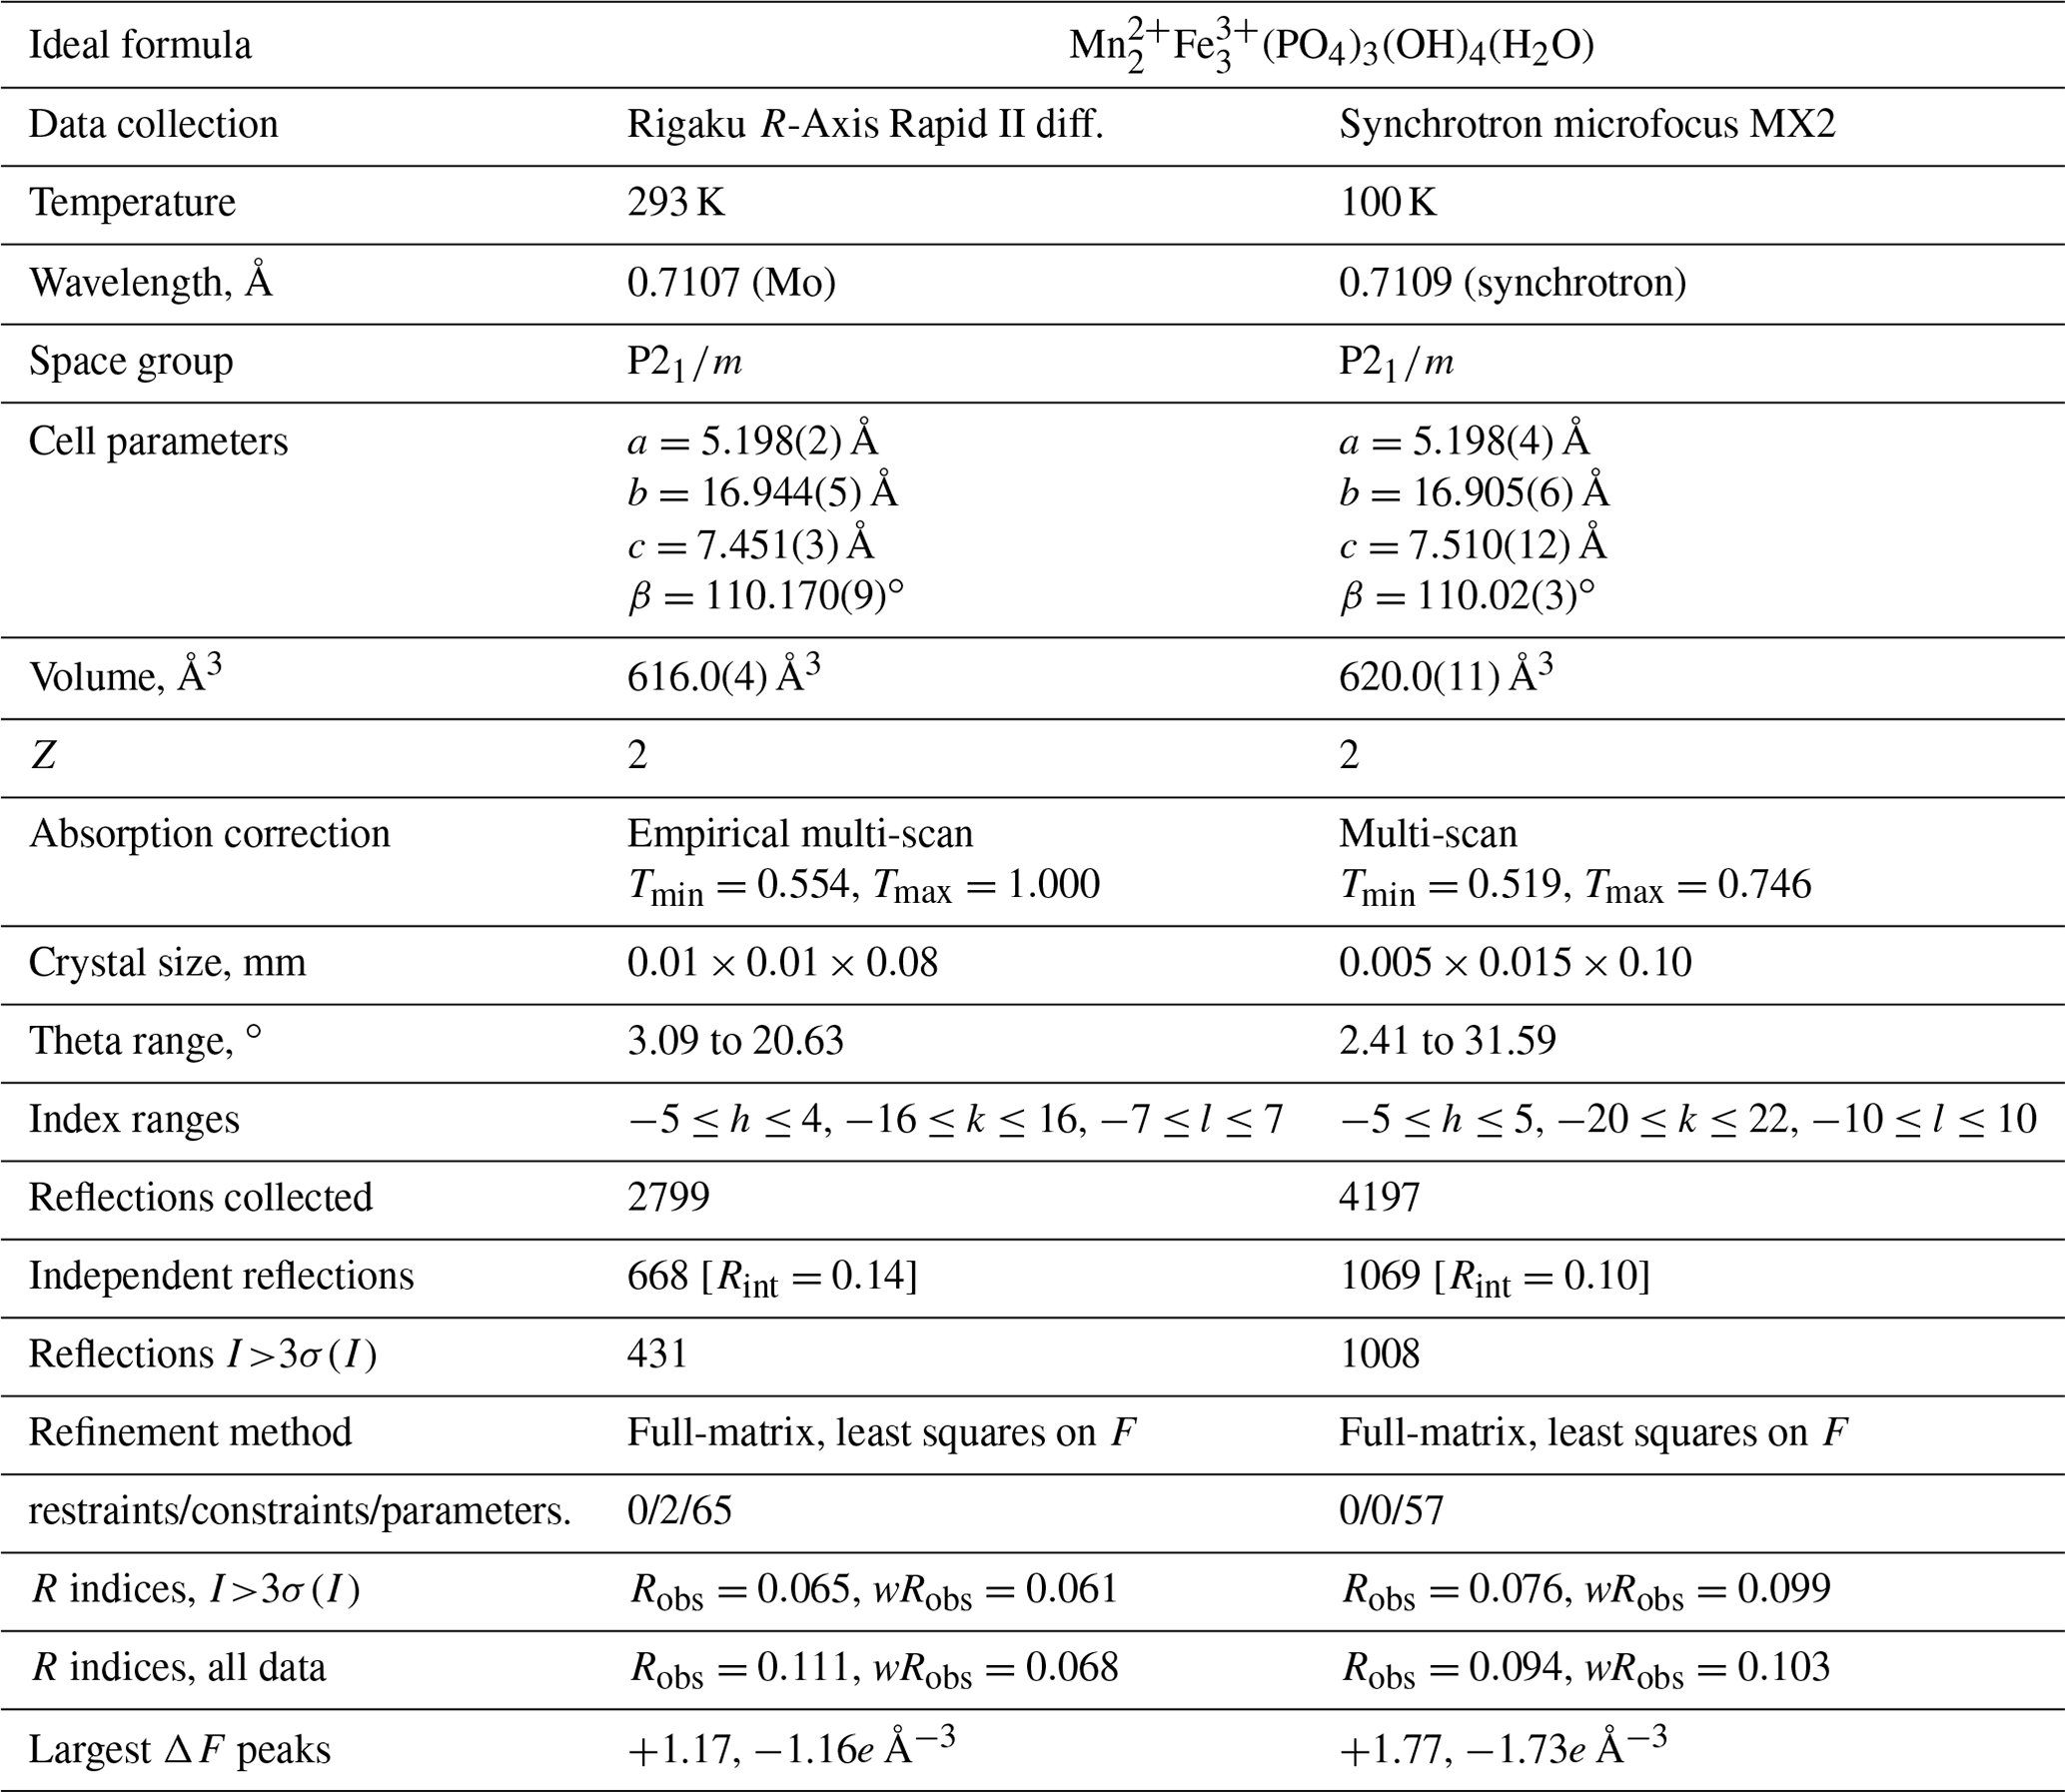
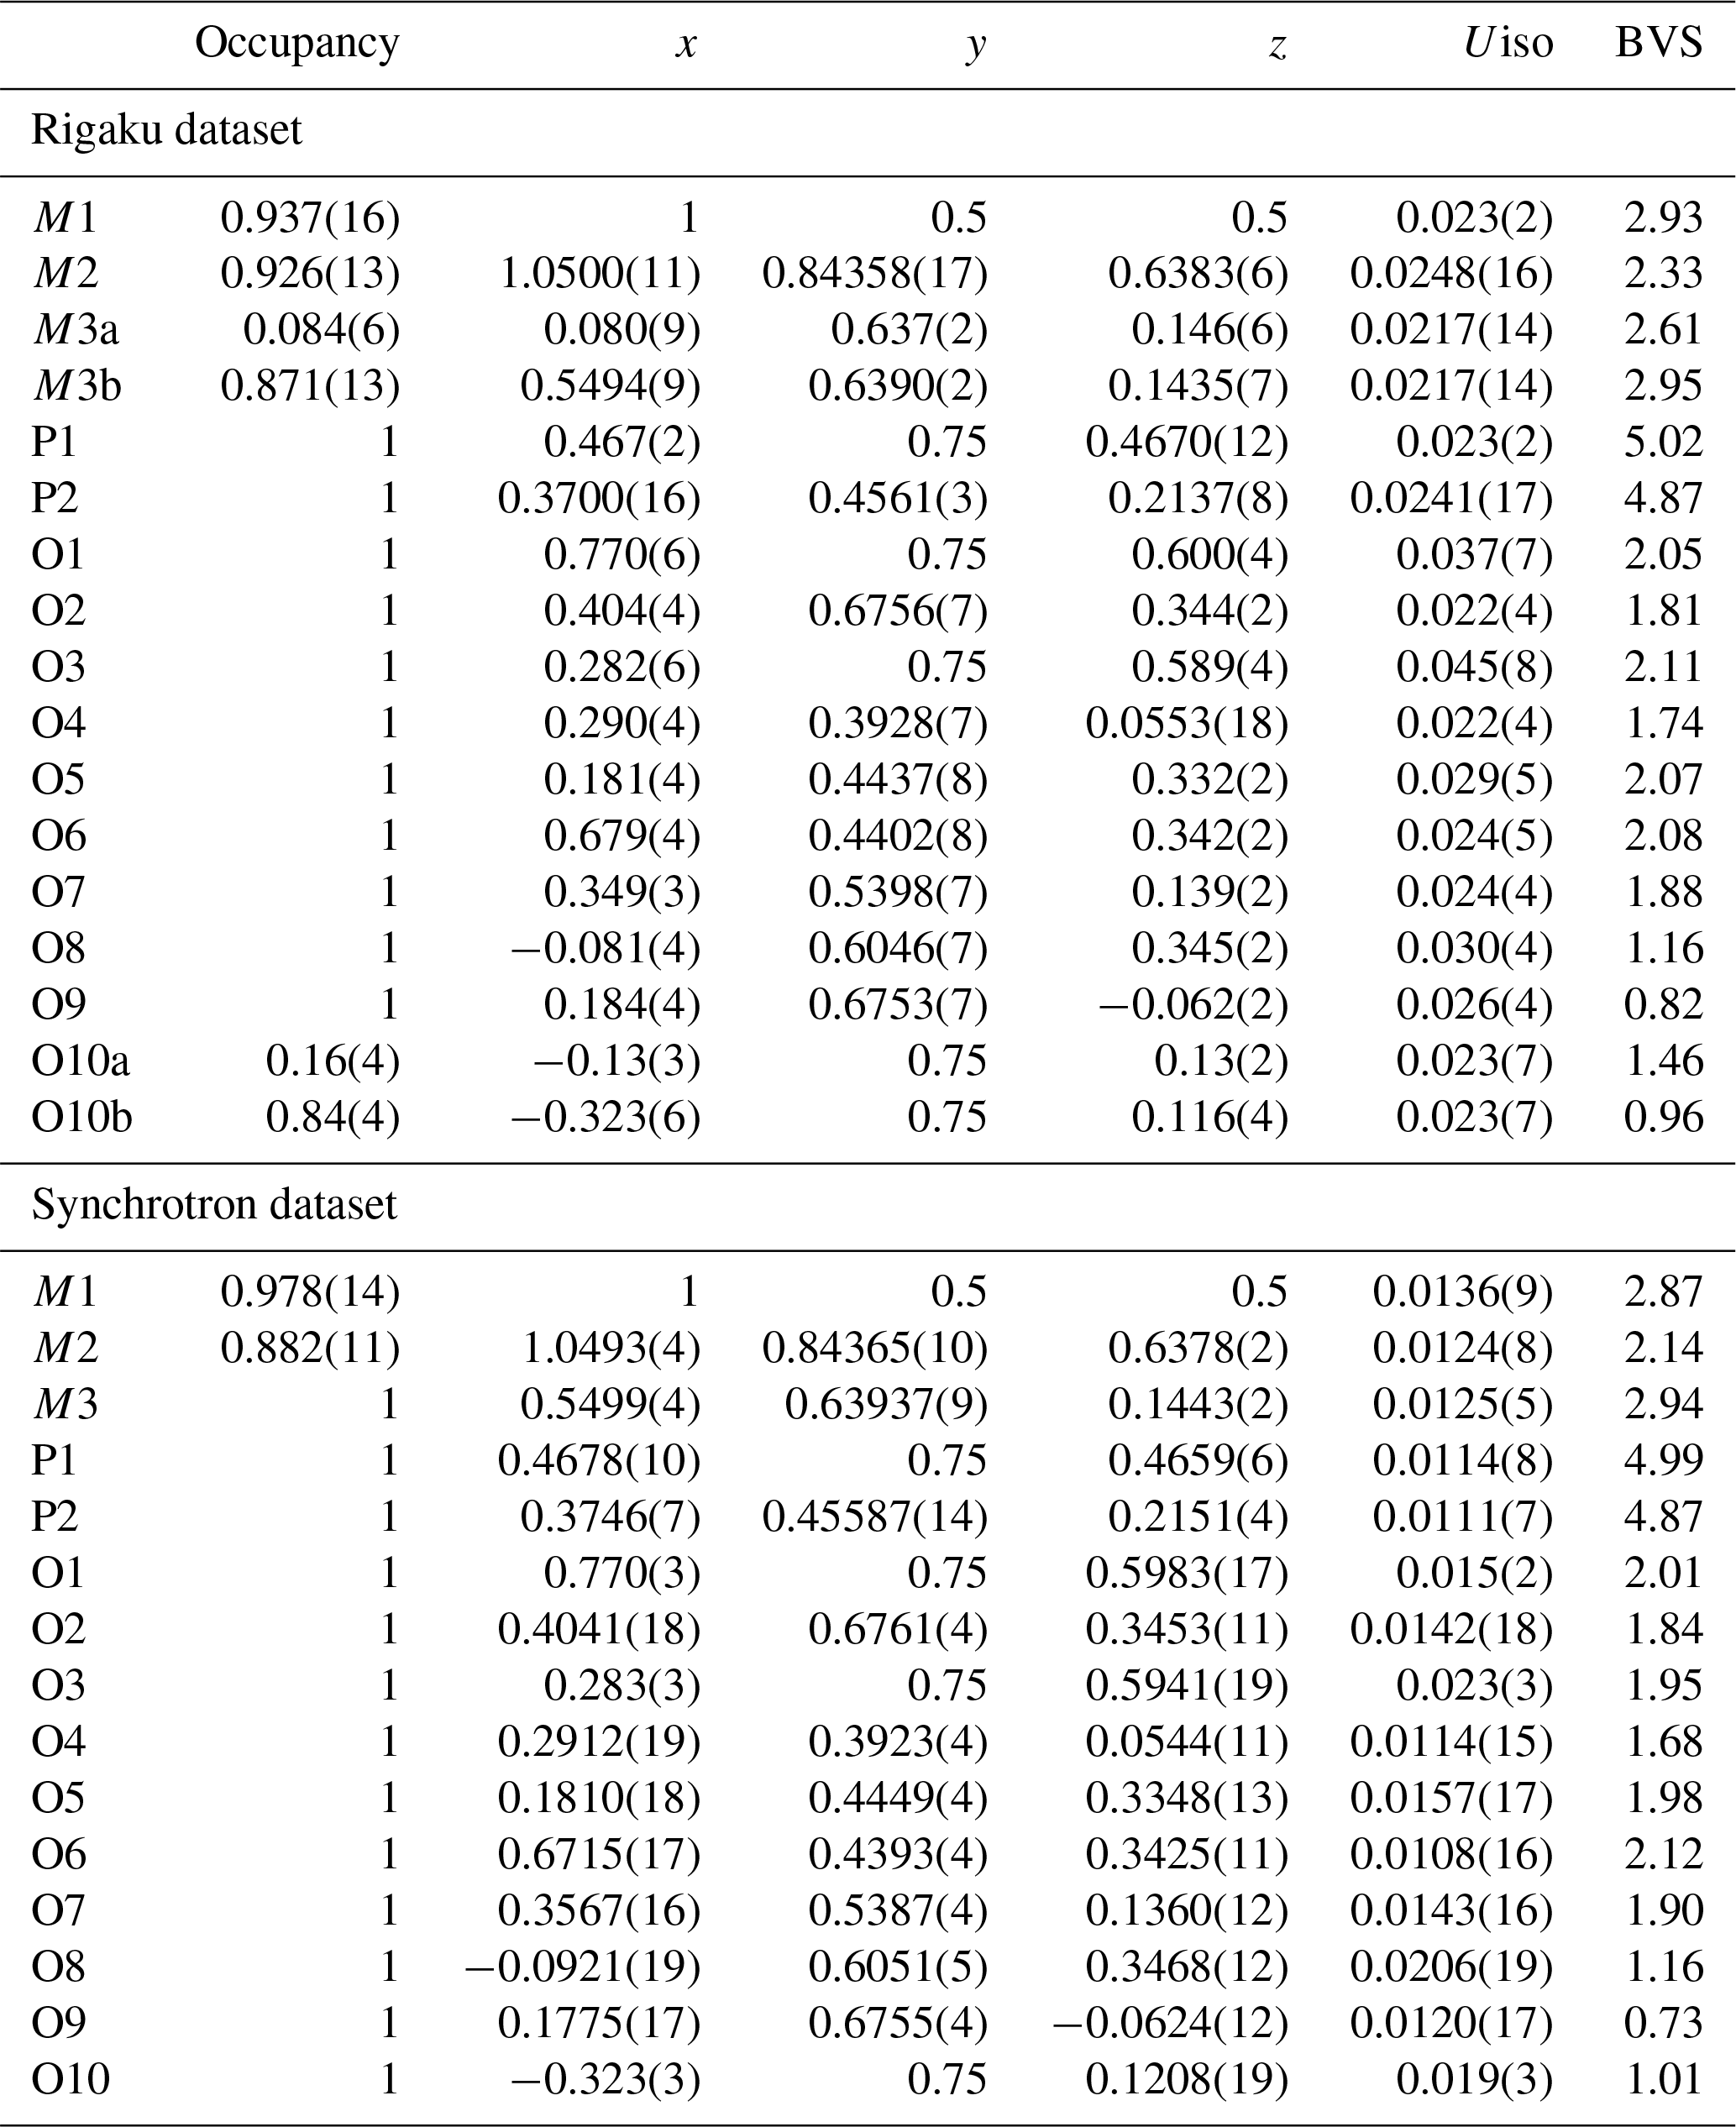
Table 5Fractional atom coordinates, isotropic displacement parameters (Å2), site occupancies and bond valence sums (BVSs, valence units) for manganrockbridgeite.
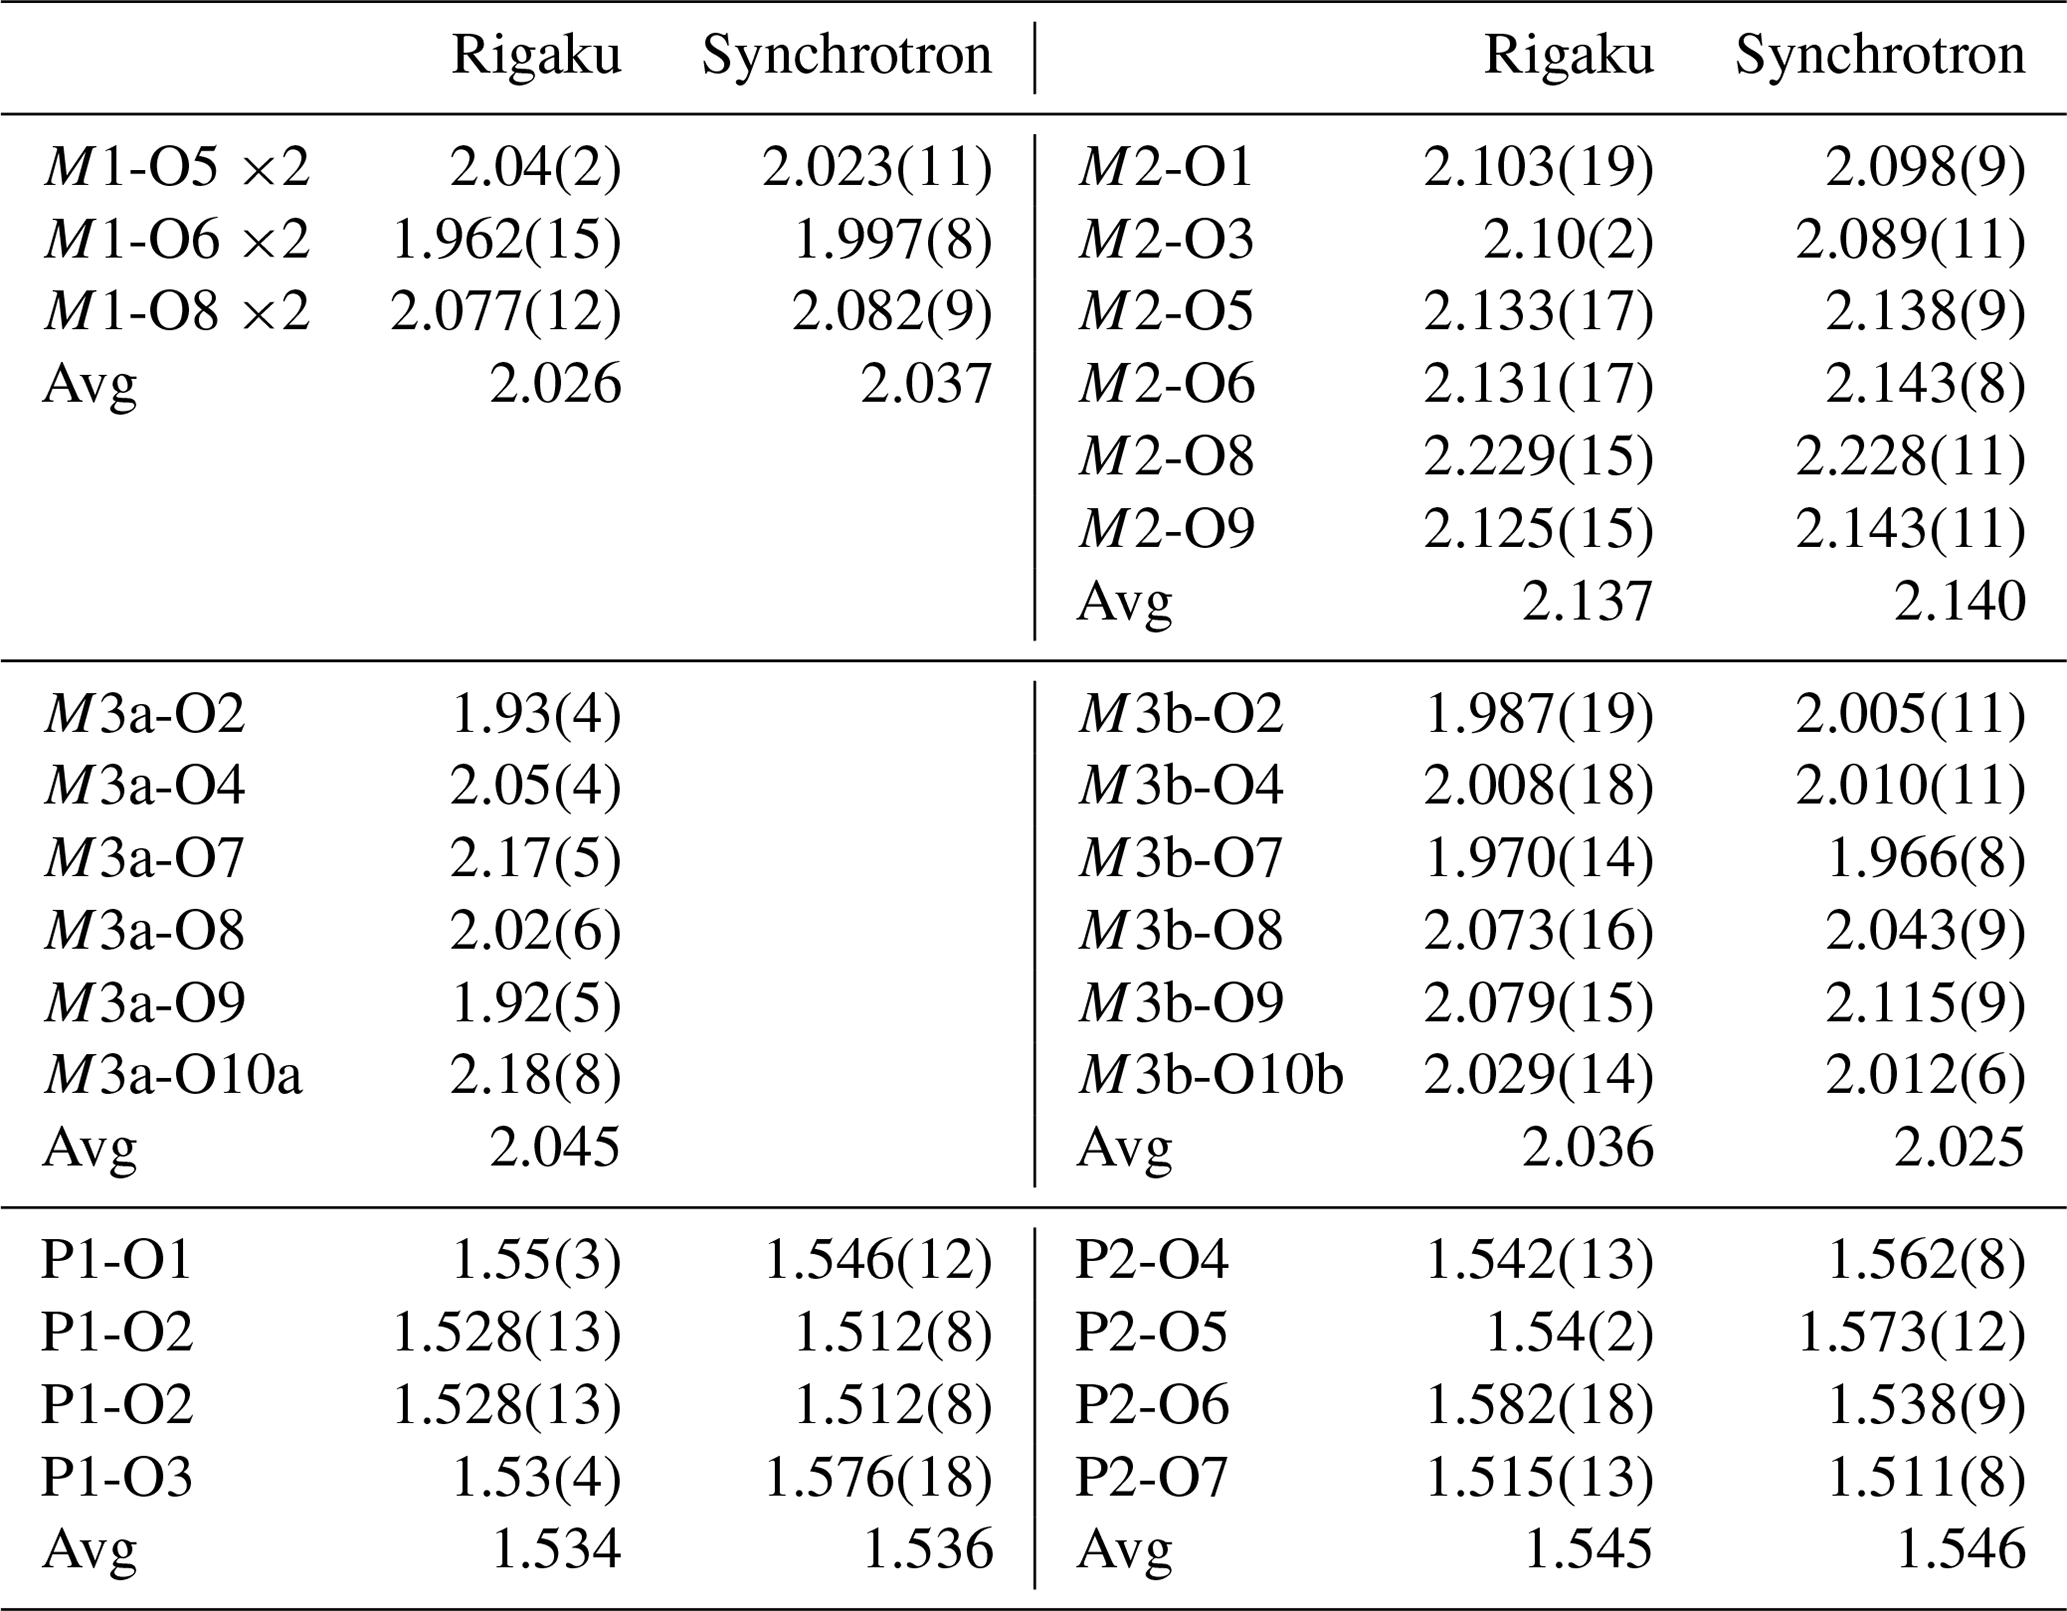
Several thin blades of manganrockbridgeite were also checked for diffraction quality at the Australian Synchrotron MX2 microfocus beamline (Aragao et al., 2018). The diffraction patterns showed multiply split spots due to diffraction from subparallel and splayed lamellae as shown in Fig. 3. The crystal showing the cleanest diffraction was used for a data collection. Intensity data were collected using a Dectris Eiger 16 M detector and monochromatic radiation with a wavelength of 0.7109 Å. The crystal was maintained at 100 K in an open-flow nitrogen cryostream during the data collection. The diffraction data were collected using a single 36 s sweep of 360∘ rotation around ϕ. The resulting dataset consists of 3600 individual images with an approximate ϕ angle of each image being 0.1∘. The raw intensity dataset was processed using XDS software to produce data files that were analysed using SHELXT (Sheldrick, 2015) and JANA2006 (Petříček et al., 2014). The data collection and refinement conditions are given in Table 4. Refined fractional coordinates, isotropic displacement parameters, site occupancies and bond valence sums (BVS) (Gagné and Hawthorne, 2015) are reported in Table 5. Polyhedral bond distances are given in Table 6.
Both the Rigaku and the synchrotron datasets were limited by the very small crystal sizes and the diffraction quality, as reflected in the relatively high merging Rint factors and the refinement Robs values (Table 4). Nevertheless, both datasets gave crystallographically consistent models, and the average polyhedral bond distances for both models in Table 6 are in close agreement.
It was not possible to obtain unambiguous location of hydrogen atoms in difference-Fourier maps for manganrockbridgeite. The BVS values close to 1 in Table 5 are consistent with O8, O9 and O10 being hydroxyl ions. The low BVS value of 0.82 for O9 suggests that H2O substitution for OH−, required for charge balance in the empirical formula, occurs predominantly at this site.
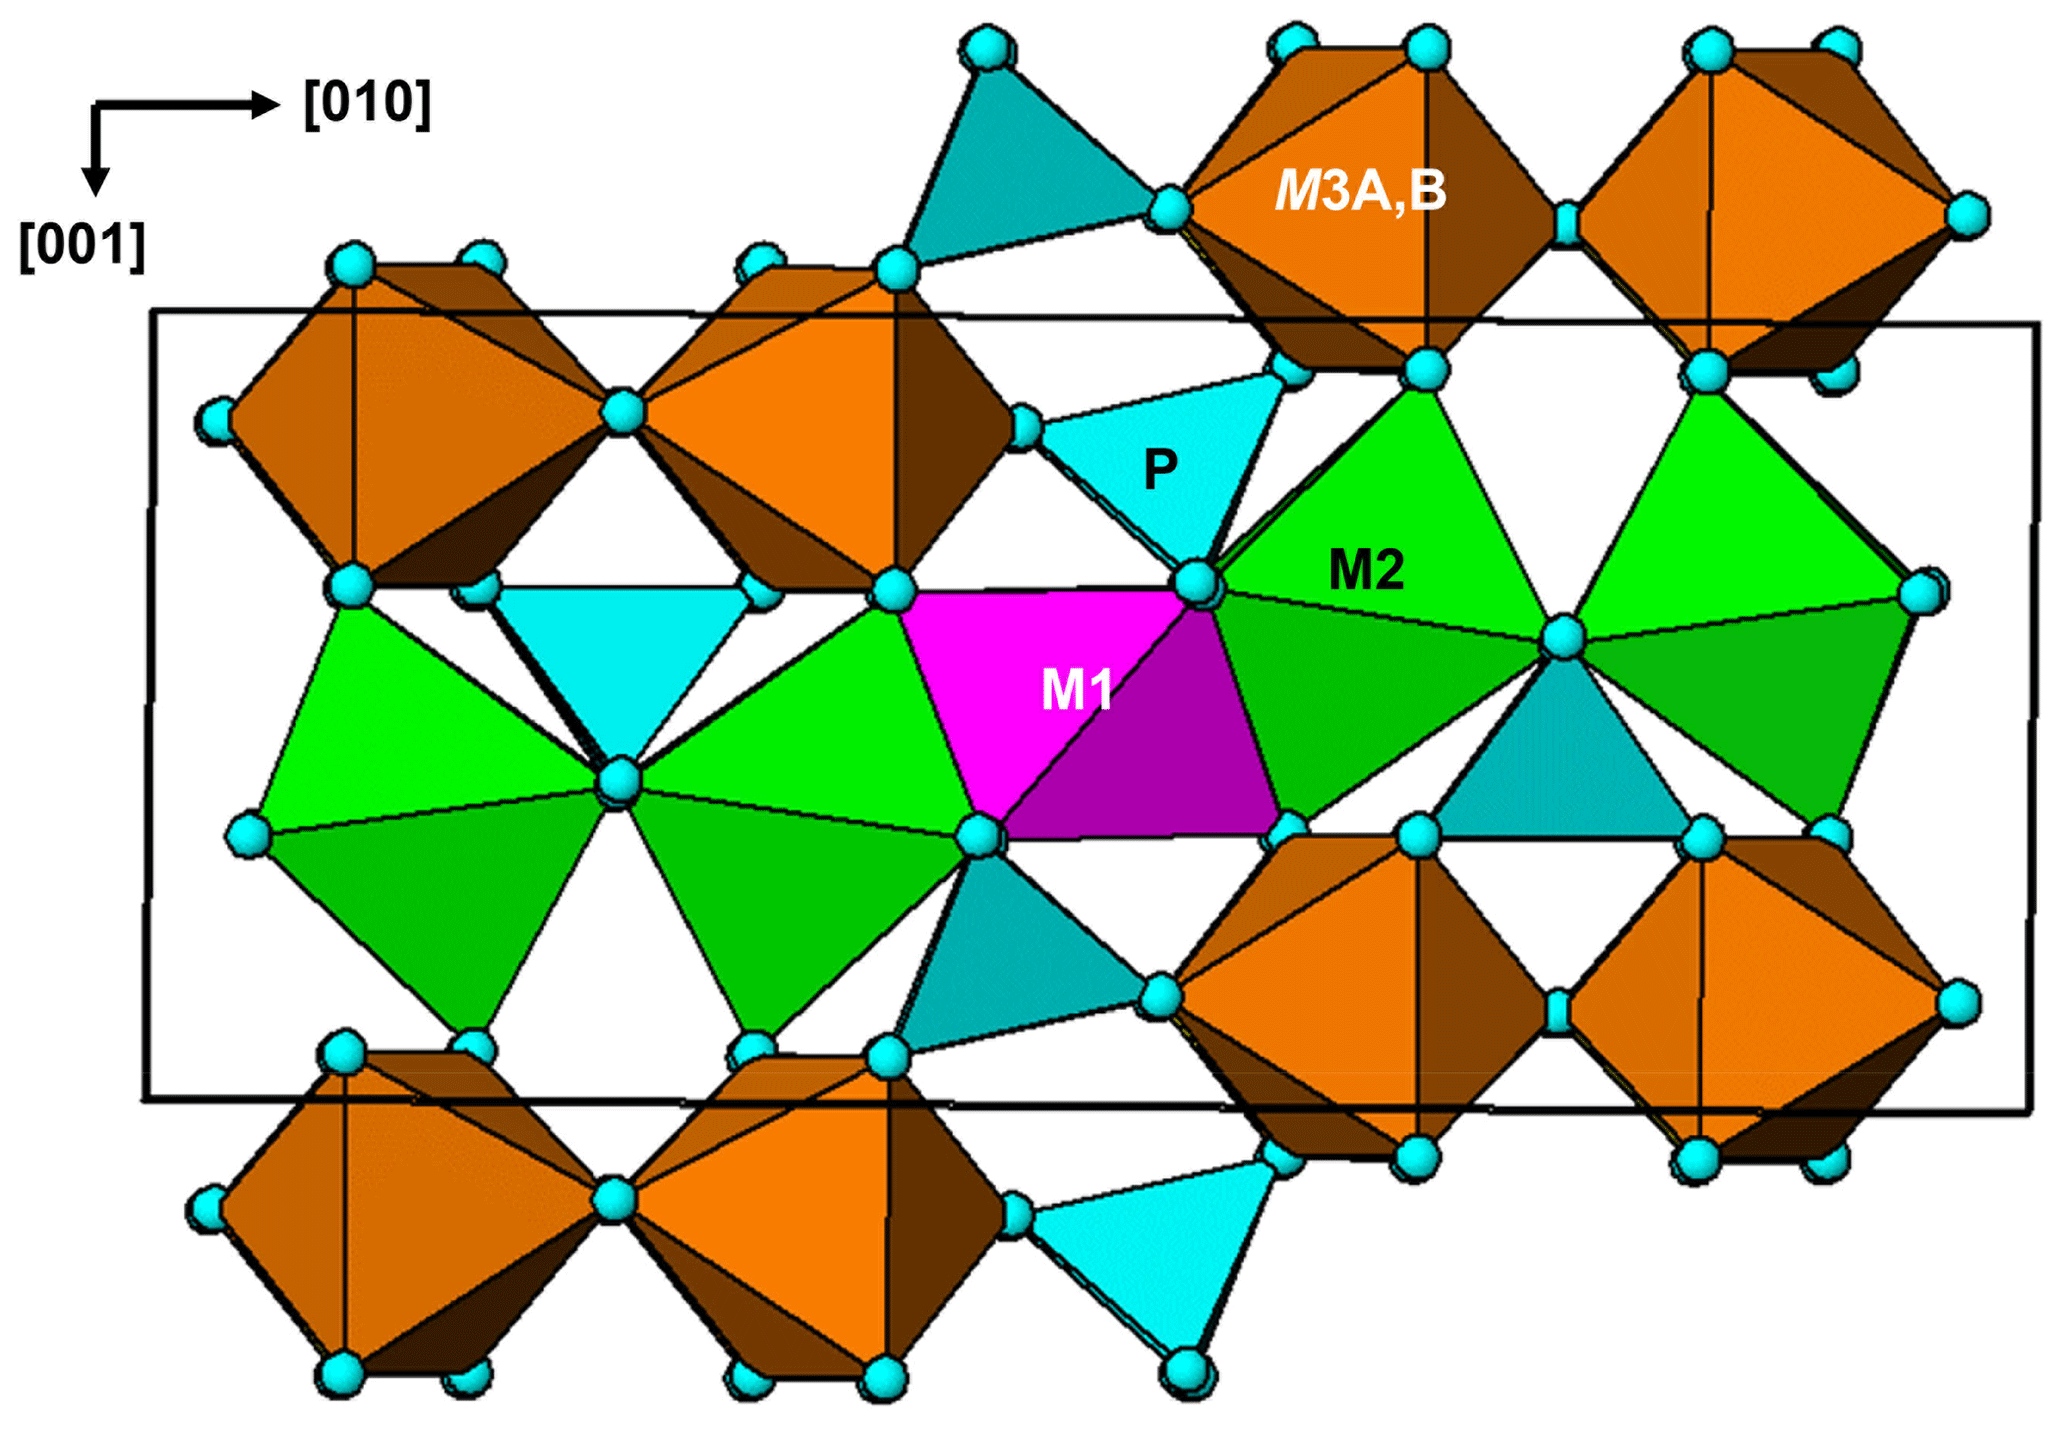

Figure 7Comparison of the M3 sites in (a) orthorhombic rockbridgeite-group minerals with (b) monoclinic manganrockbridgeite.
6.3 Description of crystal structure
A projection of the manganrockbridgeite crystal structure along the 5.2 Å a axis is shown in Fig. 6. The M1- and M2-centred octahedra form face-sharing trimers, M2–M1–M2, and these connect into chains along [010] by edge-sharing between the M2-centred octahedra and into (001) planes by corner-sharing with PO4 tetrahedra. These planes alternate with (001) planes containing dimers of corner-connected M3-centred octahedra that share faces along [100]. In the Bbmm rockbridgeite-type structure, Fig. 7a, the M3 sites are statistically half-occupied to avoid the physically unreasonable situation of M3–M3 distances of 2.6 Å (≡ 0.5a). In the P2 manganrockbridgeite structure the M3 sites are split into pairs of sites, M3a and M3b at x≈0 and x≈0.5, respectively, shown in Fig. 7b. There is a corresponding splitting of anion O10 into O10a coordinated to M3a and O10b, coordinated to M3b as shown in Fig. 7b. The results of site occupancy refinements are given in Table 5. Refinement of the crystal used for the Rigaku collect gave only 9 % occupancy at site M3a and 86 % occupancy at site M3b, whereas refinement of the crystal used for the synchrotron data collection gave full occupancy of the M3b site.
Manganrockbridgeite is a member of the rockbridgeite group, with a general formula for stoichiometric members of A2B3(PO4)3(OH,H2O)5 (Grey et al., 2019a). The letter A corresponds to the M2 crystallographic site, which contains all divalent cations, while B corresponds to the M1 and M3 sites, which contain predominantly Fe3+. The different members are distinguished by the dominant cations at the M2 site. The members are plimerite, with Zn dominant at the M2 site (Elliott et al., 2009); ferrorockbridgeite with Fe2+ dominant at M2 (Grey et al., 2019a); rockbridgeite and frondelite (Frondel, 1949; Lindberg, 1949) with co-dominant trivalent and divalent cations at the M2 site; and ferrirockbridgeite, (Fe)2(Fe3+)3(PO4)3(OH)4(H2O). The latter member is nonstoichiometric with a mix of Fe3+ and vacancies at the M2 site (Grey et al., 2019b). The ideal formulae and unit-cell parameters for the rockbridgeite-group minerals are given in Table 7.
Table 7Ideal formulae, A2B3(PO4)3X5, and unit-cell parameters for rockbridgeite-group minerals.
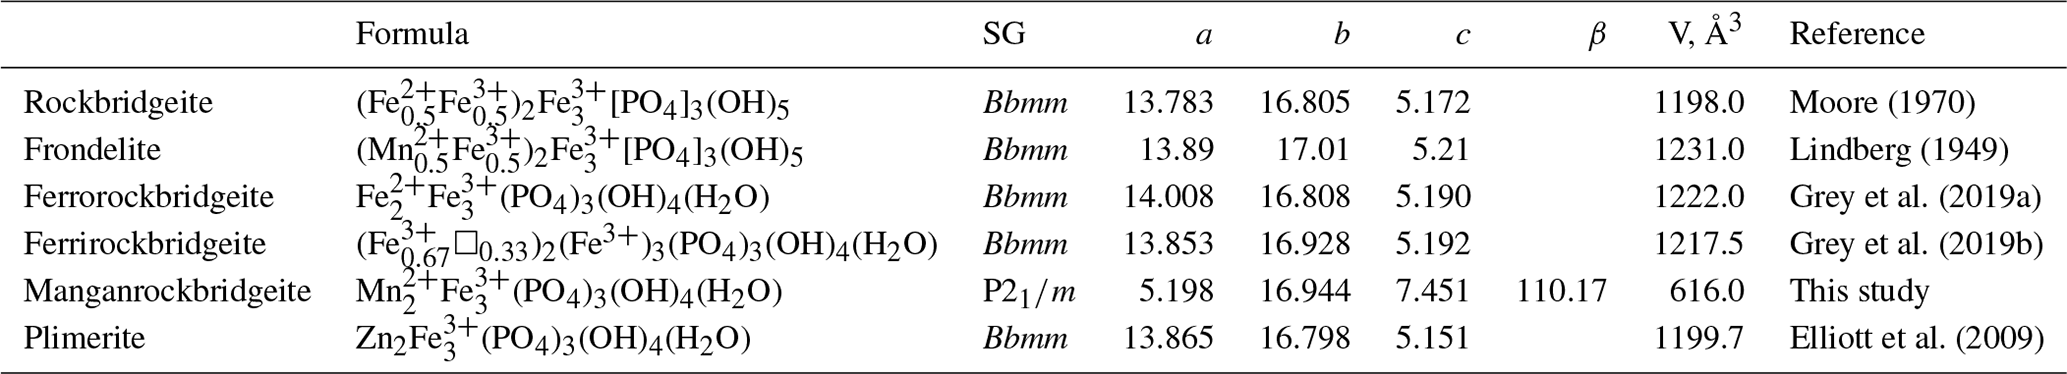
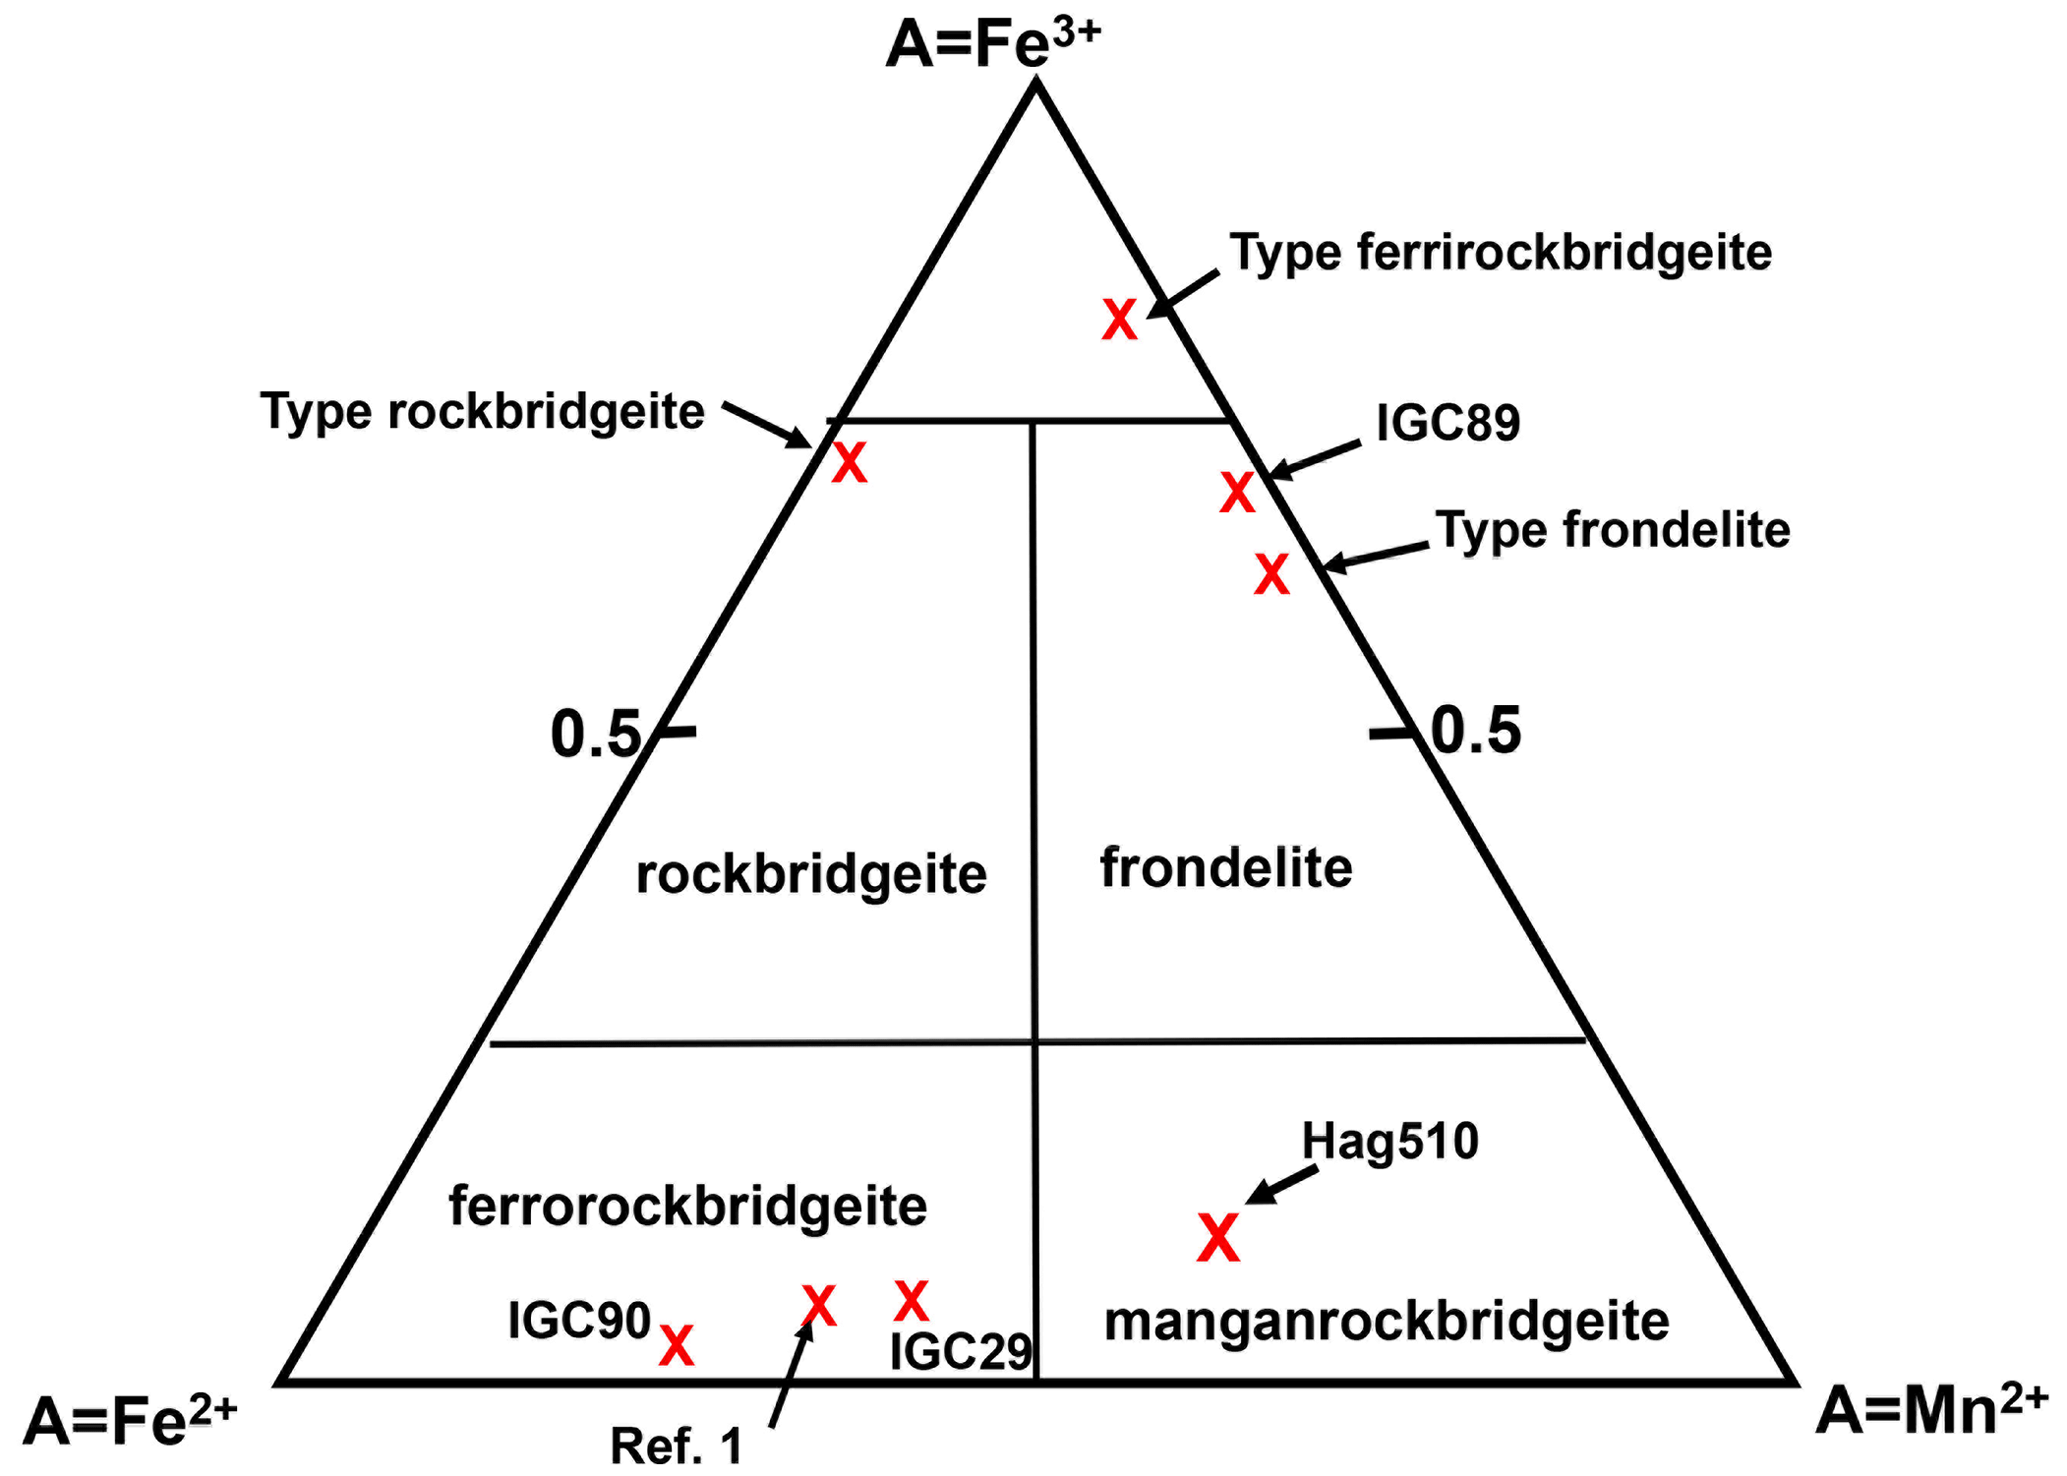
Figure 8Rockbridgeite-group mineral phase fields, based on the occupation of the M2 site by Mn2+, Fe2+ and Fe3+ (Grey et al., 2019b).
The phase fields for Mn–Fe2+–Fe3+ rockbridgeite-group minerals, based on molar occupancies of the M2 site, are shown in Fig. 8. The mean composition for manganrockbridgeite obtained from the EMP analyses and Mössbauer spectroscopy is shown for specimen Hag510 in the manganrockbridgeite phase field in Fig. 8. The other experimentally measured compositions, marked with crosses, are from Grey et al. (2019a, b).
Manganrockbridgeite is the only member of the rockbridgeite group with monoclinic symmetry. The equations converting the monoclinic unit-cell parameters for manganrockbridgeite to the Bbmm orthorhombic unit-cell parameters for other rockbridgeite minerals are given by the matrix (102, 010, −100). Applying this to the Rigaku single-crystal parameters in Table 4 gives the pseudo-orthorhombic parameters 13.988, 16.944, 5.198 Å, 90, 90.24 and 90∘, showing a small monoclinicity and a volume of 1232 Å3. For comparison, published unit-cell parameters for orthorhombic rockbridgeite-group minerals are reported in Table 7. Monoclinic manganrockbridgeite has long-range ordering of Fe3+ and vacancies in alternate sites along the 5.2 Å axis, whereas the orthorhombic rockbridgeite group minerals have only a local, short-range order of Fe3+ and vacancies at the M3 sites, manifested by broad humps in the PXRD patterns, as discussed by Grey et al. (2018).
Crystallographic data for manganrockbridgeite are available in the Supplement.
The supplement related to this article is available online at: https://doi.org/10.5194/ejm-35-295-2023-supplement.
RH and CR provided specimens, sample descriptions and specimen photos. IEG coordinated the research, analysed the data and wrote the paper. ARK did the optical characterisation of manganrockbridgeite and collected both powder- and single-crystal diffraction data for the mineral. CMM conducted the EMP analyses. SB collected and processed the SR SC data. JDC collected and processed the Mössbauer data. WGM helped analyse the single-crystal diffraction data.
The contact author has declared that none of the authors has any competing interests.
Publisher’s note: Copernicus Publications remains neutral with regard to jurisdictional claims in published maps and institutional affiliations.
We thank Matthew Glenn for help with a scanning electron microscopy examination of the specimen and for obtaining Fig. 3 and Cameron Davidson for preparing the specimen for electron microprobe analyses. This research was undertaken in part using the MX2 beamline at the Australian Synchrotron, part of ANSTO, and made use of the Australian Cancer Research detector. We acknowledge the Diffraction Laboratory at CSIRO Mineral Resources, Clayton, for use of their Philips X'PERT MPD XRD.
This paper was edited by Sergey Krivovichev and reviewed by two anonymous referees.
Aragao, D., Aishima, J., Cherukuvada, H., Clarken, R., Clift, M., Cowieson, N. P., Ericsson, D. J., Gee, C. L., Macedo, S., Mudie, N., Panjikar, S., Price, J. R., Riboldi-Tunnicliffe, A., Rostan, R., Williamson, R., and Caradoc-Davies, T. T.: MX2: a high-flux undulator microfocus beamline serving both the chemical and macromolecular crystallography communities at the Australian Synchrotron, J. Synch. Radiat., 25, 885–891, 2018.
Elliott, P., Kolitsch, U., Giester, G., Libowitzky. E., McCammon, C., Pring, A., Birch, W. D., and Brugger, J.: Description and crystal structure of a new mineral – plimerite, ZnFe(PO4)3(OH)5 – the Zn-analogue of rockbridgeite and frondelite, from Broken Hill, New South Wales, Australia, Mineral. Mag., 73, 131–148, 2009.
Farrugia, L. J.: WinGX suite for small-molecule single-crystal crystallography, J. Appl. Crystallogr., 32, 837–838, 1999.
Frondel, C.: The dufrenite problem, Am. Mineral., 34, 513–540, 1949.
Gagné, O. C. and Hawthorne, F. C.: Comprehensive derivation of bond-valence parameters for ion pairs involving oxygen, Acta Crystallogr. B, 71, 562–578, 2015.
Grey, I. E., Williams, T., Kampf, A. R., Cashion, J. D., Gozukara, Y., MacRae, C. M., and Keck, E.: Non-stoichiometry and local order in minerals with the rockbridgeite structure, Eur. J. Mineral., 30, 773–783, 2018.
Grey, I. E., Kampf, A. R., Keck, E., Cashion, J. D., MacRae, C. M., Gozukara, Y., Peterson, V. K., and Shanks, F. L.: The rockbridgeite group approved and a new member, ferrorockbridgeite, (Fe2+,Mn2+)2(Fe3+)3(PO4)3(OH)4(H2O), described from the Hagendorf Süd pegmatite, Oberpfalz, Bavaria, Eur. J. Mineral., 31, 389–397, 2019a.
Grey, I. E., Kampf, A. R., Keck, E., Cashion, J. D., MacRae, C. M., Gozukara, Y., and Shanks, F. L.: Ferrirockbridgeite, (Fe)2(Fe3+)3(PO4)3(OH)4(H2O), and the oxidation mechanism for rockbridgeite-group minerals, Eur. J. Mineral., 31, 585–594, 2019b.
Gunter, M. E., Bandli, B. R., Bloss, F. D., Evans, S. H., Su, S. C., and Weaver, R.: Results from a McCrone spindle stage short course, a new version of EXCALIBR, and how to build a spindle stage, The Microscope, 52, 23–39, 2004.
Higashi, T.: ABSCOR, Rigaku Corporation, Tokyo, 2001.
Keck, E., Grey, I. E., MacRae, C. M., Boer, S., Hochleitner, R., Rewitzer, C., Mumme, W. G., Glenn, A. M., and Davidson, C.: New secondary phosphate mineral occurrences and their crystal chemistry, at the Hagendorf Süd pegmatite, Bavaria, Eur. J. Mineral., 34, 439–450, https://doi.org/10.5194/ejm-34-439-2022, 2022.
Lindberg, M. L.: Frondelite and the frondelite-rockbridgeite series, Am. Mineral., 34, 541–549, 1949.
Mandarino, J. A.: The Gladstone-Dale relationship: Part IV, The compatibility concept and its application, Can. Mineral., 19, 441–450, 1981.
Moore, P. B.: Crystal chemistry of the basic iron phosphates, Am. Mineral., 55, 135–169, 1970.
Petříček, V., Dušek, M., and Palatinus, L.: Crystallographic Computing System JANA2006: General features, Z. Krist., 229, 345–352, 2014.
Redhammer, G. J., Roth, G., Tippelt, G., Bernroider, M., Lottermoser, W., Amthauer, G., and Hochleitner, R.: Manganoan rockbridgeite; structure analysis and 57Fe Mössbauer spectroscopy, Acta Crystallogr. C, 62, i24–i28, 2006.
Sheldrick, G. M.: Crystal structure refinement with SHELXL, Acta Crystallogr. C, 71, 3–8, 2015.