the Creative Commons Attribution 4.0 License.
the Creative Commons Attribution 4.0 License.
 | 22 Dec 2023
In situ study of the reaction phase A plus high-P clinoenstatite to forsterite plus water at reduced water activity
Christian Lathe
Monika Koch-Müller
Bernd Wunder
Oona Appelt
Melanie Sieber
Shrikant Bhat
Robert Farla
We examined the reaction phase A plus high-P clinoenstatite to forsterite plus water (Reaction R1) by means of in situ X-ray diffraction measurements with the large volume press at the synchrotron PETRA III, Hamburg. Contrary to the study of Lathe et al. (2022), in which all experiments on Reaction (R1) were performed at a water activity of 1, the reversed experiments presented in this study were performed at reduced water activity with mole fractions of about . The intention of this investigation was to test the observation made by Perrillat et al. (2005), which was that dehydration reactions are kinetically faster at reduced than under water-saturated conditions.
The position of Reaction (R1) at the reduced conditions was determined by reversal brackets at 9.1 and 9.5 GPa (630 and 700 ∘C), at 9.7 and 10.0 GPa (725 and 700 ∘C), at 9.8 and 10.2 GPa (675 and 750 ∘C), and at 10.5 GPa (675 and 740 ∘C). Additionally, we performed two offline experiments with brackets at 10.0 and 10.6 GPa (750 and 700 ∘C, respectively) that are in agreement with the results of the in situ experiments. We do not observe any “intermediate” precursor phase in our experiments. The equilibrium of Reaction (R1) is shifted by about 100 ∘C to lower temperature compared to the results under water-saturated conditions. Thus, at a water activity () below 1 the phase A plus clinoenstatite dehydration reaction can only occur in extremely cold subduction slabs.
The kinetics of Reaction (R1) dehydration at reduced water activity is slower than that determined previously by Lathe et al. (2022) under water-saturated conditions. Thus, the above-mentioned hypothesis of Perrillat et al. (2005) could not be confirmed. However, in both of our studies on Reaction (R1), the newly formed dehydration product forsterite was of nanometer size, which supports earlier experimental observations, which is that product phases of dehydration reactions are generally very fine-grained and might promote the concept that intermediate-depth earthquakes in subduction zones are initiated by mechanical instabilities from extremely fine-grained materials formed during dehydration reactions.
- Article
(2042 KB) - Full-text XML
-
Supplement
(682 KB) - BibTeX
- EndNote


To what extent and through which phases is water transported into the deeper mantle by subduction, at what depths do these phases dehydrate, and which processes are initiated thereby remain open and frequently discussed questions in relation to the deep-water cycle and our understanding of seismic processes. Serpentine is the most abundant H2O-bearing phase found in hydrothermally altered oceanic crust. Its stability is limited to temperatures below about 700 ∘C, and it thus dehydrates during subduction at depths of about 150–200 km. Beyond these depths, dense hydrous magnesium silicates (DHMSs) (e.g., humite-group phases, phase A, phase E, and superhydrous phase B) are considered to be further carriers of water to depths of the mantle transition zone (e.g., Sanchez-Valle et al., 2008; Shirey et al., 2021) – phase D may even transport water to the lower mantle (Frost and Fei, 1998).
In cold environments, phase A, Mg7Si2O8(OH)6, is viewed as a key phase for water transfer down to the transition zone. A typical hydrated harzburgite may consist of pyroxene, forsterite, and phase A. Thus, the reaction
and its pressure (P) and temperature (T) dependence are of significant importance (Liu, 1987; Wunder, 1998; Hacker et al., 2003). Recently, Lathe et al. (2022) reinvestigated the exact position of Reaction (R1) under water-excess conditions and confirmed the equilibrium data reported by Wunder (1998).
Dehydration reactions of DHMSs might also be associated with various water-influenced processes (Ferrand et al., 2017; Shirey et al., 2021), e.g., melt formation or generation of deep earthquakes. Mechanical instabilities for triggering seismicity due to dehydration reactions are especially favored in cases when the reaction products are extremely fine-grained (Ferrand et al., 2017) and/or the reactions are kinetically rapid (Chollet et al., 2011). Perrillat et al. (2005) investigated the dehydration of antigorite and observed that under water-undersaturated conditions the antigorite dehydration, although being significantly shifted to lower temperatures, is much faster than under water-saturated conditions. Lathe et al. (2022) showed that the kinetics of Reaction (R1) under water-saturated conditions is extremely slow and that the dehydration product forsterite is nanocrystalline. Thus, the initiation of seismicity from this reaction could only be favored from the fine-grained reaction product formed.
Here, we determine the P–T coordinates and kinetics of Reaction (R1) under water-undersaturated conditions using in situ X-ray diffraction with synchrotron radiation sources, compare these data with our former results for Reaction (R1) (Lathe et al., 2022), and discuss the relevance of dehydration reactions for triggering intermediate-depth earthquakes in subduction zones.
2.1 Synthesis and characterization of the starting materials and run products
Starting materials for the reversed equilibrium experiments consisted of a mixture of phase A, low-P clinoenstatite (space group , and forsterite with a molar ratio of the solids according to Reaction (R1). Synthesis, characterization methods, and properties of these starting materials are identical to the detailed specifications given in Lathe et al. (2022), and some characteristics are shown in Table S1. The grain size distribution of the three solids in the starting material of this study was homogeneous, and the grains are smaller than 20 µm. The recovered samples of all experimental runs except for run 705 (Table 1) were investigated by electron probe microanalysis, EPMA (backscattered electron (BSE) images; point analyses; Si element mapping), for phase identification and textural observations and Raman spectroscopy (Fig. S1) to verify the water content (see Lathe et al., 2022).
2.2 Experimental procedure
2.2.1 Water activity in the experimental runs
Contrary to the study of Lathe et al. (2022), in which all experiments on Reaction (R1) were performed at a water activity of 1, the reversed experiments presented in this study were carried out with a lower water activity. This was achieved by adding water and silver oxalate (Ag2C2O4) with the solid mixture to the capsules. To avoid the formation of an alloy between Ag and the Ti capsules used (see below) in the experiments, Ag2C2O4 was filled into small open Pt capsules (1.15 mm length, 1.39 mm in diameter) that were placed at the bottom of the Ti capsule (Fig. S2).
At temperatures above about 200 ∘C Ag2C2O4 decomposes to produce CO2 according to the reaction Ag2C2O4= 2Ag + 2CO2. Water and silver oxalate were added in a mass ratio of 1:8.4 to the capsule to achieve a mole fraction of of 0.5 during the experiments at conditions close to the equilibrium curve. We assume the system is fluid-saturated, and by bracketing Reaction (R1) the mole fraction of H2O does not change very much. We observe a reaction progress of less than 10 %; thus due to water release (growth of forsterite from phase A plus clinoenstatite) and decrease by water consumption (breakdown of forsterite to phase A plus clinoenstatite), remains more or less constant.
2.2.2 In situ multi-anvil press experiments
Five in situ multi-anvil experiments were carried out at the beamline station P61B, PETRA III, at DESY, Hamburg, Germany. The synchrotron is operating in a top-up mode with energy of 6 GeV and current of 120 mA. The high-energy white-beam beamline is operated using energy-dispersive X-ray diffraction with a Ge solid-state detector (SSD) and a multichannel analyzer (MCA) to collect the diffraction patterns in the energy range of 30–160 keV. The channel to energy relationship of the SSD–MCA was calibrated using the gamma ray lines of different metals (57Co and 133Ba). The large volume press, a Hall-type six-ram instrument (mavo press LPQ6 1500-100; Max Voggenreiter GmbH, Germany), can achieve a maximum combined press load of 1500 t (∼ 620 bar (62 MPa) oil pressure in each of the six hydraulic rams).
We used a standard (octahedral edge/cube truncation) assembly, which consists of an octahedron made of MgO (mixed with 5 % Cr2O3) and which has cylindrical drilling. The drilling is filled with the other pressure-transmitting MgO parts, the stepped graphite heater (to minimize a temperature gradient), the sample container, and the type C thermocouple (precision about ± 10 ∘C). The thermocouple tip was in contact with boron nitride (BN) powder to prevent the oxidation of the thermocouple wires. The absence of a temperature gradient was verified by applying the 2-pyroxene geothermometer (see Müller et al., 2017). Within the 2 mm long capsule the temperature was homogenously distributed at ± 30 ∘C. The variation is not due to a real temperature variation but due to the limitation of the electron microprobe (EMP) analyses (mixed analyses). The sample material was placed in 2 mm long Ti capsules together with a smaller Pt capsule as the container of the silver oxalate (Fig. S2). We used Ti because it is one of the most transparent metals for white X-rays (Chinnery et al., 1999) and can be sealed watertight. For details of the experimental setup, see Lathe et al. (2022).
The assembly was first compressed to the target pressure at room temperature and then heated stepwise to a target temperature. The assembly was first compressed to the target pressure at room temperature and then heated stepwise to a target temperature. We employed the pressure-transmitting MgO just outside the sample container as a marker for the in situ pressure measurements and the exact position of the detector at a 3∘ diffraction angle. We used the (111), (200), and (220) reflections of periclase along with the calibration reported by Tange et al. (2009) to calculate the pressure with a precision of ± 0.1 GPa. The peaks were fitted with the symmetric pseudo-Voigt function in the open-source program PDIndexer ver4.441. Throughout the experiment, the pressure was measured multiple times as the temperature and pressure were gradually changed to reach the desired target conditions. Additionally, pressure measurements were taken during the annealing process. In certain experiments, a slight decrease in pressure was observed, and an average pressure value was subsequently calculated for these instances.
The experiments were carried out in the pressures range 7.7–10.6 GPa and temperatures ranging from 550 to 750 ∘C. Thus, we expect high-P clinoenstatite (space group ) to be present instead of starting material low-P clinoenstatite (Angel and Hugh-Jones, 1994). The procedure during the equilibrium experiments was the following: we first increased the pressure 10 % above the target pressure; then we started heating from room temperature to temperatures close to the expected phase transition. The pressure and temperature were held constant, and we monitored the reaction progress by collecting the X-ray diffraction pattern in situ. For detecting the reaction progress, we monitored in detail the intensity changes in the strongest reflections of the different phases that do not overlap with reflections of the other phases. After determining the reaction direction, e.g., growth of phase A and high-P clinoenstatite at 10.0 GPa and 700 ∘C within 53 min (run 599; Tables 1 and S2), we increased the temperature to 725 ∘C and decreased pressure to 9.7 GPa to bracket the reaction. We collected X-ray diffraction patterns until the growth of forsterite was unambiguously determined after 122 min. All other in situ experiments are performed in a similar way.
It is reasonable to assume that the relative integral intensities of the diffraction peaks are directly related to the weight fraction of the phase. This assumption is based on the fact that the X-ray absorption coefficient remains constant throughout the transformation process. The line profile was determined by employing a Gaussian distribution, which was measured using a solid-state detector (e.g., Lauterjung and Will, 1985). We calculated the transformed volume by analyzing the relative peak intensities of the (110) diffraction peaks of phase A. Additionally, we used the reflections (111), (131), (122), and (122) of forsterite, which resulted in similar growth rates (see Table 1), to determine the transformation X (t). The intensity of the peaks was fitted with the symmetric pseudo-Voigt function in the open-source program PDIndexer ver4.441, and we used the height of the reflections as the measure for the intensities. A typical value for full width at half maximum (FWHW) is about 0.03 keV for the fitted peaks. The degree of transformation X (t) is determined by dividing the intensity of the diffraction peak of phase A and forsterite at time t (Iat) by the value at time t0 (I0). The transformation intensities of the reflections (110) of phase A and (021) of forsterite are plotted as as a function of time.
2.2.3 High-pressure multi-anvil quench experiments
Two high-pressure offline experiments (labeled MA622 and MA628) were performed using the multi-anvil press at GFZ Potsdam (Table 1). To be consistent with the in situ experiments performed at beamline P61B, we used the same assembly as described above. The press was calibrated by press load experiments, using high-pressure–high-temperature phase transformations such as quartz–coesite, coesite–stishovite, garnet–perovskite (CaGeO3), and forsterite-wadsleyite. Details of the experimental setup of the multi-anvil press at GFZ Potsdam are given in Koch-Müller et al. (2021).
2.3 Thermodynamic modeling
Phase diagrams in the MgO–SiO2–H2O–CO2 system were calculated with perple_X using the volatile free bulk composition of the starting material at and saturated with a CO2+ H2O fluid with . Since those calculations consider a simplified COH fluid model containing only neutral species such as CO2 and H2O, an attempt was made to use the deep earth water model incorporating aqueous speciation (Sverjensky, 2019). Details are provided in the Supplement.
Compared to the results performed under water-saturated conditions (Lathe et al., 2022), the reaction under water-reduced conditions is shifted by about 100 ∘C to lower temperature. Run conditions and results are shown in Table 1 and Fig. 1. In Fig. 1 we also compare the results of the thermodynamic modeling for and with the experiments. The modeling results for compare well with the results of Lathe et al. (2022), while the modeling results for are slightly shifted to higher temperatures compared to the experiments. The reaction is extremely sluggish especially at low temperatures (e.g., run 645): no reaction was observed in the T range 550–600 ∘C at 7.7–7.9 GPa for 277 min (Fig. 1).
EMP analyses of the recovered samples revealed only the presence of forsterite, phase A, and low-P clinoenstatite – no intermediate phase was observed as reported from other dehydration reactions (e.g., Perrillat et al., 2005; Incel et al., 2017; Koch-Müller et al., 2021). Thus, depending of the P–T conditions, forsterite directly breaks down to phase A plus high-P clinoenstatite even under water-undersaturated conditions, and phase A plus high-P clinoenstatite reacted directly to forsterite plus water. In some runs, in addition, SiO2 quench phases can be reported, but its amount is negligible. One run (MA 622) showed a very small amount of magnesite accumulated in a crack. As described for Reaction (R1) under water-saturated conditions in Lathe et al. (2022), the newly formed forsterite at reduced water activity is also of nanometer size (Figs. 2 and 4). As analyzed by Raman spectroscopy, phase A still contains its stoichiometric water content, and forsterite and low-P clinoenstatite contain traces of water in parts per million (Fig. S1).
Table 1Results of quench experiments at GFZ Potsdam and equilibrium experiments at DESY, including their starting material, experimental conditions, and reaction progress.
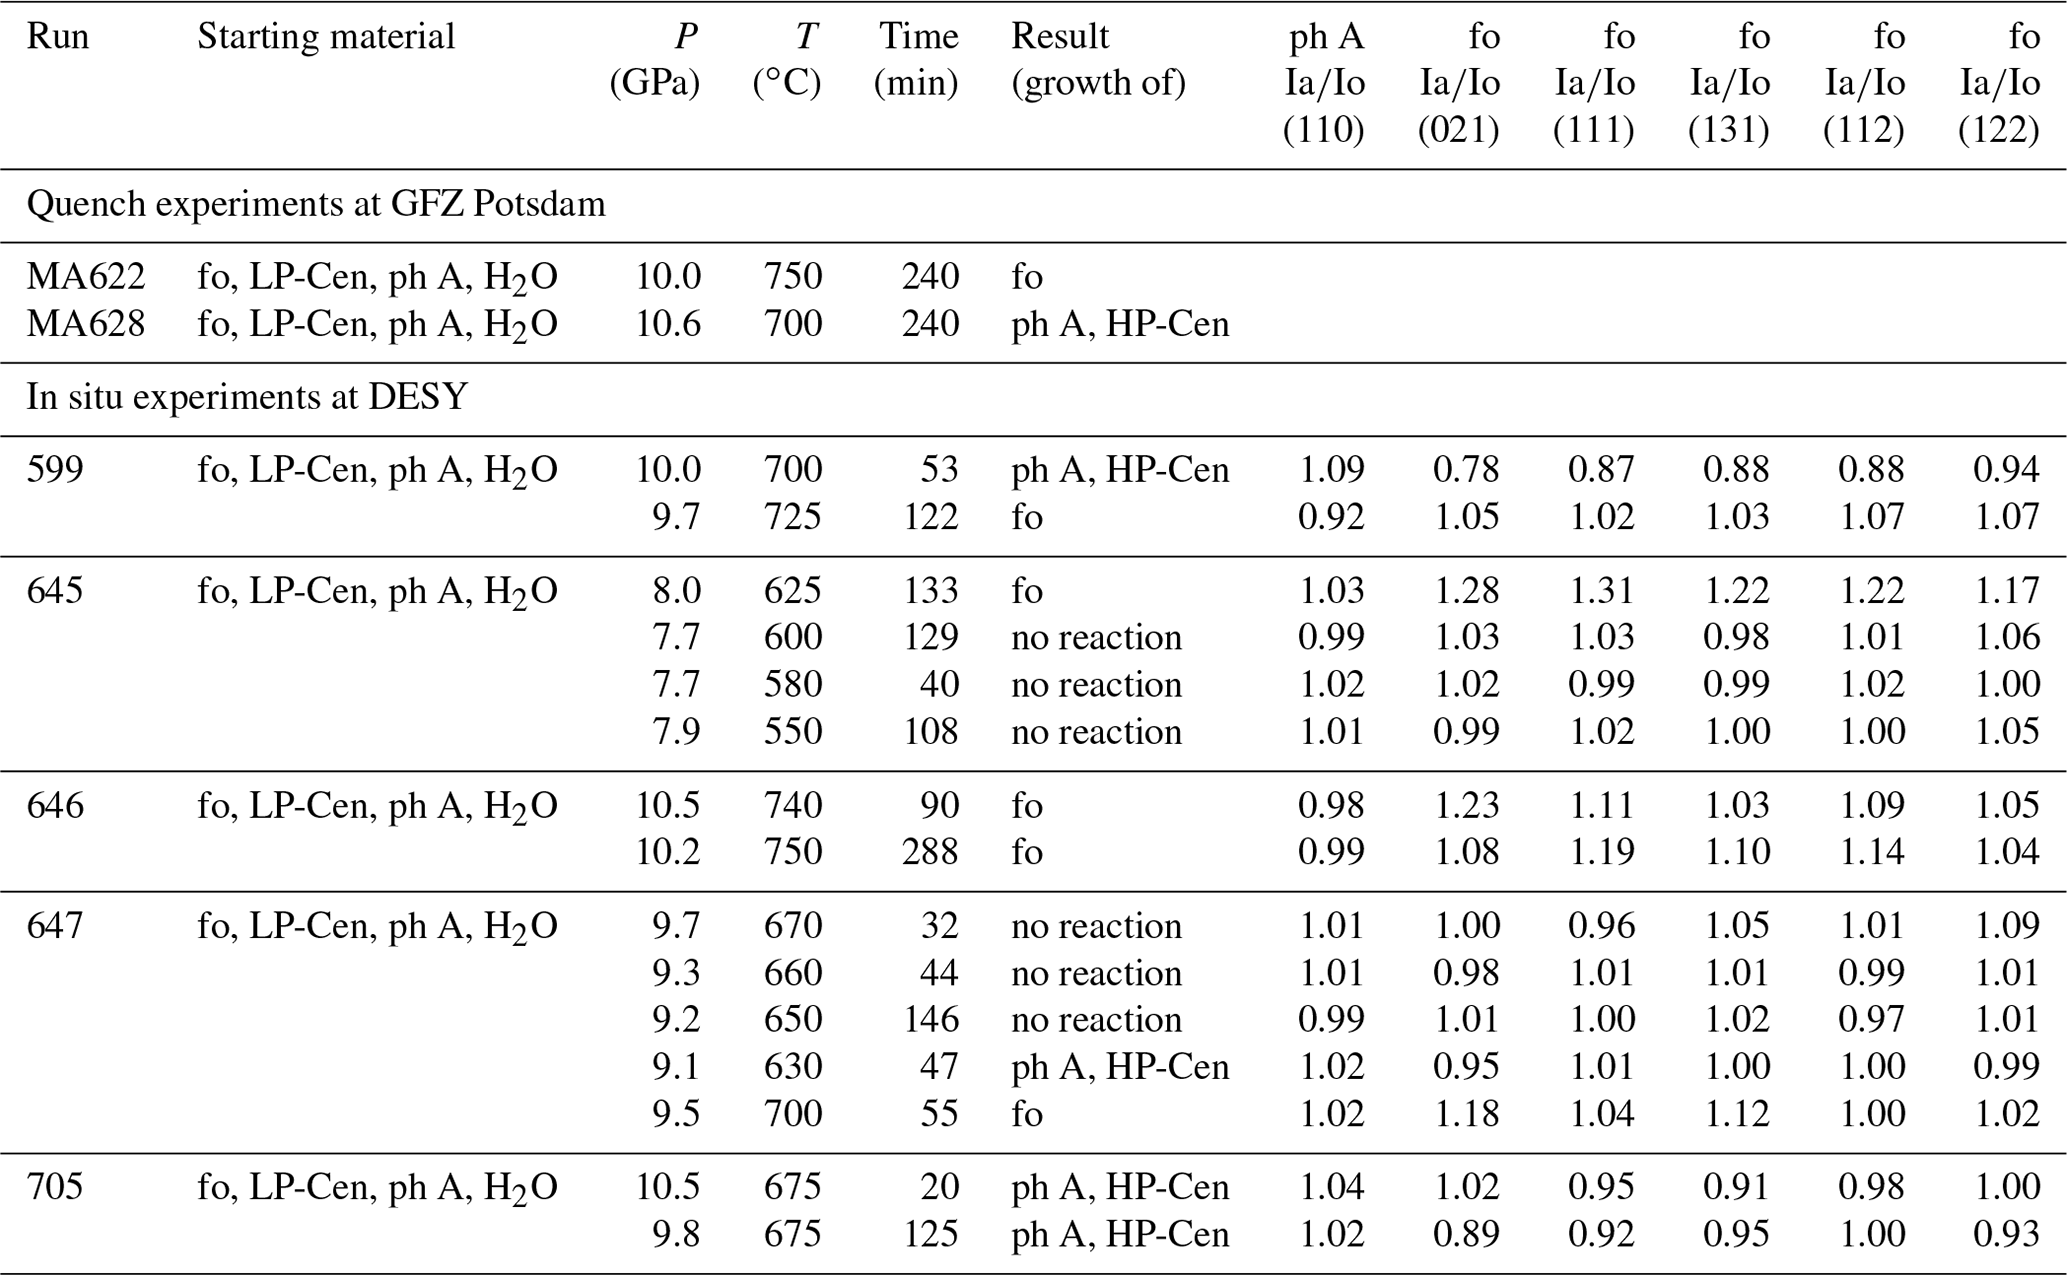
Abbreviations: fo – forsterite; ph A – phase A; LP-Cen – low-P clinoenstatite; HP-Cen – high-P clinoenstatite.
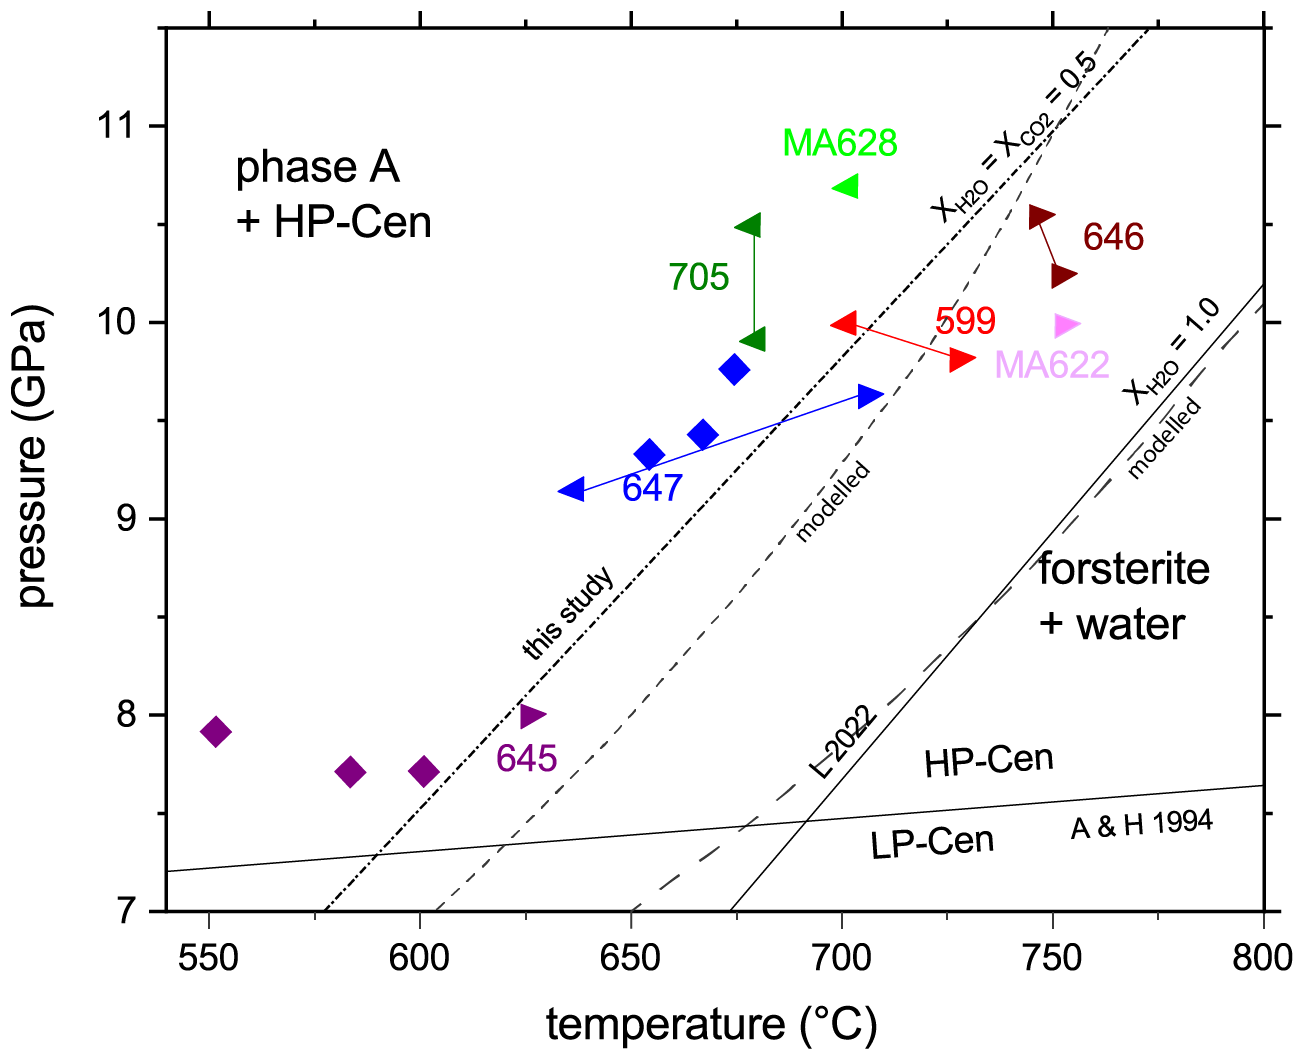
Figure 1Experimental results on quench experiments (MA622, MA628) and in situ experiments on the reaction phase A plus high-P clinoenstatite to forsterite plus water under water-reduced conditions and thermodynamic calculations (modeled). Triangles pointing left indicate growth of phase A and high-P clinoenstatite, while those pointing right indicate growth of forsterite. Diamonds indicate no reaction at this P–T condition. The solid lines that connect symbols of the same color show the P and T paths of the corresponding experiment. For comparison the position of Reaction (R1) as determined under water-saturated conditions by Lathe et al. (2022), here abbreviated as L 2022, is shown. Angel and Hugh-Jones (1994) represent the low-P–high-P clinoenstatite transition after Angel and Hugh-Jones (1994). Abbreviations as in Table 1.
3.1 Reversed experiments (equilibrium runs)
3.1.1 Quenched experiments
In Fig. 2, a detailed representative BSE image from the upper part of the capsule from experiment MA 622 is shown. According to EPMA, the dominant phase here is forsterite. Thus, this experiment recorded the breakdown of phase A plus high-P clinoenstatite to forsterite plus water. Dark-gray-colored single crystals represent phase A, light-gray-colored single crystals with cracks represent clinoenstatite, and fine-grained light gray cumulates represent the newly formed nano-sized forsterite. In Fig. 3 a cross section of the lower part of the capsule containing the Pt capsule with the former oxalate, and now silver is shown. The reaction direction in this run is confirmed by a Si element mapping shown in Fig. 4. The green areas represent forsterite, the yellow enstatite, and the blue phase A. The starting material yielded 47.2 % forsterite by volume, 20.3 % clinoenstatite, and 32.5 % phase A by volume. According to the analysis of the Si mapping the capsule contained after the run 59.7 % forsterite by volume, 13.9 % clinoenstatite, and 26.4 % phase A; thus, the clear growth of forsterite is indicated. In Fig. 4 the crack on the left side is partly filled with magnesite. We assume that a small amount of Mg dissolved in the fluid phase and reacted with CO2 to form magnesite. From the 2D image of Fig. 4, we estimate the volume of the magnesite to be less than 1 %.
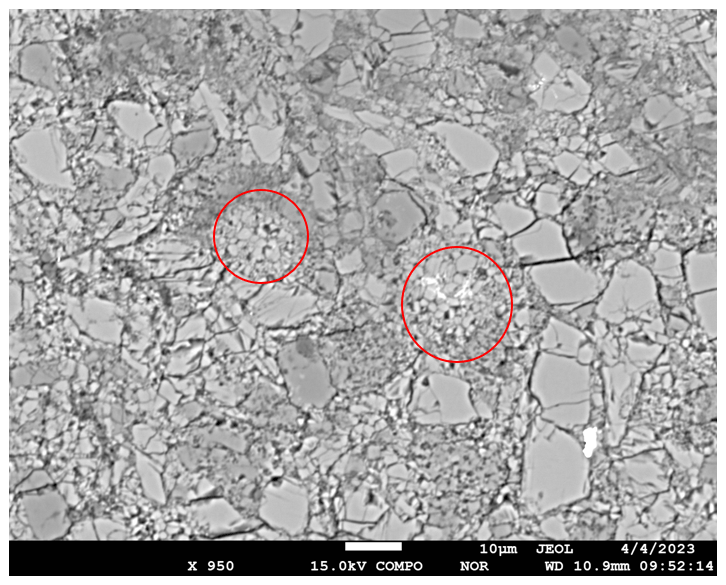
Figure 2BSE image of a part of the cross section of the upper part of the Ti capsule after experiment MA 622 (Table 1). The dark gray color represents 10 µm sized single crystals of phase A, and the light gray color with cracks represents clinoenstatite (now quenched to low-P clinoenstatite) single crystals of about 10–20 µm in size. Fine-grained aggregates also of light gray color (e.g., see red circles) represent the newly formed fine-grained forsterite.
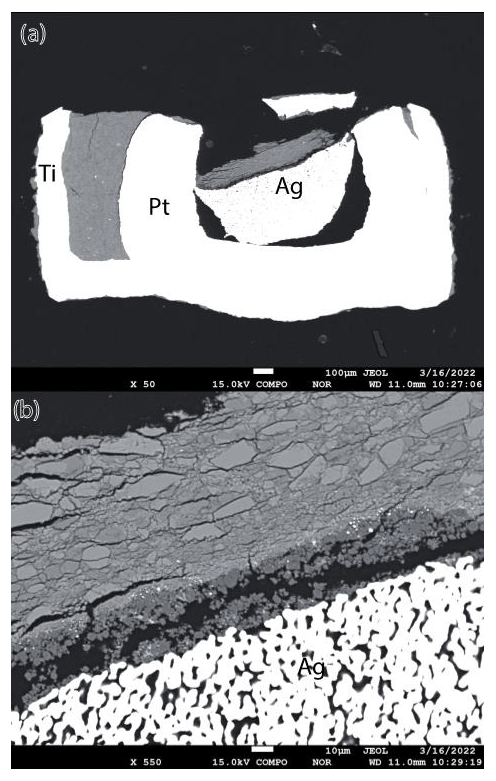
Figure 3Cross section of the lower part of the Ti capsule after experiment MA 622. (a) Overview: lower half of the Ti capsule with part of the sample (gray) and with the Pt capsule containing the Ag oxalate (now only silver). (b) Enlarged part of Fig. 3a showing the reaction product of Reaction (R1) (gray crystals): in the lower part the formed Ag from the Ag oxalate (white) and in between a fine-grained reaction rim (dark gray).
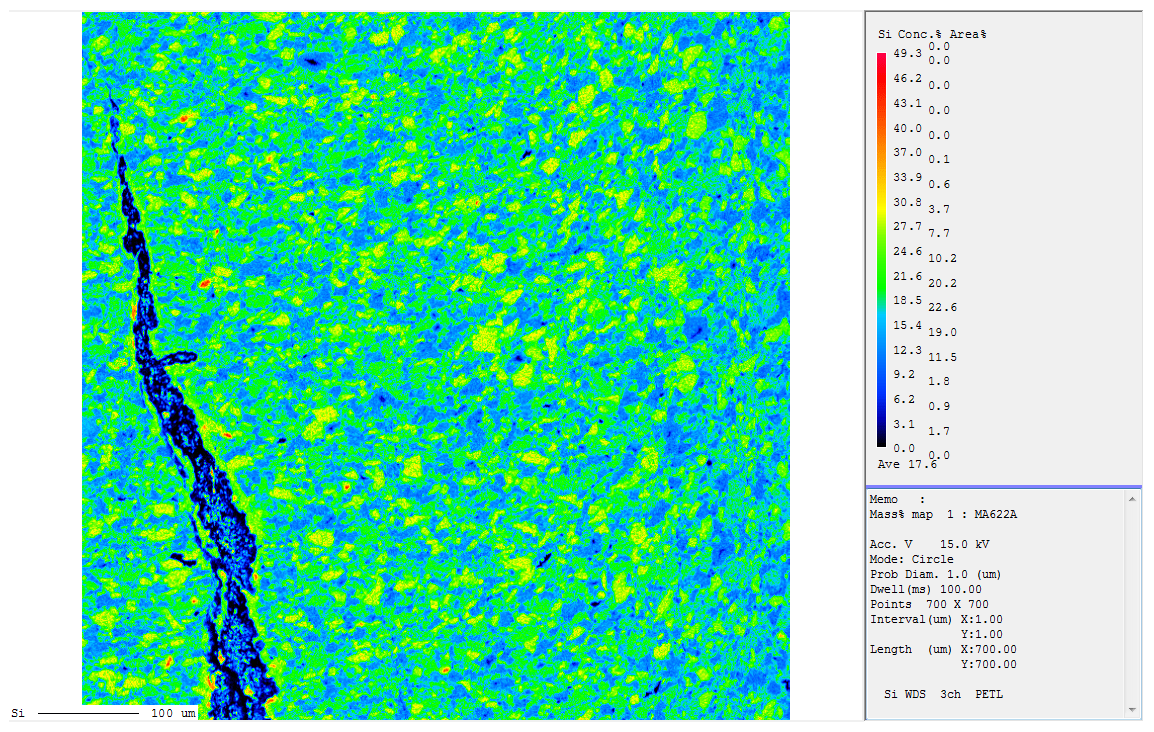
Figure 4Si element mapping of the recovered sample of run MA 622 (Table 1). Phase A contains 27 wt % SiO2, forsterite 43 wt %, and enstatite 60 wt %. The element distribution patterns of the Si mapping of reaction products were dominated by green, yellow, and blue colors. We normalized the percent area to these three colors. Yellow corresponds to enstatite, green to forsterite, and blue to phase A. Using Reaction (R1) and the molar volumes of the phases, we calculated the volume percent of each phase of the starting material. In the starting material phase A has 32.5 % of the volume, enstatite 20.3 %, and forsterite 47.2 % of the volume, and it was compared with the area percent obtained from the element mapping images. We assume that the area percent is comparable to the volume percent. This hypothesis has been proven in previous experiments, where we re-polished the cross sections of the capsules down for another 500 µm and re-collected the same element distribution patterns (Lathe et al., 2022) as before. According to the analysis of the Si mapping, the capsule MA622 contained after the run 59.7 % forsterite by volume, 13.9 % clinoenstatite, and 26.4 % phase A, thus indicating the clear growth of forsterite. In contrast to micrometer-sized single crystals of clinoenstatite and phase A, forsterite forms very fine-grained aggregates. On the left side of Fig. 4 a crack partly filled with magnesite is shown. The volume of the magnesite compared to the whole capsule is estimated to be less than 1 %. We assume that a small amount of Mg dissolved in the fluid phase reacted with CO2 to form magnesite.
3.1.2 In situ experiments
Results of run 599 were already described in Sect. 2 as an example for our experimental approach. Experiment 645 was performed at 8.0 GPa and 625 ∘C. We could clearly observe the growth of forsterite reflections after 133 min. The following steps at 7.7 GPa and 600 ∘C, 7.7 GPa and 580 ∘C, and 7.9 GPa and 550 ∘C showed no growing in phase A with high-P clinoenstatite or forsterite within more than 4 h. This could be a sign that we are very close to or even directly on the phase boundary or that the reaction at these low temperatures is far too slow for the phase transition to be observed in the limited time frame available at the synchrotron beamline. In experiment 646 we observed the growth of forsterite at 10.5 GPa and 740 ∘C within 90 min, and at 10.2 GPa and 750 ∘C it was clearly observable after 288 min. Experiment 647 was held at 9.2–9.7 GPa and 650–670 ∘C for a total of 222 min without observing any reaction. But finally, we observed the growth of phase A when we held the run at 9.1 GPa and 630 ∘C for 47 min. To bracket Reaction (R1), we changed the P–T conditions to 9.5 GPa and 700 ∘C and observed the growth of forsterite. The last experiment 705 was carried out in two steps at 10.5 GPa and 675 ∘C and 9.8 GPa and 675 ∘C for 20 and 55 min, respectively. In both cases we can report the growing of reflections belonging to phase A and high-P clinoenstatite.
The reaction directions in the in situ runs were always determined by evaluating the energy dispersive X-ray (EDX) pattern. Representative spectra are shown in Figs. S3 and S4. Figures 5 and 6 show the reaction progress in run 599 (Table 1) at two different P and T conditions. Figure 5 shows the growth of phase A, and Fig. 6 the growth of forsterite. In all cases, except for one, the reaction direction of the final step was confirmed in addition by Si element maps of the recovered sample material as shown in Fig. 4 and described above. The analyzed data are given in Table S2.
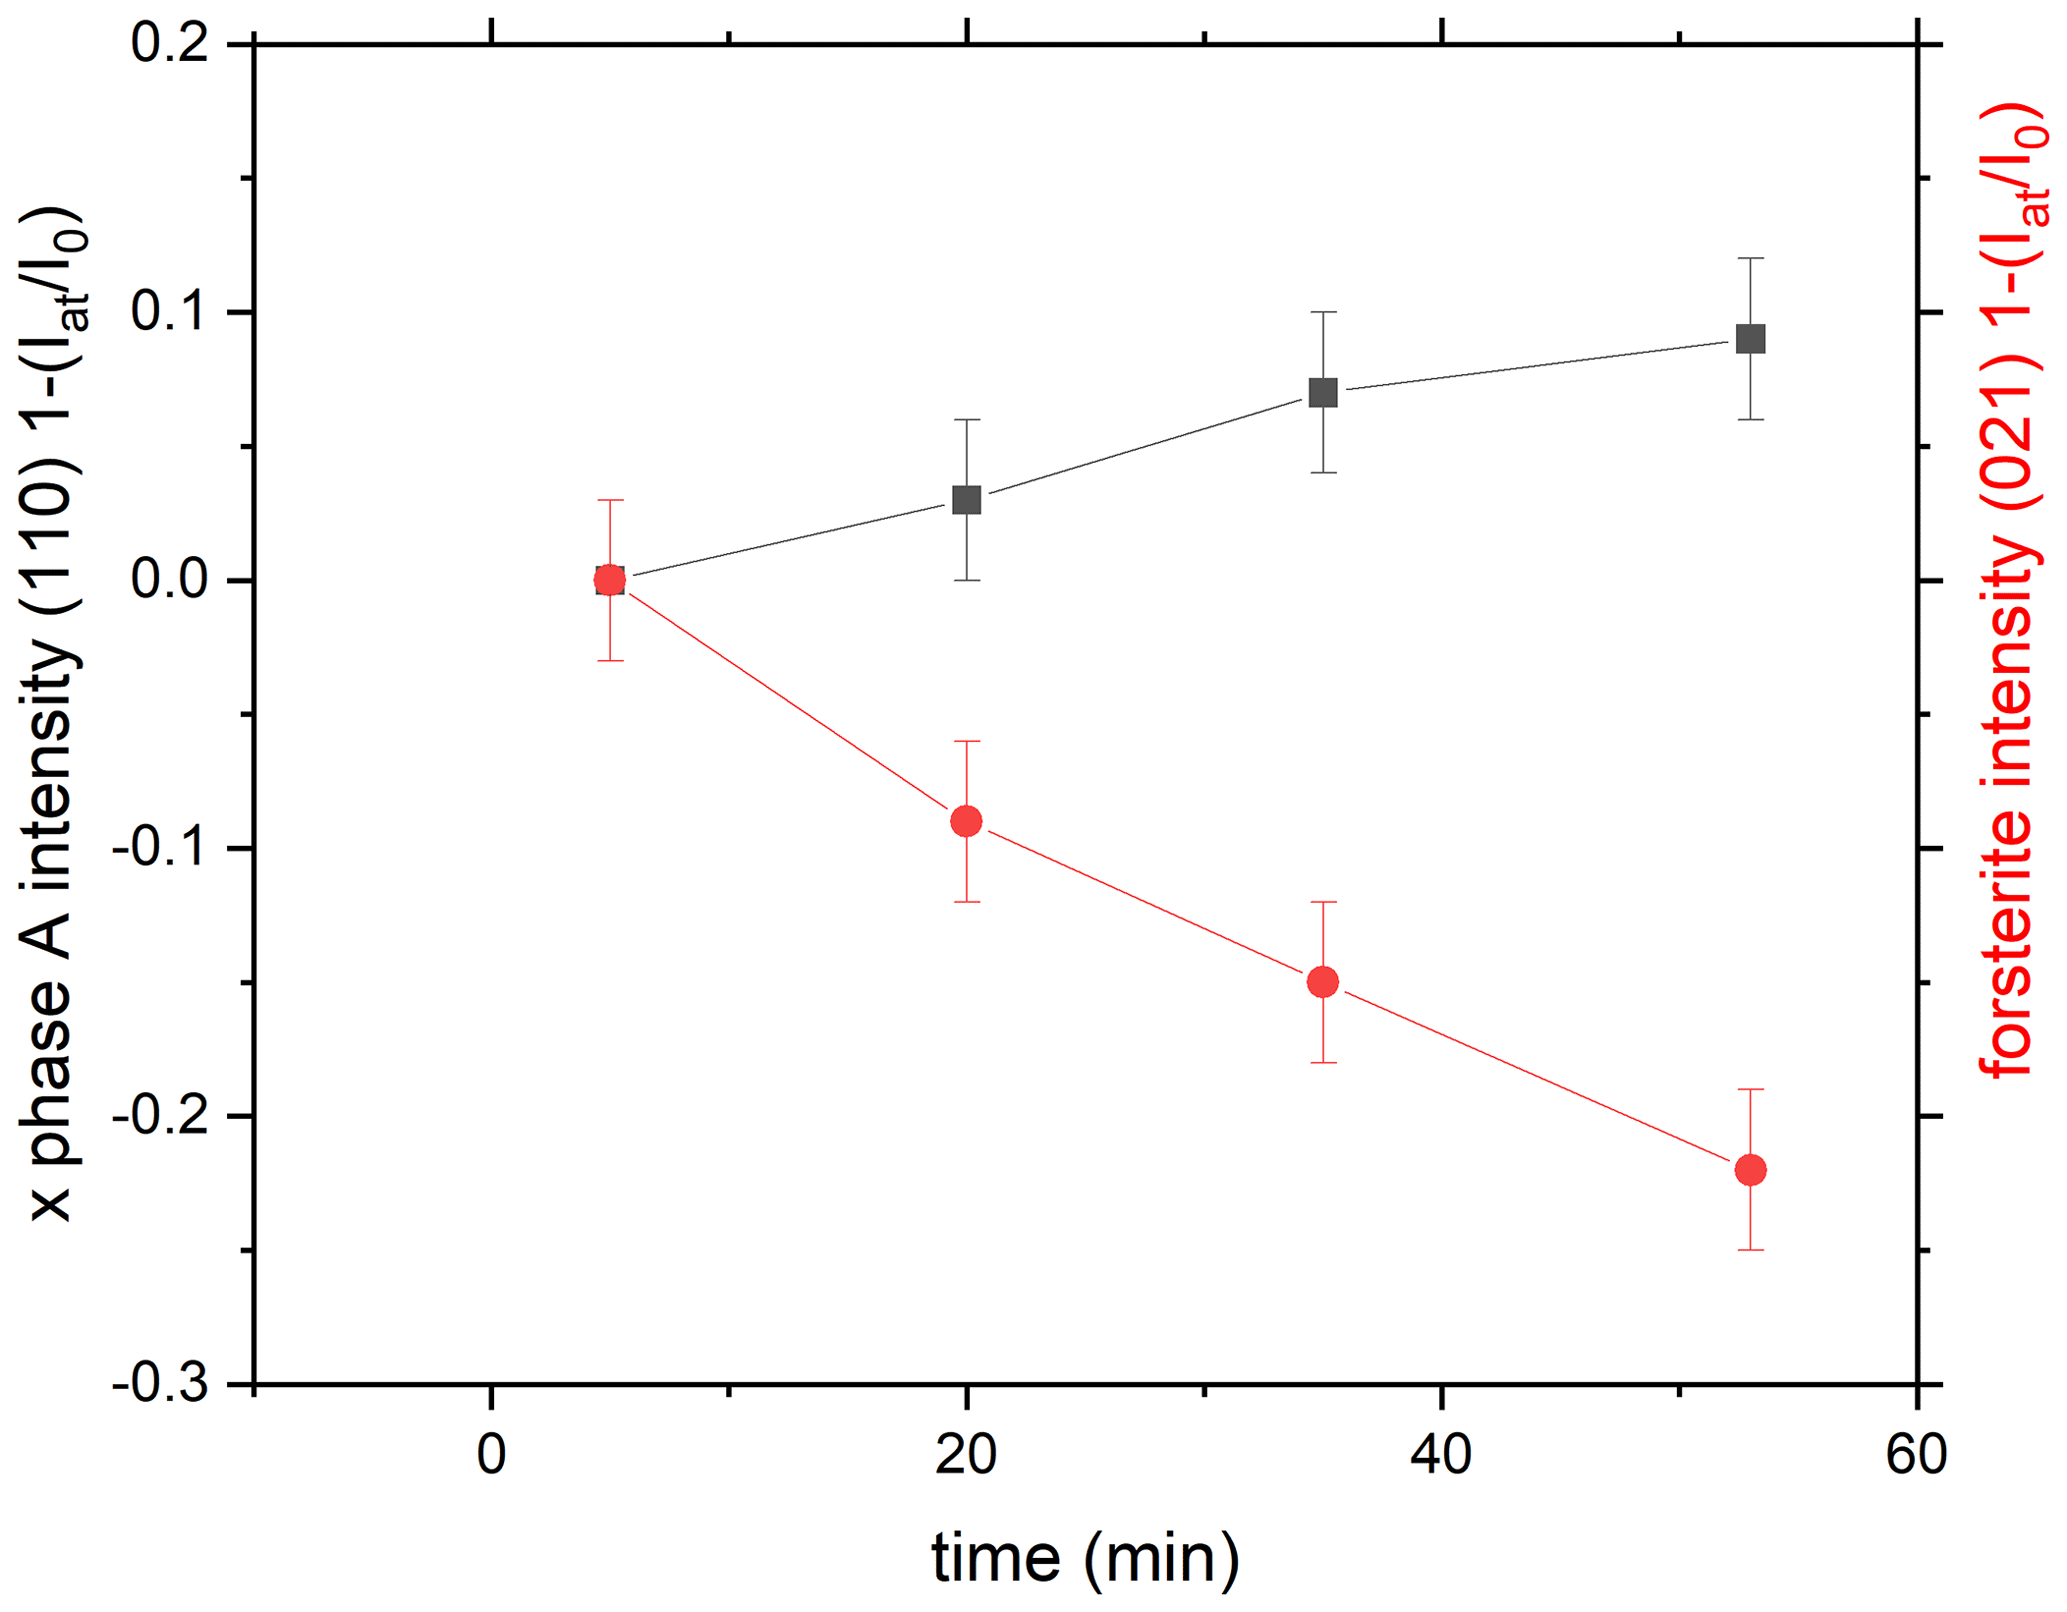
Figure 5Reaction progress in run 599 (Table 1) by exemplarily comparing the time-dependent intensity change in the (110) reflection of phase A and of the (021) refection of forsterite as a function of time as . Here at 10 GPa and 700 ∘C we see the growth of phase A.
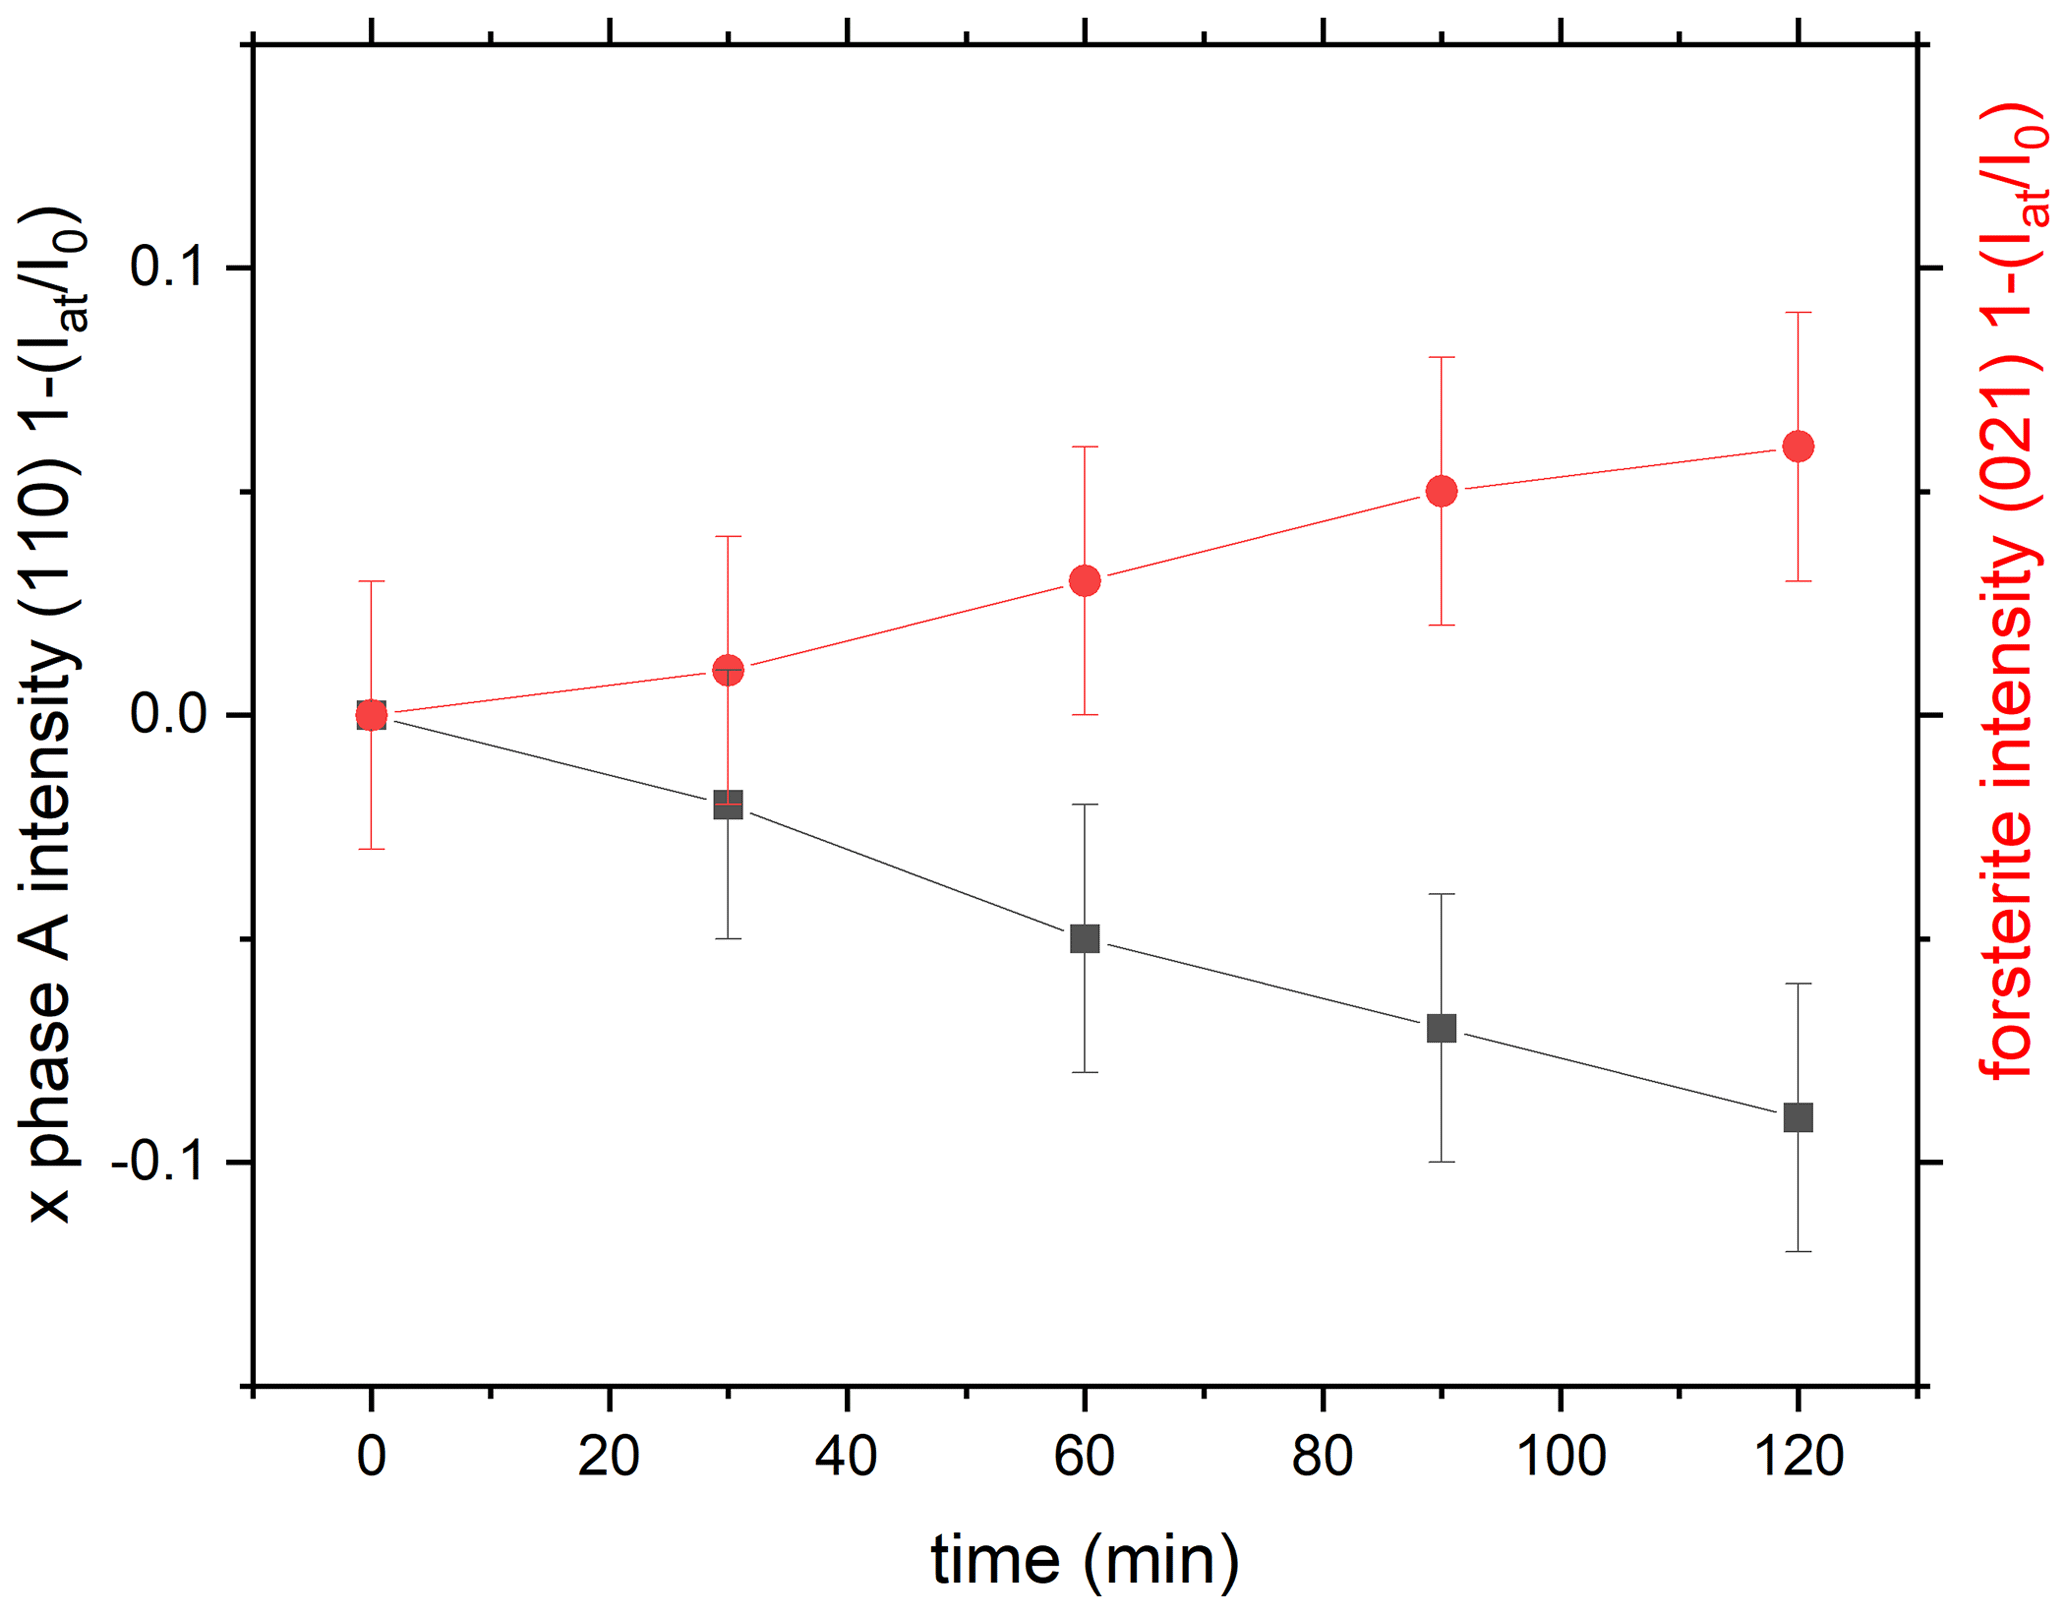
Figure 6Reaction progress in run 599 (Table 1) by exemplarily comparing the time-dependent intensity change in the (110) reflection of phase A and of the (021) refection of forsterite as a function of time as . Here at 9.7 GPa and 725 ∘C we see the growth of forsterite.
For water-undersaturated conditions we observed a shift in the high-temperature stability limit of the assemblage phase A plus high-P clinoenstatite by about 100 ∘C to lower temperature (Fig. 1). The modeling results for compare well with the results of Lathe et al. (2022), while the modeling results for are slightly shifted to higher temperatures. Hereby, the largest offset between modeled and experimentally obtained phase boundaries occurs in run 645 with a T deviation of 20–25 ∘C (Fig. 1). The reasons for such a mismatch could be (i) uncertainties in the temperature measurements with thermocouple type C at high pressures (not P-corrected); (ii) deviation of the experimental fluid from – a in the experiments could explain the mismatch; or (iii) uncertainties in the modeling parameter at these high P and T. The fact that the modeling results compare well with the experiments at but not at rules out the temperature measurements with the type C thermocouple as a reason. Also, in this case we would not expect the largest deviation at the lowest investigated pressure. Deviation of the experimental fluid from may reflect minor variations in sample loading. But the final point – uncertainties in the modeling parameter at these high P and T – may contribute mainly to the mismatch. The perple_X calculations simplify the fluid to a COH fluid containing only neutral species of CO2 and H2O. This means that solute components of, e.g., MgO and SiO2 in the fluid; changes in the pH values; and the bicarbonate or carbonate ion concentrations of the fluids are not considered. Variation in in the experimental fluid will influence the solubility of MgO and SiO2 in the fluid. This may contribute to the enhanced mismatch at compared to . However, we would like to emphasize that the deviation of the model from the experiments is only minor: the highest T difference (run 645) between experiment and model is 20–25 ∘C.
The breakdown of phase A plus high-P clinoenstatite proceeds directly by forming forsterite plus water without any precursor phases and vice versa by the reaction of forsterite plus water to phase A plus high-pressure clinoenstatite.
Water-undersaturated conditions did not enhance the kinetics of the dehydration reaction as proposed by Perrillat et al. (2005). Perrillat et al. (2005) studied the dehydration of antigorite in situ in a Paris–Edinburgh large volume press using hexagonal boron nitride (BN) as sample containers. BN is X-ray transparent but not watertight; thus, during the dehydration event water escaped uncontrollably and continuously from the container. Perrillat et al. (2005) interpreted these experiments as being performed under water-undersaturated conditions. They observed a large P–T shift in the antigorite breakdown reaction to lower temperatures by 50–100 ∘C. The breakdown reaction proceeds via an intermediate assemblage in which forsterite plus a “talc-like” phase is involved. This assemblage is observed within a temperature interval of 130 ± 20 ∘C until finally at T>700 ∘C (at 3 GPa) enstatite is formed at the expense of the talc-like phase. Importantly, the dehydration under water-undersaturated conditions is reported as being much faster than under water-saturated conditions: it completed within 0.5–4 h, whereas under water-saturated conditions the complete disappearance of antigorite was never achieved even for run durations as long as 1 week. We assume that the uncontrolled and continuous escape of water during the experiments enhanced the breakdown reaction and the formation of the metastable intermediate assemblage. The water activity in Perrillat et al.'s (2005) experiments is not really constrained over the run duration of 0.5 to 4 h. It is unclear if the experiments after 4 h still contained water or if they were completely dry. This is in contrast to our procedures, where we established a constant mole fraction of a COH fluid with close to 0.5. Here, we observed the direct breakdown reaction of forsterite to phase A plus high-P clinoenstatite without the formation of an intermediate phase. Consequently, at the reduced water activity of our experiments the kinetics of the dehydration is not enhanced but even slower likely because the phase transition occurs at lower temperatures compared to the earlier water-saturated experiments (Lathe et al., 2022). Most probably an intermediate phase does not appear as we performed reversed experiments, where all phases (educts and products) were present from the very beginning. Thus, the dehydration reaction reported by Perrillat et al. (2005) is a special case, and their observation that the reaction rate is increased with decreasing water activity cannot be considered a general rule.
As described for Reaction (R1) under water-saturated conditions (Lathe et al., 2022), the newly formed forsterite at reduced water activity is also of nanometer size (Figs. 2 and 4). Lathe et al. (2022) showed that the kinetics of the reaction is extremely slow and that the dehydration product forsterite has nano-sized dimensions. Thus, the initiation of seismicity from this reaction is not favored due to the sluggishness of this reaction but could be favored from the fine-grained reaction product formed due to mechanically induced instabilities. These instabilities could produce softening or deformation of the slabs and finally in special cases result in seismicity. As shown in this study the same holds for Reaction (R1) under water-undersaturated conditions.
In situ X-ray diffraction as a function of time is used to investigate the P–T location of the reaction phase A plus three clinoenstatite (low-P–high-P clinoenstatite) to five forsterite plus three water (Reaction R1) under well-defined water-undersaturated conditions. At the reduced water activities applied in this study the reaction is shifted by 100 ∘C to lower temperature and the breakdown of phase A plus high-P clinoenstatite to forsterite plus water and vice versa proceeds directly and not via precursor phases. Thus, at a water activity () below 1, the dehydration reaction of phase A plus clinoenstatite can also occur in colder subduction slabs than implied in Lathe et al. (2022).
In both of our studies on Reaction (R1) (Lathe et al., 2022; this study) and in our study on the breakdown of the 3.65 Å phase (Koch-Müller et al., 2021), the newly formed dehydration products were of nanometer size, which supports earlier experimental observations that product phases of dehydration reactions are generally very fine-gained. Based partly on these observations Ferrand et al. (2017) propose an alternative model to the concept of dehydration embrittlement. Studying dehydration of antigorite they came to the conclusion that it is not only the released fluid which may cause seismicity. They propose that the formation of nanocrystalline reaction products during the dehydration can lead to extreme weakening and mechanical instabilities and can transfer stress to the surrounding rocks and finally cause intermediate earthquakes. Following this concept Shirey et al. (2021) predicted that the dehydration of DHMSs may play the same role for deep earthquakes as antigorite, namely that, due to the formation of nanocrystalline reaction products, they become extremely weak. Our studies on the 3.65 Å phase and phase A prove that this indeed can be true, but it needs to also be tested for other DHMSs.
All data derived from this research are presented in the enclosed tables, figures, and the Supplement.
The supplement related to this article is available online at: https://doi.org/10.5194/ejm-35-1149-2023-supplement.
CL performed and analyzed the experiments. MKM and BW had the initial idea for the project and prepared the paper, with contribution of all co-authors. OA did the electron microprobe measurements and analyses. MS did the thermodynamic modeling for the phase transition. SB and RF supported us during the experiments in Hamburg.
The contact author has declared that none of the authors has any competing interests.
Publisher’s note: Copernicus Publications remains neutral with regard to jurisdictional claims made in the text, published maps, institutional affiliations, or any other geographical representation in this paper. While Copernicus Publications makes every effort to include appropriate place names, the final responsibility lies with the authors.
The authors are extremely thankful to Andreas Ebert for his support during the multi-anvil experiments in Potsdam and in Hamburg. The authors also thank Hans-Peter Nabein for his technical help. Two anonymous reviews helped to improve the manuscript. We acknowledge DESY (Hamburg, Germany), a member of the Helmholtz Association HGF, for the provision of experimental facilities. Parts of this research were carried out at beamline P61B (proposals no. I-20210162, I-20211114) with support from the Federal Ministry of Education and Research, Germany (BMBF, grants nos. 05K16WC2 and 05K13WC2). The authors also acknowledge the scientific exchange and support of the Centre for Molecular Water science (CMWS).
This research has been supported by the Bundesministerium für Bildung, Wissenschaft, Forschung und Technologie (grant nos. 05K16WC2, 05K13WC2).
The article processing charges for this open-access publication were covered by the Helmholtz Centre Potsdam – GFZ German Research Centre for Geosciences.
This paper was edited by Paola Comodi and reviewed by two anonymous referees.
Angel, R. J. and Hugh-Jones, D. A.: Equations of state and thermodynamic properties of enstatite pyroxenes, J. Geophys. Res., 99, 19777–19783, https://doi.org/10.1029/94JB01750, 1994.
Chinnery, N. J., Pawley, A. R., and Clark, S. M.: In situ observation of the formation of 10 Å phase from talc + H2O at mantle pressures and temperatures, Science, 286, 940–942, https://doi.org/10.1126/science.286.5441.940, 1999.
Chollet, M., Daniel, I., Koga, K. T., Morard, G., and van de Moortèle, B.: Kinetics and mechanism of antigorite dehydration: Implications for subduction zone seismicity, J. Geophys. Res., 116, B04203, https://doi.org/10.1029/2010JB007739, 2011.
Ferrand, T. P., Hilairet, N., Incel, S., Deldicque, D., Labrousse, L., Gasc, J., Renner, J., Wang, Y., Green II, H. W., and Schubnel, A.: Dehydration-driven stress transfer triggers intermediate-depth earthquakes, Nat. Commun., 8, 15247, https://doi.org/10.1038/ncomms15247, 2017.
Frost, D. J. and Fei, Y.: Stability of phase D at high pressure and high temperature, J. Geophys. Res., 103, 7463–7474, https://doi.org/10.1029/98JB00077, 1998.
Hacker, B., Abers, G., and Peacock, S.: Subduction factory 1. Theoretical mineralogy, densities and seismic wave speeds, and H2O contents, J. Geophys. Res., 108, 2029, https://doi.org/10.1029/2001JB001127, 2003.
Incel, S., Hilairet, N., Labrousse, L., John, T., Deldicque, D., Ferrand, T., Wang, Y., Renner, J., Morales, L., and Schubnel, A.: Laboratory earthquakes triggered during eclogitization of lawsonite-bearing blueschist, Earth Planet. Sc. Lett., 459, 320–331, https://doi.org/10.1016/j.epsl.2016.11.047, 2017.
Koch-Müller, M., Appelt, O., Wunder, B., and Wirth, R.: New insights in the mechanisms of the reaction 3.65 Å phase = clinoenstatite + water down to nanoscales, Eur. J. Mineral., 33, 675–686, https://doi.org/10.5194/ejm-33-675-2021, 2021.
Lathe, C., Koch-Müller, M., Wunder, B., Appelt, O., Bhat, S., and Farla, R.: In situ reinvestigation of reaction phase A plus high-pressure clinoenstatite to forsterite plus water in the system MgO-SiO2-H2O (MSH), Eur. J. Mineral., 34, 201–213, https://doi.org/10.5194/ejm-34-201-2022, 2022.
Lauterjung, J. and Will, G.: A fully automatic peak-search program for the evaluation of Gaus-shaped diffraction patterns, Nucl. Instrum. Method. A, 239, 281–287, https://doi.org/10.1016/0168-9002(85)90727-2, 1985.
Liu, L. G.: Effects of H2O on the phase behavior of the forsterite-enstatite system at high pressures and temperatures and implications for the Earth, Phys. Earth Planet. Inter., 49, 142–167, https://doi.org/10.1016/0031-9201(87)90138-5, 1987.
Müller, J., Koch-Müller, M., Rhede, D., Wilke, F., and Wirth, R.: Melting relations in the system CaCO3-MgCO3 at 6 GPa, Am. Mineral., 102, 2440–2449, https://doi.org/10.2138/am-2017-5831, 2017.
Perrillat, J.-P., Daniel, I., Koga, K. T., Reynard, B., Cardon, H., and Crichton, W. A.: Kinetics of antigorite dehydration: A real-time X-ray diffraction study, Earth Planet. Sc. Lett., 236, 899–913, https://doi.org/10.1016/j.epsl.2005.06.006, 2005.
Sanchez-Valle, C., Sinogeikin, S. V., Smyth, J. R., and Bass, J. D.: Sound velocities and elasticity of DHMS phase A to high pressure and implications for seismic velocities and anisotropy in subducted slabs, Phys. Earth Planet. Int., 170, 229–239, https://doi.org/10.1016/j.pepi.2008.07.015, 2008.
Shirey, S. B., Wagner, L. S., Walter, M. J., Pearson, D. G., and van Keken, P. E.: Slab transport of fluids to deep focus earthquake depths – thermal modelling constraints and evidence from diamonds, AGU Adv., 2, e2020AV000304, https://doi.org/10.1029/2020AV000304, 2021.
Sverjensky, D. A.: Thermodynamic modelling of fluids from surficial to mantle conditions, J. Geol. Soc., 176, 348–374, https://doi.org/10.1144/jgs2018-105, 2019.
Tange, Y., Nishihara, Y., and Tsuchiya, T.: Unified analyses for P-V-T equation of state of MgO: A solution for pressure-scale problems in high P-T experiments, J. Geophys. Res., 114, B03208, https://doi.org/10.1029/2008JB005813, 2009.
Wunder, B.: Equilibrium experiments in the system MgO-SiO2-H2O (MSH): Stability fields of clinohumite-OH [Mg9Si4O16(OH)2], chondrodite-OH [Mg5Si2O8(OH)2] and phase A (Mg7Si2O8(OH)6), Contrib. Mineral. Petrol., 132, 111–120, https://doi.org/10.1007/s004100050410, 1998.