the Creative Commons Attribution 4.0 License.
the Creative Commons Attribution 4.0 License.
 | 25 Oct 2022
Studies on the local structure of the F ∕ OH site in topaz by magic angle spinning nuclear magnetic resonance and Raman spectroscopy
Gudrun Scholz
Nader de Sousa Amadeu
Jingjing Shao
Dina Schultze
Jeremy Fuller
Beate Paulus
Franziska Emmerling
Thomas Braun
Timm John
The mutual influence of F and OH groups in neighboring sites in topaz (Al2SiO4(F,OH)2) was investigated using magic angle spinning nuclear magnetic resonance (MAS NMR) and Raman spectroscopy. The splitting of 19F and 1H NMR signals, as well as the OH Raman band, provides evidence for hydrogen bond formation within the crystal structure. Depending on whether a given OH group has another OH group or fluoride as its neighbor, two different hydrogen bond constellations may form: either OH⋯O⋯HO or F⋯H⋯O. The proton accepting oxygen was determined to be part of the SiO4 tetrahedron using 29Si MAS NMR. Comparison of the MAS NMR data between an OH-bearing and an OH-free topaz sample confirms that the 19F signal at −130 ppm stems from F− ions that take part in H⋯F bonds with a distance of ∼ 2.4 Å, whereas the main signal at −135 ppm belongs to fluoride ions with no immediate OH group neighbors. The Raman OH sub-band at 3644 cm−1 stems from OH groups neighboring other OH groups, whereas the sub-band at 3650 cm−1 stems from OH groups with fluoride neighbors, which are affected by H⋯F bridging. The integrated intensities of these two sub-bands do not conform to the expected ratios based on probabilistic calculations from the total OH concentration. This can be explained by (1) a difference in the polarizability of the OH bond between the different hydrogen bond constellations or (2) partial order or unmixing of F and OH, or a combination of both. This has implications for the quantitative interpretation of Raman data on OH bonds in general and their potential use as a probe for structural (dis-)order. No indication of tetrahedrally coordinated Al was found with 27Al MAS NMR, suggesting that the investigated samples likely have nearly ideal ratios, making them potentially useful as high-density electron microprobe reference materials for Al and Si, as well as for F.
- Article
(4311 KB) - Full-text XML
-
Supplement
(3774 KB) - BibTeX
- EndNote


Topaz (Al2SiO4(F,OH)2) is one of the major fluorine bearing silicate phases in highly differentiated magmatic rocks such as granites, rhyolites, and pegmatites, as well as in greisen alterations and hydrothermal veins associated with these rock types. Its structure and composition are simple and well-defined with typically low concentrations of trace elements and close to perfect stoichiometry, apart from the F ↔ OH exchange. This makes topaz an ideal object for a case study on intra-structural H⋯F hydrogen bridging interactions. The occupation of the monovalent anion site can be described with the formula Al2SiO4Fx(OH)2−x. Natural specimens are mostly fluoride-dominated (1.4<x<2; e.g., Barton, 1982), but hydroxide-dominated topaz with x≥0.9 has been found in high-pressure rocks (Zhang et al., 2002). The fully hydroxylated end-member (Al2SiO4(OH)2) has so far not been observed in nature but has been synthesized in high-pressure experiments (5.5–10 GPa at ≤ 1000 ∘C), suggesting it may be present in subducting pelitic metasediments and thus act as a transporting agent for water into the Earth's mantle (Wunder et al., 1993).
Topaz is an orthorhombic nesosilicate with the space group Pbnm (Gatta et al., 2006). The structure (see Fig. 1) consists of four slightly distorted close-packed anion layers with the stacking order ABAC along the b axis, wherein the layers at position A are fully occupied by O2−, and the other two layers are each occupied by (F, OH)− and O2−. There is only one symmetrically equivalent position each for Al3+ and Si4+ and three for O2−. One single position is occupied partially by F− and partially by the oxygen of the OH− group. The single proton position in fluoride-rich topaz and the hydrogen bond lie in the (010) plane (e.g., Gatta et al., 2006). In the fully hydroxylated end-member, there are two partially occupied proton positions (e.g., Northrup et al., 1994; Chen et al., 2005). A high p–T polymorph of the OH end-member, called topaz-OH II, was studied by Xue et al. (2010).
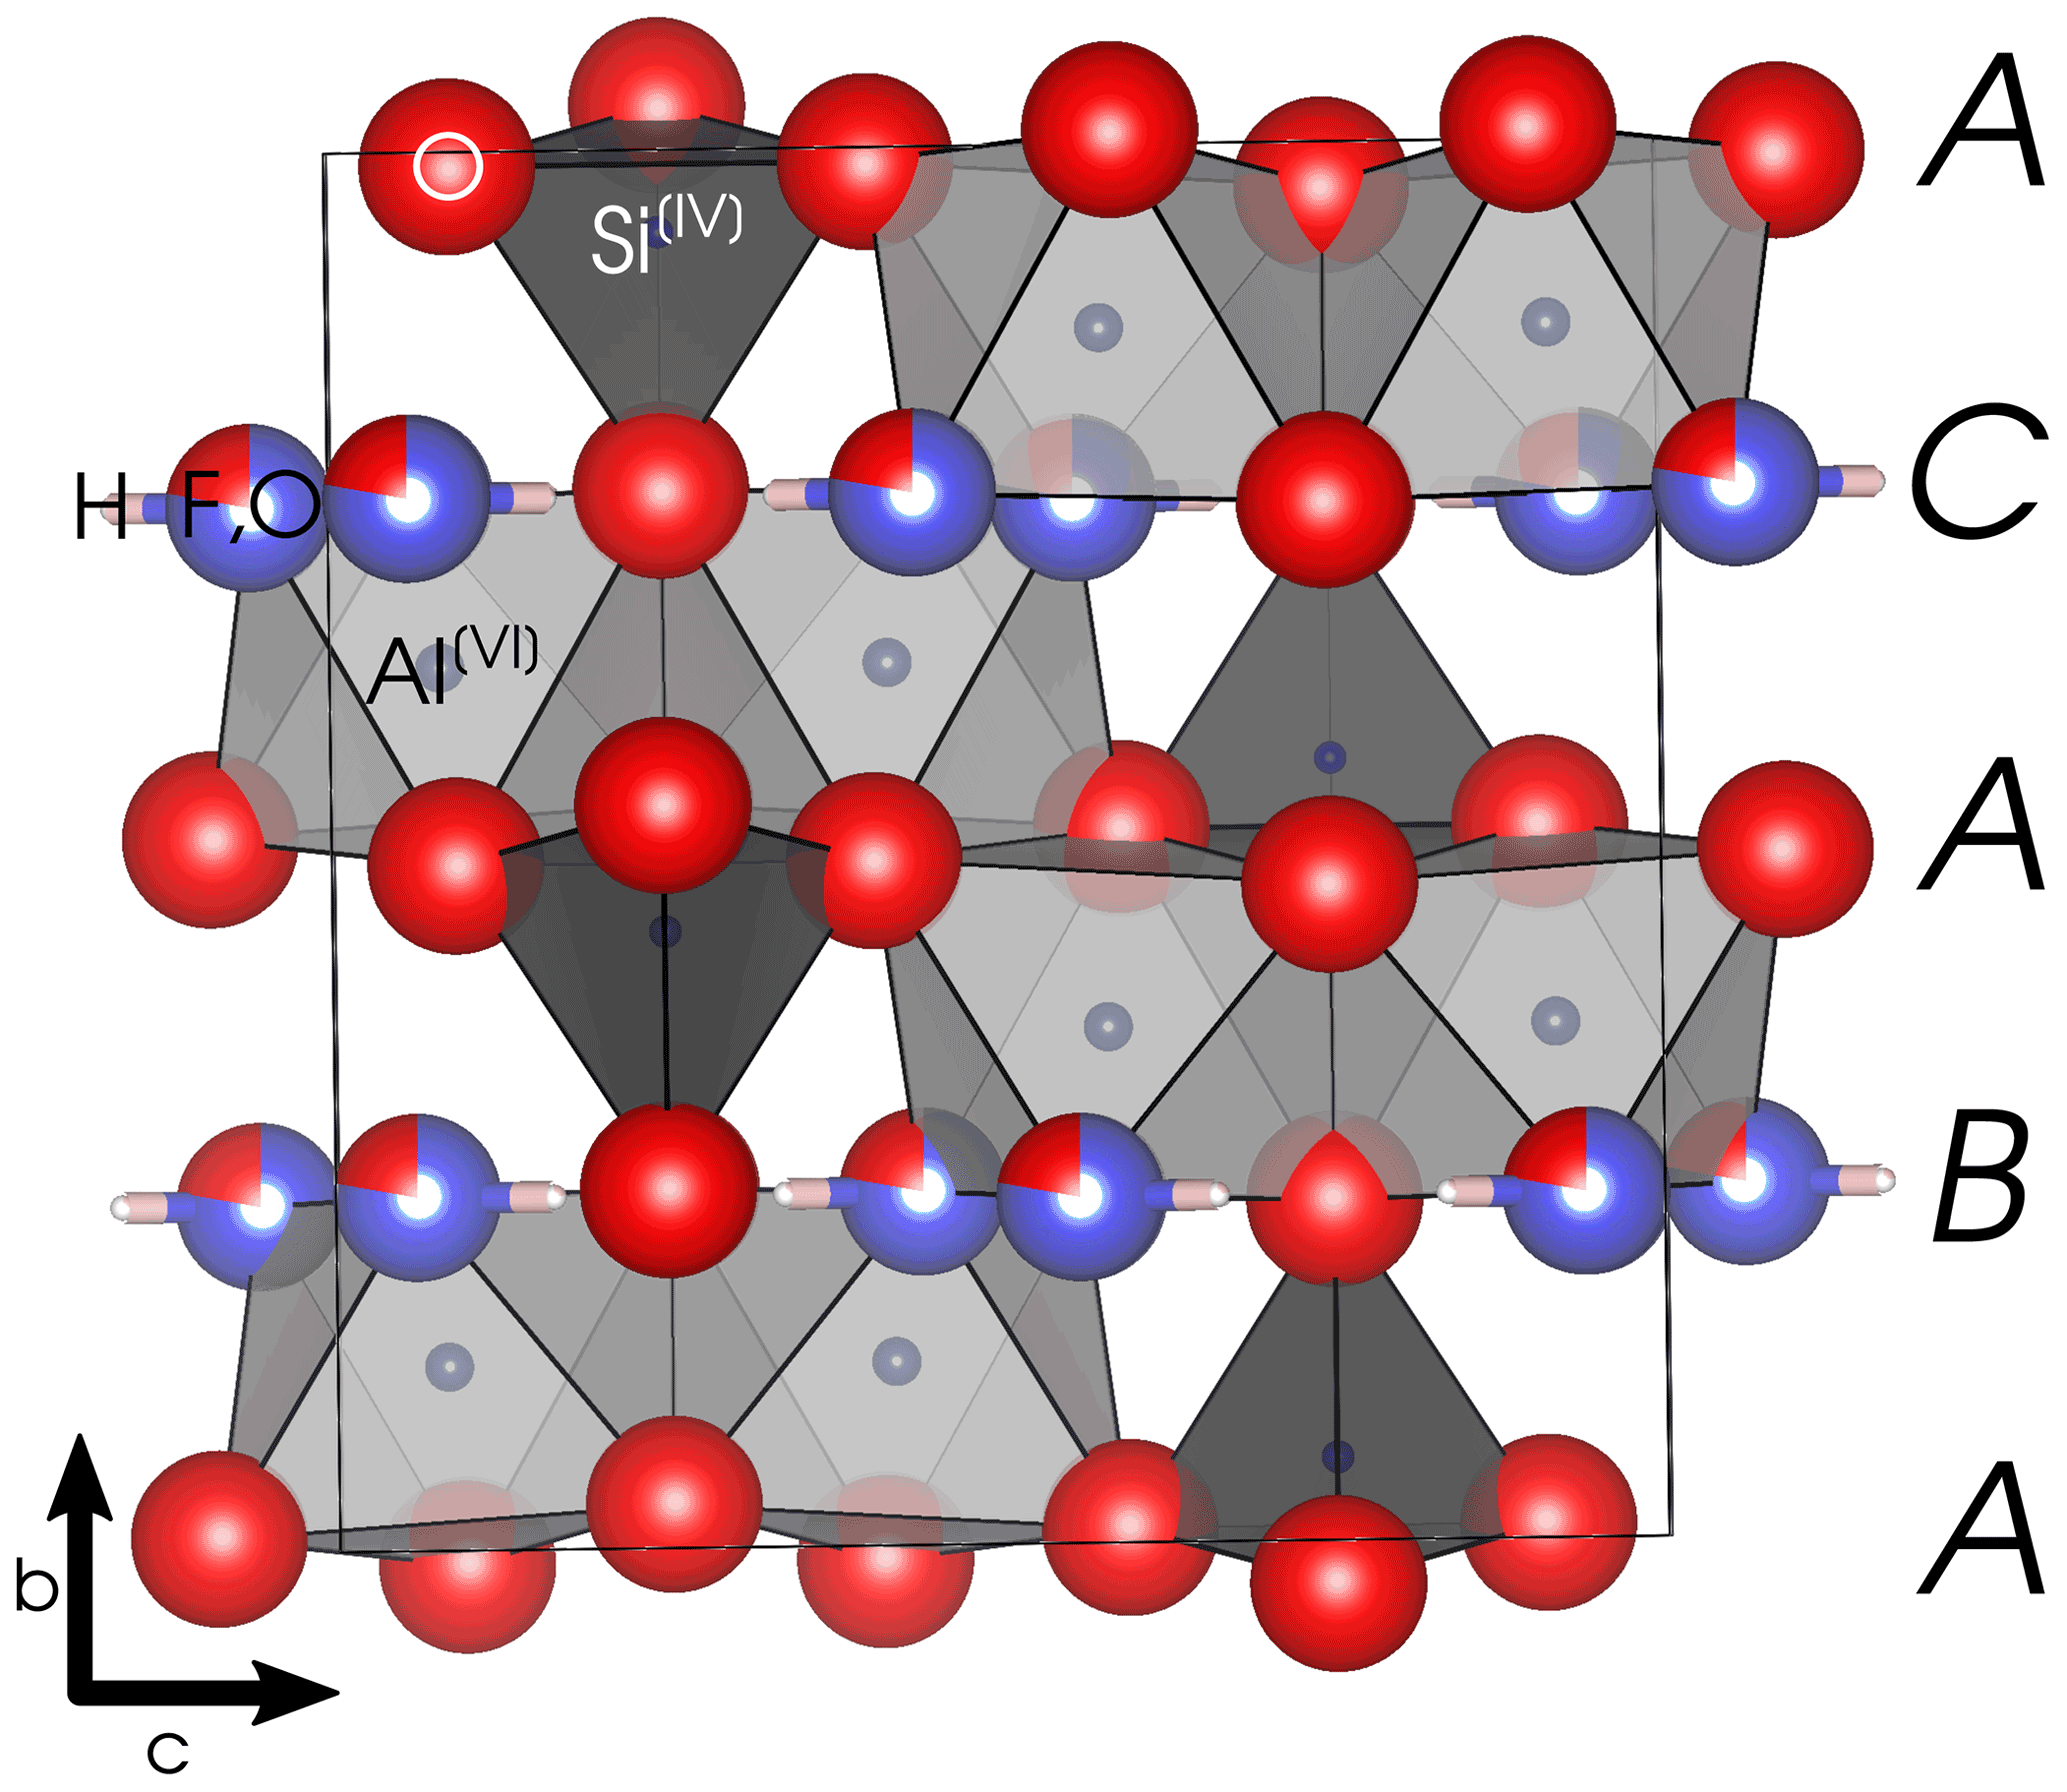
Figure 1Topaz structure viewed along [100]. The black box marks the outline of the unit cell. Capital letters on the right margin denote the stacking order of close-packed anion layers. Space group = Pbnm; a= 4.667 Å; b= 8.834 Å; c= 8.395 Å. Graphics produced with VESTA 3 (Momma and Izumi, 2011) from neutron diffraction data at 298 K by Gatta et al. (2006).
The Al3+ cations occupy of the octahedral voids in the anion close packing and are coordinated by four O2− and two (F, OH)−. The Si4+ ions occupy of the tetrahedral voids. These octahedra form kinked chains by sharing an edge (two oxygen atoms) with each neighbor. The monovalent anions and the Si tetrahedra interconnect these chains. Each (F, OH)− is thus bound to two Al3+, each of which is again bound to another (F, OH)−, forming twisted Al-(F,OH) chains along the a axis. The effective ionic radius of OH− is about 2.7 % larger than that of F− in two-fold coordination (Shannon, 1976). Because the monovalent anions are located in discreet layers parallel to (010), substitution on this site correlates with expansion of the b lattice parameter (Ribbe and Rosenberg, 1971). Due to the analytical difficulties of precisely determining F and OH contents with other methods (particularly electron microprobe; see Ottolini et al., 2000), this correlation is commonly used to determine the ratio of topaz from X-ray diffractometry (XRD) data.
Substitution of Al3+ on the tetrahedral Si4+ site, called a (AlO4)0 center, has been proposed to be the reason for a major color and luminescence center in brown (also known as smoky) topaz based on electron paramagnetic resonance spectroscopy (EPR) (e.g., Yukihara et al., 2002; Souza et al., 2004). This center is interpreted by these authors to be at least partially responsible for the brown coloration of topaz upon γ irradiation by creating electron holes in the surrounding crystal, as well as the disappearance of the brown color, accompanied by thermoluminescence upon heating above ca. 200 ∘C, by acting as an electron hole trap. To the best of our knowledge, tetrahedrally coordinated Al has so far not been directly observed in topaz with NMR spectroscopy, and we are only aware of one attempt to do so (Mizuno et al., 2006).
Topaz tends to be poor in minor and trace elements, making it an ideal candidate for structural investigations. The 3d transition metals of the fourth period can substitute for Al3+ on the octahedral site, with Cr3+ and Fe3+ being most relevant in natural samples (e.g., Ribbe and Rosenberg, 1971; Pinheiro et al., 2002; Gatta et al., 2006).
There are three anion positions that can potentially form hydrogen bonds with the proton. The fluoride position, which may be partially occupied by oxygen as well (in the case of non-end-member topaz), and the O2 position are essentially in the same a−c lattice plane as the H (Figs. 1, 2; Gatta et al., 2006). Their distances to the hydrogen atom are therefore almost independent of the b lattice parameter and of the ratio of the crystal (e.g., Ribbe and Rosenberg, 1971).
Two different constellations of hydrogen bonds are possible, if at least one of the sites of a pair of neighbors is occupied by OH. The neighboring site is also occupied by OH (Fig. 2, left side), in which case both protons can form hydrogen bonds with the oxygen on the O2 site atop the SiO4 tetrahedron, resulting in a OH⋯O⋯HO configuration. If the neighboring site is occupied by fluoride (Fig. 2, right side), the single proton can form a F⋯H⋯O configuration with the hydrogen being involved in two hydrogen bonds (denoted by ⋯), one with the fluorine and the other with the oxygen. The hydrogen is itself part of an OH group, but the oxygen in F⋯H⋯O is again the O2 site atop the SiO4 tetrahedron and not part of an OH group.
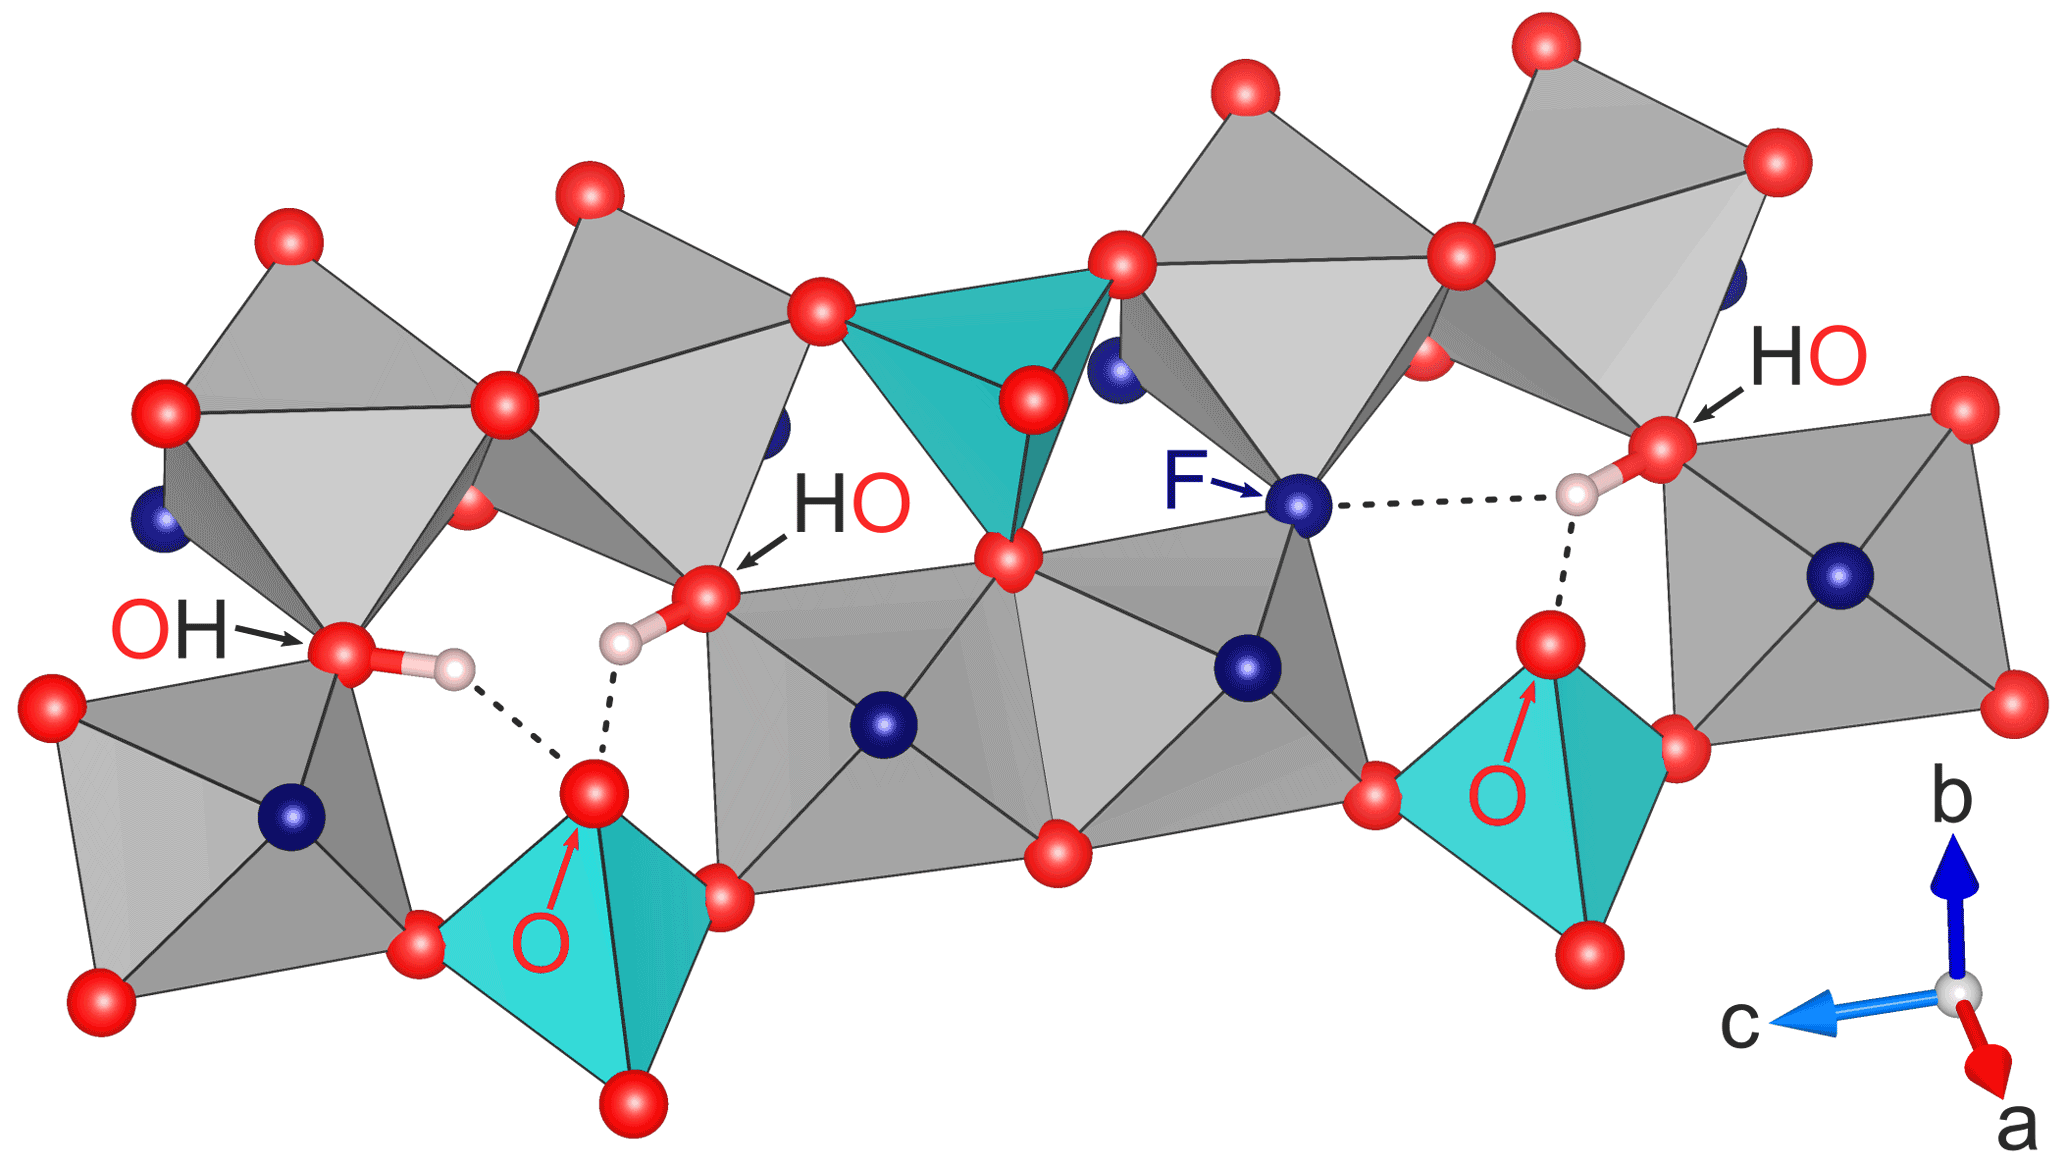
Figure 2Detail of the part of the structure of topaz with possible hydrogen bonds for different occupation constellations of neighboring sites. On the left side, both neighboring sites are occupied by OH groups, which allows the formation of two hydrogen bonds (OH⋯O⋯HO) with the O2 site atop the blue SiO4 tetrahedron. On the right side, the neighboring sites are occupied by one fluoride and one OH group each, causing the single proton to form a double hydrogen bond of the form F⋯H⋯O. All hydrogen bonds lie in the (010) plane, and only the involved anions are marked. All involved hydrogen bonds are similar in length (see text) despite appearing otherwise in the perspective drawing. Graphics produced with VESTA 3 (Momma and Izumi, 2011) from neutron diffraction data at 298 K by Gatta et al. (2006).
Up to four distinct bands between 3450 and 3650 cm−1 can be observed with vibrational spectroscopy methods at room temperature in OH-rich topaz (Al2SiO4Fx(OH)2−x with x≤0.84), which has two distinct hydrogen atom positions (Northrup et al., 1994; Wunder et al., 1999). Although topaz with x≥0.98 has only one hydrogen atom position, it still shows two of these bands between 3600 and 3650 cm−1 (Wunder et al., 1999). Structurally distinct sites have been proposed as an explanation for this phenomenon (Pinheiro et al., 2002, and references therein) and have been confirmed spectroscopically (Prasad and Gowd, 2003), which would also reduce symmetry from Pbnm, which is the space group that is observed by X-ray and neutron diffraction methods (e.g., Gatta et al., 2006). This apparent inconsistency may be explained by interactions between the OH bond and the fluorine atoms or OH groups occupying nearby sites. Each site is a shared corner of two Al-centered octahedra (Fig. 2) and has one directly neighboring site in the same anion layer. If one of these neighboring sites is occupied by OH hydroxo groups, the proton occupies the adjacent distorted octahedral void. If both are occupied by OH, the two protons must share this void. Using neutron diffraction, Parise et al. (1980) observed a lower symmetry (P1), as a result of non-equivalent hydrogen positions in topaz with F (F + OH) = 0.91. Watenpuhl et al. (2010) demonstrated that in their IR spectroscopic data of 17 topaz samples with statistically distributed F and OH on the site, ranging from F (F + OH) = 0.075 to 0.82, the ratio of the integrated areas under both sub-bands corresponds to the ratio of the probabilities of each OH group to have another OH group or a fluoride as its neighbor. The higher wavenumber peak corresponds to the OH bonds that are neighbored by fluoride. It has been suggested that two OH in neighboring sites may be energetically unfavorable and that this could be the reason for the rarity of topaz with >0.5 in nature (Barton, 1982).
Here, we investigate the local environment of both fluorine and hydroxy groups on the site in topaz with magic angle spinning nuclear magnetic resonance (MAS NMR) and Raman spectroscopy. To distinguish the interactions between F and OH moieties in neighboring sites, we compare data from near-end-member F topaz with those from an OH-bearing sample. To control for a possible effect of the rest of the lattice on the results, the coordination of both Al and Si was also investigated to evaluate the stoichiometry of the Si tetrahedra Al octahedra framework of the topaz. Ab initio density functional theory (DFT) calculations are used to test the plausibility of different explanation models for the experimental data.
2.1 Samples
Two topaz crystals from different locations were studied. The samples were chosen among several dozen of potential crystals from various locations based on clarity, crystal size, and low fluorescence in preliminary Raman tests. The latter was important since it allows better-quality Raman data and indicates low concentration of transition metals as trace elements, which might otherwise interfere with NMR analysis due to their magnetic properties.
The first sample was obtained commercially, and no precise provenance was available other than the country of origin, Pakistan. We will hereinafter call this sample TopP. The specimen was clear and colorless, with a length of about 1.5 cm along [001] and a diameter of about 1.0 cm. The {001} faces terminated in cleavage plains, whereas crystal faces and sedimentary rounding are found perpendicular to those. Judging by the size and shape of the TopP specimen, we speculate that it most likely originated from a pegmatite but was either transported in water some way or was rounded by some process during the mining of the pegmatite. The specimen was poor in fluid inclusions. Before powdering the samples for XRD and solid state NMR analysis, the sample was coarsely crushed and only chunks without visible inclusions were picked for powdering. The samples were powdered using a Fritsch Pulverisette 7 agate ball mill.
The second sample, TopT, comes from Topaz Mountain, Thomas Range, Juab County, Utah, USA, and is also clear and colorless. This locality is known for gem-quality topaz crystals very close to F end-member composition hosted in light-gray rhyolite (Patton, 1908; Ribbe and Rosenberg, 1971). Topaz is associated in this locality with other minerals typical of pneumatolytic alteration in highly evolved rhyolite, such as bixbyite, beryl, garnet, pseudobrookite, durangite, and cassiterite (Holfert et al., 1996). Topaz crystals from this locality are typically brown or reddish but will bleach in direct sunlight (Holfert et al., 1996). The crystal used for this study was colorless, approximately 0.5 cm long and wide, and had well-developed crystal faces and few inclusions. The specimen was coarsely crushed and only chunks without visible inclusions were picked under the microscope for powdering. These were then powdered as finely as possible by hand using an alumina ceramic mortar to avoid the slight agate contamination caused by the mill observed in sample TopP (see Results). The grain sizes of neither powder were analyzed, but the TopT powder was visibly coarser than the TopP powder.
2.2 Micro X-ray fluorescence analysis
The micro X-ray fluorescence (µ-XRF) measurements were performed at the Museum für Naturkunde Berlin using a Bruker Nano M4 Tornado Plus. The machine was operated under vacuum conditions of 0.2 mBar, using a rhodium target material anode as X-ray source and a polycapillary lens system to minimize beam size and maximize localized sample excitation. Emitted characteristic X-ray fluorescence was measured with two energy dispersive silicon drift detectors with an active area of 60 mm2 and a super light element window for element detection down to carbon.
Single point analysis was conducted at 50 kV acceleration voltage and 300 µA current, with a focused X-ray beam size of 20 µm. In order to eliminate diffraction peak interference, every analysis spot was measured sequentially with both detectors. Quantification was performed by peak area integration using a fundamental parameter algorithm included in the M4 Tornado software. A well-characterized in-house standard of gem-quality andalusite (with 0.15 wt % Fe2O3 as the only significant trace element) was used as reference material for the type calibration of Al and Si values. The quantification of F and O was standardless. Trace element detection limits for topaz as matrix are <200 µg g−1 for Na–Ca, <100 µg g−1 for Sc–Zn, and <50 µg g−1 for elements ≤ Ga. Elemental mapping was performed in a continuous measurement mode (which sets the dwell time per pixel by adjusting the stage movement velocity) using both detectors simultaneously at 50 kV, 600 µA, and with a dwell time of 50 ms per pixel. Pixel size was 20 µm for the mapping of sample TopP and 13 µm for TopT.
2.3 X-ray powder diffraction
The X-ray diffractometry (XRD) data were obtained at the Institute of Geological Sciences, Free University Berlin, using a PANalytical Empyrean diffractometer, equipped with a PIXcel1D-Medipix3 detector. Copper Kα radiation at λ=1.54060 Å was used with 40 kV acceleration voltage and 40 mA tube current. A 10 mm beam mask, 0.04 rad soller slits, and a fixed ∘ divergence slit were used on the incident beam, and 7.5 mm anti-scatter slit, 0.04 rad soller slit, and a 20 µm thick Ni Kβ filter were used on the diffracted beam. The powders were placed on a rotating stage and scanned from 15 to 80∘ 2θ in 4950 steps of 0.013∘ 2θ with a total counting time of 118 s.
2.4 Rietveld analysis and determination of fraction
Rietveld refinement of the XRD data was performed with the GSAS-II software package (Toby and Von Dreele, 2013). Plots of the observed and fitted XRD patterns are shown in Fig. S1 (Supplement). The instrument parameter file was produced from quartz powder as reference material, using the same measurement conditions as for the samples. Refined structural data of natural topaz obtained with neutron diffraction (Gatta et al., 2006) were used as a starting point for the refinement. The lattice parameters were refined, but the symmetry of the structure was kept fixed at Pbnm. The atomic positions of all atoms except H were refined. All parameters of the F anion and the O of the OH group were constrained to be identical. The occupancy of the F site was originally taken from Gatta et al. (2006) for the refinement as a first guess. The real occupancy was then calculated from the lattice b parameter provided by this first guess fit, using the calibration of Ribbe and Rosenberg (1971), and then manually fed back into the Rietveld software for another round of refinement. This was repeated until the b-parameter value converged to the fourth decimal. Three iterations were necessary for both samples.
The uncertainty of fraction stems predominantly from the error of the fluorine determination in the input data of the calibration by Ribbe and Rosenberg (1971). This absolute error of approximately ± 0.2 wt % F translates to 0.02 on the F-site occupancy or 0.01 on the fraction, based on then individual errors of the 13 samples reported by these authors. However, based on the excellent correlation of between F content and b parameter in the data from n=13 samples of Ribbe and Rosenberg (1971), we know that the relative error between any two topaz specimens is lower.
2.5 MAS NMR
Most of the 19F, 1H , 27Al, and 29Si MAS NMR spectra were measured at Humboldt University Berlin on a Bruker Avance 400 spectrometer (static field: 9.4 T; Larmor frequencies , , , MHz) using a 2.5 mm MAS probe (Bruker BioSpin) and applying a rotation frequency of 20 kHz unless otherwise indicated.
19F MAS NMR spectra were measured with a pulse duration of 4.4 µs, a spectrum width of 400 kHz, and a recycle delay of 240 s. The isotropic chemical shifts δiso of 19F resonances are given below with respect to the CFCl3 standard. 1H MAS NMR spectra were recorded with different recycle delays ranging from 5 to 60 s to check the characteristics of the signals, a pulse duration of 3.5 µs, and a spectrum width of 100 kHz. The number of accumulations (ns) is given in the captions to the figures for comparison (where appropriate). Existent background signals of 19F and 1H were suppressed with the application of a phase-cycled depth pulse sequence according to Cory and Ritchey (1988).
The 27Al MAS NMR spectra were recorded with a recycle delay of 2 s, and the chemical shifts are given with respect to an aqueous AlCl3 solution. For the 29Si MAS NMR spectrum a 4 mm probe (Bruker BioSpin) was used applying a rotation frequency of 10 kHz. With a recycle delay of 300 s and 522 accumulations a total measurement time of about 5.5 d was necessary. Both the 29Si chemical shifts and the 1H chemical shifts are given with respect to tetramethylsilane (TMS).
Additional 19F MAS NMR experiments were performed at BAM (German Federal Institute for Materials Research and Testing) with a Bruker Avance 600 spectrometer under a static field of 14 T ( 564.7 MHz). The samples were packed into 2.5 mm zirconia rotors with Vespel top and bottom plugs and spun at 35 kHz under the magic angle (MAS) in an HFX triple resonant wide bore probe at room temperature. Typical acquisition parameters were a repetition period (d1) of 240 s and 4.4 µs for the 90∘ pulses. The EASY pulse program (Jaeger and Hemmann, 2014) was applied, in which two 90∘ pulses were irradiated with a short delay (0.1–10 ms) in between. By subtracting the free induction decay (FID) after each of those pulses, the background signal was canceled. Subsequent processing involved Fourier transformation, phase adjustment, and baseline correction (Bernstein polynomials, fourth order or higher).
2.6 Raman spectroscopy and fitting
The Raman spectra were recorded in reflection geometry on a WITec alpha300 R with a 532 nm laser, using a Zeiss EC Epiplan objective and ca. 20 mW laser power on the sample. Measurements were taken on the cleavage plane (001) and on well-developed (010) crystal faces. The incident laser was circular polarized with a plate. No analyzer or other filter was applied to the signal. A UHTS300 VIS spectrometer with a 1800 mm−1 grating and a 1650 line charge coupled device (CCD) area detector was used. Recording time for single spectra was 10 s in all cases, with 360 accumulations for the high-resolution measurements of the OH-band region around 3650 cm−1 and 30 accumulations for the lattice band region spectra (ca. 100–1200 cm−1). Calibration of the spectrometer was preformed immediately before each measurement and verified after each measurement, using the integrated Hg(Ar)-lamp calibration routine of the instrument. Correctness of this procedure was verified via the 520.7 cm−1 band of a silicon wafer. This band was fitted using a pseudo-Voigt profile, and the deviation from 520.7 cm−1 was less than 1 cm−1 in all measurements. Cosmic ray events were filtered out by removing all single spectrum pixels that deviated by more than 5σ from the average for the same pixel over the course of all accumulations. All spectra were subsequently corrected for the read-out and dark-current background of the detector, which were recorded as 1200 accumulations of 1 and 10 s, respectively, with no signal on the detector. Fitting of the Si and OH bands was performed with a custom Python 3 script utilizing the NumPy and SciPy libraries.
2.7 Computational methods
All computations in this work were performed by applying the Vienna Ab Initio Simulation Package (VASP) (Kresse and Hafner, 1993, 1994; Kresse and Futhmüller, 1996a, b). Within the VASP code, plane wave DFT with the Perdew–Burke–Ernzerhof (PBE) functional (Perdew et al., 1996), together with the projector augmented wave (PAW) potentials (Kresse and Joubert, 1999) and the Γ-centered Monkhorst–Pack grid of size (Monkhorst and Pack, 1976), is employed. Dispersion corrections were included via the D3 method (Grimme et al., 2010) including Becke–Johnson damping (Grimme et al., 2011). The convergence criteria for the electronic self-consistent field loop were set to eV. The plane wave cut-off criterion was set to 500 eV for the optimizations, which are done by applying the residual minimization method with direct inversion in the iterative subspace (RMMDIIS) (Wood and Zunger, 1985; Pulay, 1980), together with the tetrahedron method with Blöchl corrections (Blöchl et al., 1994).
3.1 Composition and F OH content of the topaz samples
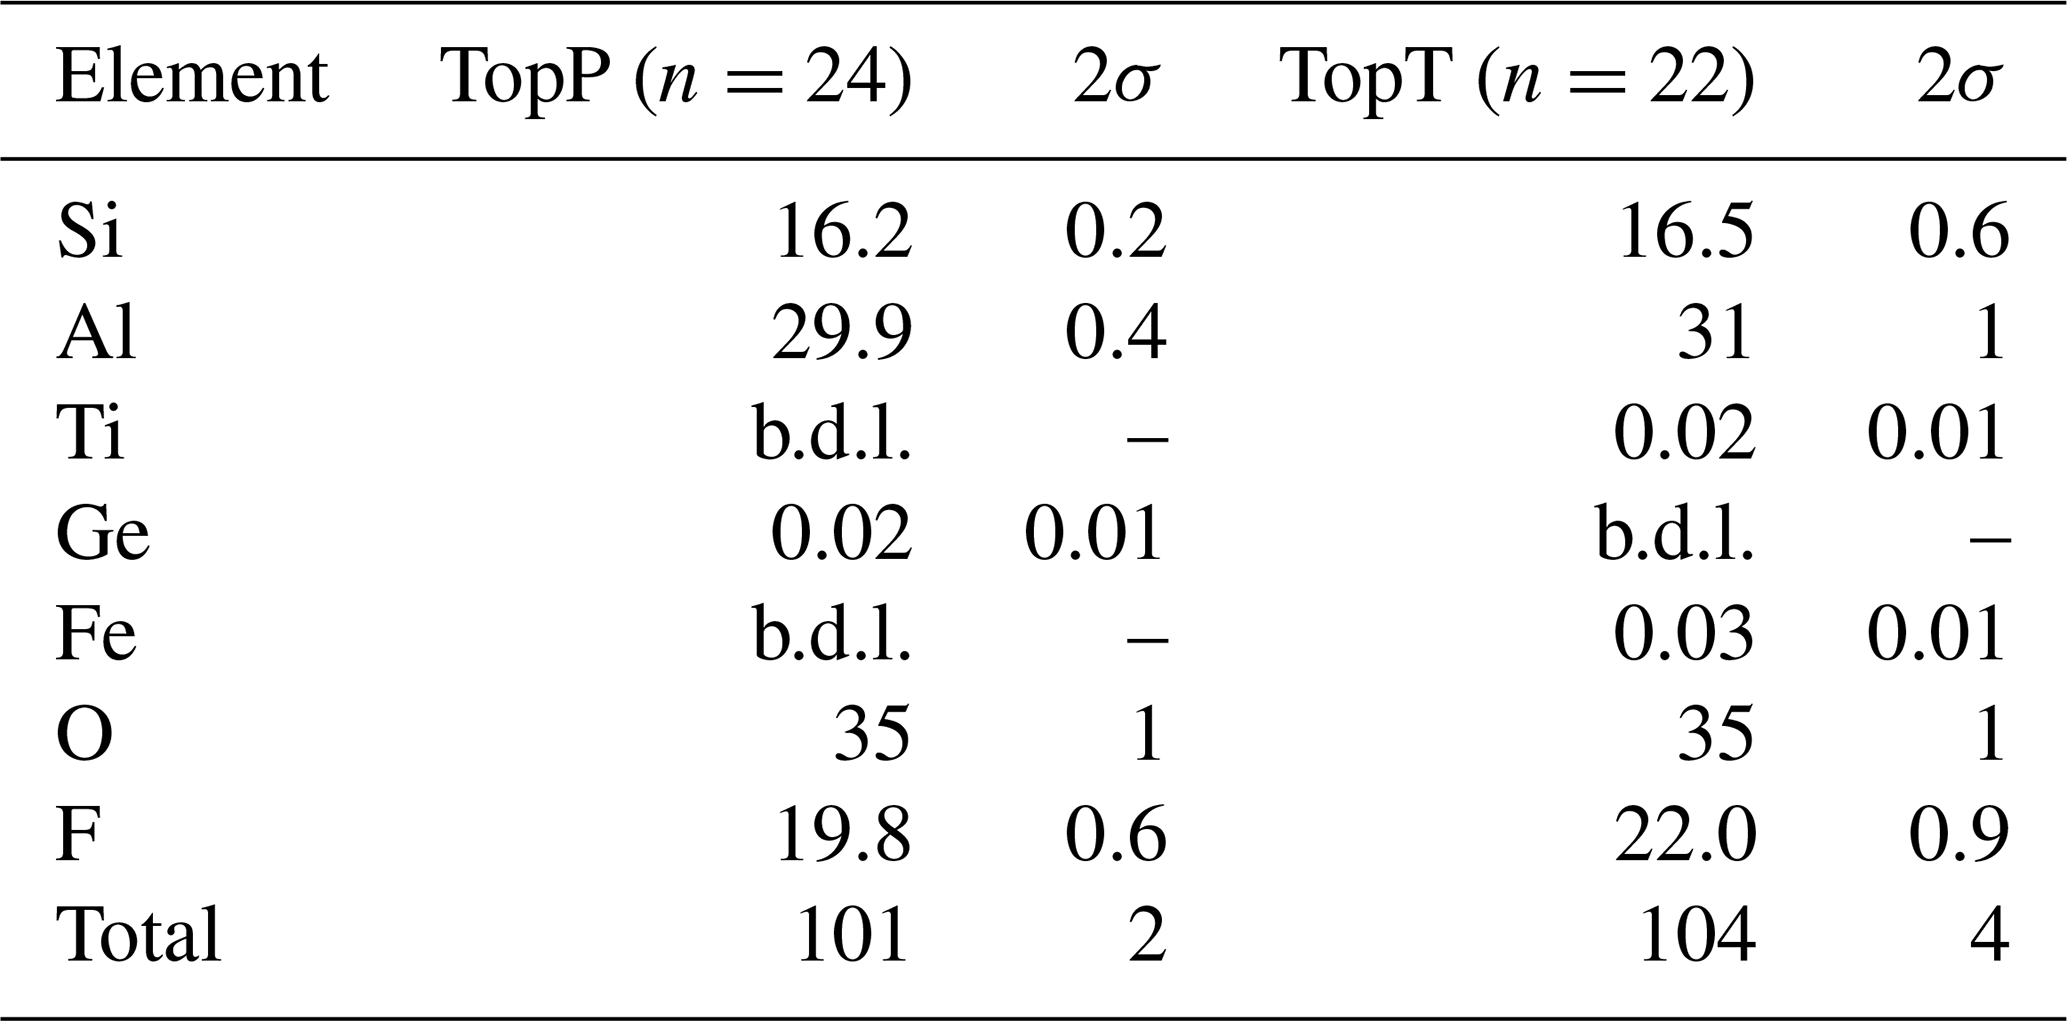
The composition of the samples as measured by µ-XRF is given in Table 1. Each sample was analyzed on multiple spots, and averages are reported along with 2σ variation among the spots. Several factors complicate the analysis of the major element composition of topaz. It is known that X-ray emission intensity of fluorine in topaz is strongly dependent on the orientation of the crystal lattice to the detector (Ottolini et al., 2000) due to orientation-dependent absorption in the crystal. This means that adequate correction of the absorption effects, which is necessary for any accurate analysis based on X-ray emission (like XRF and electron microprobe analysis), requires either standardization to an orientation-matched reference topaz of similar composition or a theoretical absorption correction that takes orientation into account. Neither of these are currently available. Similar but less well documented problems affect the silicon absorption correction. The Kα emission line of Si is strongly affected by the absorption edge of Al, which makes the correction highly sensitive to density and anisotropy of the sample, especially if it contains much more Al than Si, as is the case for topaz. These challenges impose additional (not generally quantifiable) uncertainties on the analysis for F and Si. The µ-XRF data are therefore used primarily to check for the presence of significant minor or trace elements and of potential zonation in the major element composition. The only detectable trace elements were Ge in sample TopP and Ti, as well as Fe, in TopT. No zonation or heterogeneity was observed for Al, Si, or F in either sample (see Supplement Figs. S2 and S3). The trace elements do show growth zoning in sample TopP (Ge shown in Fig. S2) and growth, as well as sector zoning, in sample TopT (Ti shown in Fig. S3). However, due to the low concentrations of the trace elements (Table 1), neither of these are expected to have any observable effect on the 19F NMR signal or the OH band in Raman spectra. Therefore, these results will not be further discussed. Based on the observation that no tetrahedrally coordinated Al was identified with NMR, the ratio can be assumed to be near ideal, which is in agreement with the µ-XRF data, considering the respective analytical uncertainties. Due to the large uncertainty on F quantification, we rely on the correlation of lattice parameters with the ratio (Ribbe and Rosenberg, 1971) to determine the latter.
Table 1Results of µ-XRF spot analyses (in wt %). See text for analytical issues. b.d.l. denotes below detection limit.
The XRD patterns are shown in Fig. S1. Sample TopP shows a small reflection at 2θ=26.6∘, which corresponds to the main peak of quartz and contamination by agate from the ball mill used for this sample. Therefore, sample TopT was pulverized using a corundum hand mortar, which did not cause visible contamination but instead textured particles due to the single cleavage plain of topaz in (001), as can be seen as a texture effect in Fig. S1b. The content of the samples was calculated from the b lattice parameter results of the Rietveld analysis of the XRD data using the calibration (F[wt %] = 892.5–99.2b) in Table 2 of Ribbe and Rosenberg (1971). The results of the Rietveld analysis and the corresponding contents are listed in Table 2. If we assume a perfect statistical distribution of fluoride and hydroxide on the site, we can calculate the probability of any two neighboring sites being occupied by either two fluorides, one fluoride and one OH group, or two OH groups from the proportions XF and XOH on the lattice site. The probability for two fluoride neighbors is simply X, and for two OH neighbors it is X. For two different neighbors, the probability is 2⋅ XF ⋅ XOH. For sample TopP with XF= 0.94 ± 0.01, 88.36 % of the site pairs should have two fluoride ions sitting in the two neighboring positions, whereas 11.28 % should have one fluoride and one hydroxide neighbor, and 0.36 % should have two hydroxide neighbors, assuming perfect disorder on this site. The result of XF= 0.99 ± 0.01 for sample TopT is consistent with an end-member fluorine topaz composition, within experimental error. However, if we assume XF= 0.99, 98.01 % of all site pairs would have two fluorides, 1.98 % would have one fluoride and one hydroxide, and 0.01 % would have two hydroxides.
Table 2Results of the Rietveld lattice parameter fits and corresponding F content. X OH) [mol mol−1].

3.2 Nuclear magnetic resonance spectroscopy
Two signals can be unambiguously distinguished in the 19F MAS NMR spectrum of the sample TopP (Fig. 3a). With measurements applying different recycle delays up to 240 s, an identical spin–lattice relaxation behavior was found, and the relative intensity of both signals did not change. The spectrum recorded at 14 T (Fig. 3a, dashed) allows a higher resolution and the identification of an additional small shoulder at ca. −132 ppm. The deconvolution of the spectrum resulted in a contribution of about 90 % of the resonance with the maximum at −135 ppm and about 10 % for the second resonance at −130 ppm. Here we assume that the EASY pulse program will only slightly compromise the quantitative fidelity of the acquired signals.
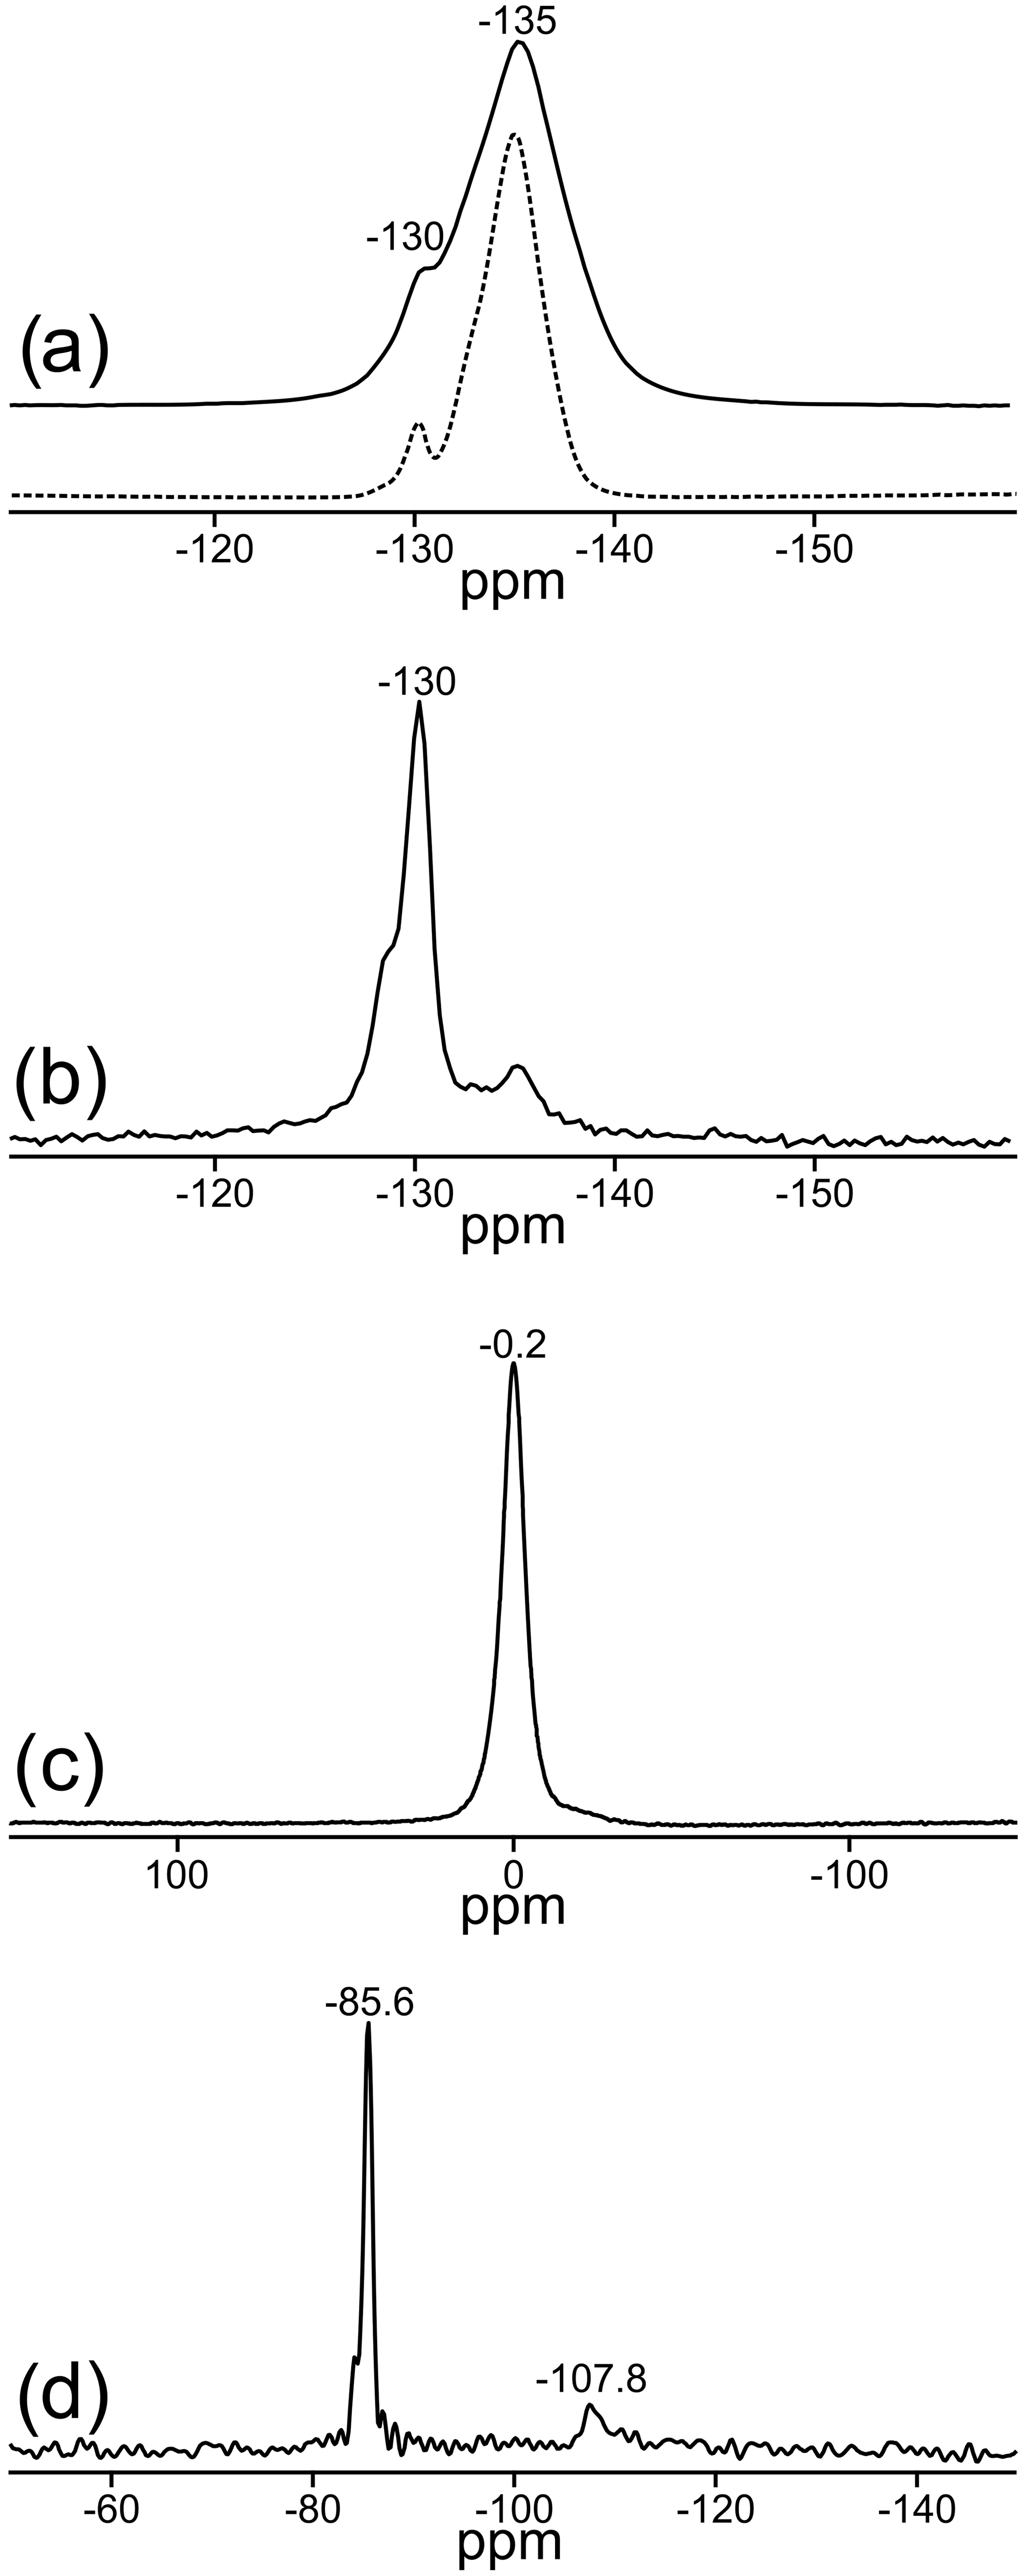
Figure 3Central regions of the MAS NMR spectra of TopP: (a) 19F: solid line: νrot=20 kHz at a field of 9.4 T; dashed line: νrot=25 kHz at a field of 14 T, relative to CFCl3 reference; (b) rotor-synchronized 19F spin-echo spectrum, recorded with a dipolar evolution time of 1.25 ms (ns = 1024); (c) 27Al relative to AlCl3; (d) 29Si relative to tetramethylsilane.
In accordance with the data from X-ray diffraction the signal at −135 ppm (∼ 90 %) represents sites in the chains with two F− ions in neighboring positions, while the signal at −130 ppm (∼ 10 %) originates from sites with one fluoride and one hydroxide as neighbors. Rotor-synchronized spin-echo experiments confirm these findings and suggest a completely different spin–spin relaxation behavior of both F sites. Signals with good spin–spin interaction, i.e., two neighboring F− ions with short spin–spin relaxation time, disappear first, which is clearly visible for the behavior of the resonance at −135 ppm (Fig. 3b). For comparison, similar 19F MAS NMR spectra of two commercially available zharchikhite and topaz samples are also shown in Fig. S4.
Only one signal at −0.2 ppm can be detected in the 27Al MAS NMR spectrum (Fig. 3c). Its chemical shift indicates exclusively six-fold coordinated Al sites with the possibility of local (AlO4F2) or (AlO5F) coordination environments (König et al., 2008a, b). The existence of the latter two mentioned local units is also confirmed by the position of the 19F signals in Fig. 3a (König et al., 2008a).
The 29Si MAS NMR spectrum of TopP is depicted in Fig. 3d. The NMR signal at −85.6 ppm is typical for the presence of SiO4 units in the structure. The small shoulder at −84.5 ppm hints at deviations due to the hydrogen bridging network, which is also verified by 1H–29Si cross-polarization experiments (not shown here). The signal at −107.8 ppm is in the typical range for so-called SiO4–Q4 groups with Si–O–Si bonds and is very likely due to the contamination by agate from the ball mill used for sample TopP, which is also observed in the XRD data.
The 1H MAS NMR spectrum of TopP is shown along with the rotor-synchronized spin-echo 1H spectra in Fig. 4. Four 1H containing entities can be identified with signals at 4.9, 2.8, 1.1, and −0.3 ppm. The deconvolution of the spectrum in Fig. 4a is shown in Fig. S5 (Supplement). All 1H nuclei differ not only in chemical shift but also in the spin–lattice and spin–spin relaxation behavior. The spin–lattice relaxation time of the narrow 1H signal at 2.8 ppm is very long, and even with a recycle delay of 60 s the relaxation is not finished. This is an unusual behavior for most of the 1H species but typical for isolated 1H sites in well-ordered systems. The spin-echo spectra clearly show the disappearance of the signal at 4.9 ppm (dashed line in Fig. 4), which is generated by hydrogen-bonded H positions (Figs. 4b, c, S5), whereas the 1H signals at 2.8 and 1.1 ppm can be attributed to isolated OH groups.
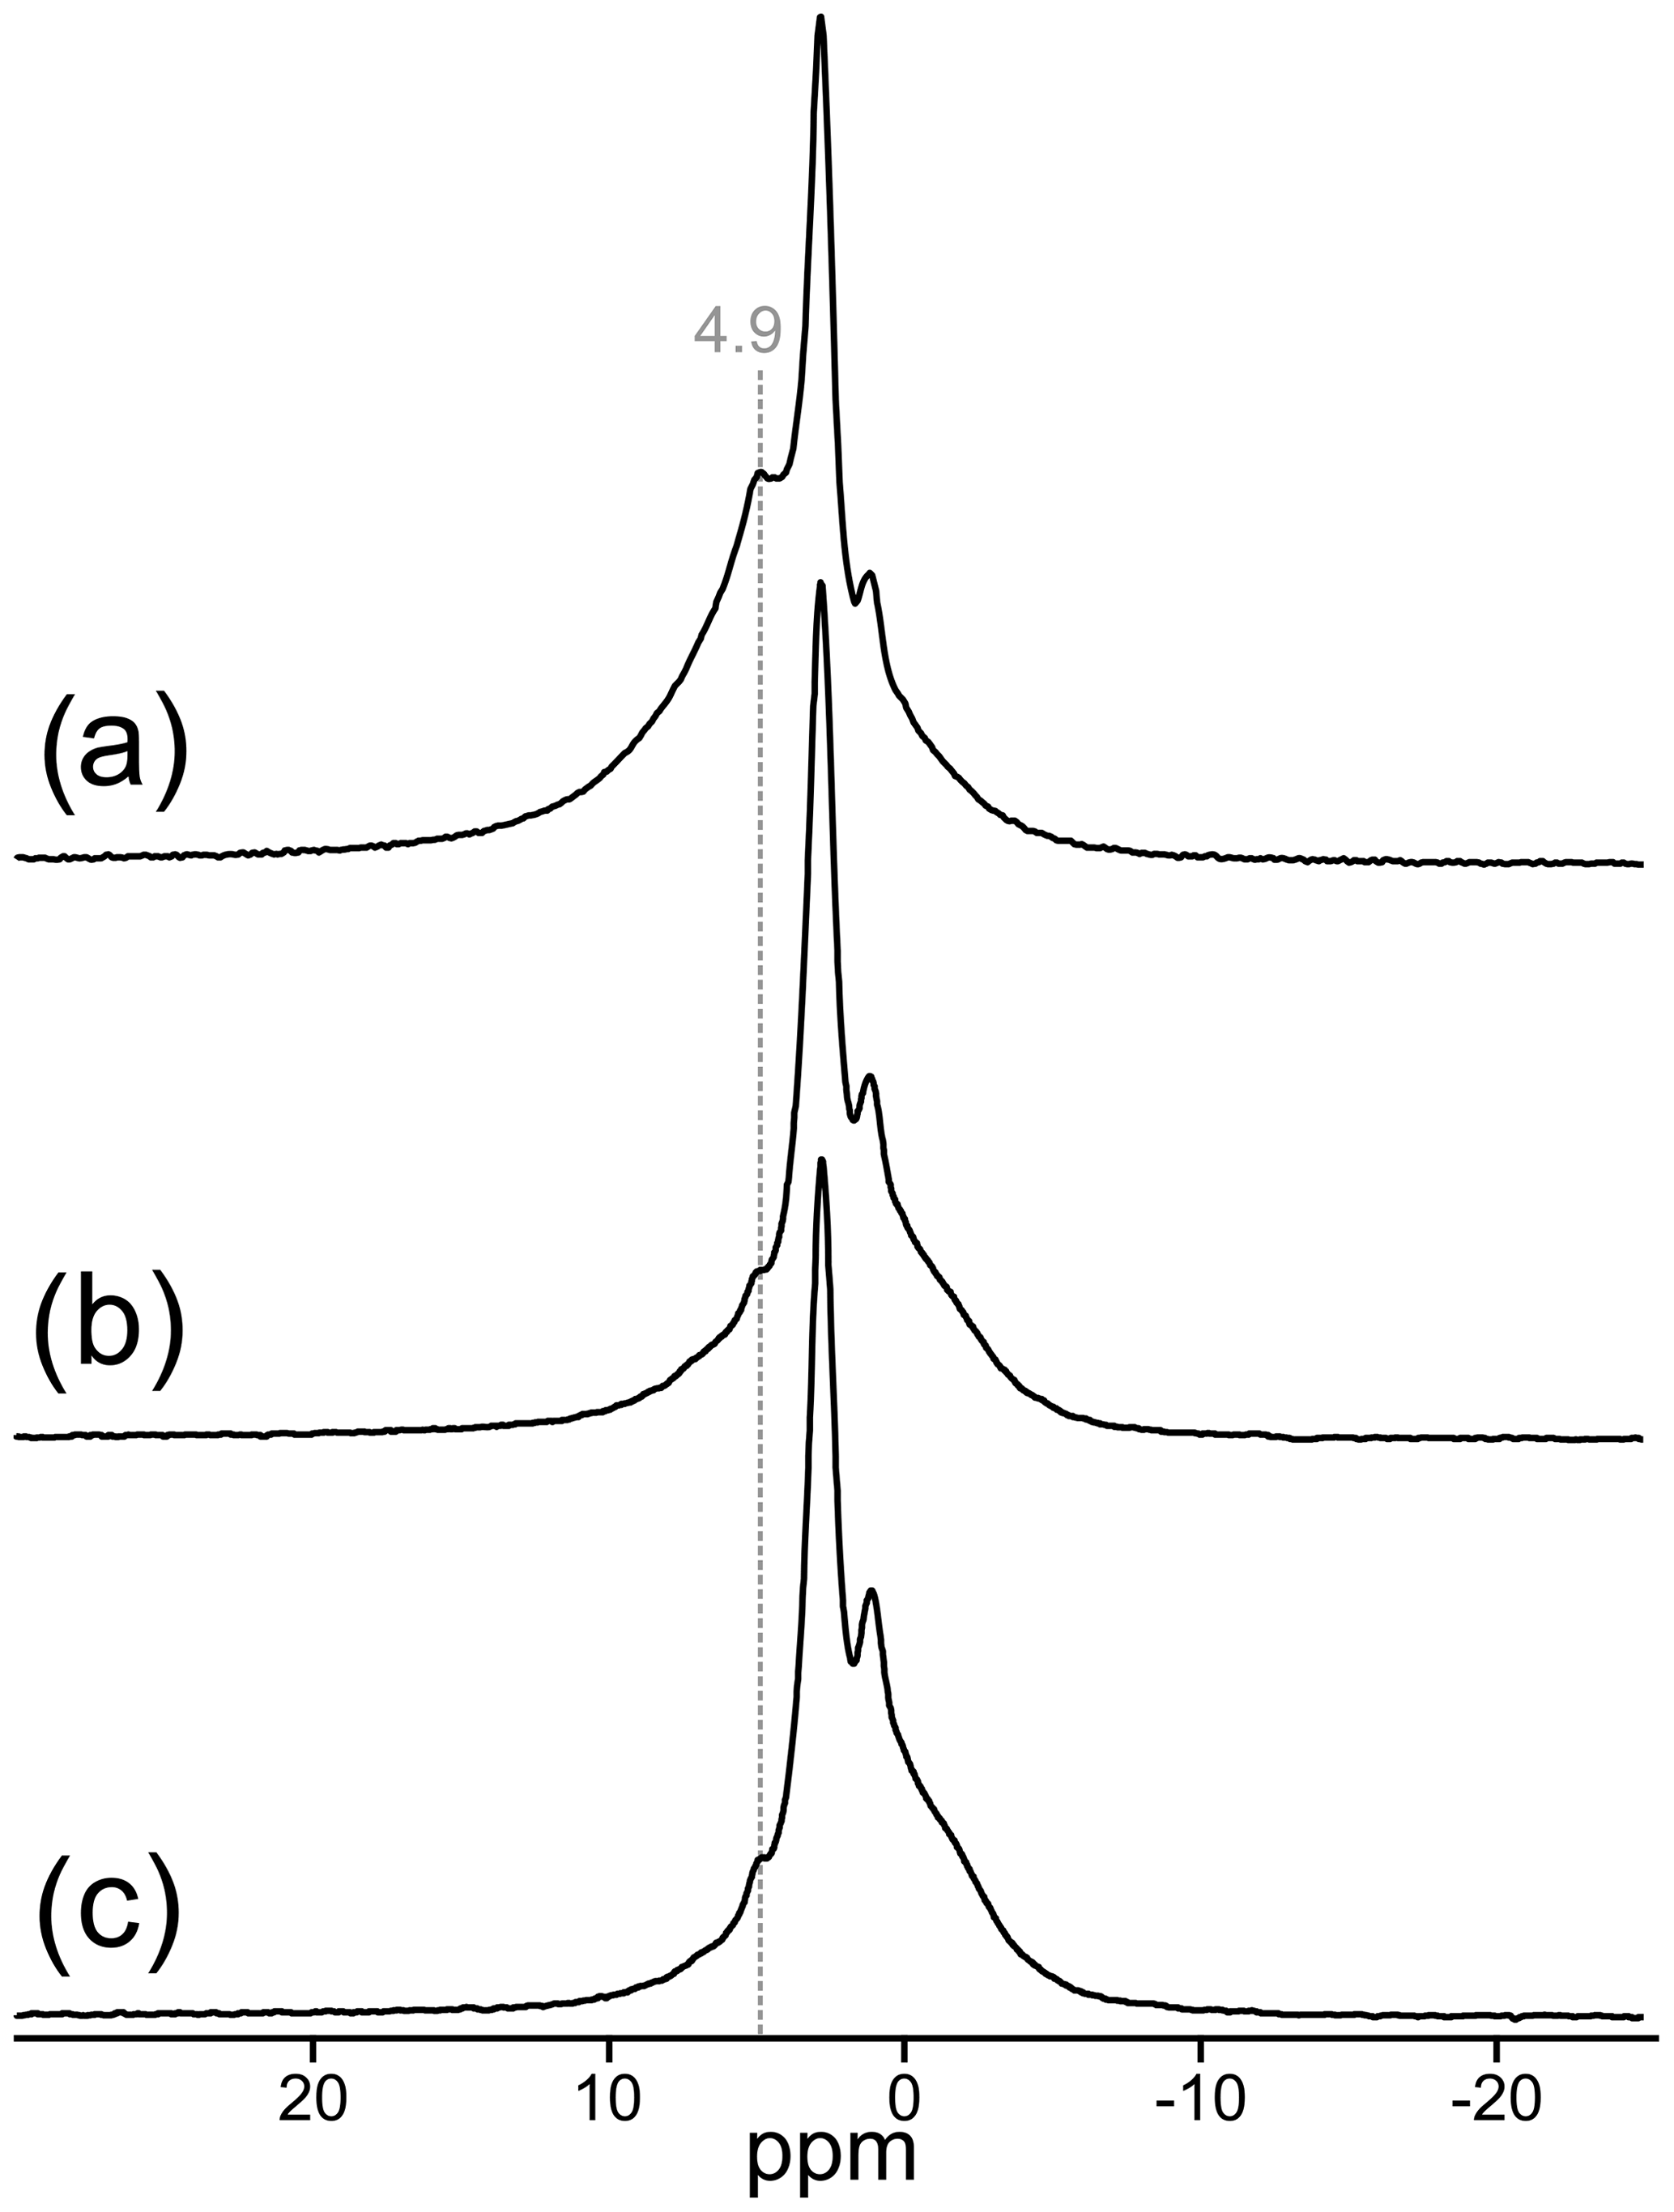
Figure 4Central region of the 1H MAS NMR spectrum of TopP (a) relative to tetramethylsilane; rotor-synchronized 1H spin-echo MAS NMR spectra of TopP with dipolar evolution times of 0.5 (b) and 1 ms (c).
The 19F, 27Al, and 1H MAS NMR spectra of the OH-poor topaz TopT are given in Fig. 5. Only one 19F signal at −135 ppm can be detected representing fluoride with another fluoride in neighboring positions, as found by X-ray diffraction with a portion of about 99 %. An extremely small signal at −130 ppm can be visualized only with rotor-synchronized spin-echo measurements (Fig. 5b). As for the OH-rich sample TopP, the symmetric 27Al signal at −0.2 ppm has the typical chemical shift for six-fold coordinated Al sites with one to two fluorine atoms in their first coordination sphere (König et al., 2008a, b). The low OH content of TopT manifests also in the very large number of accumulations (ns = 1024) necessary for the registration of the 1H MAS NMR spectrum with a good signal-to-noise ratio (Fig. 5d). All observed signals, and especially the narrow signal at 1.3 ppm, are in the typical range for isolated OH groups (Scholz et al., 2010).
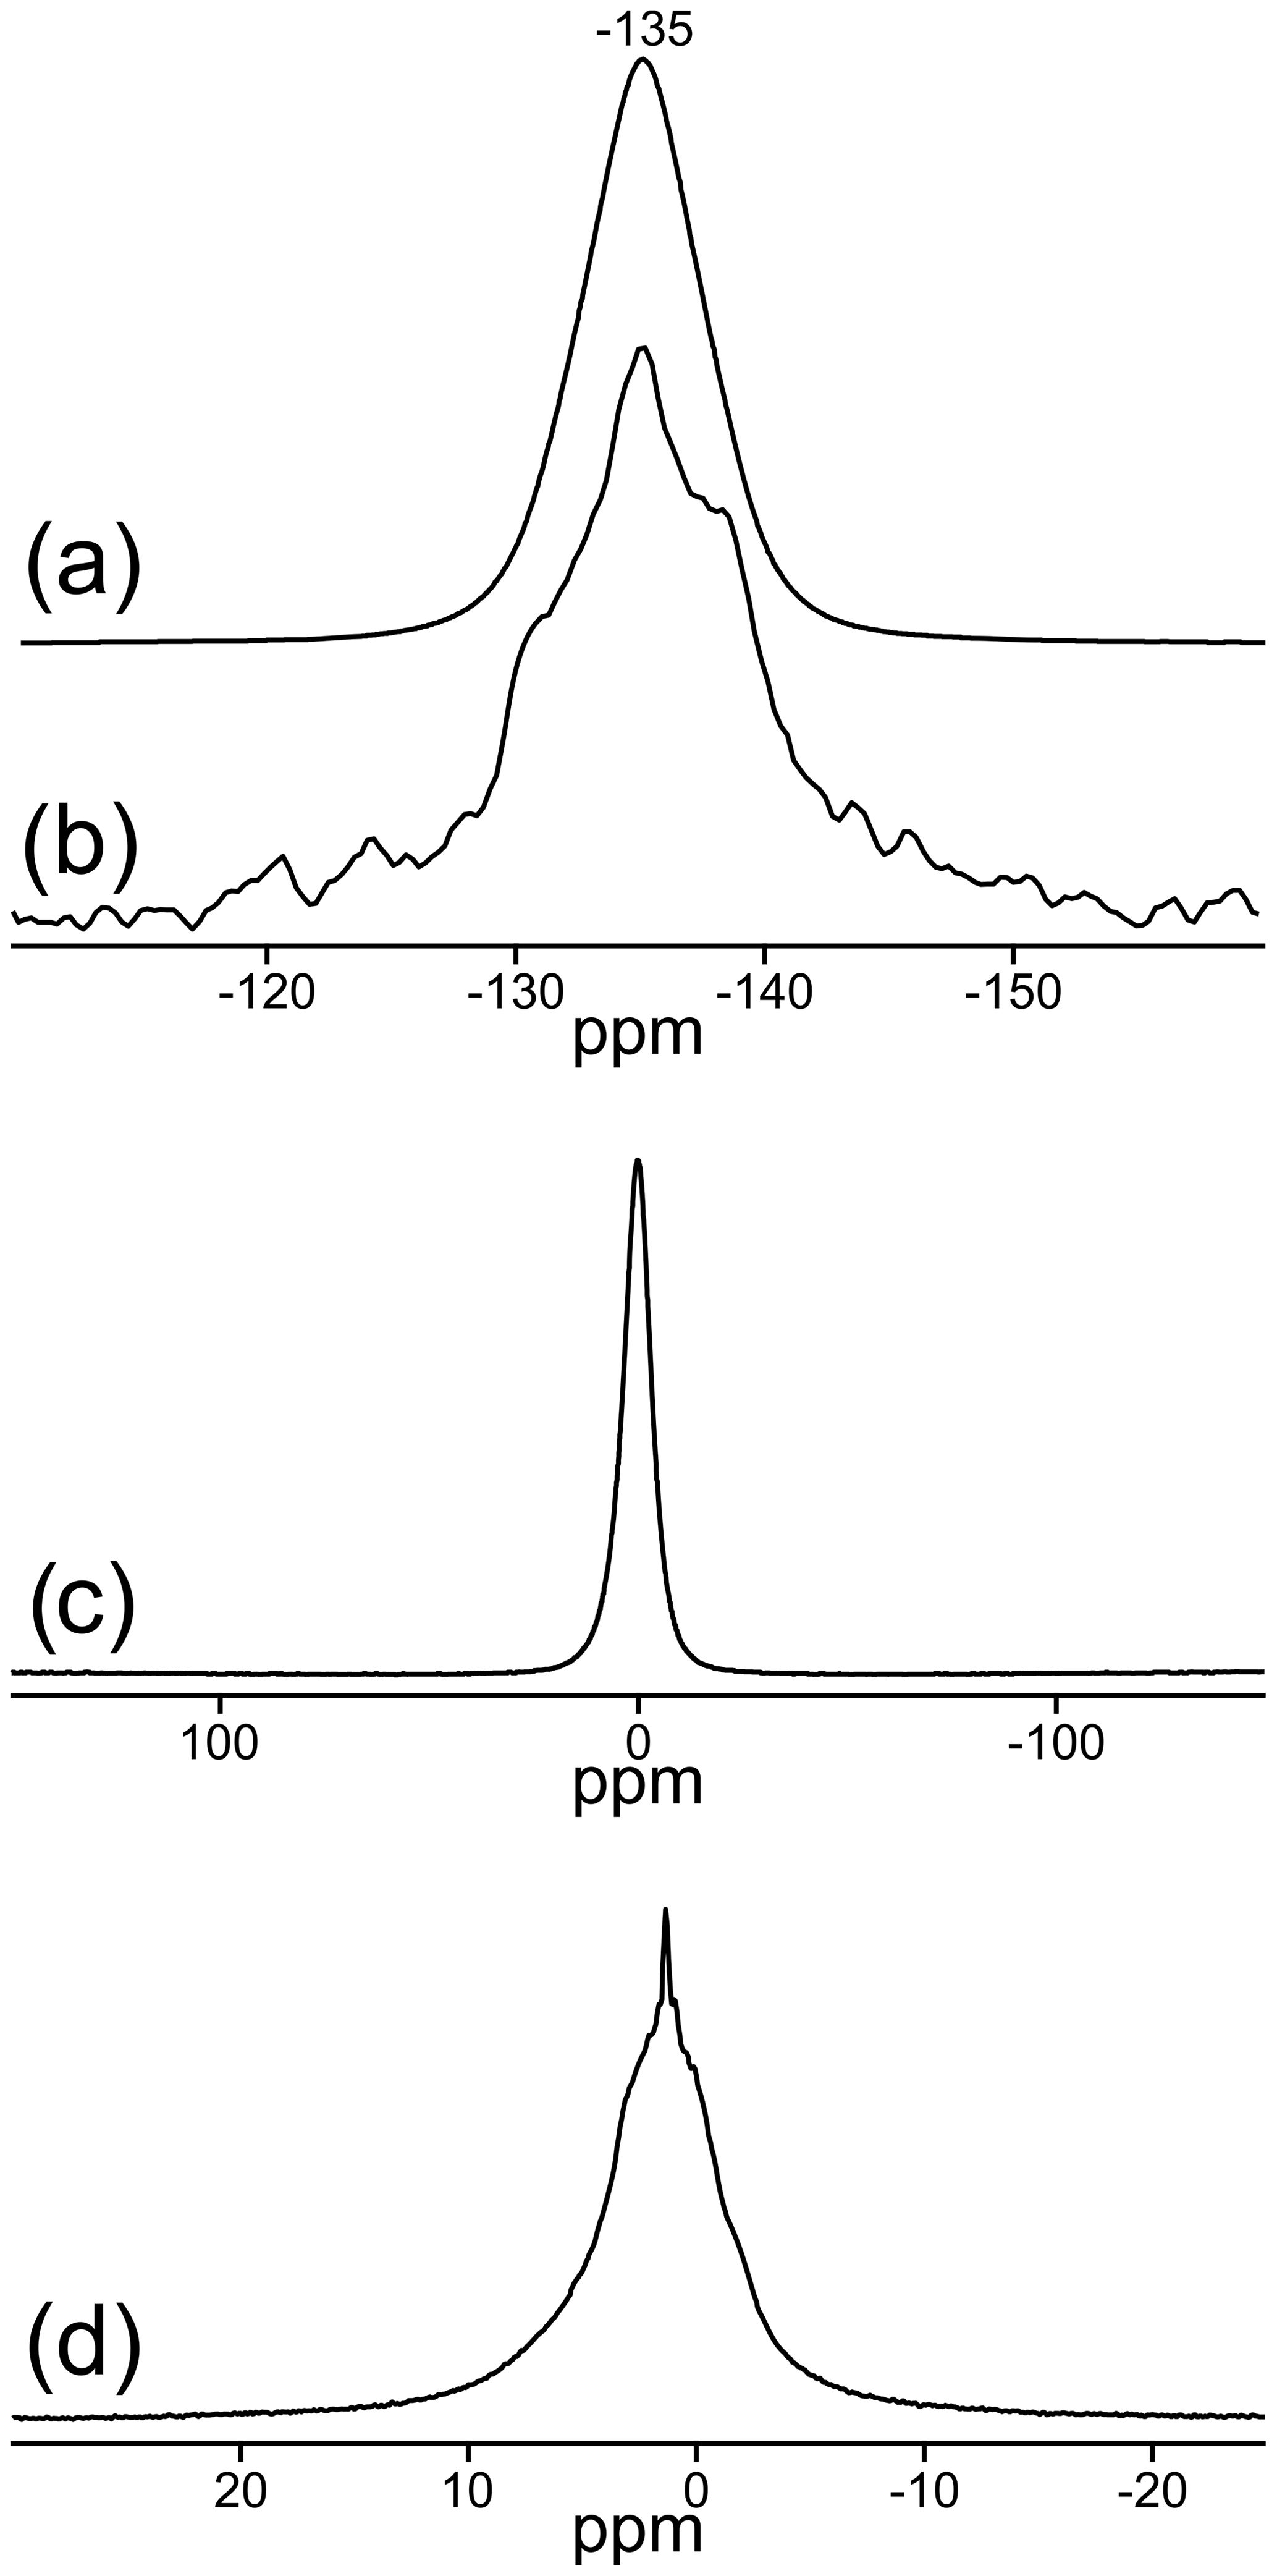
Figure 519F, 27Al, and 1H MAS NMR spectra of TopT: (a) 19F (ns = 32) relative to CFCl3; (b) 19F rsecho (ns = 4096), dipolar evolution time of 1 ms; (c) 27Al relative to AlCl3; (d) 1H (ns = 1024) relative to tetramethylsilane.
3.3 Raman spectroscopy of the OH band
Raman spectra of both samples are shown in Fig. 6. Sample TopT is homogeneous with respect to the Raman spectrum; therefore only one exemplary analysis is shown. Sample TopP shows slight differences in the overall fluorescence background, as well as the shape of the OH band between the innermost core and the rim of the sample. Therefore, one point from the core and one from the rim were chosen for detailed analysis with the incident laser direction parallel [001]. An additional analysis with the laser parallel [010] is also shown.
The lattice band positions and height ratios show fairly little difference between the two samples when measured in the same orientation (Fig. 6a). However, TopP has a clear OH band at 3650 cm−1, which TopT does not have. TopT also has a higher fluorescence background that increases to higher wave numbers. The region around 3650 cm−1 is shown in detail in Fig. 6b, not stacked but in raw counts per second from high-resolution spectra with 360 accumulations of 10 s. No OH band was found in any of the analyzed TopT spots; therefore only one representative spectrum is shown. It is obvious that the elevated background of TopT is less smooth than the background of the two TopP spectra. However, this is not statistical noise but the texture of the fluorescence that causes the background elevation. It is not clear what the lowest OH group concentration in the sample would be that would still result in a visible OH band. We can only state with certainty that there is no Raman evidence for OH groups in TopT. This is in agreement with the XRD findings.
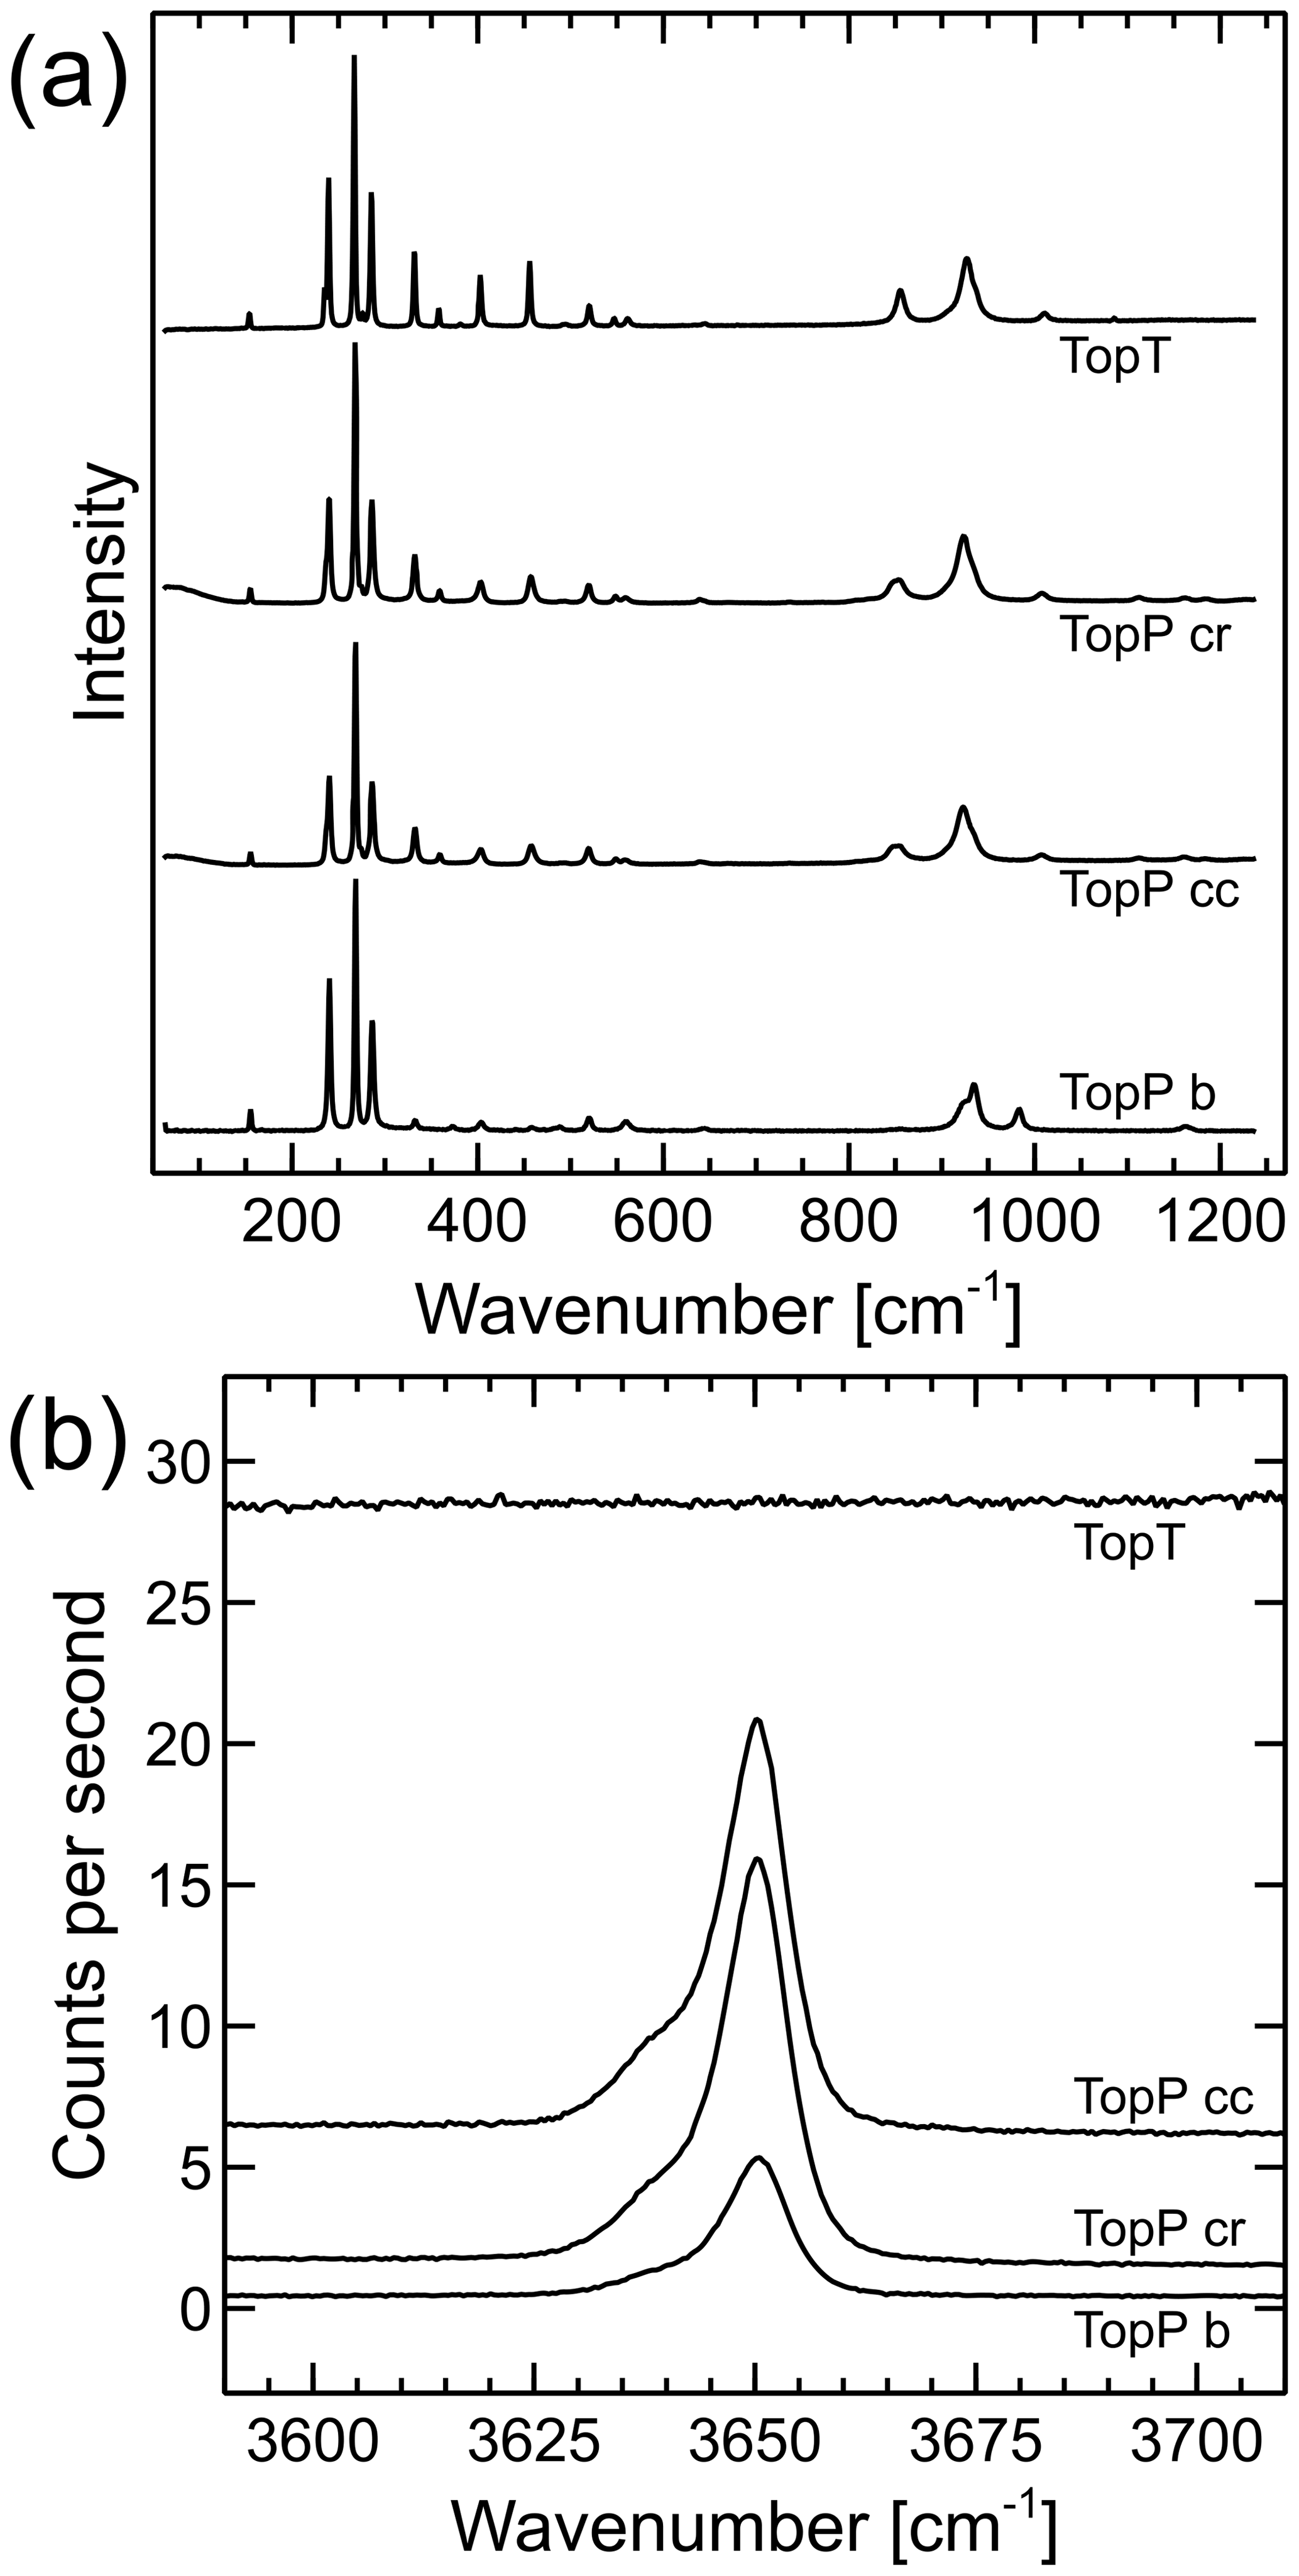
Figure 6Raman spectra of sample TopP analyzed with the incident laser along the b axis or [010] direction (TopP b) and along the c axis or [001] direction near the center (TopP cc) and rim (TopP cr), as well as of sample TopT. (a) Spectra of the lattice band region, scaled to the same maximum peak height and stacked. (b) Detail of the OH-band region from high-resolution spectra, absolute counts per second, not stacked or shifted. No background correction or processing was applied apart from cosmic ray removal, as well as detector readout and dark current corrections.
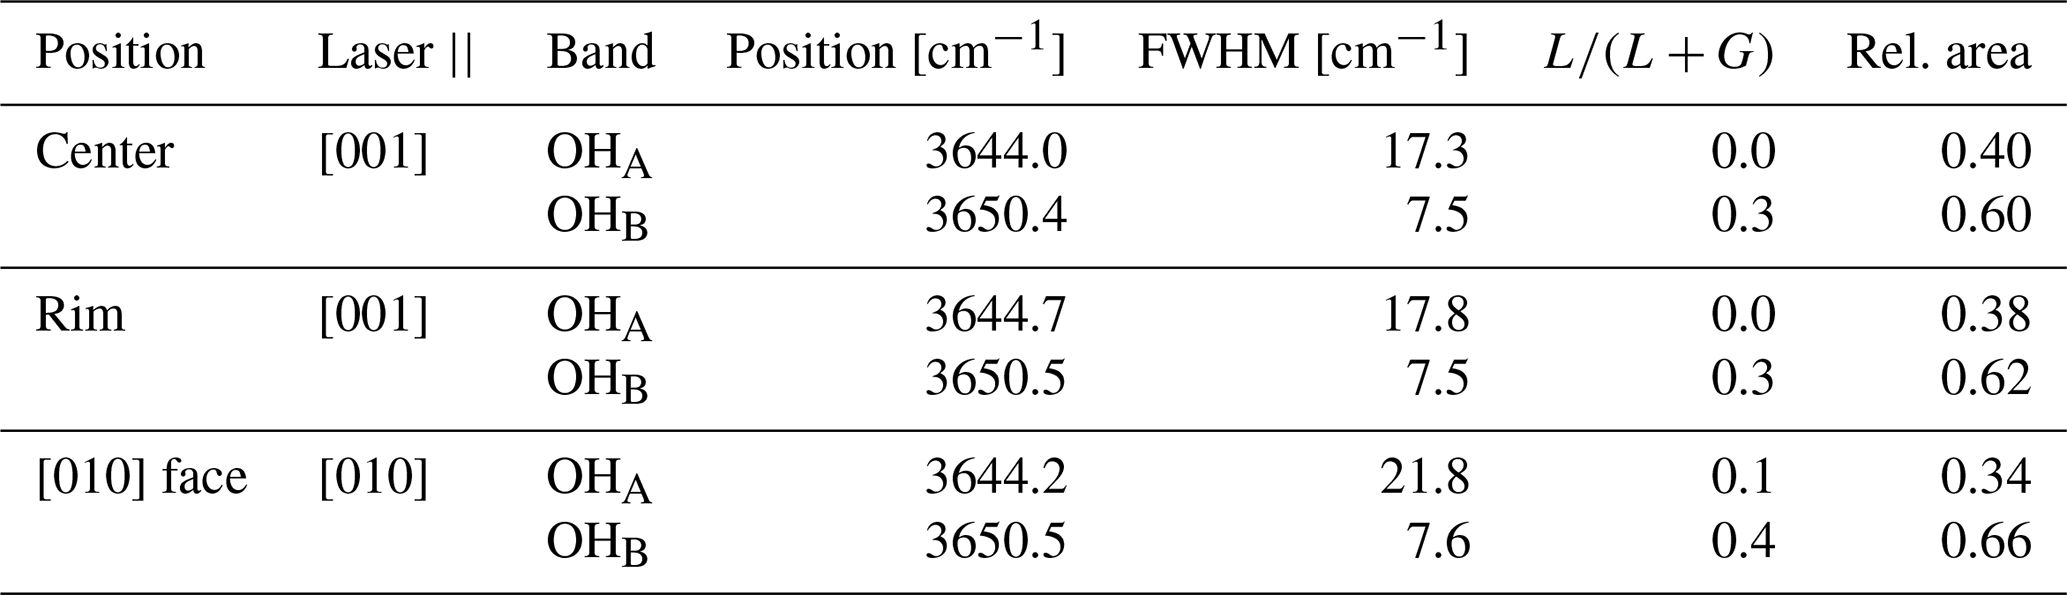
The OH bands of TopP in Fig. 6a show a shoulder to lower wavenumbers of the main peak. This band splitting has been described previously, and we will call the two bands OHA and OHB in keeping with the convention used by Pinheiro et al. (2002). Fitting of the peak parameters was performed assuming a linear background between 3610 and 3690 cm−1 and two pseudo-Voigt profiles. The resultant fit parameters are summarized in Table 3.
Table 3Summary of fit results of OH Raman bands in sample TopP. FWHM signifies full width at half maximum. denotes the Lorentzian proportion of the linear combination Lorentzian + Gaussian (a.k.a. pseudo-Voigt) profile.
3.4 Density functional theory computations
We have performed DFT calculations for various different OH substitutions in the fully fluorinated topaz structure. The crystallographic unit cell contains eight fluoride ions, which can be replaced by hydroxide ions. Because the investigated natural topaz samples are on the fluorine-rich side, we performed structure optimizations at XF= F (F + OH)molar=0.5, 0.75, and 0.875. For the former two, various symmetrically non-equivalent substitution patterns are possible. The lattice parameters of the optimized structures are summarized in Table 4.
The substitution pattern for the XF=0.5 case yields an interesting insight in the local structure. It is theoretically possible to sort OH and F into two separate planes (Fig. 7b), but this distribution is the least energetically favorable (Table 4). In this structure, both six-fold coordinated aluminum centers with two fluoride and ones with two hydroxide ions occur. If the same local pattern occurs, but not all OH are arranged in one plane, the structure (Fig. 7c) is stabilized by 0.26 eV per unit cell. A further reduction in energy by 0.08 eV can be achieved, when each aluminum center carries one F and one OH anion, yielding the most stable structure (Fig. 7d) for XF=0.5 distribution. All OH groups have the same O–H bond length of 0.974 Å in this structure.
Table 4Calculated energies and lattice parameters for the structures presented in Fig. 7. X OH) [mol mol−1].

4.1 Nuclear magnetic resonance spectroscopy
The local environments of Al and Si depicted by 27Al and 29Si MAS NMR spectra are in agreement with the published structure of topaz (e.g., Gatta et al., 2006) and the X-ray diffraction results (Figs. 3, 5). Aluminum is exclusively octahedrally coordinated, and silicon is exclusively tetrahedrally coordinated, which, in this simple structure, suggests that the ratio is very close to the theoretical stoichiometric ratio of 2. We therefore assume that the samples are ideally stoichiometric topaz (Al2SiO4(F, OH)2), which is in agreement with the µ-XRF results. The small shoulder of the 29Si signal around −84.5 ppm (Fig. 3d) is likely indicative of some H⋯O bonding involving the O2 site, which is part of the SiO4 tetrahedron and the closest oxygen position to the hydrogen of the OH group (Gatta et al., 2006). O2 is the only oxygen position in the anion layers marked “B” and “C” in Fig. 1 (although additional oxygen may reside in the site as part of an OH group).
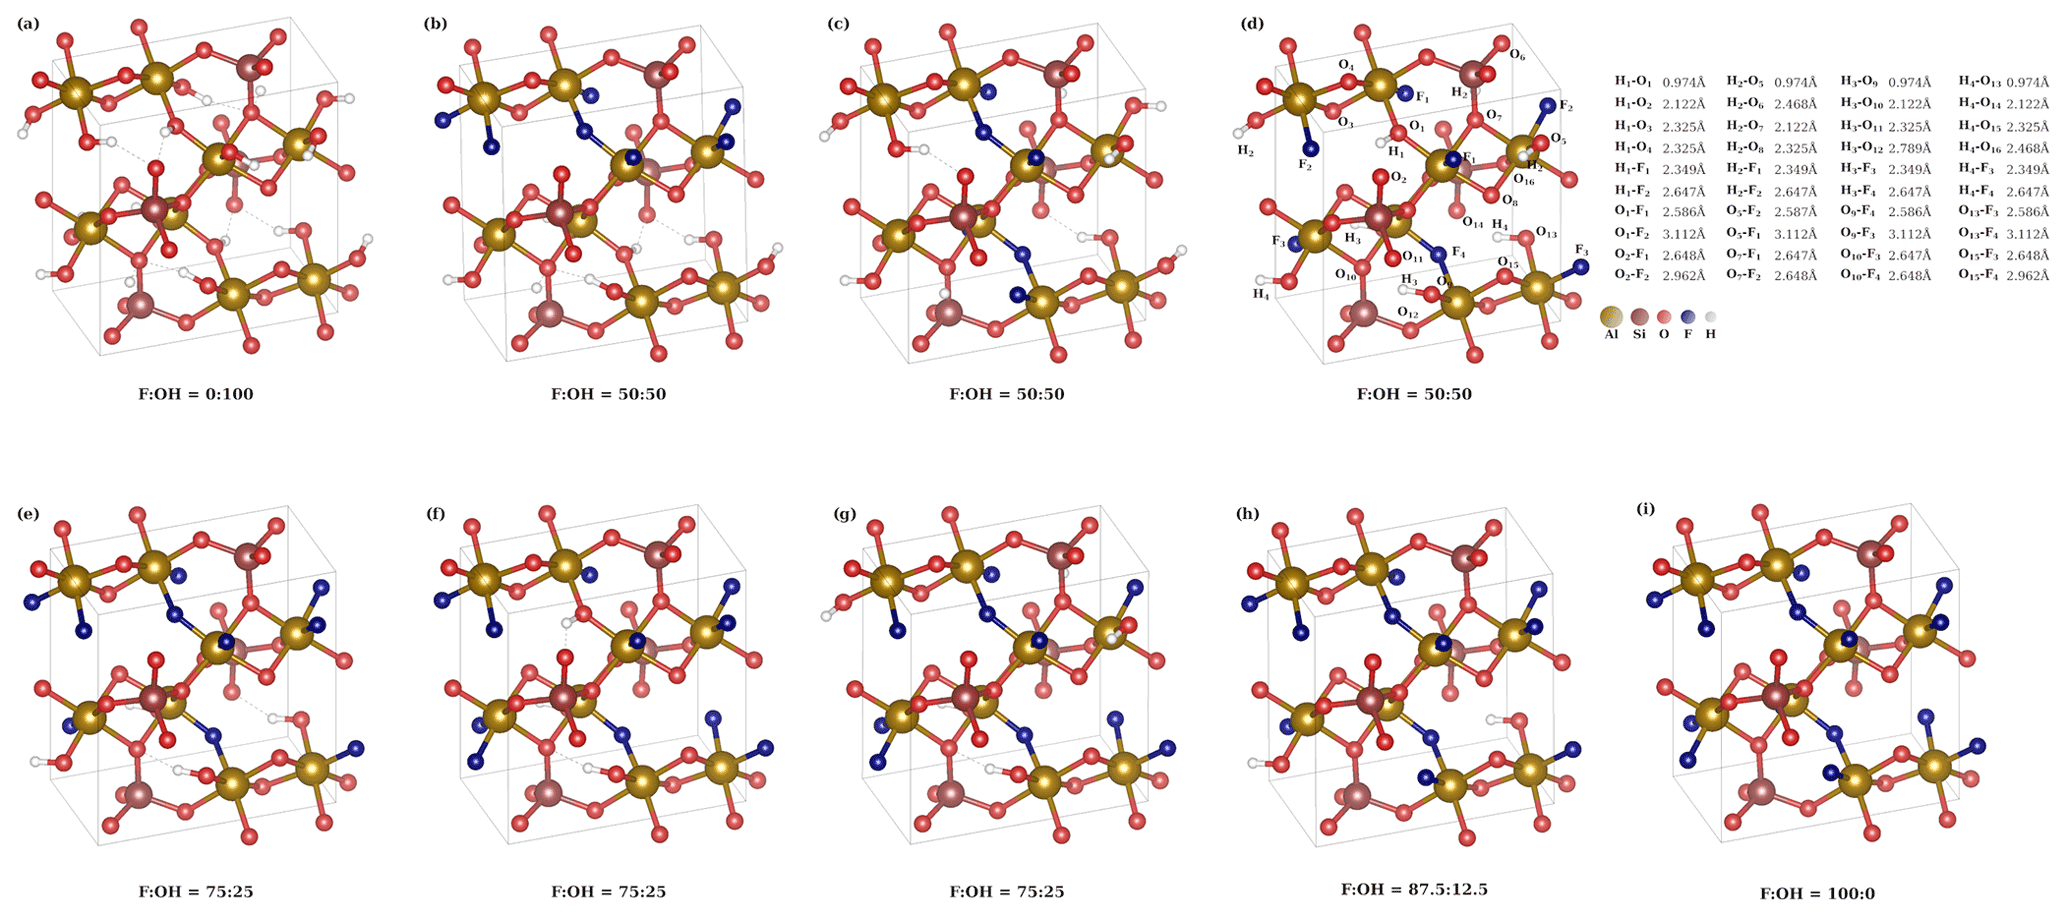
Figure 7Structures used in DFT calculations. The interatomic distances are given for structure (d). For results of the calculations, see Table 4.
The 19F and 1H MAS NMR measurements provide structural information about the site. Two fluorine positions can be clearly distinguished: −130 and −135 ppm. Their relative intensities in sample TopP (Fig. 3a) correlate well with the calculated abundance of F− ions with another F− in its neighboring position (∼ 90 %, −135 ppm) and with an OH group as neighbor (∼ 10 %, −130 ppm), respectively. This interpretation is corroborated by the fact that the latter signal cannot be observed for TopT (Fig. 5a).
In the 1H MAS NMR spectra, two narrow signals can be identified at 2.8 and 1.1 ppm. Both are typical signals for OH groups that are part of an octahedral coordination around Al3+ (Scholz et al., 2010), as is expected for the TopP sample and can be correlated with the OHA and OHB Raman bands. The broad 1H resonance with its maximum at 4.9 ppm (Figs. 4, S5) most likely stems from water molecules adsorbed on the very fine powder of sample TopP. The sample was not dried prior to the experiment, and structurally bound molecular water does not appear to be likely to occur in the topaz structure. The disappearance of this signal applying spin-echo measurements, which is an indication for strongly bonded protons, typical for water molecules (Scholz et al., 2010), supports this assumption (Fig. 4b, c). The extremely low OH content in sample TopT required a large number of accumulations, and the 1H MAS NMR spectrum gives only a very narrow signal at 1.3 ppm for the few isolated OH groups still present in the sample (Fig. 5d). No OH band is visible in the Raman spectrum of TopT (Fig. 6). Although our method does not allow quantification of the 1H concentration in the sample, we can state that structurally bound OH groups are present in sample TopT but at extremely low concentrations.
4.2 Implications of Raman OH band splitting
The cause of the splitting of the OH band in vibrational spectroscopy in topaz with XOH≤0.5 has been a matter of debate in the past (e.g., Wunder et al., 1999; Pinheiro et al., 2002; Prasad and Gowd, 2003; Watenpuhl et al., 2010). The conclusion of Watenpuhl et al. (2010) that the band position of any individual OH group depends on whether the neighboring site is occupied by F or by OH works well for their IR spectroscopic data on 17 synthetic topaz samples synthesized by Wunder et al. (1999) and also their two natural samples. In their model, the proportion of the OHA band (lower wavenumber, OH neighbor) to the OHB band (higher wavenumber, F neighbor) can be calculated from the F (F + OH) ratio XF and the OH (F + OH) ratio XOH as 2XF XOH. The crossover point, where both bands have the same area under the peak, is thus at XOH=0.66. The fact that the ratio of the observed integrated intensities of both bands correlates almost perfectly with the ratio of OH groups having F or OH as neighbors raises the question of the origin of the frequency shift between the two bands. It is also interesting to note that the model that Watenphul et al. (2010) applied successfully is not compatible with the “proton avoidance model” of Barton (1982), in which no two OH groups should be direct neighbors. This is somewhat surprising because repulsion between neighboring protons provides a convincing explanation for the fact that OH-rich topaz has two distinct hydrogen atom positions (Northrup et al., 1994; Wunder et al., 1999), and this repulsion would be expected to lead to proton avoidance.
Based on these observations, hydrogen bonds between the OH group and fluoride or oxide anions seem the most plausible cause for the band splitting, with the role of the repulsion between protons of neighboring OH groups being unclear. Hydrogen bonds are known to influence the strength, polarization, and polarizability of OH molecular bonds and thereby the frequency, as well as the intensity of absorption and scattering bands in vibrational spectroscopic methods, particularly IR and Raman spectroscopy (e.g., Lutz et al., 1996; Rozenberg et al., 2000; Steiner, 2002). The effect on frequency decreases strongly with increasing H⋯O distance (Rozenberg et al., 2000). However, the effect on intensity is typically more pronounced (e.g., Lutz et al., 1996; Steiner, 2002).
The atomic distances for potential hydrogen bonds in topaz are approx. 2.377 Å for H⋯F and 2.215 Å for H⋯O2 at standard conditions, with a θ angle (Steiner, 2002) of the prospective hydrogen bond of 139 and 138∘, respectively (using the H position determined by Gatta et al., 2006, obtained with neutron diffraction at 298 K). Because O2 is part of the tetrahedral coordination of Si, H⋯O2 bridging should influence the NMR signal of 29Si. Outside the a−c plane, oxygen position O1 is the closest to H. Using the values of Gatta et al. (2006) for a and c and the range for b given by Ribbe and Rosenberg (1971), the distance H⋯O1 works out to 2.300 ± 0.005 Å, thereby being shorter than the H⋯F distance of 2.377 Å. However, the θ angle for a possible hydrogen bond involving O1 would be about 94∘, making this bond unlikely due to the preference of hydrogen bonds for linear configuration (Steiner, 2002).
Considering the distances of <2.4 Å from the H site to the (potential) F position, as well as the O2 site of the SiO4 tetrahedron (Fig. 2), together with the angle of <140∘ between the OH group and either the F or the O2, it seems very likely that hydrogen bonds can form with both these anions. Depending on the occupation of two neighboring sites, two different constellations of hydrogen bonds may form: (1) OH⋯O⋯HO or (2) F⋯H⋯O (Fig. 2). Although formation of hydrogen bonds generally tends to shift the frequency of the OH stretching band to lower values (red shift) compared to free OH groups, this effect decreases with the length of the hydrogen bond and is relatively small compared to other influences at hydrogen bond lengths of >2 Å (Rozenberg et al., 2000; Steiner, 2002). It is therefore difficult to predict which of the constellations depicted in Fig. 2 should show the lower or higher frequency IR or Raman band. Based on the results of Watenphul et al. (2010), we are confident that the lower IR absorption frequency indeed belongs to the OH⋯O⋯HO configuration and the higher frequency to the F⋯H⋯O hydrogen bond. Results of Pinheiro et al. (2002) in their Raman study on 27 natural topaz samples with different OH concentrations corroborate this interpretation for Raman spectroscopy as well. However, while the IR band intensities of Watenphul et al. (2010) correlate very well with the statistically expected ratios of the two different hydrogen bond constellations, Pinheiro et al. (2002) found much higher relative intensities of the OHA band, with the point of equal intensity at around XOH=0.14. Our own Raman data show OHB OHA ratios between 1.5 and 2.0 for sample TopP with XOH = 0.06.
There are two possible and mutually non-exclusive explanations for the discrepancy in OH-band intensity ratios between IR and Raman spectroscopy: (1) the sensitivity of the different bands is very similar in IR spectroscopy but drastically different in Raman spectroscopy, or (2) the distribution of F and OH on the sites is different for the samples in the different studies. If there is a difference in the sensitivity ratios between IR and Raman, it must stem from the selection rules for these two spectroscopic methods. While IR absorption intensities scale with the polarization of a molecular bond, Raman band intensities scale with the square of the polarizability (Nafie, 2017). OH groups with hydrogen bonds to nearby anions typically show a large increase in intensity compared to OH groups without hydrogen bonds due to an increase in the polarization of the OH group (e.g., Rozenberg et al., 2000). This effect occurs so reliably that it is used as an indicator for the presence or absence of hydrogen bonds (Steiner, 2002). In case of topaz, there seems to be no significant difference in polarization between the two different OH neighbor constellations or else the correlation of Watenphul et al. (2010) would not work as it does. This is surprising considering the fact that in the OH⋯O⋯HO constellation (Fig. 2 left) one oxygen pulls at the electron fields of two OH groups, whereas in the F⋯H⋯O constellation (Fig. 2 right), oxygen and one fluorine pull at only one OH group together. It has been shown that the formation of hydrogen bonds also influences polarizability and its change upon phonon excitation (e.g., Lutz et al., 1996). According to our data and those of Pinheiro et al. (2002), the change in polarizability of the OH⋯O⋯HO constellation as a result of phonon excitation by incident laser photons during Raman spectroscopy would be larger than in the case of the F⋯H⋯O constellation. How the change in polarizability can be so different while the polarization remains almost unchanged is unclear pending further investigation. This effect may further be influenced by a potential change in proton positions for the OH⋯O⋯HO constellation compared to that for the F⋯H⋯O constellation (Barton 1982; Northrup et al., 1994; Wunder et al., 1999).
If, however, we assume that the difference in OH-band ratios between IR and Raman spectroscopy cannot be caused by differences in polarizability behavior because the polarization is apparently unchanged, we need to consider possible structural explanations. The IR spectroscopic data of Watenphul et al. (2010) were collected using mostly synthetic samples, whereas the Raman spectroscopic study of Pinheiro et al. (2002), as well as the present work, used natural samples. This may suggest that in natural samples more OH groups have OH neighbors than would be expected based on probability calculations for perfectly disordered site occupation. This can be achieved either by ordering into a super-structure or by unmixing into different domains of OH-rich and OH-poor topaz. Using the method of Watenphul et al. (2010) for sample TopP with XOH= 0.06, the expected OHB OHA ratio can be calculated. The resulting ratio is 31. This is in stark contrast to the OHB OHA ratio of 1.5–2.0 determined as the area under the two Raman OH sub-bands with peak fitting (in three different positions and orientations, see Fig. 6b). Calculating backwards from these ratios of 1.5–2.0 would result in XOH=0.5 to 0.6, which is clearly inconsistent with the XRD results. The unexpectedly high proportion of the OHA band may be explained by the formation of OH-rich domains through unmixing. If present, then more OH would have OH neighbors in the OH-rich domains, thus making the OHA band more prominent, while any OH-free domains would of course be simply invisible to the Raman OH band observation. No such domain structure is evident in the F mappings of sample TopP (Fig. S2), although the domains would need to differ by almost 10 wt % F if they were to be the sole cause for the over 10-fold difference in the Raman OH-band ratio between observation and expectation. This means that the domains are either smaller than the resolution of the mapping of sample TopP (20 µm) or are not the cause of the discrepancy. To test this hypothesis, future detailed analysis using transmission electron microscopy will be needed.
In all structures where only one hydroxo group is coordinated to an aluminum center the lattice constants are only slightly changed compared to the fully fluorinated topaz (Table 4), so nearly no strain will be built up in the crystal by local exchange of F for OH groups. Replacing four F atoms by four OH groups in one unit cell (most stable XF=0.5 structure) is energetically more favorable by 0.08 eV per moiety than replacing only one fluorine atom by one OH group in each of the four unit cells (XF= 0.875). This suggests that, at least in terms of enthalpy, it is favorable for the topaz to form an internal zoning with more fluoride and more hydroxide-rich regions. However, at higher temperatures, this difference will be diminished by the effect of entropy, which always seeks to distribute all components statistically. A separation into layers of F-rich and layers of OH-rich topaz (Fig. 7b), on the other hand, is energetically less favorable by 0.03 and 0.04 eV per moiety than the two other possible configurations of identical bulk composition of XF= 0.5 (see b, c, and d in Table 4). This is interesting because the “OH-layer” structure (Fig. 7b) is the only one of these three configurations with direct OH neighbors and thus the only one violating the proton avoidance principle (Barton, 1982). It seems that unmixing into OH-rich and OH-poor domains is energetically feasible but only as long as no direct OH neighbors occur. Unmixing according to these simple model structures is therefore unlikely to be the explanation for the over-representation of the OHA band in the Raman spectrum. However, the role of proton avoidance and the energy budget of site occupation closer to the F end-member of topaz need to be investigated further before dismissing unmixing entirely.
One additional factor that may influence the observed Raman band ratios is that the H⋯F bonds may alter the orientation of OHA and OHB groups, which would affect the Raman experiments of Pinheiro et al. (2002) and our samples but not the IR spectroscopic data on powder pellets used by Watenpuhl et al. (2010). Due to the geometry of the neighboring sites (Fig. 2), the influence of the hydrogen bonds can only rotate the OH group in the (010) plane and should therefore be averaged out in observations with circular polarized light in [010] viewing direction. The orientation effect, if it exists, should be most prominent in observations along [001]. However, only about 15 % relative difference in the band area ratios is observed between those two ratios (Table 3), and the observation along [010] still has a much more prominent OHA band than should be expected. A change in orientation of the OH group therefore does not seem to play a significant role in the observed apparent over-representation of the OHA band in the Raman data.
The splitting of the Raman band of the OH group, as well as the 19F and 1H NMR spectroscopic signal splitting, shows evidence for intra-structural hydrogen bonds between the two neighboring sites, which also involves an oxygen of the SiO4 tetrahedron. Depending on whether a given OH group has another OH group or fluoride as its neighbor, either an OH⋯O⋯HO or F⋯H⋯O hydrogen bond constellation can form, with Raman bands at 3644 and 3650 cm−1, respectively. The intensity of the former is much higher in relation to the latter than would be expected for perfectly disordered site occupation if we were to assume that the Raman sensitivity of both bands is identical. This may plausibly be explained by (1) changes in the polarizability of the OH molecular bond depending on the hydrogen bond constellation or by ordering or (2) unmixing in the sample. Neither hypothesis can currently be dismissed although energetic considerations favor the former.
Ab initio DFT calculations of lattice energy of different ordering in the unit cell of topaz suggest that unmixing of topaz into three-dimensional OH-rich domains is energetically favorable compared to purely random OH distributions, whereas ordering in fluoride-richer and OH-richer anion layers in (001) is unfavorable. Comparison of Raman with IR spectroscopy on a wider range of suitable topaz samples with various OH concentrations may be necessary to clarify this point.
27Al MAS NMR spectroscopy showed no evidence for tetrahedrally coordinated Al sites in the structure, confirming that the actual ratio must be very close to the theoretical formula. This means that topaz, particularly near-end-member F topaz, may be a suitable reference material for Al and Si determination in other high-density minerals of similar composition using microanalytical techniques.
All data used in this paper are shown in the tables and figures.
The supplement related to this article is available online at: https://doi.org/10.5194/ejm-34-507-2022-supplement.
The project was initially designed by AL, TB, and TJ. GS and BP joined planning after initial results. NMR experiments were performed by GS and NdSA, Raman measurements by AL, and computations by JS. JF contributed samples and geological information. DS performed the µ-XRF analysis. All authors participated in the discussion and interpretation of the results. Writing of the manuscript was led by AL, with contributions from all co-authors. Funding was acquired by AL, BP, FE, TB, and TJ.
The contact author has declared that none of the authors has any competing interests.
Publisher’s note: Copernicus Publications remains neutral with regard to jurisdictional claims in published maps and institutional affiliations.
Gefördert durch die Deutsche Forschungsgemeinschaft (DFG) – Projektnummer 387284271 – SFB 1349. The North-German Supercomputing Alliance (HLRN) and HPC Service of ZEDAT, Freie Universität Berlin, are acknowledged for computing time. The authors thank Moritz Liesegang for the XRD measurements and Niels Højmark Andersen, Christian Schmidt, Bernd Wunder, and Xin Zhong for fruitful discussions. Associate editor Alessandro Pavese, chief editor Etienne Balan, and the editorial staff at EJM are thanked for handling the review and revision process. The authors thank the anonymous reviewers for their constructive criticism which helped improve the manuscript.
This research has been funded by the Deutsche Forschungsgemeinschaft (DFG) – project number 387284271 – SFB 1349.
We acknowledge support from the Open Access Publication Initiative of Freie Universität Berlin.
This paper was edited by Alessandro Pavese and reviewed by two anonymous referees.
Barton, M. D.: The thermodynamic properties of topaz solid solutions and some petrologic applications, Am. Mineral., 67, 956–974, 1982.
Blöchl, P. E., Jepsen, O., and Andersen, O. K.: Improved tetrahedron method for Brillouin-zone integrations, Phys. Rev. B, 49, 16223–16233, https://doi.org/10.1103/PhysRevB.49.16223, 1994.
Chen, J., Lager, G. A., Kunz, M., Hansen, T. C., and Ulmer, P.: A Rietveld refinement using neutron powder diffraction data of a fully deuterated topaz, Al2SiO4(OD)2, Acta Crystallogr. E, 61, i253–i255, https://doi.org/10.1107/S1600536805034811, 2005.
Cory, D. G. and Ritchey, W. M.: Suppression of signals from the probe in bloch decay spectra, J. Magn. Reson., 80, 128–132, https://doi.org/10.1016/0022-2364(88)90064-9, 1988.
Gatta, G. D., Nestola, F., Bromiley, G. D., and Loose, A.: New insight into crystal chemistry of topaz: A multi-methodological study, Am. Mineral., 91, 1839–1846, https://doi.org/10.2138/am.2006.2223, 2006.
Grimme, S., Antony, J., Ehrlich, S., and Krieg, H.: A consistent and accurate ab initio parametrization of density functional dispersion correction (DFT-D) for the 94 elements H-Pu, J. Chem. Phys., 132, 154104, https://doi.org/10.1063/1.3382344, 2010.
Grimme, S., Ehrlich, S., and Goerigk, L.: Effect of the damping function in dispersion corrected density functional theory, J. Comput. Chem., 32, 1456–1465, https://doi.org/10.1002/jcc.21759, 2011.
Holfert, J., Mroch, W., and Fuller, J.: A Field Guide to Topaz and Associated Minerals of the Thomas Range, Utah, HM Publishing, 103 pp., 1996.
Jaeger, C. and Hemmann, F.: EASY: A simple tool for simultaneously removing background, deadtime and acoustic ringing in quantitative NMR spectroscopy – Part I: Basic principle and applications, Solid State Nucl. Magn. Reson., 57/58, 22–28, https://doi.org/10.1016/j.ssnmr.2013.11.002, 2014.
König, R., Scholz, G., Bertram, R., and Kemnitz, E.: Crystalline aluminium hydroxy fluorides – Suitable reference compounds for 19F chemical shift trend analysis of related amorphous solids, J. Fluor. Chem., 129, 598–606, https://doi.org/10.1016/j.jfluchem.2008.04.015, 2008a.
König, R., Scholz, G., Pawlik, A., Jäger, C., van Rossum, B., Oschkinat, H., and Kemnitz, E.: Crystalline Aluminum Hydroxy Fluorides: Structural Insights Obtained by High Field Solid State NMR and Trend Analyses, J. Phys. Chem. C, 112, 15708–15720, https://doi.org/10.1021/jp804662f, 2008b.
Kresse, G. and Furthmüller, J.: Efficiency of ab-initio total energy calculations for metals and semiconductors using a plane-wave basis set, Comput. Mater. Sci., 6, 15–50, https://doi.org/10.1016/0927-0256(96)00008-0, 1996a.
Kresse, G. and Furthmüller, J.: Efficient iterative schemes for ab initio total-energy calculations using a plane-wave basis set, Phys. Rev. B, 54, 11169–11186, https://doi.org/10.1103/PhysRevB.54.11169, 1996b.
Kresse, G. and Hafner, J.: Ab initio molecular dynamics for liquid metals, Phys. Rev. B, 47, 558–561, https://doi.org/10.1103/PhysRevB.47.558, 1993.
Kresse, G. and Hafner, J.: Ab initio molecular-dynamics simulation of the liquid-metal–amorphous-semiconductor transition in germanium, Phys. Rev. B, 49, 14251–14269, https://doi.org/10.1103/PhysRevB.49.14251, 1994.
Kresse, G. and Joubert, D.: From ultrasoft pseudopotentials to the projector augmented-wave method, Phys. Rev. B, 59, 1758–1775, https://doi.org/10.1103/PhysRevB.59.1758, 1999.
Lutz, B. T. G., Jacob, J., and van der Maas, J. H.: Vibrational spectroscopic characteristics of = C-H–O and N-H–π interaction in crystalline N-(2,6-dimethylphenyl)-5-methylisoxazole-3-carboxamide, Vib. Spectrosc., 12, 197–206, 1996.
Mizuno, M., Aoki, Y., Endo, K., and Greenidge, D.: Local structure analysis of smoky and colorless topaz using single crystal 27Al NMR, J. Phys. Chem. Solids, 67, 705–709, https://doi.org/10.1016/j.jpcs.2005.10.180, 2006.
Momma, K. and Izumi, F.: VESTA 3 for three-dimensional visualization of crystal, volumetric and morphology data, J. Appl. Crystallogr., 44, 1272–1276, https://doi.org/10.1107/S0021889811038970, 2011.
Monkhorst, H. J. and Pack, J. D.: Special points for Brillouin-zone integrations, Phys. Rev. B, 13, 5188–5192, https://doi.org/10.1103/PhysRevB.13.5188, 1976.
Nafie, L. A.: Raman Optical Activity, Theory, in: Encyclopedia of Spectroscopy and Spectrometry (Third Edition), edited by: Lindon, J. C., Tranter, G. E., and Koppenaal, D. W., Academic Press, Oxford, 891–899, https://doi.org/10.1016/B978-0-12-803224-4.00267-3, 2017.
Northrup, P. A., Leinenweber, K., and Parise, J. B.: The location of H in the high-pressure synthetic Al2SiO4(OH)2 topaz analogue, Am. Mineral., 79, 401–404, 1994.
Ottolini, L., Cámara, F., and Bigi, S.: An investigation of matrix effects in the analysis of fluorine in humite-group minerals by EMPA, SIMS, and SREF, Am. Mineral., 85, 89–102, https://doi.org/10.2138/am-2000-0110, 2000.
Parise, J. B., Cuff, C., and Moore, F. H.: A neutron diffraction study of topaz: evidence for a lower symmetry, Mineral. mag., 43, 943–944, https://doi.org/10.1180/minmag.1980.043.331.21, 1980
Patton, H. B.: Topaz-bearing rhyolite of the Thomas range, Utah, Geol. Soc. Am. Bull., 19, 177–192, https://doi.org/10.1130/GSAB-19-177, 1908.
Prasad, P. S. R. and Gowd, T. N.: FTIR Spectroscopic Study of Hydroxyl Ions in Natural Topaz, J. Geol. Soc. India, 61, 202–208, 2003.
Perdew, J. P., Burke, K., and Ernzerhof, M.: Generalized Gradient Approximation Made Simple, Phys. Rev. Lett., 77, 3865–3868, https://doi.org/10.1103/PhysRevLett.77.3865, 1996.
Pinheiro, M. V. B., Fantini, C., Krambrock, K., Persiano, A. I. C., Dantas, M. S. S., and Pimenta, M. A.: substitution in topaz studied by Raman spectroscopy, Phys. Rev. B, 65, 104301, https://doi.org/10.1103/PhysRevB.65.104301, 2002.
Pulay, P.: Convergence Acceleration of Iteratve Sequences. The Case of SCF Iteration, Chem. Phys. Lett., 73, 393–398, 1980.
Ribbe, P. H. and Rosenberg, P. E.: Optical and X-ray determinative methods for fluorine in topaz, Am. Mineral., 56, 1812–1821, 1971.
Rozenberg, M., Loewenschuss, A., and Marcus, Y.: An empirical correlation between stretching vibration redshift and hydrogen bond length, Phys. Chem. Chem. Phys., 2, 2699–2702, https://doi.org/10.1039/b002216k, 2000.
Scholz, G., Brehme, S., König, R., Heidemann, D., and Kemnitz, E.: Crystalline Aluminum Hydroxide Fluorides AlFx(OH)3 H2O: Structural Insights from 1 H and 2 H Solid State NMR and Vibrational Spectroscopy, J. Phys. Chem. C, 114, 10535–10543, https://doi.org/10.1021/jp1023857, 2010.
Shannon, R. D.: Revised effective ionic radii and systematic studies of interatomic distances in halides and chalcogenides, Acta Crystallogr. A, 32, 751–767, https://doi.org/10.1107/S0567739476001551, 1976.
Souza, D. N., Fernandes de Lima, J., Valerio, M. E. G., Marcos Sasaki, J., and Caldas, L. V. E.: Radiation-induced charge trapping and recombination process in natural topaz studied by TL, EPR and XRD, Nucl. Instrum. Methods Phys. Res. B, 218, 123–127, https://doi.org/10.1016/j.nimb.2003.12.050, 2004.
Steiner, T.: Die Wasserstoffbrücke im Festkörper, Angew. Chem., 114, 50–80, https://doi.org/10.1002/1521-3757(20020104)114:1<50::AID-ANGE50>3.0.CO;2-H, 2002.
Toby, B. H. and Von Dreele, R. B.: GSAS-II: the genesis of a modern open-source all purpose crystallography software package, J. Appl. Crystallogr., 46, 544–549, https://doi.org/10.1107/S0021889813003531, 2013.
Watenphul, A., Libowitzky, E., Wunder, B., and Gottschalk, M.: The OH site in topaz: an IR spectroscopic investigation, Phys. Chem. Miner., 37, 653–664, https://doi.org/10.1007/s00269-010-0365-4, 2010.
Wood, D. M. and Zunger, A.: A new method for diagonalising large matrices, J. Phys. A, 18, 1343–1359, https://doi.org/10.1088/0305-4470/18/9/018, 1985.
Wunder, B., Rubie, D. C., Ross, C. R., Medenbach, O., Seifert, F., and Schreyer, W.: Synthesis, stability, and properties of Al2SiO4(OH)2: A fully hydrated analogue of topaz, Am. Mineral., 78, 285–297, 1993.
Wunder, B., Andrut, M., and Wirth, R.: High-pressure synthesis and properties of OH-rich topaz, Eur. J. Mineral., 11, 803–814, https://doi.org/10.1127/ejm/11/5/0803, 1999.
Xue, X., Kanzaki, M., and Fukui, H.: Unique crystal chemistry of two polymorphs of topaz-OH: A multi-nuclear NMR and Raman study, Am. Mineral., 95, 1276–1293, https://doi.org/10.2138/am.2010.3471, 2010.
Yukihara, E. G., Yoshimura, E. M., and Okuno, E.: Paramagnetic radiation-induced defects in gamma-irradiated natural topazes, Nucl. Instrum. Methods Phys. Res. B, 191, 266–270, https://doi.org/10.1016/S0168-583X(02)00573-6, 2002.
Zhang, R. Y., Liou, J. G., and Shu, J. F.: Hydroxyl-rich topaz in high-pressure and ultrahigh-pressure kyanite quartzites, with retrograde woodhouseite, from the Sulu terrane, eastern China, Am. Mineral., 87, 445–453, https://doi.org/10.2138/am-2002-0408, 2002.