the Creative Commons Attribution 4.0 License.
the Creative Commons Attribution 4.0 License.
 | 07 Oct 2022
Ferro-ferri-holmquistite, □Li2(Fe2+3Fe3+2)Si8O22(OH)2, Fe2+Fe3+ analogue of holmquistite, from the Iwagi islet, Ehime, Japan
Mariko Nagashima
Teruyoshi Imaoka
Takashi Kano
Jun-ichi Kimura
Qing Chang
Takashi Matsumoto
Ferro-ferri-holmquistite (IMA2022-020), ideal formula □Li2(FeFe)Si8O22(OH)2, was found in albitized granite from the Iwagi islet, Ehime, Japan. Ferro-ferri-holmquistite is a CFe2+Fe3+ analogue of holmquistite and belongs to the lithium-subgroup amphiboles. It commonly occurs as acicular aggregate and/or isolated crystals in quartz, albite and K-feldspar and is blue with a bluish-grey streak and a vitreous luster. It has a Mohs hardness of 5 . Its cleavage is perfect on {210}. Measured and calculated densities are g cm−3 and g cm−3, respectively. Ferro-ferri-holmquistite is optically biaxial (-), with α=1.685, β=1.713 and γ=1.727, and is pleochroic, with X= pale blue ∼ pale yellowish blue, Y= deep blue ∼ brownish blue and Z= deep blue ∼ deep bluish violet; X>Z>Y. The magnetic susceptibility is similar to the associated biotite. Ferro-ferri-holmquistite is insoluble in HCl, HNO3 and H2SO4. The empirical formula calculated on the basis of Σ(C+T) = 13 on the results obtained by electron microprobe analyzer (EPMA), and laser ablation inductively coupled plasma mass spectrometry (LA-ICP-MS) is A(K0.01Na0.06)Σ0.07B(Li1.95Na0.04Ca0.01)Σ2.00C(FeFeAl0.51Mg0.22MnTi0.01)Σ5.00T(Si7.98Al0.02)Σ8.00O22(OH)1.94F0.06. Structure refinement converged to R1= 4.22 %. The space group is orthorhombic Pnma, and the unit-cell parameters are a= 18.5437(2) Å, b= 17.9222(1) Å, c= 5.3123(1) Å and V= 1765.51(1) Å3. Based on the refined site occupancies, the structural formula can be written as ANa0.062M4(Li1.952Na0.048)Σ2.000M1(FeMg0.230)Σ2.000M2(FeFeAl0.452)Σ2.000M3(FeMg0.109)Σ1.000TSi8O22(OH)2 (Z= 4). Three OH-stretching IR bands, centered at 3614, 3631 and 3644 cm−1, are assigned to the local configuration M1M1M3= FeFeFe, MgFeFe (including FeMgFe and FeFeMg) and MgMgFe (including MgFeMg and FeMgMg), respectively, based on the IR studies of the orthorhombic Pnma amphiboles.
- Article
(3912 KB) - Full-text XML
- BibTeX
- EndNote


Ferro-ferri-holmquistite (IMA2022-020), ideal formula □Li2(FeFeSi8O22(OH)2, was found in albitized granite from the Iwagi islet, Ehime, Japan. This is the fourth new mineral species discovered from this locality. All four minerals, sugilite (Na2K(Fe3+, Mn3+, Al)2Li3Si12O30; Murakami et al., 1976; Kato et al., 1976; Armbruster and Oberhänsli, 1988), katayamalite (KLi3Ca7Ti2(SiO3)12(OH)2; Murakami et al., 1983; Andrade et al., 2013), murakamiite (LiCa2Si3O8(OH); Imaoka et al., 2017; Nagashima et al., 2018) and ferro-ferri-holmquistite, are rich in lithium.
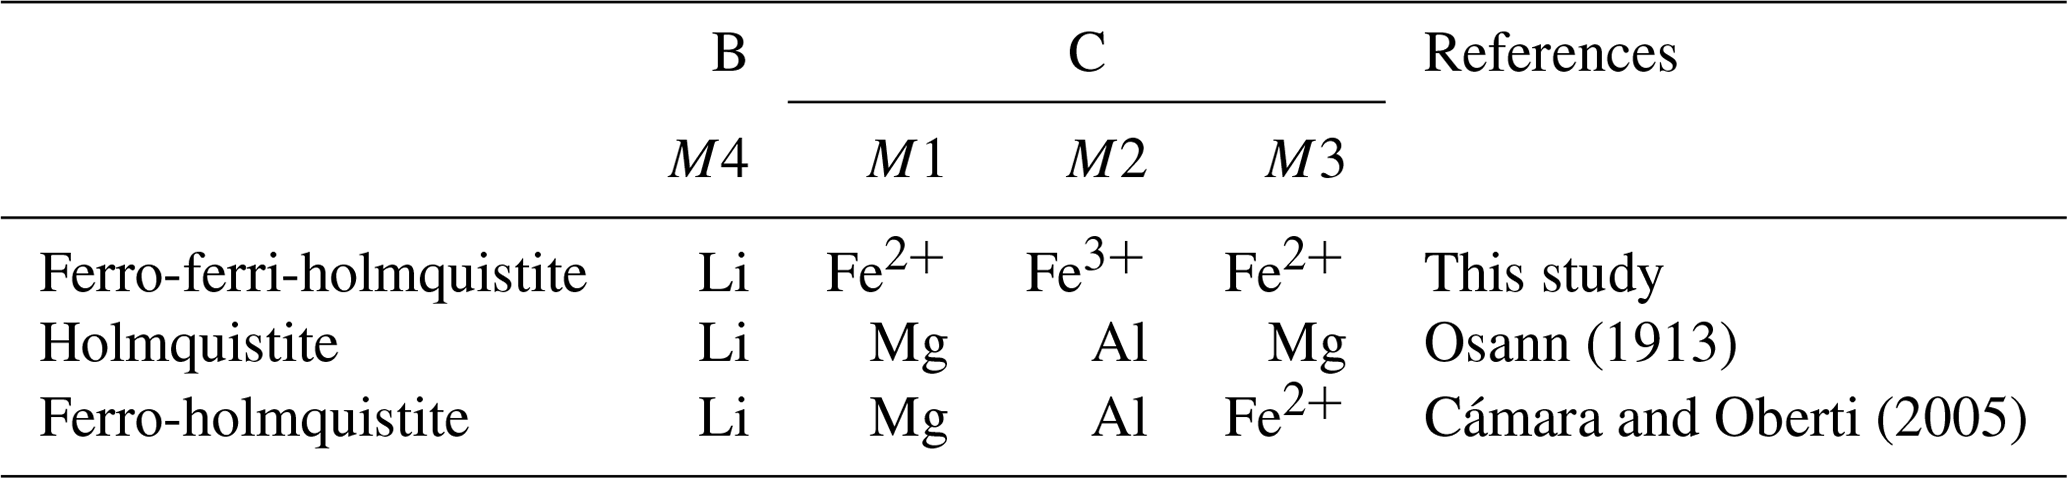
Amphibole-supergroup minerals are chemically strongly variable. The standard amphibole formula is written as AB2C5T8O22W2, where A = Na, K, □ (vacant), Ca, Li; B = Na, Li, Ca, Mn2+, Fe2+, Mg; C = Mg, Fe2+, Mn2+, Al, Fe3+, Mn3+, Ti4+, Li; T = Si, Al, Ti4+ and W = (OH), F, Cl, O2− (e.g. Hawthorne and Oberti, 2007). The amphibole-supergroup minerals have either orthorhombic or monoclinic symmetry. The root name holmquistite defines a series of orthorhombic Pnma amphiboles of a composition as A□BLi[(Mg, Fe2+)3(Al, Fe3+)2]TSi8O22(OH)2 (Leake et al., 2003; Cámara and Oberti, 2005). Ferro-ferri-holmquistite is the CFe2+Fe3+ analogue of holmquistite. The C cations occupy the octahedrally coordinated M1, M2 and M3 sites. The larger M1 and M3 octahedra are occupied predominantly by Fe2+, and the smaller M2 octahedron is occupied predominantly by Fe3+. Clino-ferro-ferri-holmquistite discovered by Oberti et al. (2003) is a species with monoclinic symmetry () with the same ideal formula, □Li2(FeFe)Si8O22(OH)2 as ferro-ferri-holmquistite.
The name, ferro-ferri-holmquistite, is based on the nomenclature of the amphibole supergroup (see Table 6 in Hawthorne et al., 2012). The type specimens of ferro-ferri-holmquistite are housed in the National Museum of Nature and Science, Tsukuba, Japan, and the Geological and Mineralogical Museum of Faculty of Science, Yamaguchi University, Japan, under registered numbers NSM-M49617 (holotype) and 95263G (cotype), respectively.
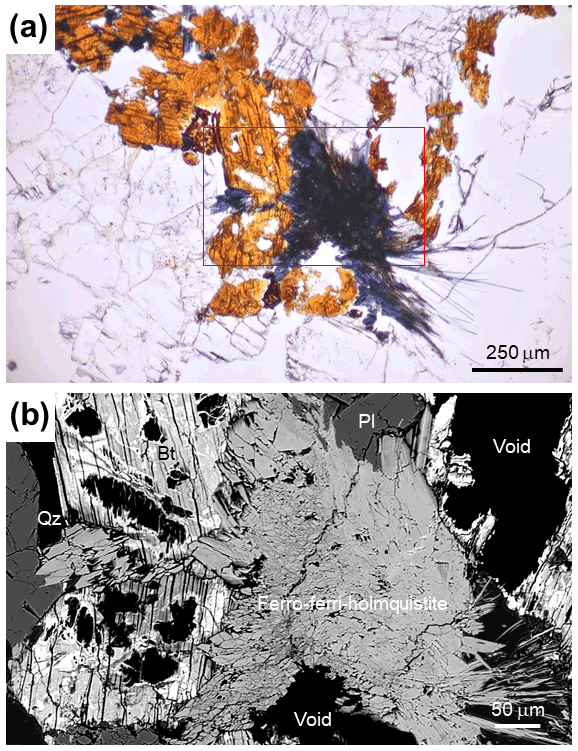
Figure 1Microphotograph (a) and back-scattered electron (BSE) image (b) of ferro-ferri-holmquistite. Red square shown in (a) corresponds to area of BSE image (b). Abbreviations: Bt = biotite (strongly altered), Pl = plagioclase and Qz = quartz.
Small bodies of approximately E−W trending metasomatic rocks that contain pyroxene, garnet, amphibole and biotite occur in the Setouchi area, SW Japan (see Fig. 1a, Imaoka et al., 2021b) associated with Late Cretaceous granites (Murakami, 1976). Albitite forms small bodies that are several tens of centimeters to tens of meters in size, disseminated in a host granite of Late Cretaceous age. The Iwagi Islet (34∘15′47" N, 133∘9′39" E), Ehime Prefecture, Japan contains metasomatic rocks which are the type locality of three Li-bearing minerals, sugilite, katayamalite and murakamiite. Li-rich pectolite, zektzerite, sogdianite and taeniolite also occur (Imaoka and Nagashima, 2022; Imaoka et al., 2021a).
The metasomatic rocks in the studied area are classified into the following types based on the major mineral assemblage, from the initial host rock to the inner part of metasomatism: (1) the original coarse-grained granite (quartz + microcline + plagioclase + biotite), (2) albitized granite (microcline + albite + quartz + biotite ± aegirine ± ferro-ferri-holmquistite), (3) quartz albitite (albite + quartz + microcline + aegirine), (4) hedenbergite albitite (albite + quartz + microcline + hedenbergite + andradite), (5) sugilite albitite (albite + sugilite + aegirine-augite), (6) katayamalite albitite (albite + aegirine augite + katayamalite + sugilite) and (7) murakamiite-bearing albitite (albite + sugilite + aegirine augite + murakamiite + pectolite + katayamalite) (Imaoka et al., 2021b; Imaoka and Nagashima, 2022). These types of metasomatic alteration occur on the scale of centimeters to meters. Acicular ferro-ferri-holmquistite is observed in the weakly albitized rocks (sample no. IWG-53; latitude: 34.262577∘ N, longitude: 133.16100∘ E). In sample no. IWG-53, plagioclase (+ albite), quartz, K-feldspar, biotite, aegirine-aegirine augite, hedenbergite, zircon, thorite, chlorite titanite, fluorapatite, britholite-(Y), fluorite, monazite, anatase, baddeleyite, calcite and galena are present. Ferro-ferri-holmquistite occurs as acicular crystals typically replacing biotite and is the product of metasomatic replacement reactions by dissolution–reprecipitation processes associated with Na- and Li-rich hydrothermal fluids (Imaoka et al., 2021a, b; Imaoka and Nagashima 2022).

Figure 2Variation of total Fe and Al content (apfu) in ferro-ferri-holmquistite. The number of analytical points equals 52.
Ferro-ferri-holmquistite commonly occurs as acicular aggregates (Fig. 1a) and/or isolated crystals in quartz, albite and K-feldspar and is blue with a bluish-grey streak and a vitreous luster. It has a Mohs hardness of 5 . Its cleavage is perfect on {210}. The density, determined by the floatation method using heavy liquids, is ca. 3.32 g cm−3, which is consistent with the calculated density of 3.317 g cm−3 using the empirical formula and unit-cell volume refined from single-crystal X-ray diffraction data. Ferro-ferri-holmquistite is optically biaxial (-), with α= 1.685, β= 1.713 and γ= 1.727. The refractive indices were determined using several small crystals in immersion oil following Danhara et al. (1992). Its 2V angle measured under white light is 45–75∘ (based on the measurement of three grains), and its calculated 2V is 70∘. Dispersion was not determined. The mineral is pleochroic, with X = pale blue ∼ pale yellowish blue, Y= deep blue ∼ brownish blue and Z= deep blue ∼ deep bluish violet; X>Z>Y.
The Gladstone–Dale compatibility index of ferro-ferri-holmquistite was calculated with the measured density (average 3.32 g cm−3) and average chemical composition listed in Table 1, which is +0.030 and falls into the “excellent” category according to Mandarino (1981).
Table 1Chemical composition of ferro-ferri-holmquistite.
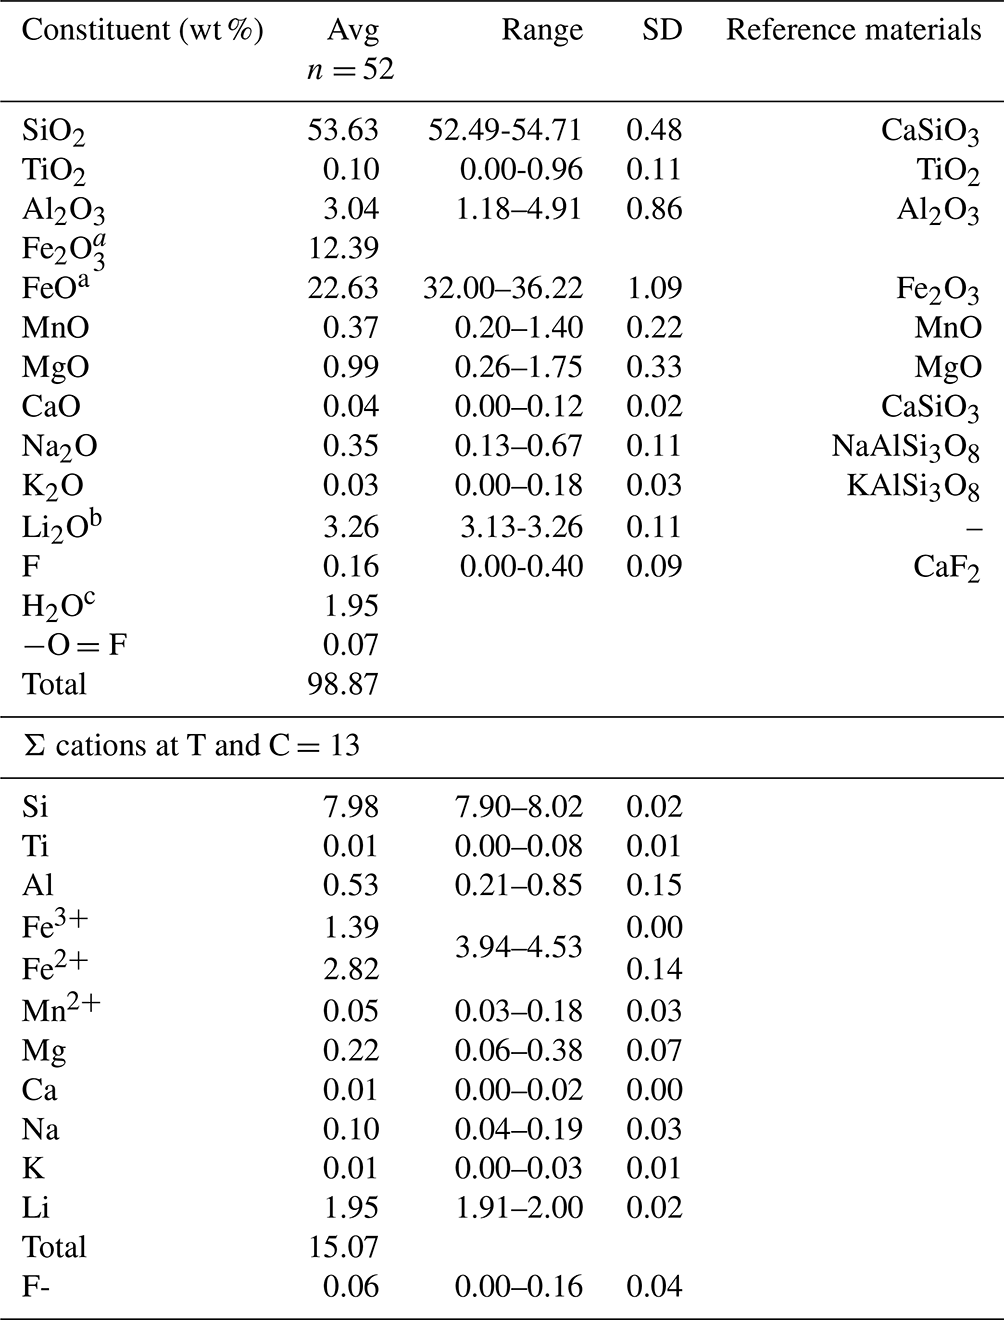
a The FeO and Fe2O3 contents were calculated on a basis of charge neutralization. The average FeO content obtained by EMPA was 33.78 wt %. b The Li2O content was determined by LA-ICP-MS. c Calc.
The magnetic susceptibility of ferro-ferri-holmquistite from the Iwagi islet is similar to that of the associated biotite determined by mineral separation using a neodymium magnet. It is slightly greater than that of aegirine-augite using a Frantz isodynamic separator at room temperature. Although both ferro-ferri-holmquistite and aegirine-augite were attracted to the magnet at 0.4 A, the former was attracted to the magnet at 0.3 A, but the latter was not.
Chemical tests with hydrochloric acid (HCl), nitrous acid (HNO3) and sulfuric acid (H2SO4) were done following the method of Jones and Fleming (1965). The specimen is insoluble in HCl, HNO3 and H2SO4.
Chemical analysis of ferro-ferri-holmquistite was done using an electron microprobe analyzer (EPMA, JEOL JXA-8230) at Yamaguchi University, Japan, and laser ablation inductively coupled plasma mass spectrometry (LA-ICP-MS) at the Japan Agency for Marine-Earth Science and Technology (JAMSTEC), Japan, following the method of Kimura and Chang (2012). The chemical composition of ferro-ferri-holmquistite and probe standards are listed in Table 1. Operating conditions for EMPA were an accelerating voltage of 15 kV, a beam current of 20 nA and a beam diameter of 1 µm. Wavelength-dispersion spectra were collected using LiF, PET and TAP monochromator crystals to identify interfering elements and locate the best wavelengths for background measurement. The abundances of Si, Ti, Al, Cr, V, Fe, Mn, Ni, Mg, Ca, Sr, Ba, Na, K, P, F and Cl were measured. Several elements, which are not shown in Table 1, are below the detection limit. The ZAF correction method was used for all elements. Li concentration was determined using LA-ICP-MS. The analytical setup consisted of a 200 nm femtosecond LA system (OK Fs2000K, OK Lab, Tokyo, Japan) combined with a quadrupole ICP-MS (iCAP-Qc, Thermo Fisher Scientific, Bremen, Germany). Laser fluence on the sample surface was ∼6 J cm−2. A 20 µm diameter laser beam and a pulse repetition of 10 Hz were used. Samples were ablated using a rotation raster protocol with a laser beam moving at 11.5 µm s−1 along the circumference of a circle of 10 µm radius. Ablation craters of ∼30 µm diameter by 15 µm depth were created after 60 s ablation. The U.S. Geological Survey (USGS) standard reference glass GSE-1G was used as a calibration standard, and the GSD-1G and BHVO-2G standard glasses (USGS), standard reference glasses SRM 610 and SRM 612 from the National Institute of Standard and Technology (NIST), and JR-1 natural obsidian glass from the Geological Survey of Japan (GSJ) were analyzed, together with the ferro-ferri-holmquistite, to evaluate the analytical performance. The Li2O concentration in ferro-ferri-holmquistite was 3.26 wt %. The analytical data were limited (analytical points, n=3) due to the difficulty to ensure sufficient analytical area within the acicular crystals of ferro-ferri-holmquistite.
X-ray powder diffraction data were collected using a Rigaku MiniFlex automated X-ray powder diffractometer for CuKα at 40 kV and 15 mA for 2θ= 3–90∘ with a step interval of 0.02∘. The unit-cell parameters were determined by RIGAKU PDXL software. A simulated powder diffraction pattern with CuKα radiation was obtained using RIETAN-FP (Izumi and Momma, 2007) based on the unit-cell parameters and atomic parameters from the single-crystal analysis.
Single-crystal X-ray diffraction data ( mm) were collected using an XtaLAB Synergy-S at Rigaku Corporation, Japan. The crystal was mounted on glass fiber, and intensity data were measured at room temperature. At first, it was measured using MoKα radiation (λ= 0.71073 Å), but because it was an aggregate of several crystals, some diffraction spots were overlapped, and the quality of data was not good enough. Therefore, to improve the separation of diffraction spots, we measured our crystal using CuKα radiation (λ= 1.54184 Å). Preliminary lattice parameters and an orientation matrix were obtained from six sets of frames and refined during the integration process of the intensity data. The diffraction data were processed using CrysAlisPro (Matsumoto et al., 2021). An empirical absorption correction using CrysAlisPro (Matsumoto et al., 2021) was applied. The reflection statistics and systematic absences are consistent with space group Pnma. Structural refinement was done using SHELXL-97 (Sheldrick, 2015) using neutral scattering factors. The starting coordinates were those of Cámara and Oberti (2005) for holmquistite and ferro-holmquistite. To determine the scattering power at the A, M4, M1, M2 and M3 sites, the following strategy was used. Occupancy at M4 was refined with Li and Na scattering factors. The site occupancies at M1 and M3 were refined with Fe and Mg scattering factors, and the occupancy at M2 was refined with Fe and Al scattering factors. Sums of Mg + Fe for M1 and M3, Al + Fe for M2, and Li + Na for M4 were fixed at 1.0. Fe at M1 and M3 also included a minor amount of Mn. Direct occupancy refinement at the T1A, T1B, T2A and T2B sites converged to full occupancy with Si scattering factors within the standard deviation; then their occupancies were fixed as 1.0 Si, which is also supported by the result of EPMA analysis listed in Table 1. Difference Fourier synthesis showed a peak of positive electron density around the A cavity, indicating a very small amount of Na possibly located at the A site. It was refined at a fixed value of Uiso= 0.05 Å. Hydrogen positions were also derived from difference Fourier synthesis and were refined at a fixed value of Uiso= 0.05 Å applying a restraint of O–H = 0.980(1) Å (Frank, 1973).
Single-crystal unpolarized Fourier transmission infrared (FT-IR) spectra were collected from 700 to 4000 cm−1 at room temperature using a VARIAN 660-IR spectrometer coupled with a VARIAN 620-IR microscope (Agilent Technologies, US) under N2 atmosphere. Sample and background spectra were averaged from each of 256 scans with a spectral resolution of 8 cm−1. The pattern was resolved by fitting a Gaussian function using OriginPro® 2022.
5.1 Chemical composition
The chemical composition of ferro-ferri-holmquistite is listed in Table 1 with respective standards for elements. Each crystal is slightly zoned (Fig. 1b). Such chemical variability is mainly due to Al ↔ Fe3+ substitution (R2= 0.83 in Fig. 2) implying the presence of Fe3+ in our sample in addition to Fe2+. In such a case, it is known to be necessary to normalize the anions to a fixed number and normalize the cations to a fixed number and then adjust the ratio to obtain electroneutrality (Hawthorne, 1983). The normalization scheme Σ (C+T) = 13 was used to obtain the cations' ratio of our specimen, where (C+T) = Si, Al, Ti, Fe3+, Fe2+, Mn2+, Mg. On the basis of charge neutrality, the FeO and Fe2O3 contents were calculated as 22.63 wt % and 12.39 wt %, respectively, corresponding to 2.82 Fe2+ and 1.39 Fe3+ apfu (atoms per formula units). The H2O content was calculated based on stoichiometry. The empirical formula calculated on the basis of Σ (C+T) = 13 is A(K0.01Na0.06)Σ0.07B(Li1.95Na0.04Ca0.01)Σ2.00C(FeFeAl0.51Mg0.22MnTi0.01)Σ5.00T(Si7.98Al0.02)Σ8.00O22(OH)1.94F0.06. The ideal formula is □Li2(FeFeSi8O22(OH)2, which requires SiO2 53.18, Fe2O3 17.67, FeO 23.85, Li2O 3.31, H2O 1.99 and total 100 wt %.
Table 2Observed X-ray powder diffraction data (d in Å) and calculated pattern based on X-ray single-crystal refinement of ferro-ferri-holmquistite*.
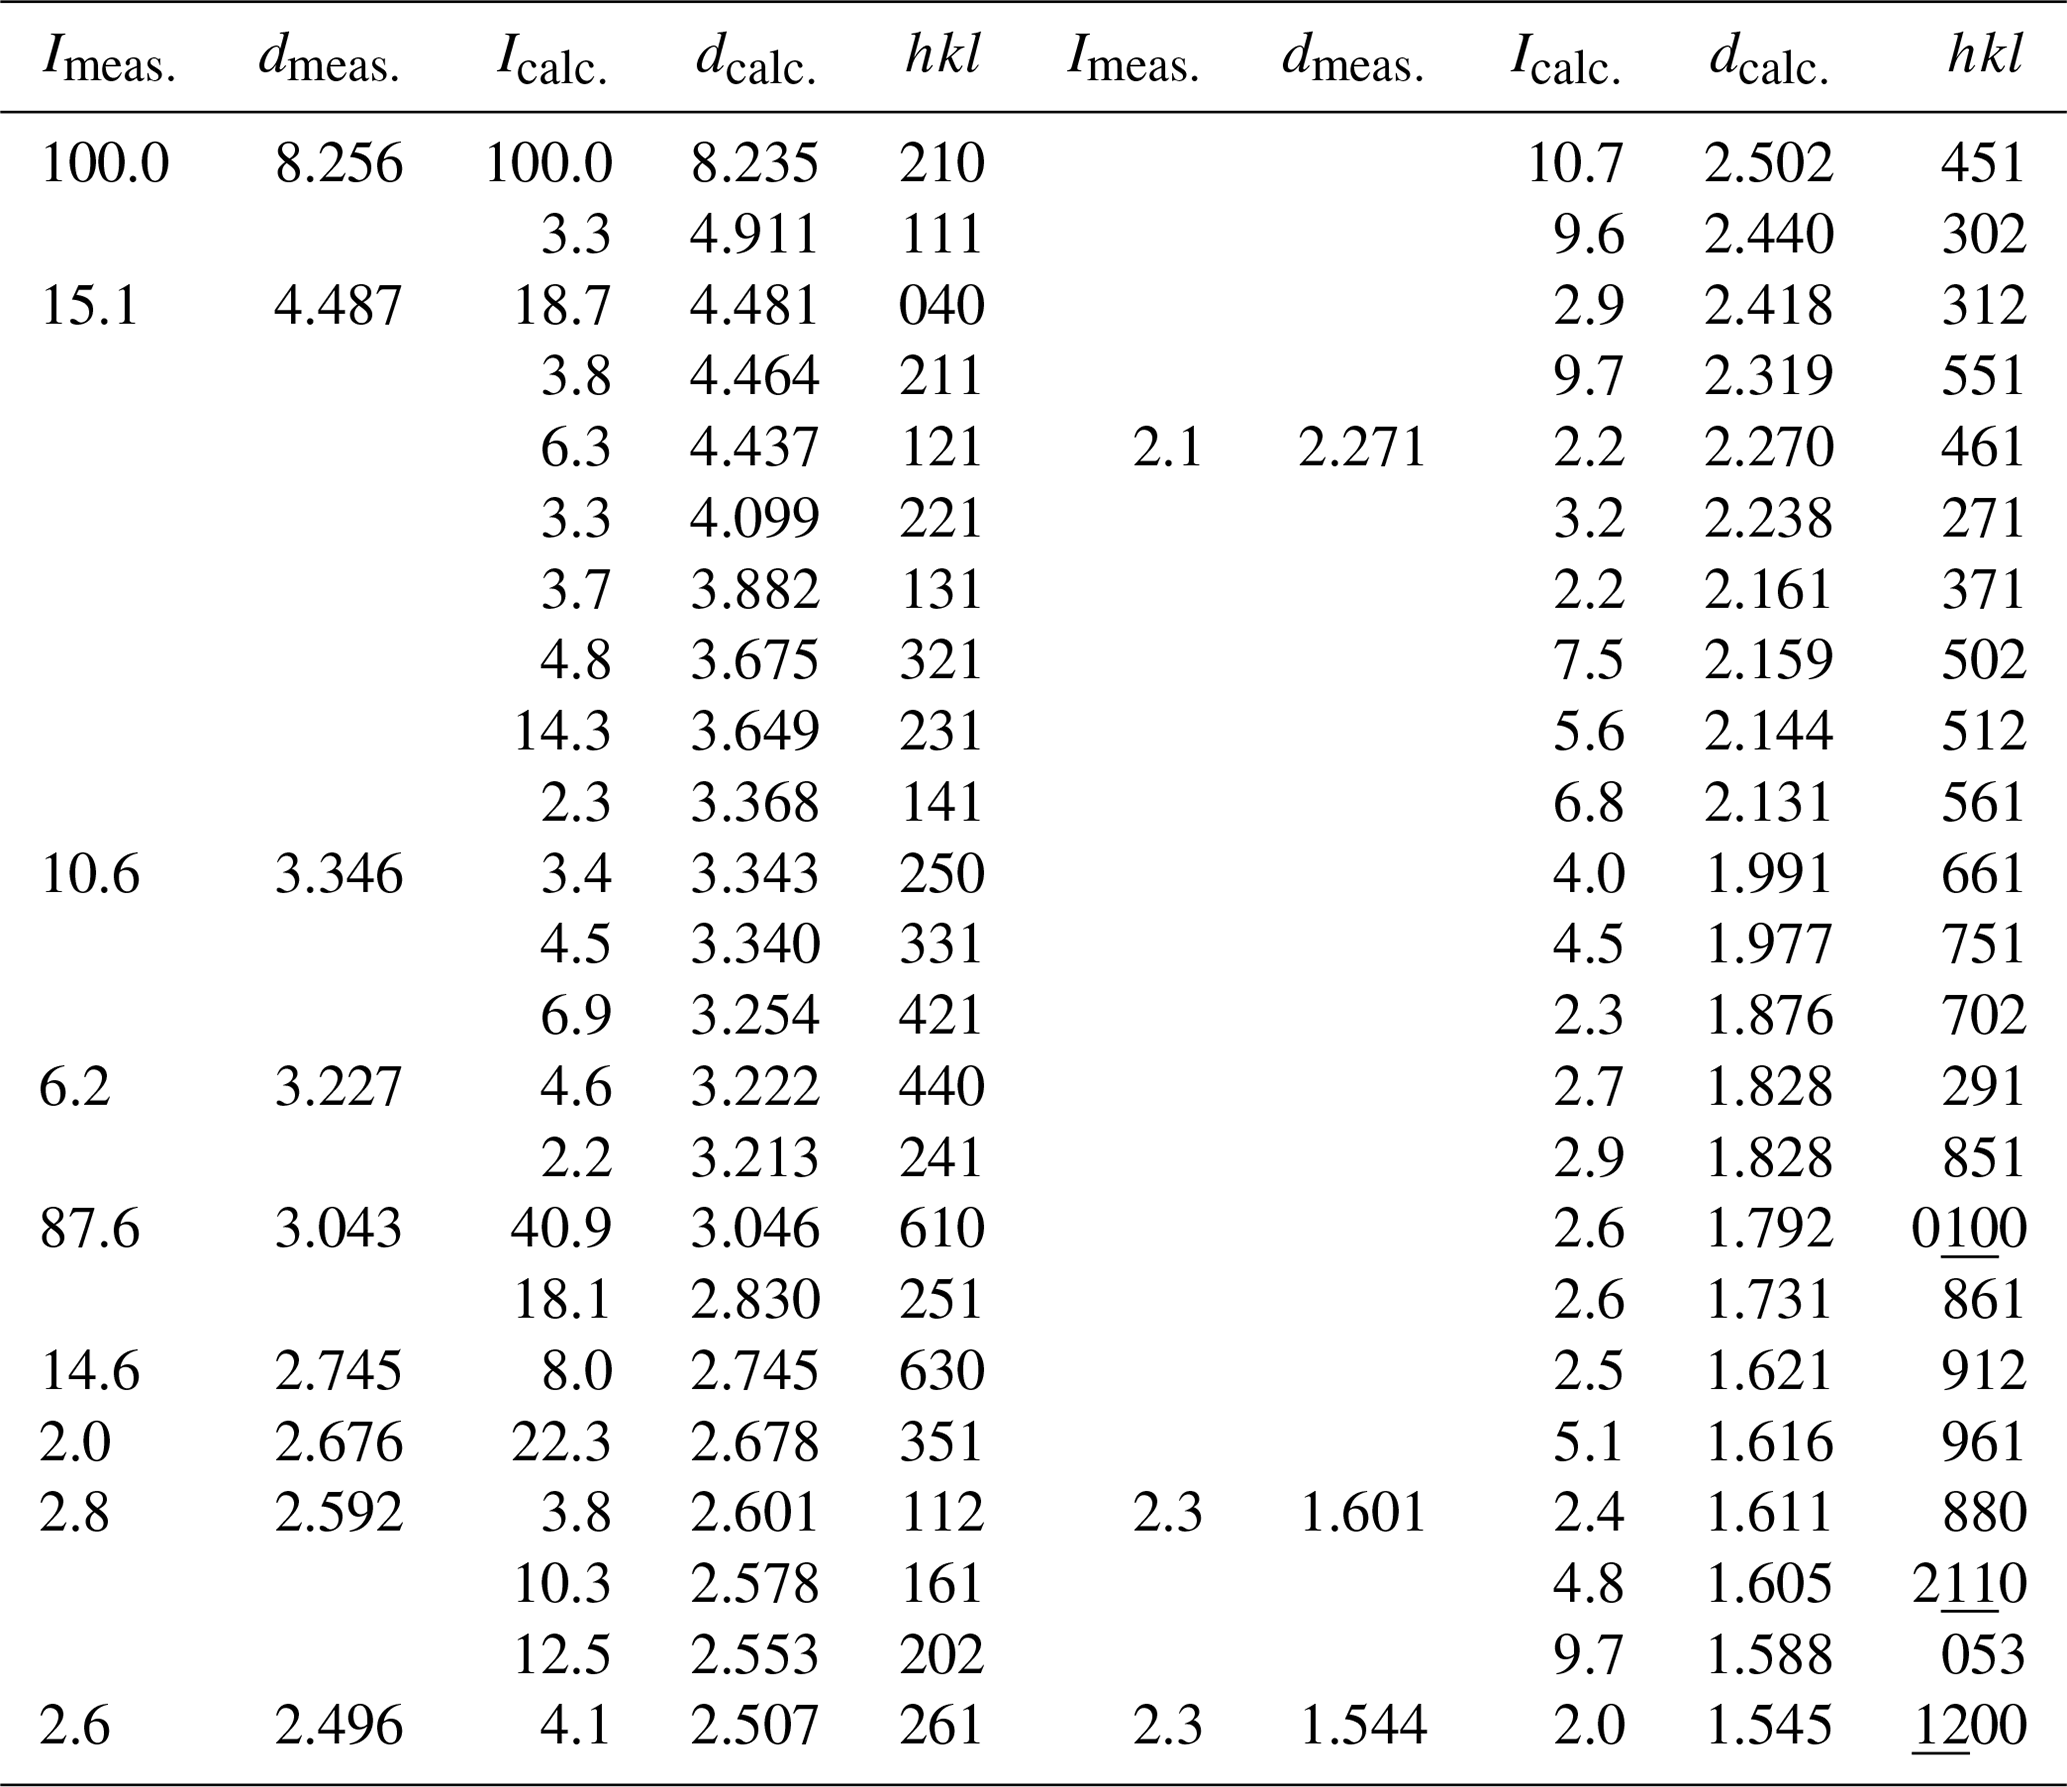
* Only reflections with relative intensity >2 % are listed.
5.2 X-ray powder diffraction analysis
The observed and simulated powder X-ray diffraction (XRD) pattern of ferro-ferri-holmquistite is listed in Table 2. The calculated pattern was obtained based on the result of single-crystal analysis mentioned below. The powder XRD pattern showed the effect of preferred orientation due to the fibrous and prismatic crystals. The refined unit-cell parameters from powder data are a= 18.5429(8) Å, b= 17.924(3) Å, c= 5.3110(18) Å and V= 1785.2(7) Å3, which is slightly smaller than those obtained from the X-ray single-crystal method.
Table 3Experimental details of the single-crystal X-ray diffraction analysis of ferro-ferri-holmquistite.
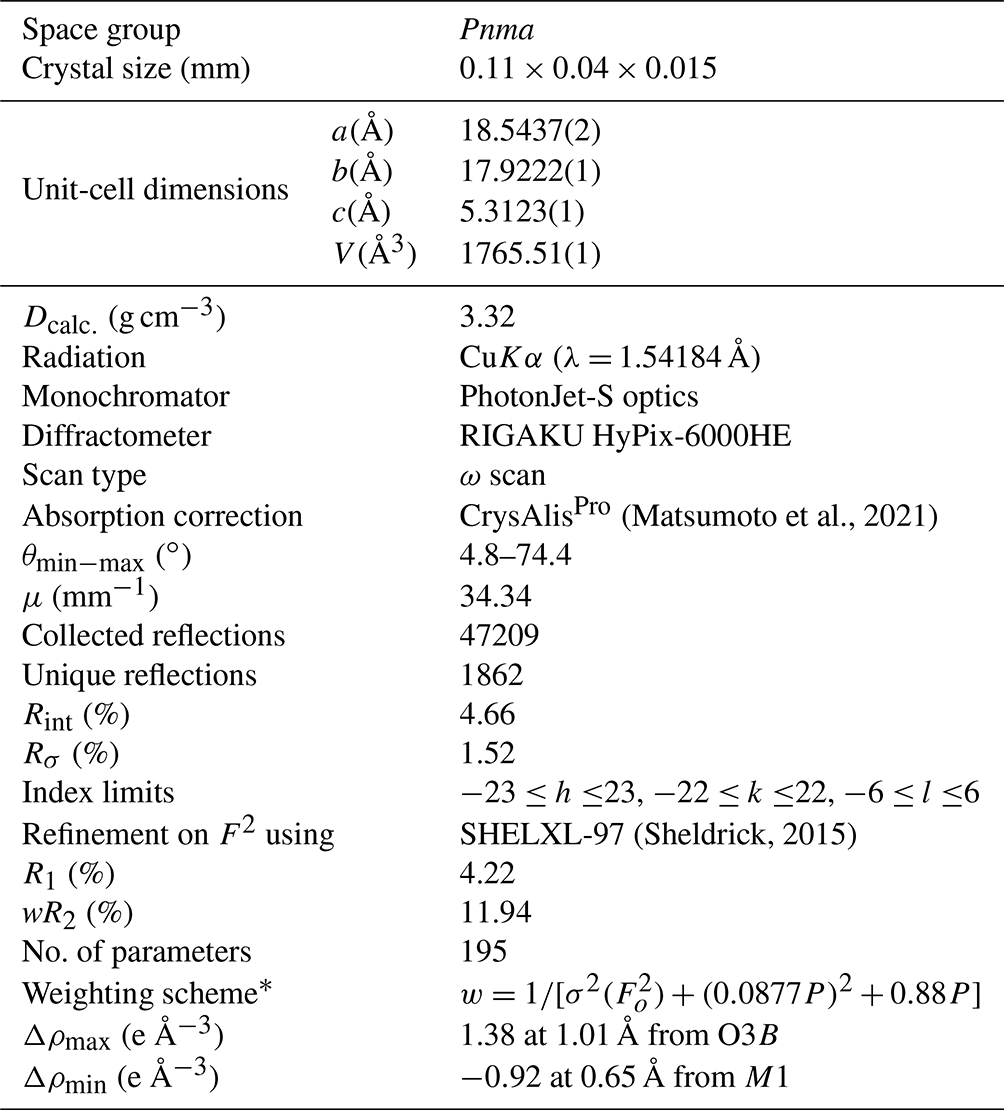
* The function of the weighting scheme is , where P= (Max() ), and the parameters a and b are chosen to minimize the differences in the variances for reflections in different ranges of intensity and diffraction angle.
5.3 Crystal-structure refinement
Crystallographic data of ferro-ferri-holmquistite are summarized in Table 3. Structural refinements converged to R1= 4.22 %. The refined atom positions and anisotropic displacement parameters are listed in Tables 4 and 5. The refined site-scattering values and the determined site assignment are shown in Table 6. Selected bond lengths and angles are listed in Table 7. Bond-valence sums are listed in Table 8, calculated using the equation of Brown and Altermatt (1985) and the bond-valence parameters of Gagné and Hawthorne (2015). Both bond-valence calculation and located hydrogen sites indicated that the O3A and O3B positions host hydroxyl groups. The crystal structure of ferro-ferri-holmquistite is shown in Fig. 3. The oxygen atoms at O3A and O3B forming the OH groups are elongated along [100].
Table 4Refined atom positions and displacement parameters (Å2) of ferro-ferri-holmquistite.
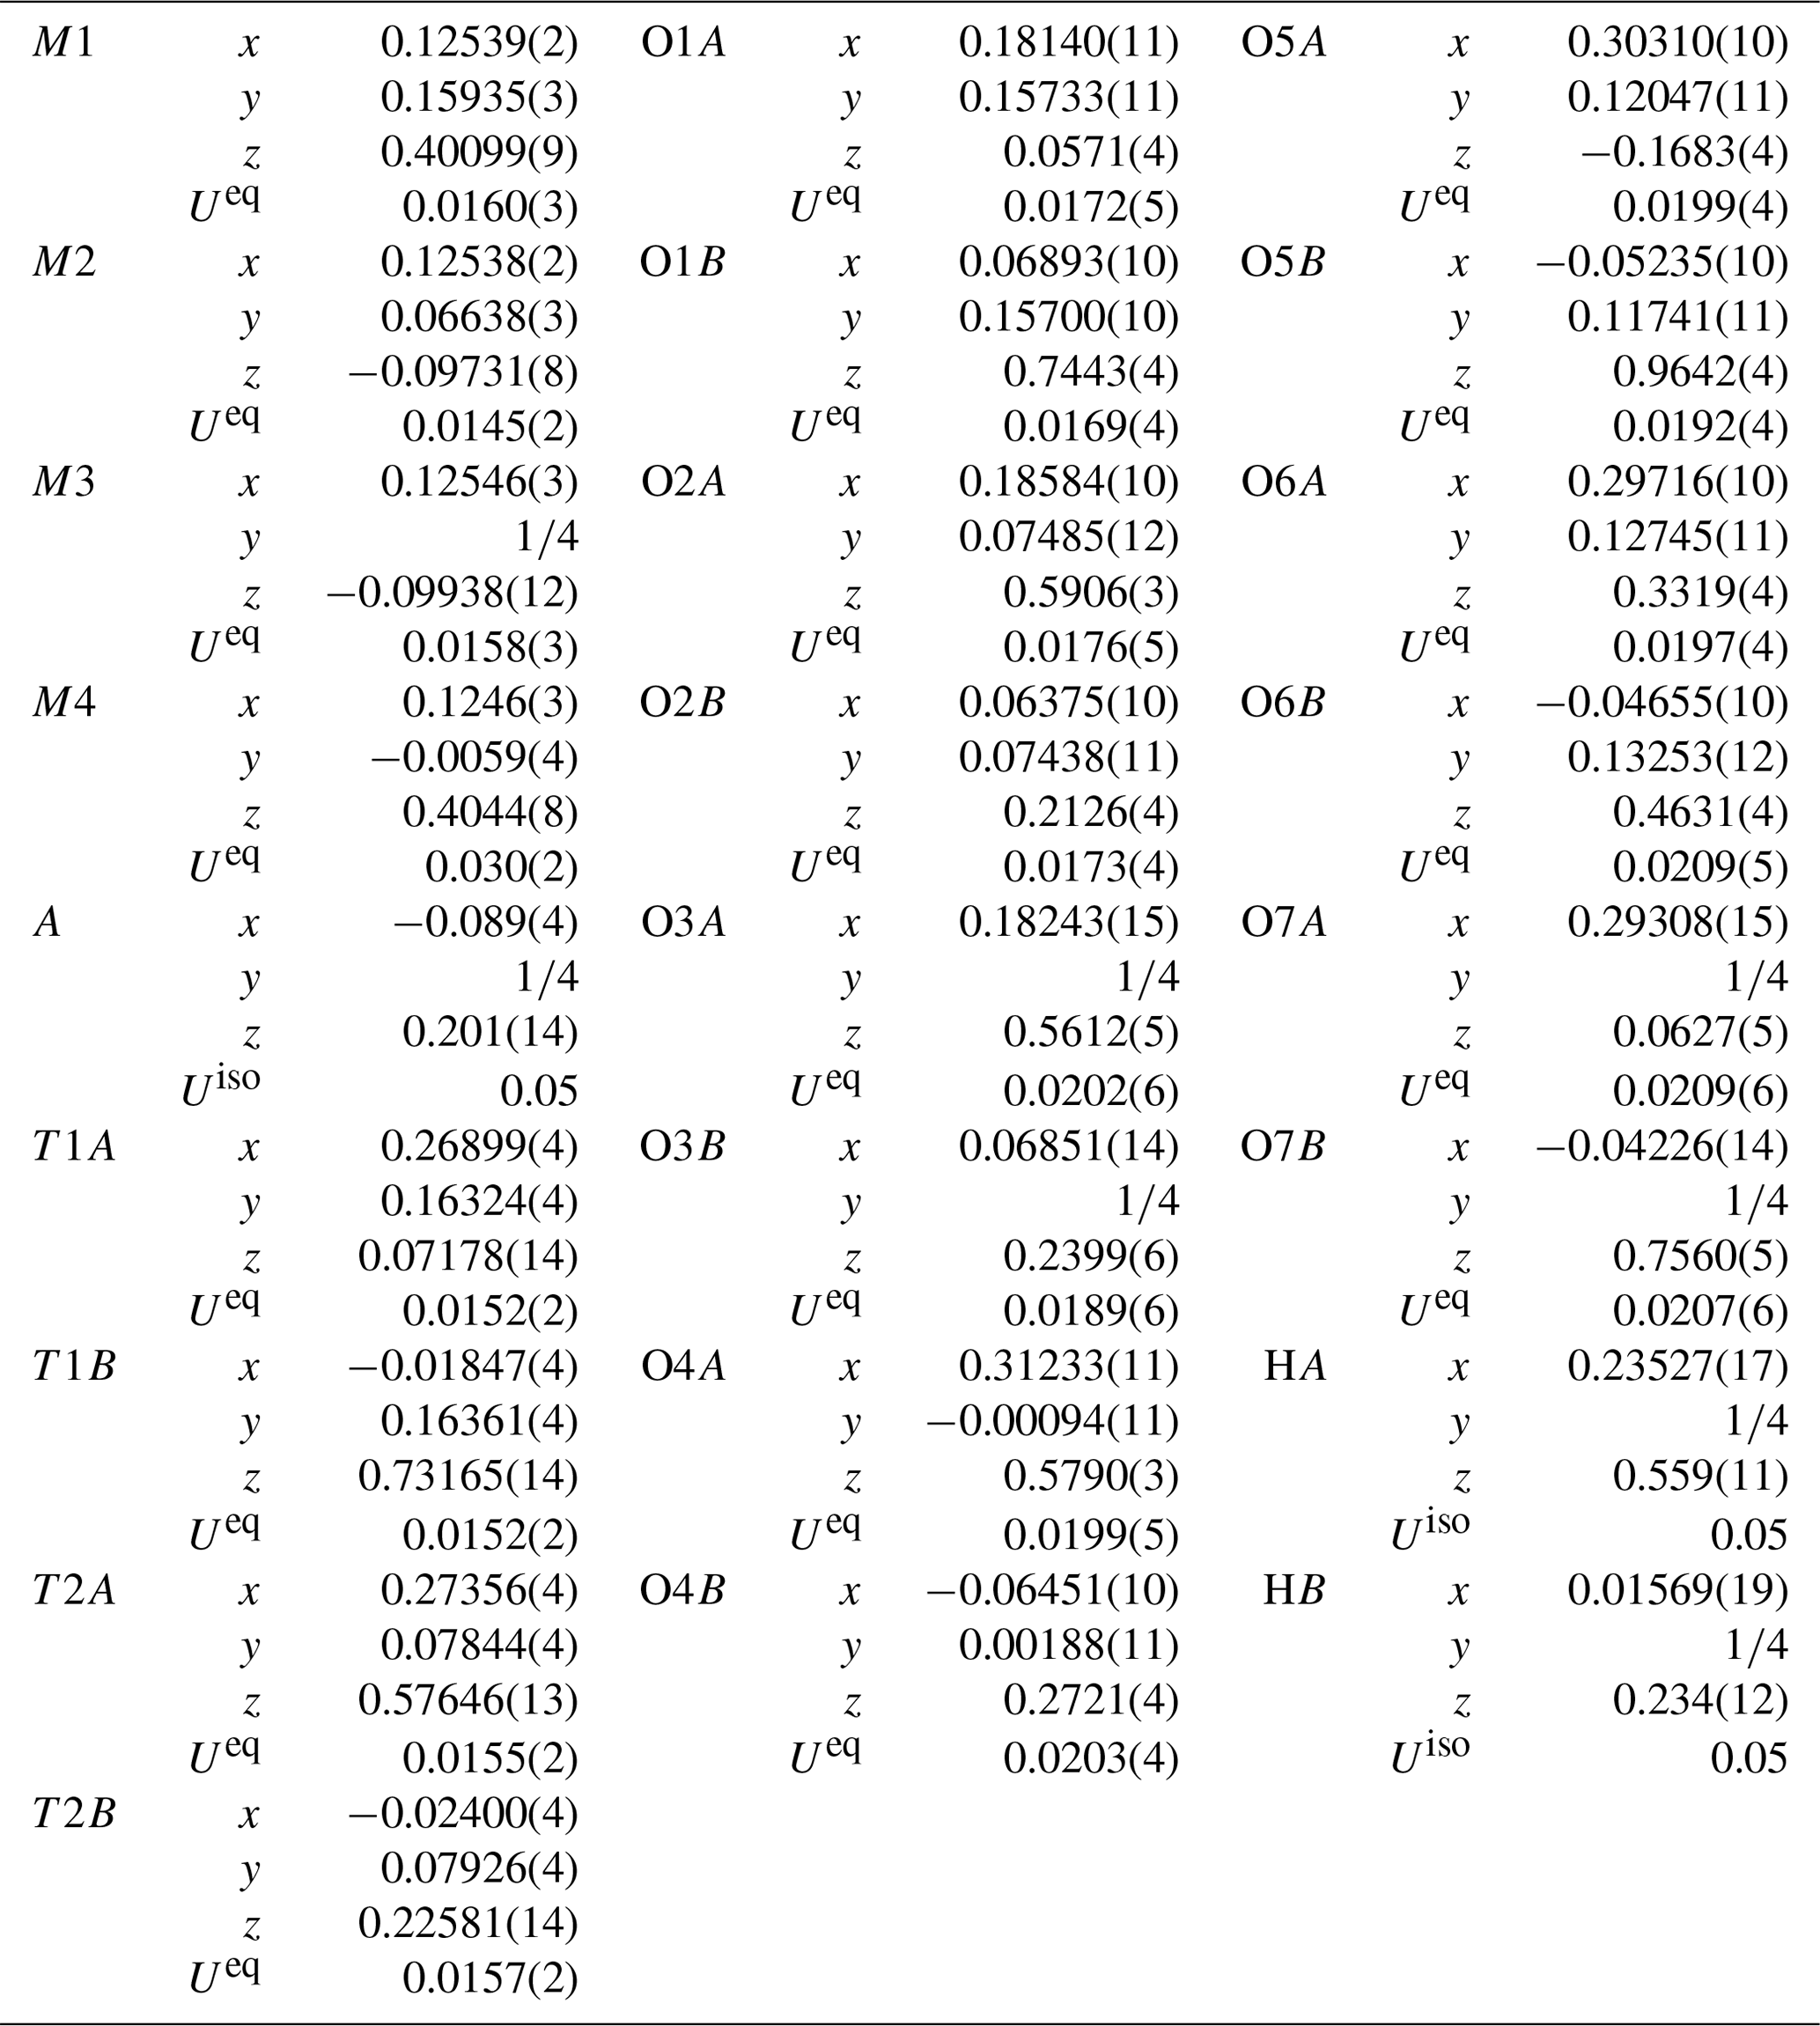
Table 5Anisotropic displacement parameters of ferro-ferri-holmquistite.
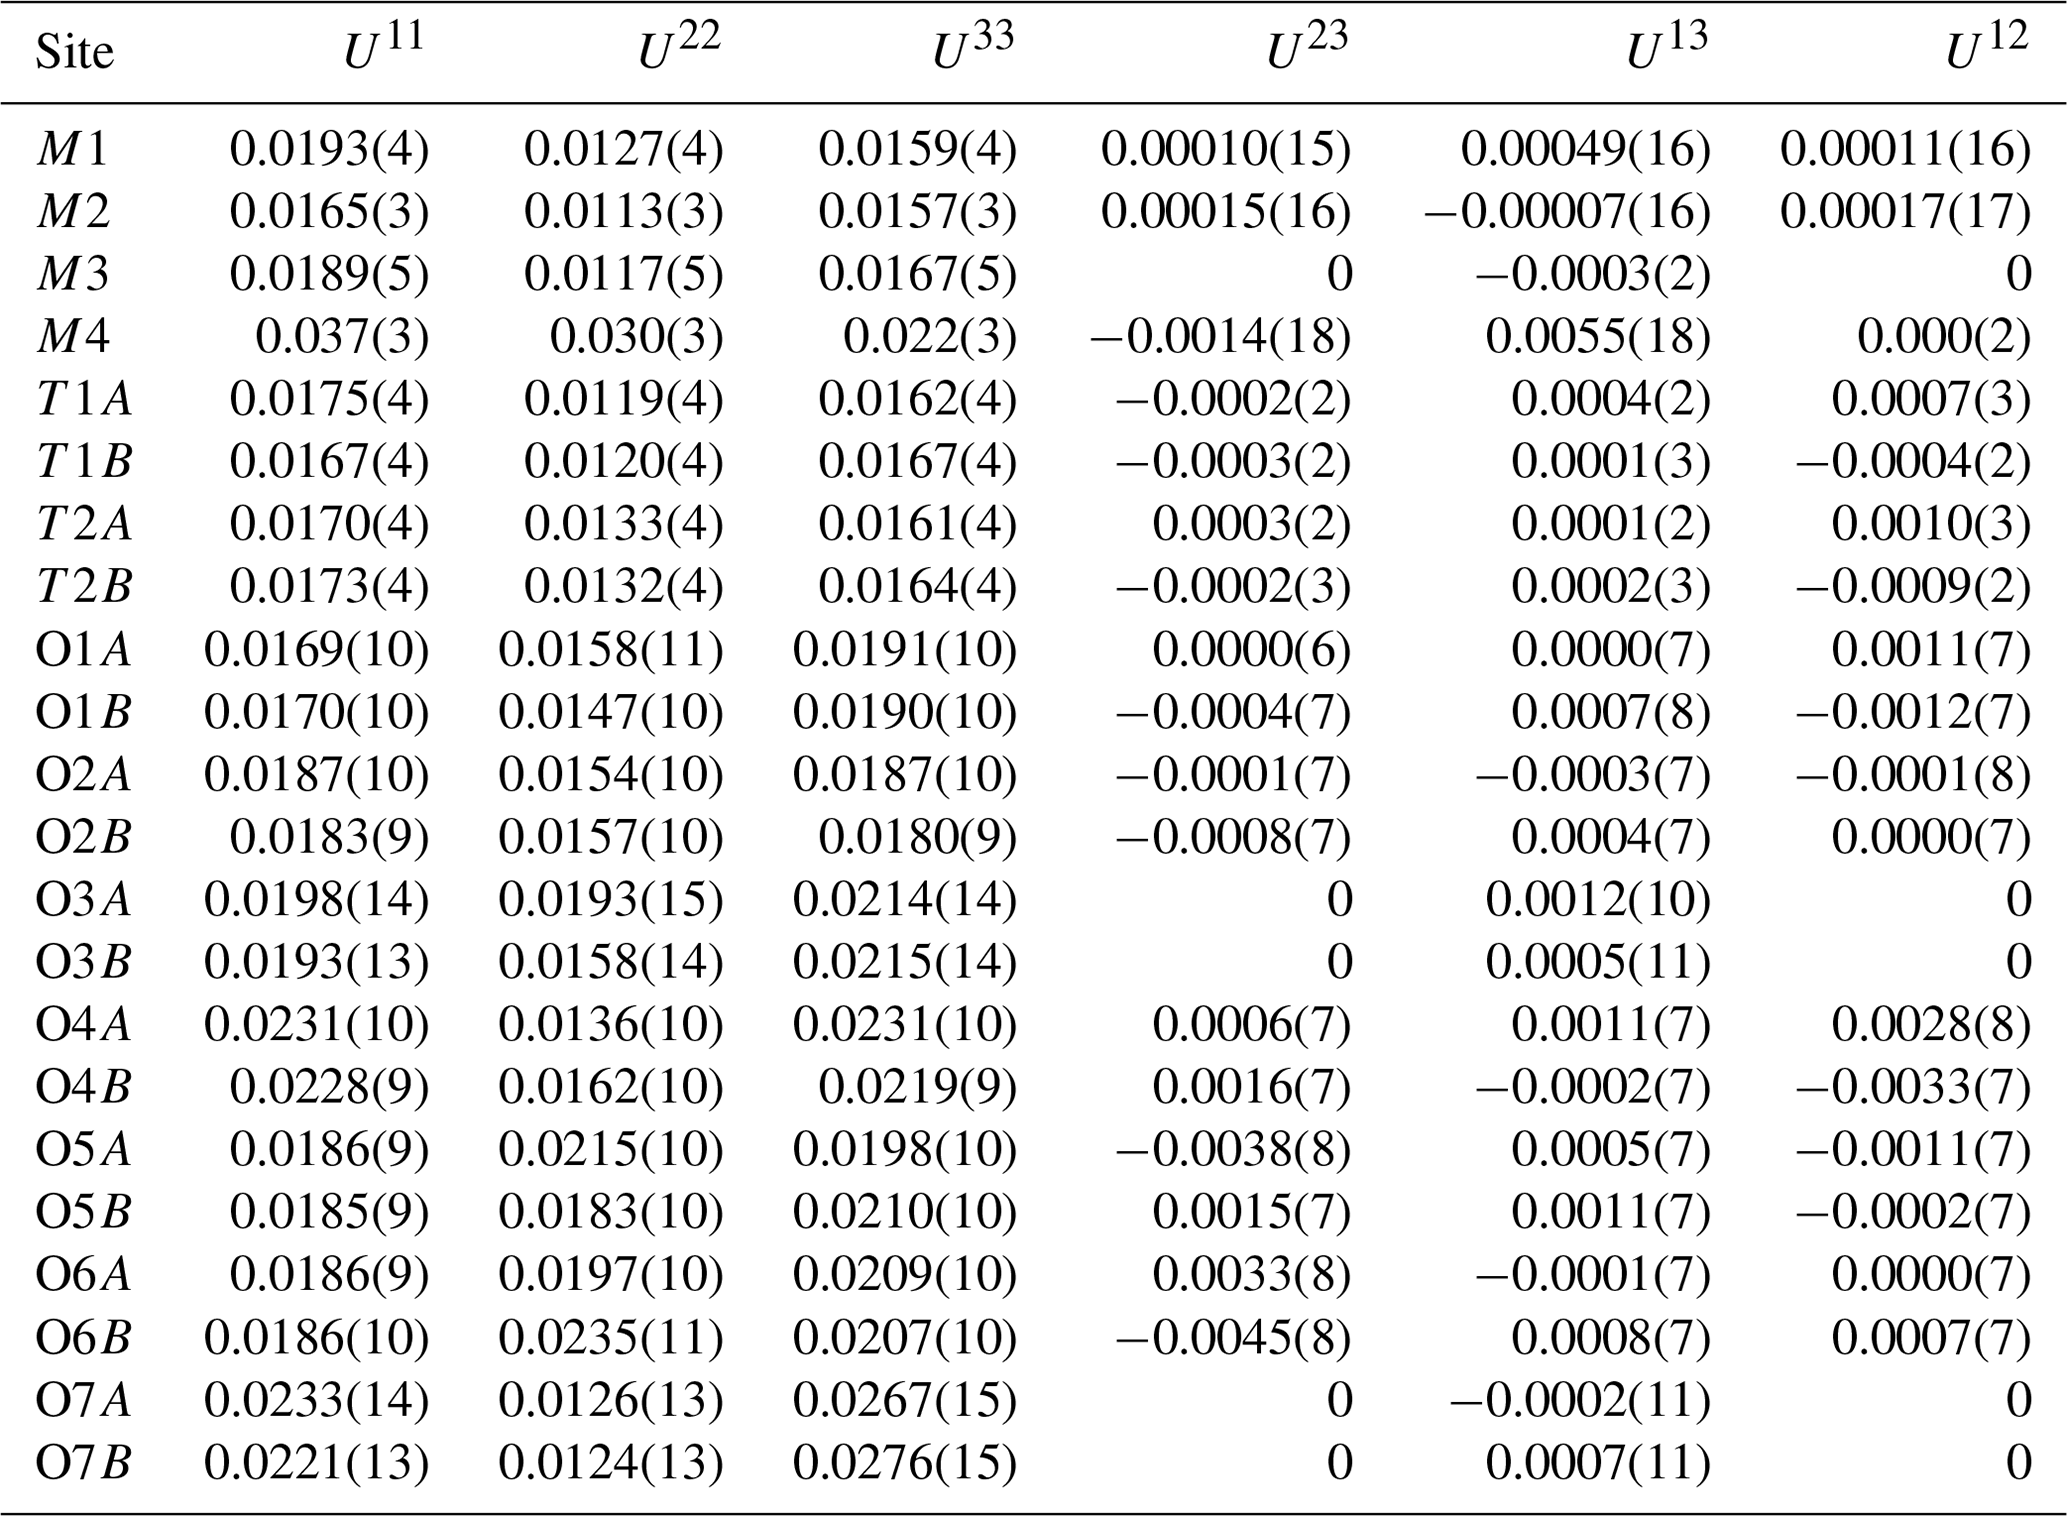
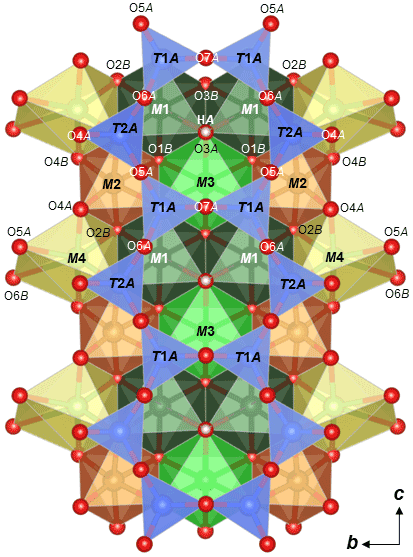
Figure 3Crystal structure of ferro-ferri-holmquistite projected onto (100) showing the configuration of the A chain with M1–4 polyhedra drawn with VESTA3 (Momma and Izumi, 2011).
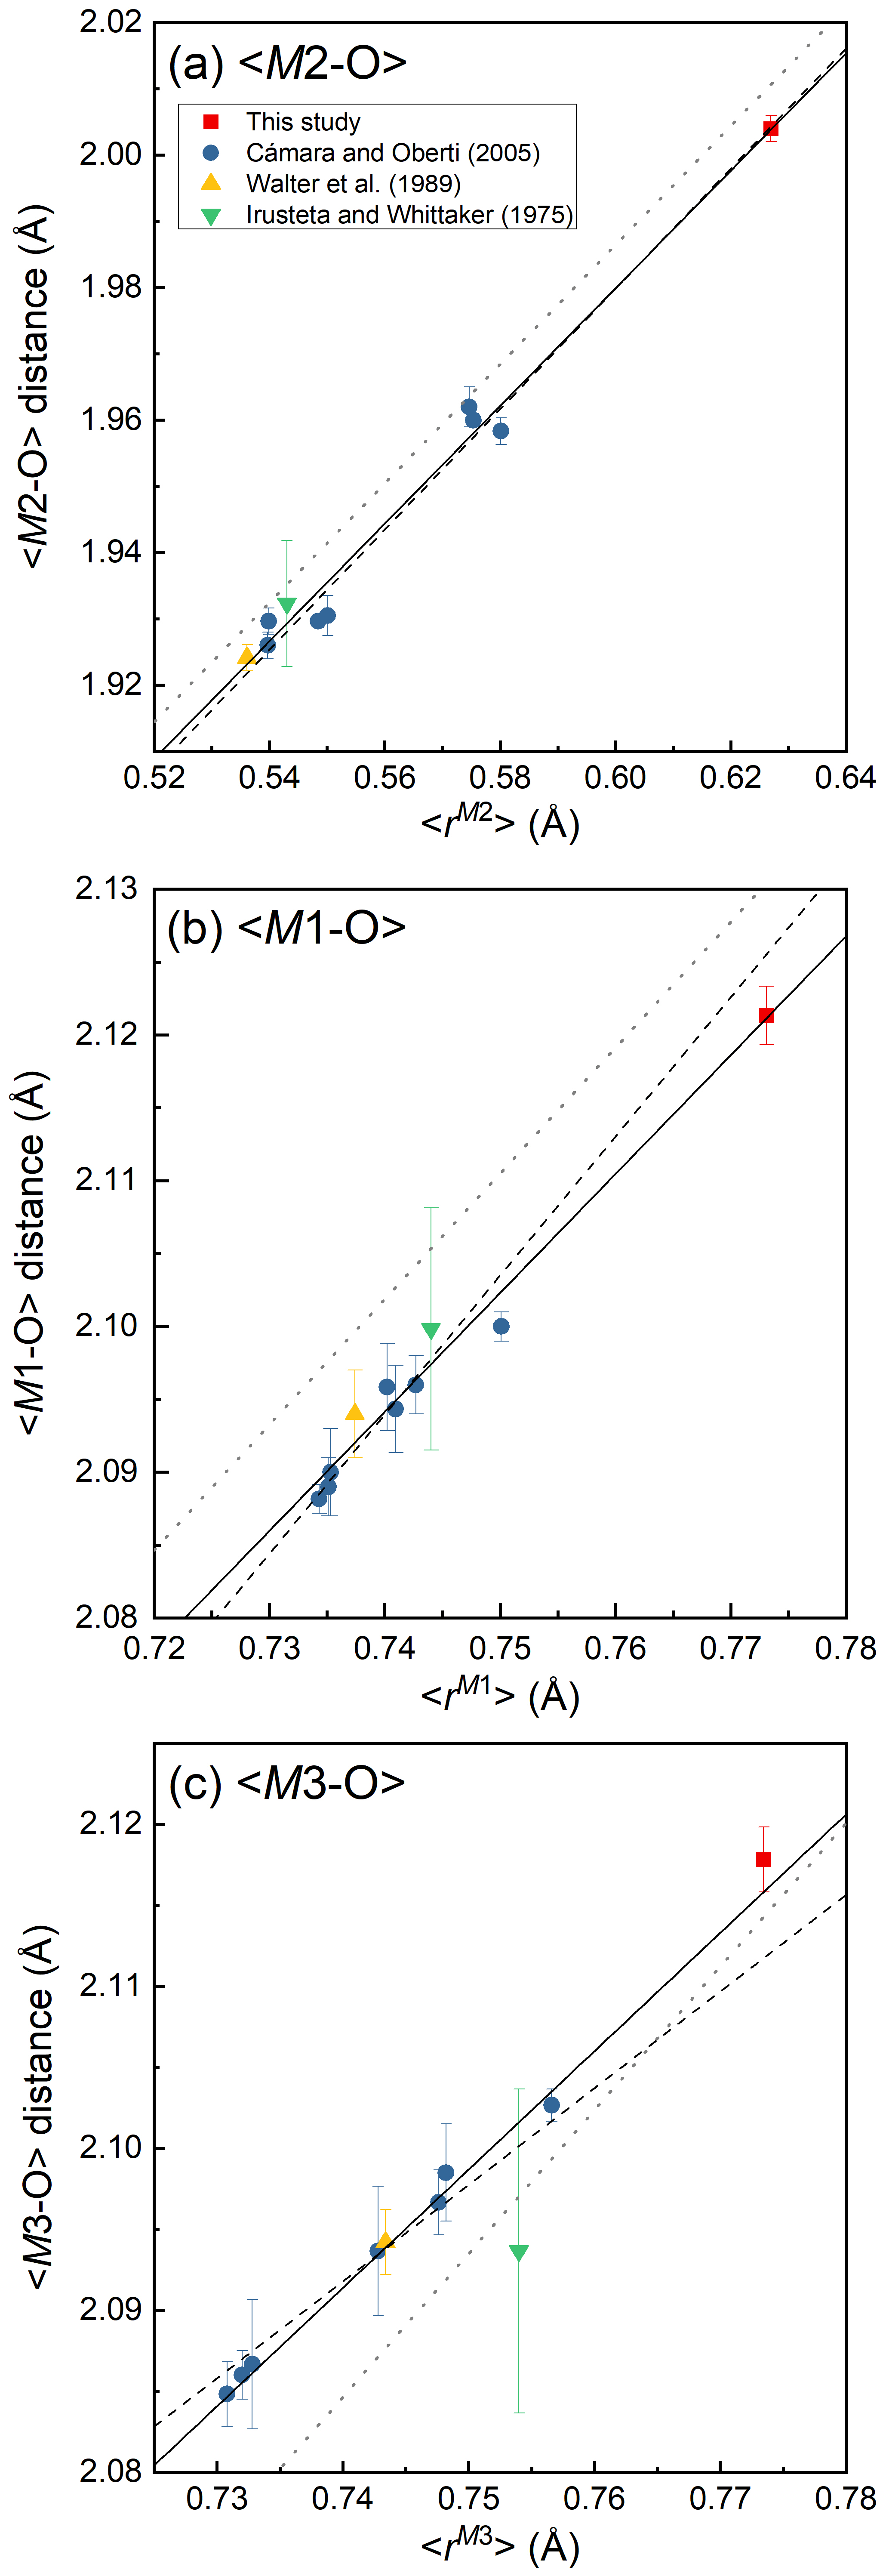
Figure 4Variations of <M2–O > (Å) (a), <M1–O > (Å) (b) and <M3–O > (Å) (c) against mean ionic radius (Å), <r>, of the constituent cations at each site. The functions of the regression lines (solid lines) are as follows: <M2–O >= 1.45(2) + 0.89(4)r (R2= 0.98), <M1–O >= 1.49(4) + 0.82(5)r (R2= 0.97) and <M3–O >= 1.55(2) + 0.73(3)r (R2= 0.99), where r is mean ionic radius of the constituent cations at each site. The break lines and dotted lines are the regression functions of the structural study of holmquistite-group minerals by Cámara and Oberti (2005) and that of the Pnma amphiboles proposed by Hawthorne et al. (2008), respectively. The cation assignment no. 6 was used to estimate <r> for the holmquistite studied by Irusteta and Whittacker (1975) following Hawthorne (1983).
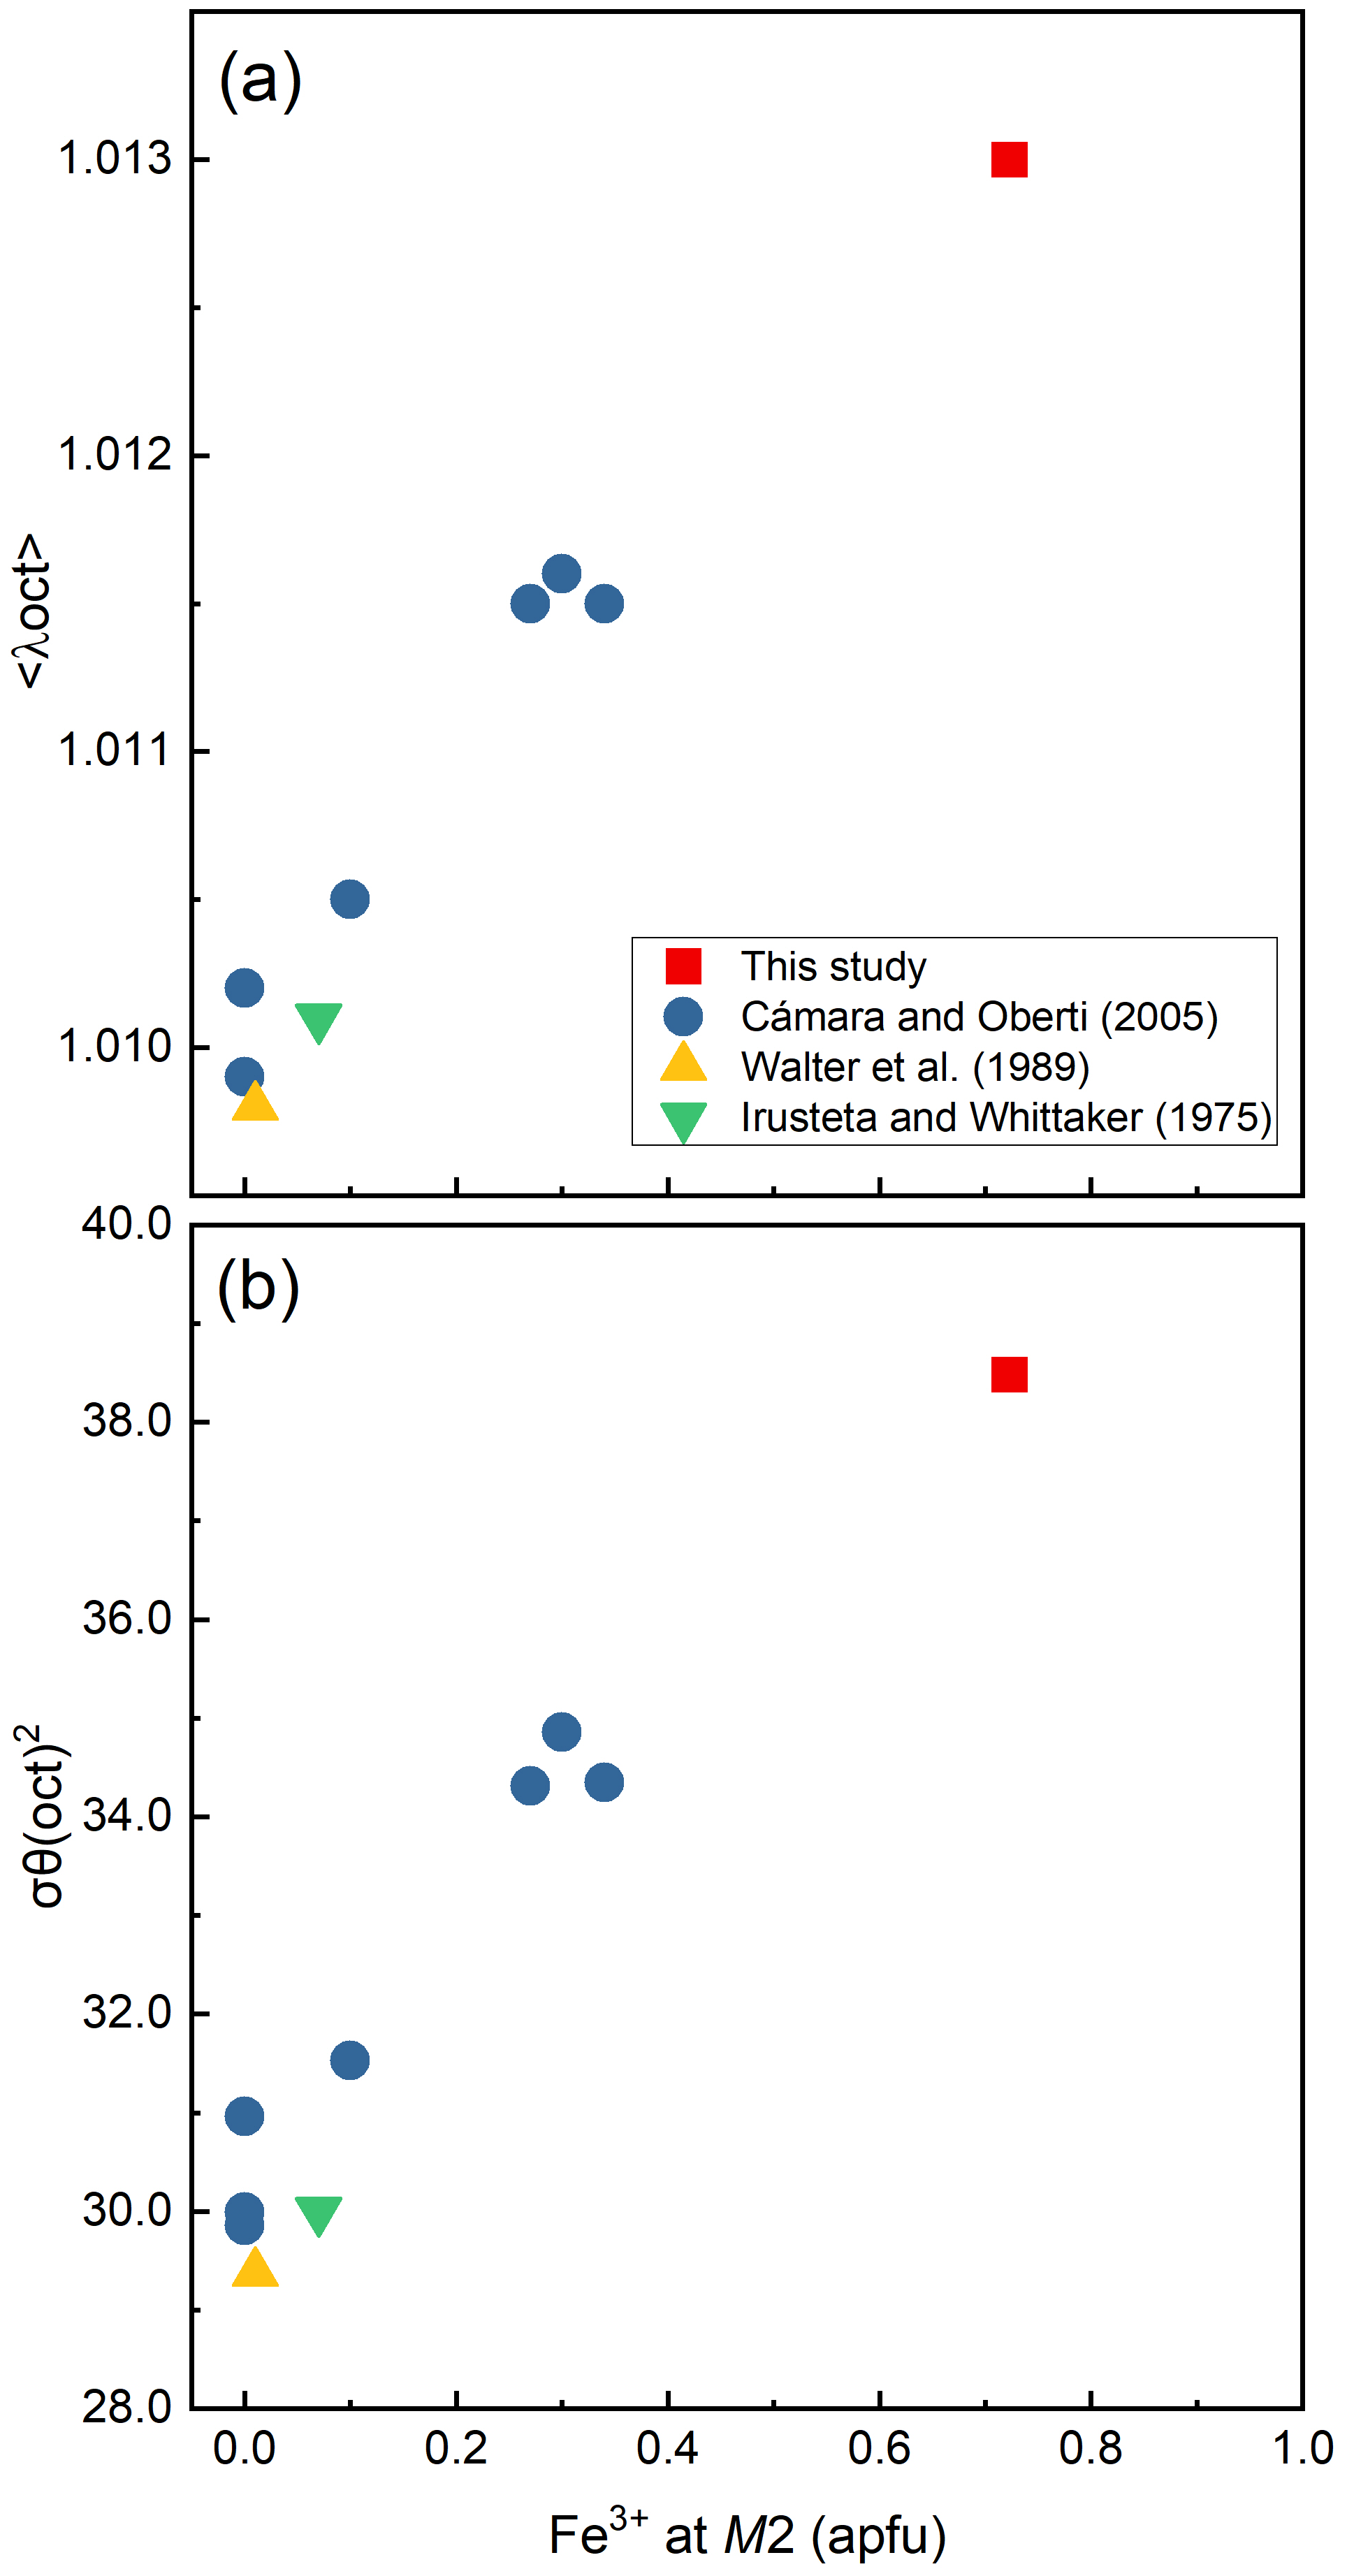
Figure 5Variations of the bond-length distortion, <λ oct >, (a) and the angle variance, (oct), (b) of the M2O6 octahedra against Fe3+ content (apfu) at the M2 site.
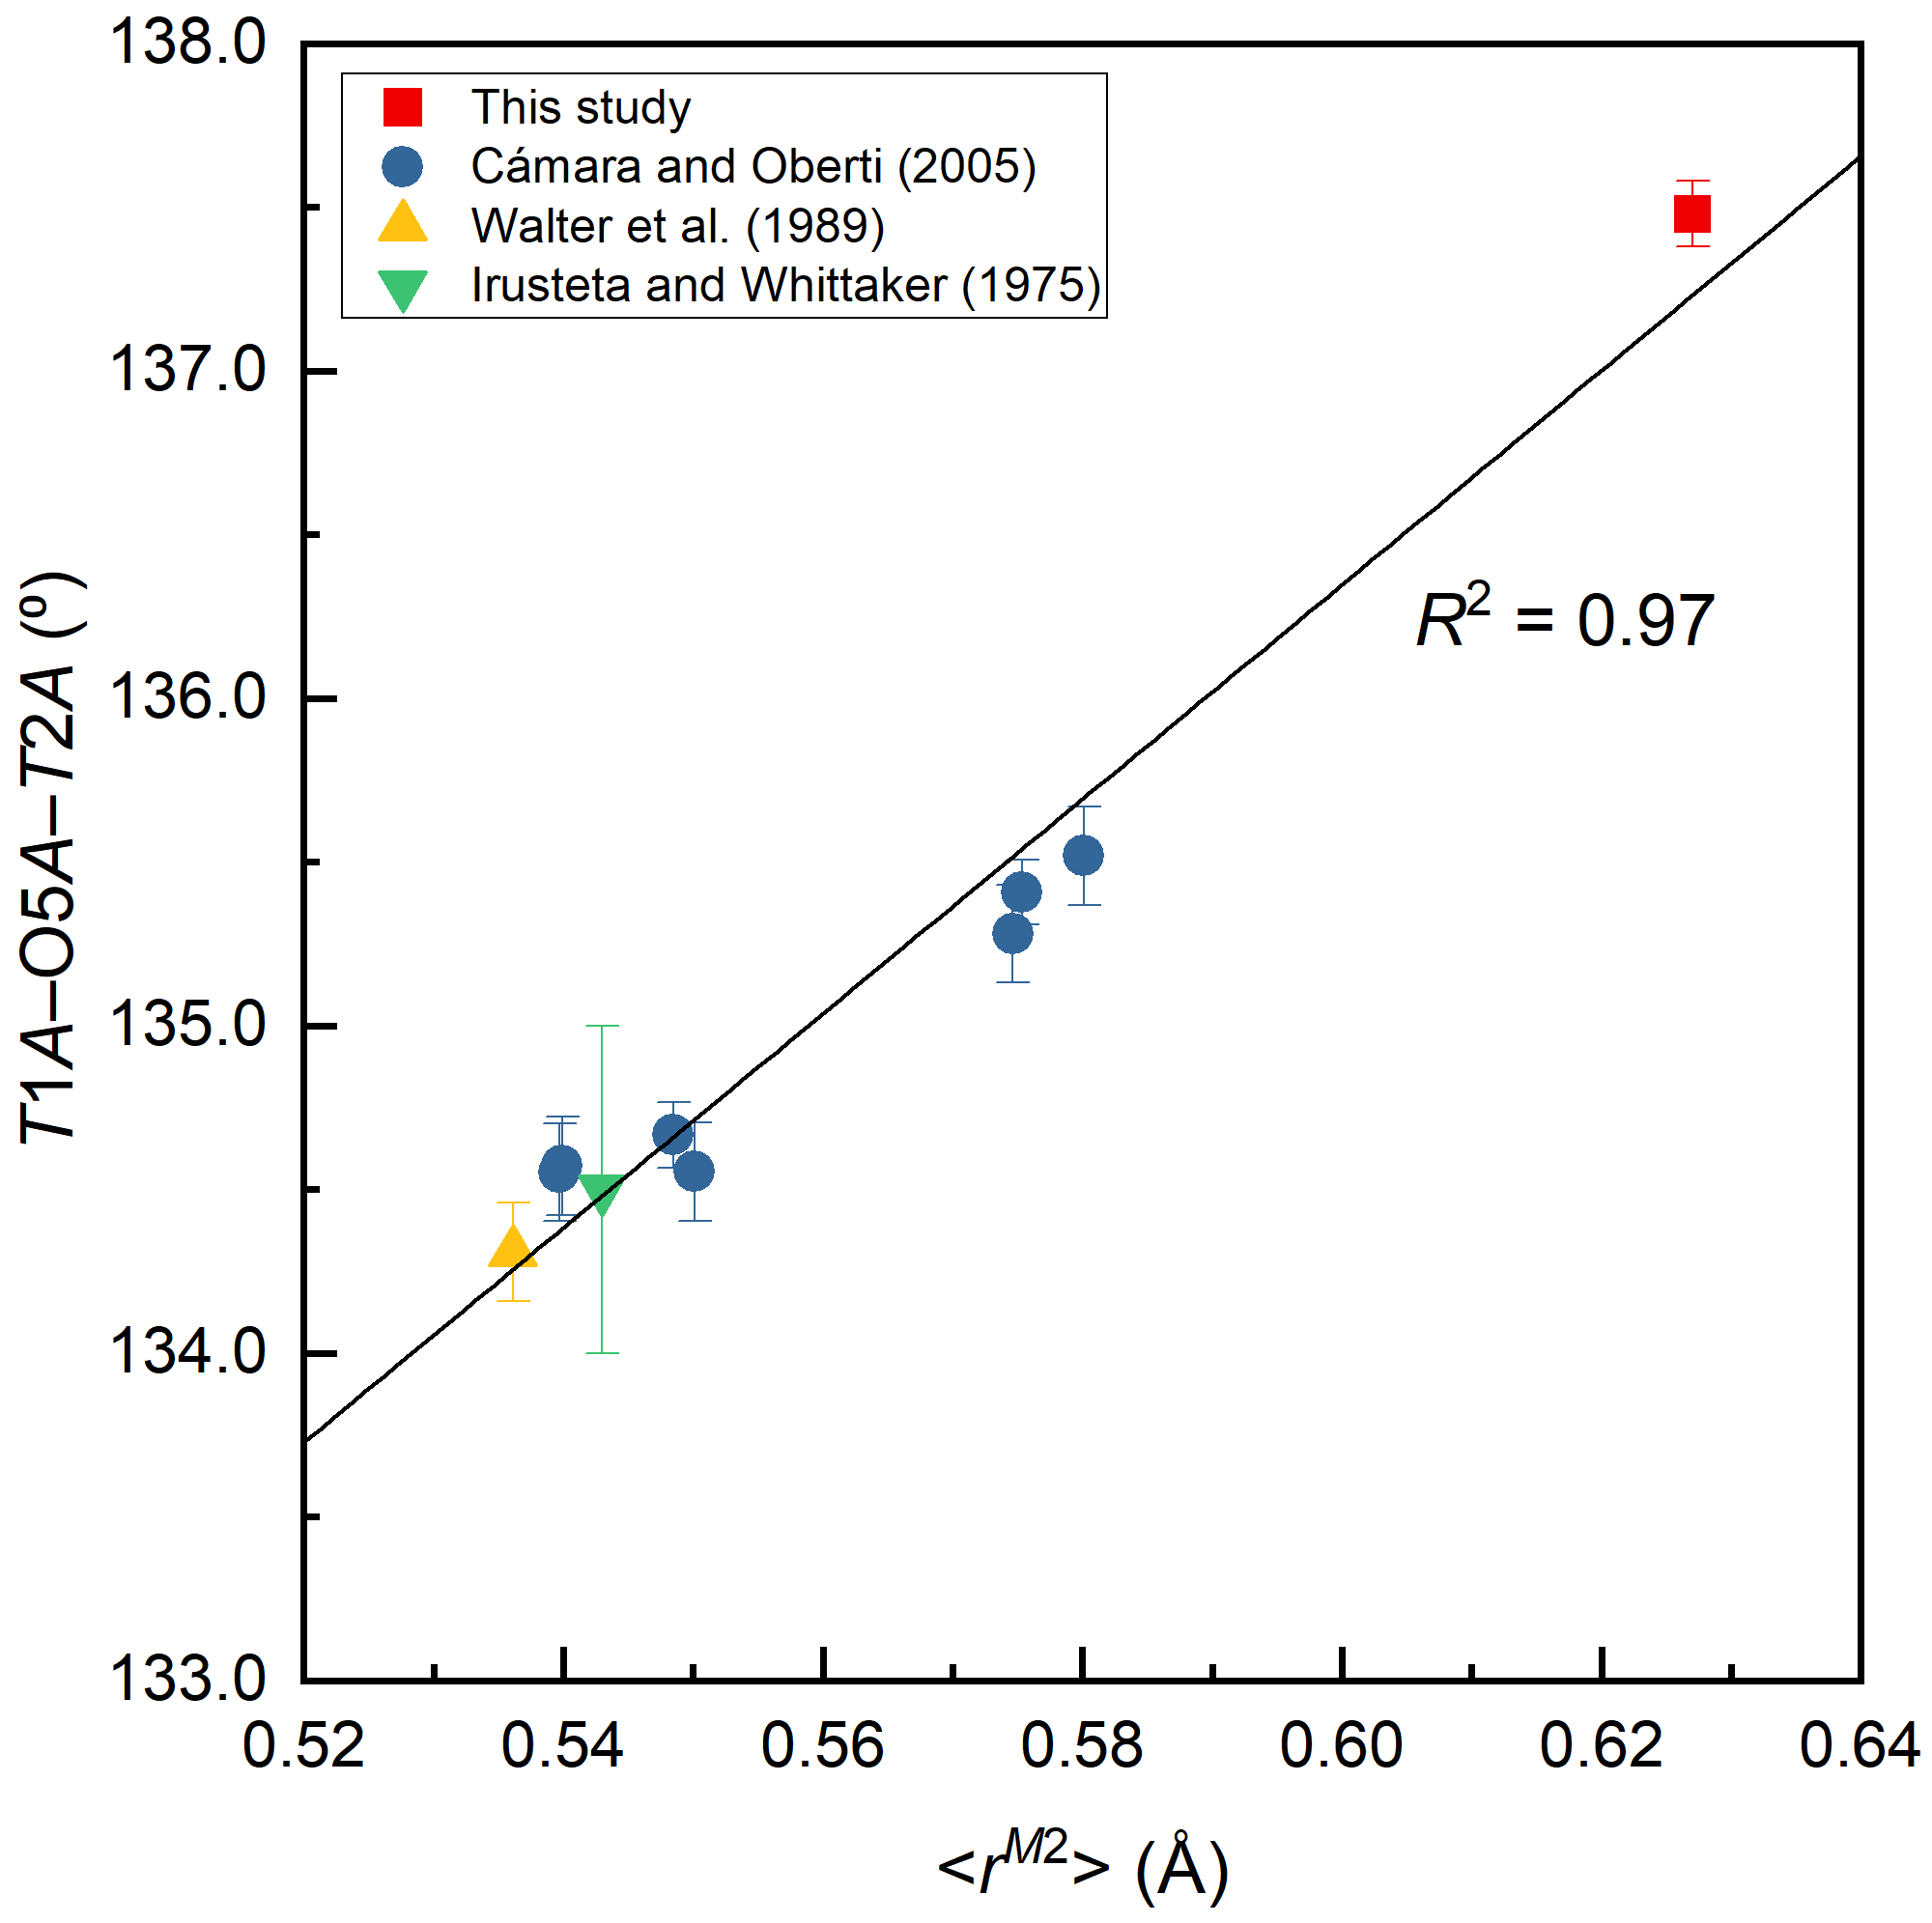
Figure 6Variation of T1A–O5–T2B angle (∘) against the mean ionic radius of the constituent cations at M2, <rM2> (Å).

Figure 7Variation of unit-cell parameters against total Fe content (apfu) in holmquistites. Error bars are within the size of symbols. The unit-cell parameters of holmquistite studied by Irusteta and Whittacker (1975) were originally given in Whittaker (1969). The standard deviations were not given in Whittaker (1969).

Figure 8The OH-stretching FT-IR spectrum (red line) of ferro-ferri-holmquistite resolved into Gaussian components (broken lines). Three peaks can be identified in the spectrum, centered at 3614, 3631 and 3644 cm−1 from right to left.
Table 6Site occupancies of ferro-ferri-holmquistite.
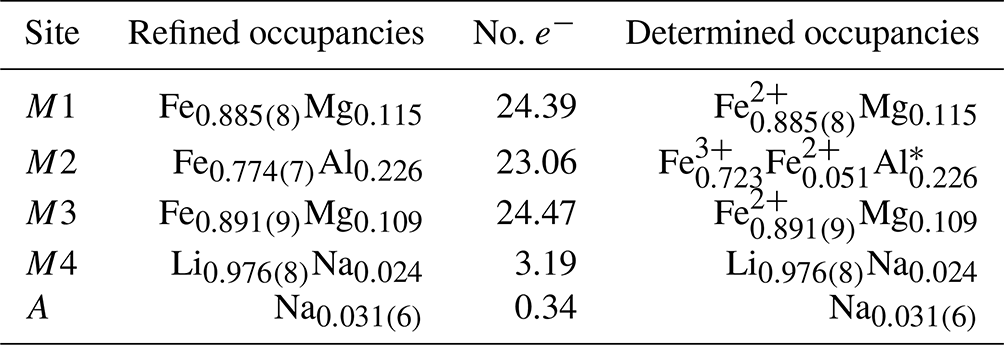
* The ratios of Fe2+ and Fe3+ were estimated based on the mean bond-length–aggregate-cation–radius relation, <M2-O , where r represents the mean ionic radius of the constituent cations at M2, based on Cámara and Oberti (2005).
Table 7Selected bond lengths (Å) and angles (∘) of ferro-ferri-holmquistite.
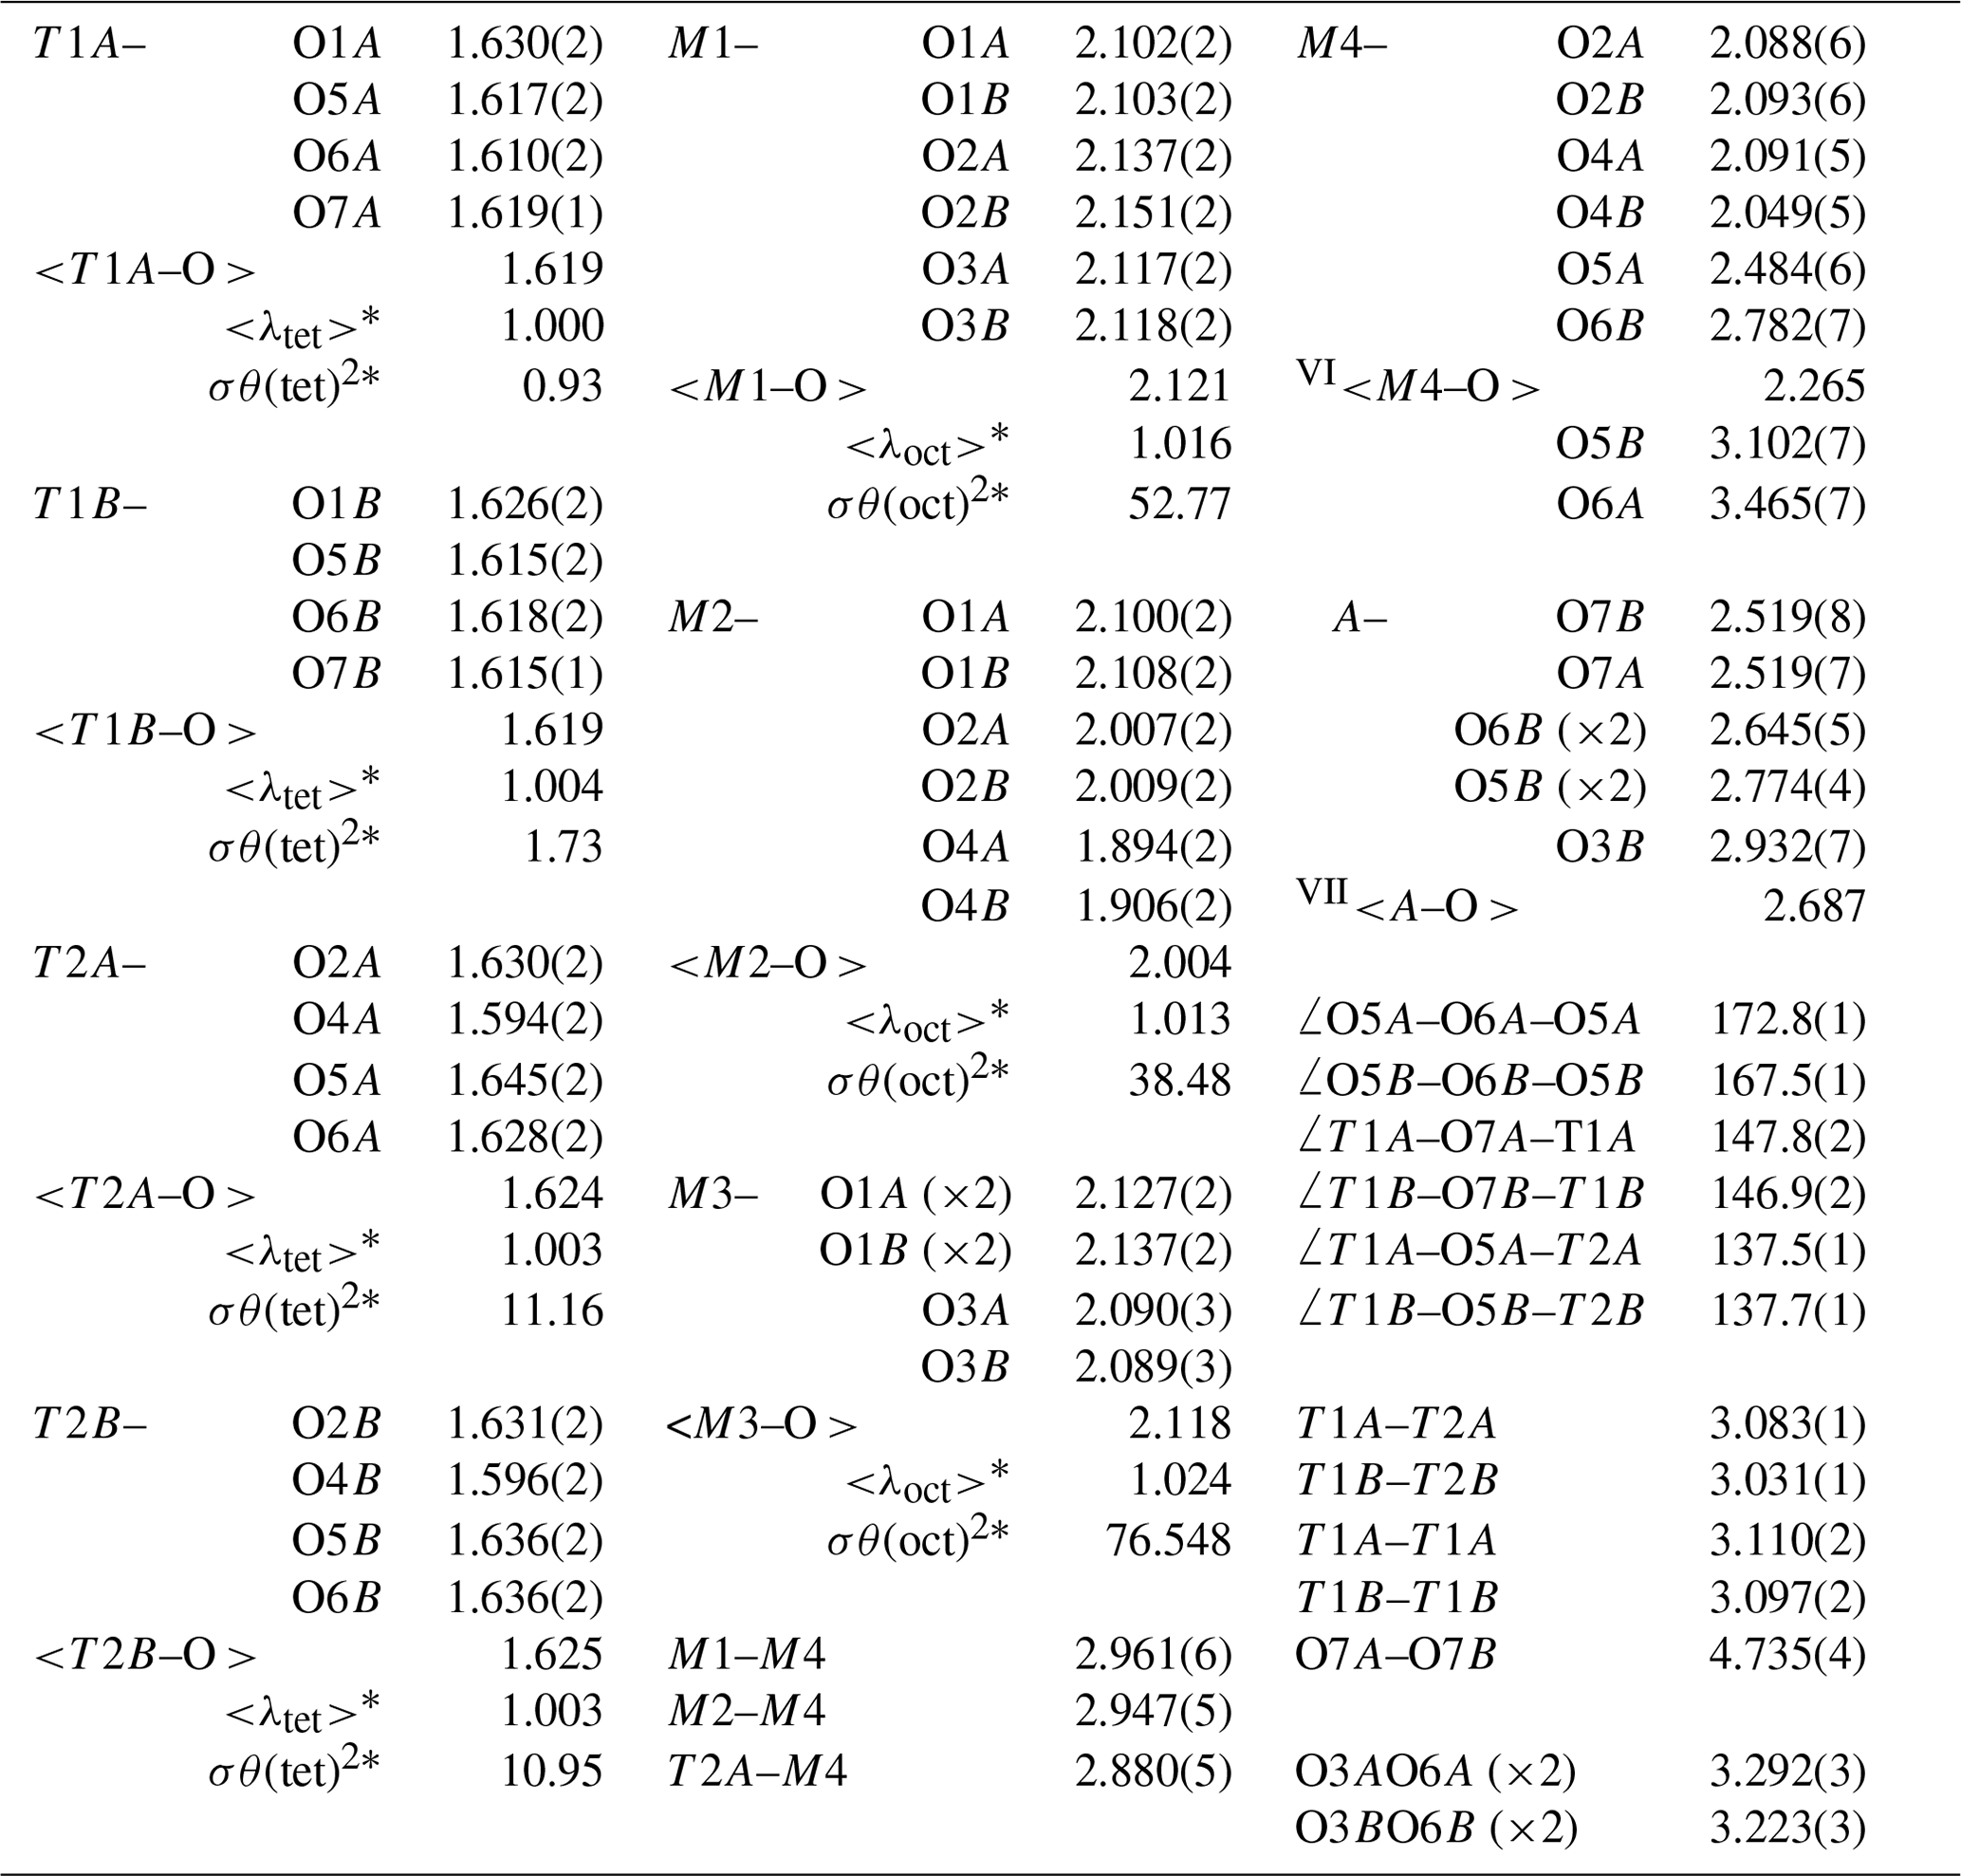
*<λ> and σθ2 are bond-length distortion and angle variance, respectively (Robinson et al., 1971).
Table 8Bond-valence analysis (v.u.) of ferro-ferri-holmquistite weighted on the refined site occupancies*.

* The A site was not considered due to its very low Na concentration. In the case that the identical bonds bind to the same cation/anion, the number with the arrow (↓ for anion and → for cation) was added.
Table 9List of orthorhombic lithium amphiboles*.
* All T sites are occupied by Si.
6.1 Cation distribution at the M1–M4 sites and structural variation
The structural formula of ferro-ferri-holmquistite is ANa0.062M4 (Li1.952Na0.048)Σ2.000M1(FeMg0.230)Σ2.000M2(FeFeAl0.452)Σ2.000M3(FeMg0.109)Σ1.000TSi8O22(OH)2 (Z=4).
According to the structural refinement, the M4 site is occupied by Li with a minor amount of Na, Li0.976(8)Na0.024 (Table 6), in good agreement with the chemical analysis (Table 1). In the case of monoclinic Li-bearing amphiboles such as clino-ferro-ferri-holmquistite () and ferro-ferri-pedrizite () studied by Oberti et al. (2003), the Li ions occur at the M(4) and M(3) sites. In contrast, Li is restricted to M4 in our orthorhombic structure crystal. Hawthorne and Oberti (2007) found no significant correlation between <M4–O > and the mean ionic radius of the constituent cations at M4, and they pointed out the strong correlation between <M4–O > and the grand mean constituent-cation radius of ions occupying the site M1, M2 and M3, in the Pnma amphiboles. Similar behaviors are also confirmed in holmquistites.
In our crystal structure, the M2O6 octahedron is smaller than the M1O6 and M3O6 octahedra. In holmquistite and ferro-holmquistite, Al3+ (VIAl 0.535 Å in Shannon, 1976) dominates the M2 site, whereas the larger divalent cations such as Mg (VIMg 0.72 Å) and Fe2+ (VIFe 0.78 Å) occupy the M1 and M3 sites (Cámara and Oberti, 2005, their Table 8). In our specimen, all Fe3+ (VIFe 0.645 Å) ions are assigned to the M2 site. As shown in Fig. 4a, the <M2–O > distance in ferro-ferri-holmquistite is much longer than that in holmquistite and ferro-holmquistite, 1.924–1.962 Å (Cámara and Oberti, 2005; Walter et al., 1989; Irusteta and Whittacker, 1975). In this study, the Fe2+ and Fe3+ ratio at M2 was estimated using the mean bond-length–aggregate-cation–radius relation, <M2–O , where r represents mean ionic radius of M2, proposed by Cámara and Oberti (2005). Accordingly, the site occupancy is FeFeAl0.226 (Table 6). The refined Al occupancy, 0.452 apfu (), at M2 may include a small amount of Mg due to their similar X-ray scattering factors. Based on the site occupancies in Table 6, the sum of Mg at the M1 and M3 sites is 0.339 apfu (). Considering the range of Mg content, 0.06–0.38 apfu (Table 1), the presence of Mg at the M2 site seems to be negligible. In addition, the occupancy based on the charge neutrality is FeFeAl0.226. In both cases, the dominant cation at M2 is Fe3+. The <M2–O > distance increases with the increasing mean ionic radius of the constituent cations at M2, <rM2 > (Fig. 4a). Both bond-length distortion, <λ oct >, and octahedral angular variance, (oct), of the M2O6 octahedron are greater than those of holmquistite and ferro-holmquistite (Cámara and Oberti, 2005; Walter et al., 1989; Irusteta and Whittacker, 1975) (Fig. 5a and b). The lengthening of M2–O1A and M2–O1B distances is slightly more pronounced than that of the others. Such anisotropic elongation of M2–Oi increases the <λ oct > value (Fig. 5a). Furthermore, the elongation of M2–O1A and M2–O1B distances reduces the O1A–M2–O1B angle (78.67∘ in ferro-ferri-holmquistite), enlarging the angular variance of the M2O6 octahedron (Fig. 5b). Cámara and Oberti (2005) reported that the short M2–O4A and M2–O4B distances were caused by the strongly underbonded oxygen at O4 due to the small Li+ ion at M4. The underbonded oxygen atoms at O4A and O4B are also confirmed in this study, and their bond valences are 1.92 and 1.91 valence units, respectively (Table 8).
The refined occupancies at M1 and M3 are FeMg0.115 and FeMg0.109, respectively (Table 6). The <M1–O > and <M3–O > distances are 2.121 and 2.118 Å, respectively (Table 7). They are much larger than those of previously reported holmquistite and ferro-holmquistite (Cámara and Oberti, 2005; Walter et al., 1989; Irusteta and Whittacker, 1975) caused by the high Fe2+ contents (Fig. 4b and c). In holmquistite-group minerals, <M1–O > tends to be shorter, whereas <M3–O > tends to be longer than the expected values predicted from functions for Pnma amphiboles (shown as dotted lines in Fig. 4b and c; Hawthorne et al., 2008). The expansion of the M1O6 octahedra is isotropic, whereas that of M3O6 is anisotropic due to the pronounced increase in the M3–O1A and M3–O1B distances. Such M3–Oi variations support the strong elongation of the M3O6 octahedron along the b axis suggested by Cámara and Oberti (2005).
The T1 tetrahedra tend to be smaller and more regular than the T2 tetrahedra (Table 7), consistent with previous studies (Cámara and Oberti, 2005; Walter et al., 1989; Irusteta and Whittacker, 1975). The grand <T–O > distance, <<T–O >>, is 1.622 Å (Table 7). According to the function <<T–O >>= 1.6214(8) + 0.0171(6) Å ×IVAl, given by Schindler et al. (2008) for the Pnma amphiboles of the anthophyllite-gedrite series, the studied ferro-ferri-holmquistite is free of IVAl. It is supported by the chemical composition (Table 1). The O5–O6–O5 angle is an index of the stretching of the TO4 chain along the c axis. In the A chain consisting of T1A and T2A tetrahedra (Fig. 3), the angle of 172.8∘ is larger than that of 167.5∘ in the B chain consisting of T1B and T2B tetrahedra. Although this trend conforms with the aforementioned studies, the angles obtained in this study are significantly larger. It indicates that the expansion of octahedra due to the high Fe content causes the TO4 chain to stretch. It is known that holmquistite has the shortest T1–T2 (short) distances (2.999–3.023 Å) among orthorhombic amphiboles (Cámara and Oberti, 2005). The T1A–T2A and T1B–T2B distances in ferro-ferri-holmquistite are obviously longer, 3.083 and 3.031 Å, respectively, than those in other holmquistites. The latter distances are close to those in anthophyllite, 3.045 and 3.048 Å, respectively (Walitzi et al., 1989). The variation of T1A–O5A–T2A and T1B–O5B–T2B angles with the elongation of T1A–T2A and T1B–T2B is significant, showing a good correlation with <rM2> (Fig. 6). In contrast, the T1–T1 distances are similar to those in holmquistite and ferro-holmquistite (Cámara and Oberti, 2005; Walter et al., 1989; Irusteta and Whittacker, 1975).
As shown in Fig. 7, the unit-cell parameters and total Fe content are positively correlated. The lengthened a and b axes reflect the thickness and lateral extension of the octahedral layer, respectively. The only moderately increased c axis can be explained by the rather rigid TO4 double chains running along the c axis. In particular, among three octahedral sites, the M2O6 octahedron is most effective for the variations of the unit-cell parameters.
Compositional and structural restrictions of holmquistite were discussed by Cámara and Oberti (2005). In holmquistite, the M1, M2 and M3 octahedra are predominantly occupied by the smallest possible divalent and trivalent octahedrally coordinated cations, MgM2AlMg, resulting in a very compact structure. The substitution of Fe2+ for Mg at M1 and M3 enlarges <M1–O > and <M3–O >. The <M2–O > distance increases with Fe3+ (∼34 % in Cámara and Oberti, 2005) at M2 (Fig. 4). They mentioned that the samples with high Fe3+ contents (and thus with long M2–O distances) were poor in Fe2+ (and thus have relative short M1–O and M3–O distances). This was interpreted as a structural limitation, leaving the overall dimension of the octahedral strip rather uninfluenced. Despite the < Mi–O > distances varying with the cation distribution at each site (Fig. 4), their behavior seems not to be directly reflected in the unit-cell parameters (Fig. 7). In fact, the unit-cell parameters as a function of total Fe are scattered. Cámara and Oberti (2005) showed that the distortion of the M1O6 and M3O6 octahedra increases as a function of the Fe2+ content in order to keep the octahedral volume constant. Following their interpretation, the distortion of the M1O6 and M3O6 octahedra of the ferro-ferri-holmquistite is expected to be much greater than the others, but the <λ oct > and (oct) values are even smaller than those obtained from the previously reported holmquistite and ferro-holmquistite structures (Table 7; previous studies: <λ oct >= 1.018–1.021 for M1 and 1.023–1.029 for M3, and (oct) = 58.13–70.11 for M1 and 74.19–94.9 for M3). Such small <λ oct > and (oct) values of the M1 and M3 sites are considered to be mainly governed by the M2O6 expansion. The cation distributions at M1 and M3 are not correlated with the distortion parameters of each polyhedron. In the crystal structure of ferro-ferri-holmquistite, the values of <λ oct > and (oct) of M1 and M3 are relatively small, but those at M2 are large. Such a restriction for M1 and M3 derived from adjacent M2 might reduce the influence on the unit-cell parameters in holmquistite structures. It is consistent with the argument that M2O6 is the most influential octahedron on the unit-cell parameters. The chemical and structural characteristics of our ferro-ferri-holmquistite do not conform with the argument by Cámara and Oberti (2005) that the specimen with high Fe3+ at M2 has low Fe2+ at M1 and M3. However, we agree that the structural restriction is active in terms that the variation of M1 and M3 is governed by M2.
6.2 Hydrogen bonding
Two crystallographically independent OH groups hosted by the oxygen atoms at O3A and O3B, in Pnma amphiboles, show two OH-stretching bands having approximately equal intensity (Hawthorne, 1983). The OH-stretching FT-IR spectrum of the ferro-ferri-holmquistite is shown in Fig. 8. Three peaks can be identified, centered at 3614, 3631 and 3644 cm−1, respectively. The full width at half maximum heights are roughly equal for all components, 10.1–10.4 cm−1. Based on the OH-stretching IR bands in orthorhombic Pnma amphiboles such as holmquistite and the anthophyllite-gedrite series (Ishida and Hawthorne, 2003; Kloprogge et al., 2001; Law, 1981, 1982; Law and Whittaker, 1981; Burns and Law, 1970; Wilkins et al., 1970), the four main bands, labeled A, B, C and D, are assigned to local configurations M1M1M3–O3H–A, where A = (□, Na) and M1M1M3 = MgMgMg, MgMgFe (including MgFeMg and FeMgMg), MgFeFe (including FeMgFe and FeFeMg) and FeFeFe for A, B, C and D, respectively. Following Ishida and Hawthorne (2003), the four bands, A, B, C and D, in holmquistite are located at 3658–3662, 3643–3648, 3628–3629 and 3611–3614 cm−1, respectively. The aforementioned three IR bands observed in our ferro-ferri-holmquistite are assigned to D, C and B bands, respectively. It makes sense that the D band derived from the configuration of M1M1M3 = FeFeFe is the strongest among the three bands in the Fe-enriched species.
The CIF file can be obtained from the corresponding author.
MN designed the project. TI performed the field observations and sample collection. TK performed the observations of optical properties. MN performed and validated the analysis by EPMA, X-ray powder diffraction and X-ray single-crystal diffraction. JK and QC performed the analysis by LA-ICP-MS. TM collected X-ray single-crystal diffraction data. MN and IT discussed all results, and MN wrote the paper.
The contact author has declared that none of the authors has any competing interests.
Publisher’s note: Copernicus Publications remains neutral with regard to jurisdictional claims in published maps and institutional affiliations.
We are grateful to the Educational Board of Ehime Prefecture and Kamishima-cho for permission to collect samples. Special thanks are extended to Yuzuru Maki (Rigaku Corporation) for his arrangement to use the RIGAKU HyPix-6000HE, Yoji Morifuku (the Center for Instrumental Analysis, Yamaguchi University) for his technical assistance and Thomas Armbruster for his critical reading of the manuscript. We also thank the chief editor, Sergey Krivovichev, as well as Frank Hawthorne and an anonymous reviewer. One of the authors (Mariko Nagashima) gratefully acknowledges the financial support of Grants-in-Aid for Scientific Research from the Japan Society for the Promotion of Science, nos. 18K03782 and 20KK0307.
This research has been supported by the Japan Society for the Promotion of Science (grant nos. 18K03782, 20KK0307).
This paper was edited by Sergey Krivovichev and reviewed by Frank Hawthorne and one anonymous referee.
Andrade, M. B., Doell, D., Downs, R., and Yang, H.: Redetermination of katayamalite, KLi3Ca7Ti2(SiO3)12(OH)2, Acta Cryst., E69, i41, https://doi.org/10.1107/S1600536813016620, 2013.
Armbruster, T. and Oberhänsli, R.: Crystal chemistry of double-ring silicates: structures of sugilite and brannockite, Amer. Miner., 73, 595–600, 1988.
Brown, I. D. and Altermatt, D.: Bond-valence parameters obtained from a systematic analysis of the inorganic crystal structure database, Acta Cryst., B41, 244–247, https://doi.org/10.1107/S0108768185002063, 1985.
Burns, R. G. and Law, A. D.: Hydroxyl stretching frequencies in the infrared spectra of anthophyllites and gedrites, Nature, 226, 73–75, https://doi.org/10.1038/226073a0, 1970.
Cámara, F. and Oberti. R.: The crystal-chemistry of holmquistites: Ferroholmquistite from Greenbushes (Western Australia) and hints for compositional constraints in BLi amphiboles, Amer. Miner., 90, 1167–1176, https://doi.org/10.2138/am.2005.1793, 2005.
Danhara, T., Yamashita, T., Iwano, H., and Kasuya, M.: An improved system for measuring refractive index using the thermal immersion method, Quatern. Int., 13/14, 89–91, https://doi.org/10.1016/1040-6182(92)90013-R, 1992.
Franks, F.: Water: A comprehensive treatise, vol. 2, Plenum, New York, 684 p., ISBN 978-0306371820, 1973.
Gagné, O. C. and Hawthorne, F. C.: Comprehensive derivation of bond-valence parameters for ion pairs involving oxygen, Acta Cryst., B71, 562–578, https://doi.org/10.1107/S2052520615016297, 2015.
Hawthorne, F. C.: The crystal chemistry of the amphiboles, Can. Miner., 21, 173–480, 1983.
Hawthorne, F. C. and Oberti, R.: Amphiboles: Crystal chemistry, in: Amphiboles: Crystal chemistry, occurrence and health issues, edited by: Hawthorne, F. C., Oberti, R., Della Ventura, G., and Mottana, A., Reviews in Mineralogy & Geochemistry 67, Mineralogical Society of America and Geochemical Society, Washington D.C., 1–54, https://doi.org/10.2138/rmg.2007.67.1, 2007.
Hawthorne, F. C., Schindler, M., Abdu, Y., Sokolova, E., Evans, B. W., and Ishida, K.: The crystal chemistry of the gedrite-group amphiboles. II. Stereochemistry and chemical relations, Miner. Mag., 72, 731–745, https://doi.org/10.1180/minmag.2008.072.3.731, 2008.
Hawthorne, F. C., Oberti, R., Harlow, G. E., Maresch, W. V., Martin, R. F., Schumacher, J. C., and Welch, M. D.: Nomenclature of the amphibole supergroup, Amer. Miner., 97, 2031–2048, https://doi.org/10.2138/am.2012.4276, 2012.
Imaoka, T. and Nagashima, M.: Mode of occurrence, crystal chemistry and origin of Li minerals of metasomatic albitite: Murakamiite from Iwagi Islet, SW Japan, J. Geogr., 131, 235–256, https://doi.org/10.5026/jgeography.131.235, 2022(in Japanese with English abstract).
Imaoka, T., Nagashima, M., Kano, T., Kimura, J.-I., Chang, Q., and Fukuda, C.: Murakamiite, LiCa2Si3O8(OH), a Li-analogue of pectolite, from the Iwagi Islet, southwest Japan. Eur. J. Miner., 29, 1045–1053, https://doi.org/10.1127/ejm/2017/0029-2675, 2017.
Imaoka, T., Akita, S., and Nagashima, M.: Dalyite (K2ZrSi6O15) and zektzerite (LiNaZrSi6O15) in aegirine-bearing albitite from Iwagi Islet, SW Japan, J. Geogr., 130, 369–378, https://doi.org/10.5026/jgeography.130.369, 2021a.
Imaoka, T., Kimura, J.-I., Chang, Q., Ishikawa, T., Nagashima, M., and Takeshima, N.: Chemical and lithium isotope characteristics of murakamiite and Li-rich pectolite from Iwagi Islet, Southwest Japan, J. Miner. Petrol. Sci., 116, 9–25, https://doi.org/10.2465/jmps.200721, 2021b.
Irusteta, M. C. and Whittacker, E. J. W.: A three-dimensional refinement of the structure of holmquistite, Acta Cryst., B31, 145–150, https://doi.org/10.1107/S0567740875002269, 1975.
Ishida, K. and Hawthorne, F.C.: Fine structure in the infrared OH-stretching bands of holmquistite and anthophyllite, Phys. Chem. Miner., 30, 330–336, https://doi.org/10.1007/s00269-003-0311-9, 2003.
Izumi, F. and Momma, K.: Three-dimensional visualization in powder diffraction, Solid State Phen., 130, 15–20, https://doi.org/10.4028/www.scientific.net/SSP.130.15, 2007.
Jones, M. P. and Fleming, M. G.: Identification of mineral grains, Elsevier Publishing Company, Amsterdam, 102 p., ISBN 978-0444403247, 1965.
Kato, T., Miúra, Y., and Murakami, N.: The crystal structure of sugilite, Miner. J., 8, 184–192, https://doi.org/10.2465/minerj.8.184, 1976.
Kimura, J.-I. and Chang, Q.: Origin of the suppressed matrix effect for improved analytical performance in determination of major and trace elements in anhydrous silicate samples using 200 nm femtosecond laser ablation sector-field inductively coupled plasma mass spectrometry, J. Anal. Atom. Spectr., 27, 1549–1559, https://doi.org/10.1039/C2JA10344C, 2012.
Klopprogge, J. T., Visser, D., Case, M. H., and Frost, R. L.: Infrared and Raman spectroscopy of holmquistite, Li2(Mg,Fe2+)3(Al,Fe3+)2(Si,Al)8O22(OH)2, J. Mater. Sci. Let., 20, 1497–1499, https://doi.org/10.1023/A:1017926529980, 2001.
Law, A. D.: Studies of the orthoamphiboles. II. Hydroxyl spectra of anthophyllites, Bull. Minéral., 104, 423–430, 1981.
Law, A. D.: Studies of the orthoamphiboles. III. Hydroxyl spectra of gedrites, Miner. Mag., 45, 63–71, https://doi.org/10.1180/minmag.1982.045.337.07, 1982.
Law, A. D. and Whittaker, E. J. W.: Studies of the orthoamphiboles. I. The Mössbauer and infrared spectra of holmquistite, Bull. Minéral., 104, 381–386, 1981.
Leake, B. E., Woolley, A. R., Birch. W., Burke, E. A. J., Ferraris, G., Grice, J. D., Hawthorne, F. C., Kisch, H. J., Krivovichev, V. G., Schumacher, J. C., Stephenson, N. C. N., and Whittaker, E. J. W.: Nomenclature of amphiboles: additions and revisions to the International Mineralogical Association's 1997 recommendations, Can. Miner., 41, 1355–1362, https://doi.org/10.2113/gscanmin.41.6.1355, 2003.
Mandarino, J. A.: The Gladstone-Dale relationship: part IV. The compatibility concept and its application, Can. Miner., 19, 441–450, 1981.
Matsumoto, T., Yamano, Y., Sato, T., Ferrara, J. D., White, F. J., and Meyer, M.: “What is this?” a structure analysis tool for rapid and automated solution of small molecule structures, J. Chem. Cryst., 51, 438–450, https://doi.org/10.1007/s10870-020-00867-w, 2021.
Momma, K. and Izumi, F.: VESTA3 for three-dimensional visualization of crystal, volumetric and morphology data, J. Appl. Cryst., 44, 1257–1276, https://doi.org/10.1107/S0021889811038970, 2011.
Murakami, N.: Paragenetic relations of main constituent minerals in metasomatic syenitic rocks in Japan, ISSN 1883-0765, Print ISSN 0021-4825, J. Japan. Assoc. Mineral. Petrol. Econ. Geol., 1, 261–281, 1976 (in Japanese).
Murakami, N., Kato, T., Miura, Y., and Hirowatari, F.: Sugilite, a new silicate mineral from Iwagi Islet, Southwest Japan, Miner. J., 8, 110–121, https://doi.org/10.2465/minerj.8.110, 1976.
Murakami, N., Kato, T., and Hirowatari, F.: Katayamalite, a new Ca-Li-Ti silicate mineral from Iwagi Islet, Southwest Japan, Miner. J., 11, 261–268, https://doi.org/10.2465/minerj.11.261, 1983.
Nagashima, M., Imaoka, T., Fukuda, C., and Pettke, T.: Relationship between cation substitution and hydrogen-bond system in hydrous pyroxenoids with three-periodic single-chain of SiO4 tetrahedra: pectolite, murakamiite, marshallsussmanite, serandite and tanohataite, Eur. J. Miner., 30, 451–463, https://doi.org/10.1127/ejm/2018/0030-2744, 2018.
Oberti, R., Cámara, F., Caballero, J. M., and Ottolini, L.: Sodic-ferri-ferropedrizite and ferri-clinoferroholmquisite: mineral data and degree of order of the A-site cations in Li-rich amphiboles, Can. Miner. 41, 1345–1354, https://doi.org/10.2113/gscanmin.41.6.1345, 2003.
Osann, A.: Über Holmquistit, einen Lithionglaukophan von der Insel Utö. Sitzungsber. Heidelb. Akad. Wiss., Math.-nat. Kl. Abt A Math.-phys. Wiss., 23, 1–16, 1913 (in German).
Robinson, K., Gibbs, G. V., and Ribbe, P. H.: Quadratic elongation: a quantitative measure of distortion in coordination polyhedra, Science, 172, 567–570, https://doi.org/10.1126/science.172.3983.567, 1971.
Schindler, M., Sokolova, E., Abdu, Y., Hawthorne, F. C., Evans, B. W., and Ishida, K.: The crystal chemistry of the gedrite-group amphiboles. I. Crystal structure and site populations, Miner. Mag., 72, 703–730, https://doi.org/10.1180/minmag.2008.072.3.703, 2008.
Shannon, R. D.: Revised effective ionic radii and systematic studies of interatomic distances in halides and chalcogenides, Acta Cryst., A32, 751–766, https://doi.org/10.1107/S0567739476001551, 1976.
Sheldrick, G. M.: Crystal structure refinement with SHELX, Acta Cryst., C71, 3–8, https://doi.org/10.1107/S2053229614024218, 2015.
Walitzi, E. M., Walter, F., and Ettinger, K.: Verfeinerung der Kristallstruktur von Anthophyllit vom Ochsenkogel/Gleinalpe, Osterreich, Z. Krist., 188, 237–244, https://doi.org/10.1524/zkri.1989.188.14.237, 1989 (in German).
Walter, F., Walitzi, E. M., and Mereiter, K.: Verfeinerung der Kristallstruktur von Holmquistit vom Brandrücken/Weinebene, Koralpe, Osterreich, Z. Krist., 188, 95–101, https://doi.org/10.1524/zkri.1989.188.14.95, 1989 (in German).
Whittaker, E. J. M.: The structure of the orthorhombic amphibole holmquistite, Acta Cryst., B25, 394–397, https://doi.org/10.1107/S0567740869002299, 1969.
Wilkins, R. W. T., Davidson, L. R., and Ross, J. R.: Occurrence and infrared spectra of holmquistite and hornblende from Mt. Marion, near Kalgoorlie, Western Australia, Contr. Miner. Petrol., 28, 280–287, https://doi.org/10.1007/BF00388950, 1970.