the Creative Commons Attribution 4.0 License.
the Creative Commons Attribution 4.0 License.
 | 10 May 2022
Automatic element and mineral detection in thin sections using hyperspectral transmittance imaging microscopy (HyperTIM)
Helge L. C. Daempfling
Christian Mielke
Nicole Koellner
Melanie Lorenz
Christian Rogass
Uwe Altenberger
Daniel E. Harlov
Michael Knoper
In this study we present a novel method for the automatic detection of minerals and elements using hyperspectral transmittance imaging microscopy measurements of complete thin sections (HyperTIM). This is accomplished by using a hyperspectral camera system that operates in the visible and near-infrared (VNIR) range with a specifically designed sample holder, scanning setup, and a microscope lens. We utilize this method on a monazite ore thin section from Steenkampskraal (South Africa), which we analyzed for the rare earth element (REE)-bearing mineral monazite ((Ce,Nd,La)PO4), with high concentrations of Nd. The transmittance analyses with the hyperspectral VNIR camera can be used to identify REE minerals and Nd in thin sections. We propose a three-point band depth index, the Nd feature depth index (NdFD), and its related product the Nd band depth index (NdBDI), which enables automatic mineral detection and classification for the Nd-bearing monazites in thin sections. In combination with the average concentration of the relative Nd content, it permits a destruction-free, total concentration calculation for Nd across the entire thin section.
- Article
(5819 KB) - Full-text XML
- BibTeX
- EndNote


The detection and classification of minerals and elements are crucial in mineral exploration and outcrop characterization. They are the main drivers of past and recent scientific research in spectroscopy and imaging spectroscopy (Hunt, 1977; Boesche et al., 2015). Hyperspectral imaging cameras have been successfully used to detect minerals and elements in outcrops, rock samples, and drill cores using reflectance measurements (van der Meer et al., 2012). Whereas hyperspectral imaging is widely used for reflectance measurements in the geosciences, transmittance measurements using imaging spectrometers are mostly applied in biology, agricultural, and food sciences. Examples of hyperspectral imaging transmittance applications include imaging transmittance measurements of leaf traits (Bergsträsser et al., 2015), plant–pathogen interaction (Thomas et al., 2017), quality of blueberries (Leiva-Valenzuela et al., 2014), and insect damage in soybeans (Huang et al., 2013). In geosciences, hyperspectral transmittance measurements have been conducted using point spectrometers. Examples of transmittance measurements involving (non-imaging) point spectrometers include the measurement of thin sections and powdered minerals for evaluating the effects of mineral orientation using a Fourier transform infrared (FTIR) micro-spectrometer (Ekaterina and Veronique, 2009), as well as measurements of the transmittance, reflectance, and emission of meteorite samples over a spectral range from the ultra-violet (UV) to the infrared (IR) using two FTIR spectrometers (Maturilli et al., 2016).
This study presents and discusses a new method for the detection of minerals and chemical elements involving hyperspectral imaging transmittance measurements of complete thin sections from rock samples. The measurements are performed by using a hyperspectral push broom imaging camera that operates in the visible and near-infrared (VNIR). It is designed for a broad variety of applications in the laboratory. The camera is equipped with a microscope lens for the use in the laboratory environment. A special measurement setup to mount the thin sections for transmittance measurements was constructed. The method was developed to analyze several thin sections containing Nd-bearing monazites from various regions including Norway, Sweden, South Africa, and Namibia.
In this study we present an application of this method to a polished thin section from a monazite-rich sample, collected from the Steenkampskraal monazite mine in South Africa. The thin section was additionally examined using a petrographic microscope and analyzed using an electron microprobe in order to provide a geochemical reference frame for comparison with our analytical results. Using this sample as an example, we present the mineral and element detection capabilities of the hyperspectral imaging camera when measuring transmittance in the VNIR spectrum.
The Steenkampskraal monazite ore body is located ca. 70 km north of Vanhynsdorp in the Western Cape Province, South Africa. It represents one of the largest vein-type monazite–apatite–chalcopyrite–magnetite deposits in the Mesoproterozoic Bushmanland subprovince of the Namaqua-Natal Metamorphic Belt (e.g., Kilian, 2011; Basson et al., 2016). The ore body is lenticular-shaped, with an average thickness of about 0.5 m. Mesoproterozoic granite gneiss hosts the ore body, which is situated in a structural zone characterized by early ductile shearing and overprinted by later brittle deformation and faulting. The ore occurs as fine-grained massive lode that is exposed on the surface for about 400 m, with a known down-dip extension of 450 m. Preliminary U–Pb geochronological data on monazite suggest that formation of the Steenkampskraal monazite ore body occurred at 1046 ± 7.5 Ma (Knoper et al., unpublished data, cited by Basson et al., 2016). Mining of monazite for Th was active from 1952 to 1963. Detailed studies of the ore body have been made by Pike (1959), De Waal and Viljoen (1970), Andreoli et al. (1994, 2006), Basson et al. (2016), Read et al. (2002), Kilian (2011), Jones and Burnett (2013), and Jones and Hancox (2012). The ore body contains up to 55 % following Andreoli et al. (1994) and up to 80 vol % monazite with a total rare earth element (REE) concentration of ca. 45 wt % following Kilian (2011), with the light rare earth elements (LREEs) predominating. Highly fractionated P-rich immiscible liquids in a tectonically instable environment are suggested to form the deposit (Andreoli et al., 1994).
In order to perform the transmittance measurements, we used a HySpex VNIR 1600 hyperspectral imaging camera. The push broom line scanner utilizes a Kodak KAI-2020 CCD as the detector element, which is part of the Adimec1600m/D camera (Lenhard et al., 2015). It operates in the spectral range from 400 to 1000 nm with 160 bands and 1600 spatial pixels per line (Lenhard et al., 2015). The resulting hyperspectral images were analyzed with feature-fitting techniques, and then compared to petrographic microscope images and electron microprobe analyses (EMPAs).
3.1 Measurement setup
All analyses with the HySpex camera were conducted in the optical laboratory of the German Research Centre for Geosciences (GFZ) in Potsdam. The HySpex camera is mounted on an aluminum frame for translational measurements in the laboratory (Rogass et al., 2017) (Fig. 1, label 1). The frame supports a motorized sample tray (translation stage) that carries the samples (Fig. 1, label 7). The speed with which the translation stage moves and transports the samples through the field of view of the sensors depends on the integration time and the fore-optics of the fixed camera (Rogass et al., 2017). To measure transmittance with the HySpex camera a special sample holder was constructed (Fig. 1, label 3). The holder was painted in matte black to reduce reflection and to buffer and reduce the effects of specular reflection by the light source. The light from the lamp was reflected by a white reference panel with a spectrally known diffuse, Lambertian spectral reflectance standard: 95 % reflectance, SphereOptics SG3151 95 % A (Fig. 1, label 6). The lamp irradiates the white reference with a 45∘ angle through the open side of the sample holder (Fig. 1, label 5). The white reference diffusely reflects the light through the opening slit at the top of the sample holder where the thin section is mounted (Fig. 1, label 4). The HySpex camera is mantled in order to reduce the stray light from sources other than the opening slit of the sample holder. Black cellular rubber was used to darken the space between sample holder and camera as this material mainly absorbs light in the considered wavelength range (Fig. 1, label 2). Measurements with an epoxy-covered microscope slide were conducted in order to subtract the irradiation, reflected by the white reference plate and the absorption and transmittance features of the epoxy and glass of the microscope slides, from the spectrum of the rock thin sections. The integration time was calibrated from several test runs until a strong signal was acquired and oversaturated pixels were not present (Table 1). A high signal to noise ratio (SNR) mode was used to reduce noise in the collected spectra. It is embedded into the software of the HySpex data acquisition tool and determines how often a frame is repeatedly captured. These measurements are averaged to reduce the zero mean, white Gaussian noise in the measurements. Since the measurement time for each thin section is roughly multiplied by the number of measurements set at the high SNR setting, an optimum between signal quality and practical measurement time had to be found. A high SNR mode of 6, which resulted in a roughly 60 min overall measurement time, was chosen for the thin section with the given integration time shown in Table 1.
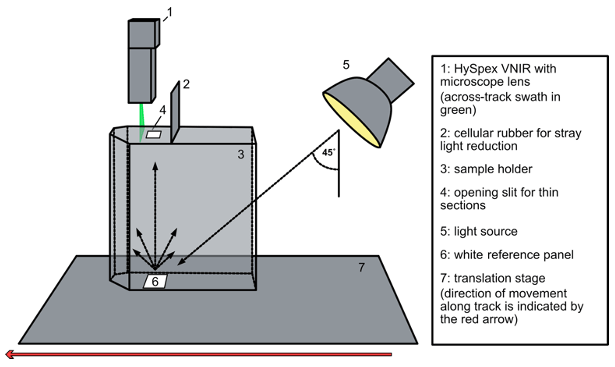
Figure 1The setup to perform the transmittance measurements. The HySpex VNIR-1600 camera was used for the measurements in this study.
Table 1Specifications of the HySpex VNIR-1600 camera (Lenhard et al., 2015) and the applied setting.

3.2 Data processing
First the raw image data with the “HySpex RAD” software was processed, rescaling the digital numbers (DNs) into radiance in accordance with the camera's radiometric profile (calibration is done by NEO yearly). The files were then spatially resized. The parts of the images not covering the thin sections (the black surface of the sample holder) are cropped to shrink the file size in order to speed up the following calculations and also save data storage space and memory. After the images have been cropped, the transmittance of the rock thin sections are isolated. Each pixel of the according image is divided by an averaged spectrum of the measured epoxy-coated reference slide. This spectrum includes that of the light source (white reference) so that the images are normalized and only the transmittance of the thin sections remains, ranging between 0 and 1.
3.3 Identification of minerals
For comparative data analysis, we fitted spectral reflectance library data to the obtained hyperspectral image data. The USGS Spectral Library version 7 (Kokaly et al., 2017) had to be spectrally resampled with respect to HySpex spectral bands using the spectral resampling tool embedded in ENVI. The spectral resampling tool in ENVI utilizes a Gaussian model of the spectral response functions (SRFs) for all HySpex bands, which is derived from former calibration measurements (Norsk Elektro Optikk, 2020). The spectral signatures of certain minerals and elements in Nd-bearing monazites are characterized by multiple absorption features in the VNIR range (Boesche et al., 2014). Absorption features can then be used to identify minerals in hyperspectral imaging spectroscopy (Boesche et al., 2014). The automatic identification and mapping of Nd-bearing monazite were implemented through the following steps. Three characteristic absorption features of Nd-bearing monazite for mineral identification and mapping were used: ∼ 580, ∼ 740, and ∼ 800 nm, following Boesche et al. (2014). The law of conservation of energy justifies using the position of the absorption features derived from reflectance spectra for transmittance measurements. The representative spectral absorption features of elements and minerals have the same position in measured transmittance spectra, given that they are not opaque. A three-point band depth index for each of the three main absorption features of Nd was used for detection and mapping.
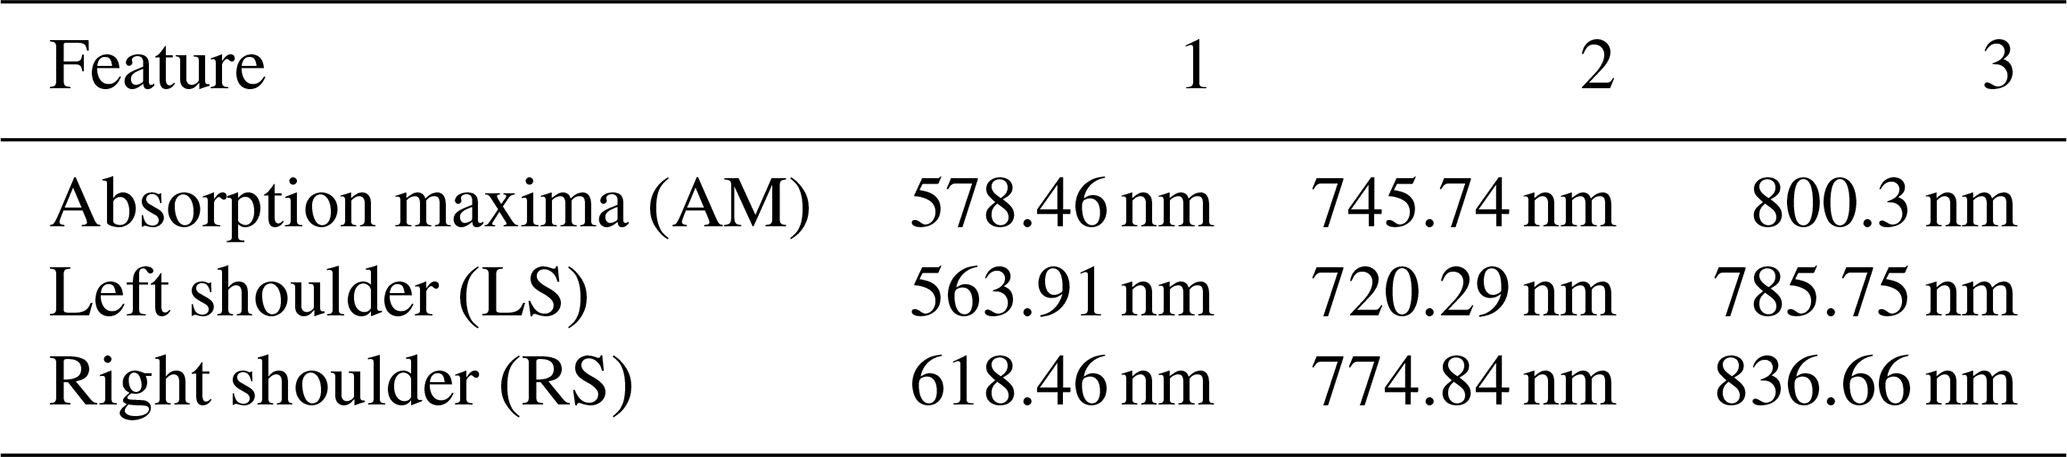
The Fe feature depth index (IFD) was adapted (Mielke et al., 2014) (Eq. 1) to the three features of the monazite-bound Nd (∼ 580, ∼ 740, ∼ 800 nm), resulting in the Nd feature depth index (NdFD), with the shoulders and maxima shown in Table 2. The NdFD is the difference between the transmittance (t) in the absorption maxima (t(AM)) of the specific feature (see Table 2) and the linearly interpolated transmittance value of the specific feature (tint(AM)) see Eq. (1) (adapted from Mielke et al., 2014). tint(AM) is calculated following Eq. (2), where t(LS) is the transmittance of the band closest to the position of the left shoulder of the feature (see Table 2), and t(RS) is the transmittance of the band closest to the position of the right shoulder of the feature (see Table 2). Equation (3) shows the application of Eqs. (1) and (2) for the first main absorption feature of Nd.
The NdFD was applied to each pixel of the hyperspectral image to highlight the monazite and Nd ((Nd)PO4) distribution in the thin section (see Sect. 4.2). The three bands in the resulting image represent the absorption depth of the three characteristic absorption features for Nd: NdFD 1: Band 1 at ∼ 580 nm; NdFD 2: Band 2 at ∼ 740 nm; and NdFD 3: Band 3 at ∼ 800 nm. The resulting three bands are multiplied by each other to create the Nd band depth index (NdBDI) (see Eq. 4). The NdBDI image is a single-band greyscale image used for classification mapping and can be compared, for example, with SEM/BSE (scanning electron microscope/backscattered electron) results.
The classification map is then created using the NdBDI greyscale value image. The resulting monazite map displays Nd-bearing monazite as red pixels, while the rest (no detection of Nd) is displayed as black pixels. The red pixels of the monazite classification map can also be overlaid on a true color RGB image of the thin section to mark the monazites. The pixel-wise classification of Nd-bearing monazite and the knowledge of the relative Nd content (wt %) of the monazites (either content estimate by a database or more exact by EMPA) allows for the free determination of the total weight content (W) of Nd in the thin section by the calculation shown in Eq. (5).
where weight content of the element is W(Element) (µg), pixel size is A(Pixel) (µm2), thickness of the thin section is T (µm), number of pixels classified as mineral is N(Mineral), bulk density (electron density) of classified mineral is ρ(Mineral) (µg µm−3), and relative element concentration in the mineral is C(Element) (0–1).
Table 2The absorption maxima and left and right shoulders of the three absorption features of monazite-bound neodymium used for each NdFD calculation.
The results from the mineral chemical analysis are compared to the results from the processed hyperspectral images of the thin sections for method assessment. This includes the analysis by a petrographic microscope and EMPA. All calculations were conducted using the programming language Python 3. The three-point band depth index, the IFD following Mielke et al. (2014), and the automatic calculations can be adapted for any element or mineral that has characteristic absorption bands.
EMPA measurements
A profile across the main monazite bands of thin section STK 115c was mapped on a JEOL JXA-8200 electron microprobe at the University of Potsdam. The elemental profile map was generated with an acceleration voltage of 20 kV, a beam current of 20 nA, a pixel size of 2, and a dwell time of 20 s. The conditions used for additional analyses of monazite grains along the profile were 20 kV acceleration voltage, 40 nA beam current, and a beam size of 2 µm. Counting times were between 10 to 25 s on the peak for major elements and 50 s for REE and other trace elements. Spectral lines, standards, and data reduction were applied following Lorenz et al. (2019). The following spectral lines and mainly Smithsonian natural mineral standards were used: fluorapatite (P Kα, Ca Kα), wollastonite (Si Kα), YPO4 (Y Lα), LaPO4 (La Lα), CePO4 (Ce Lα), PrPO4 (Pr Lβ), NdPO4 (Nd Lβ), SmPO4 (Sm Lβ), EuPO4 (Eu Lα), GdPO4 (Gd Lα), DyPO4 (Dy Lβ), HoPO4 (Ho Lβ), ErPO4 (Er Lβ), YbPO4 (Yb Lα), LuPO4 (Lu Lα), monazite (Th Mα), and crocoite (Pb Mβ). The EMPA data were reduced using the PRZ-XXP (Phi-Rho-Z method) correction routine.
4.1 Microscope and electron microprobe results
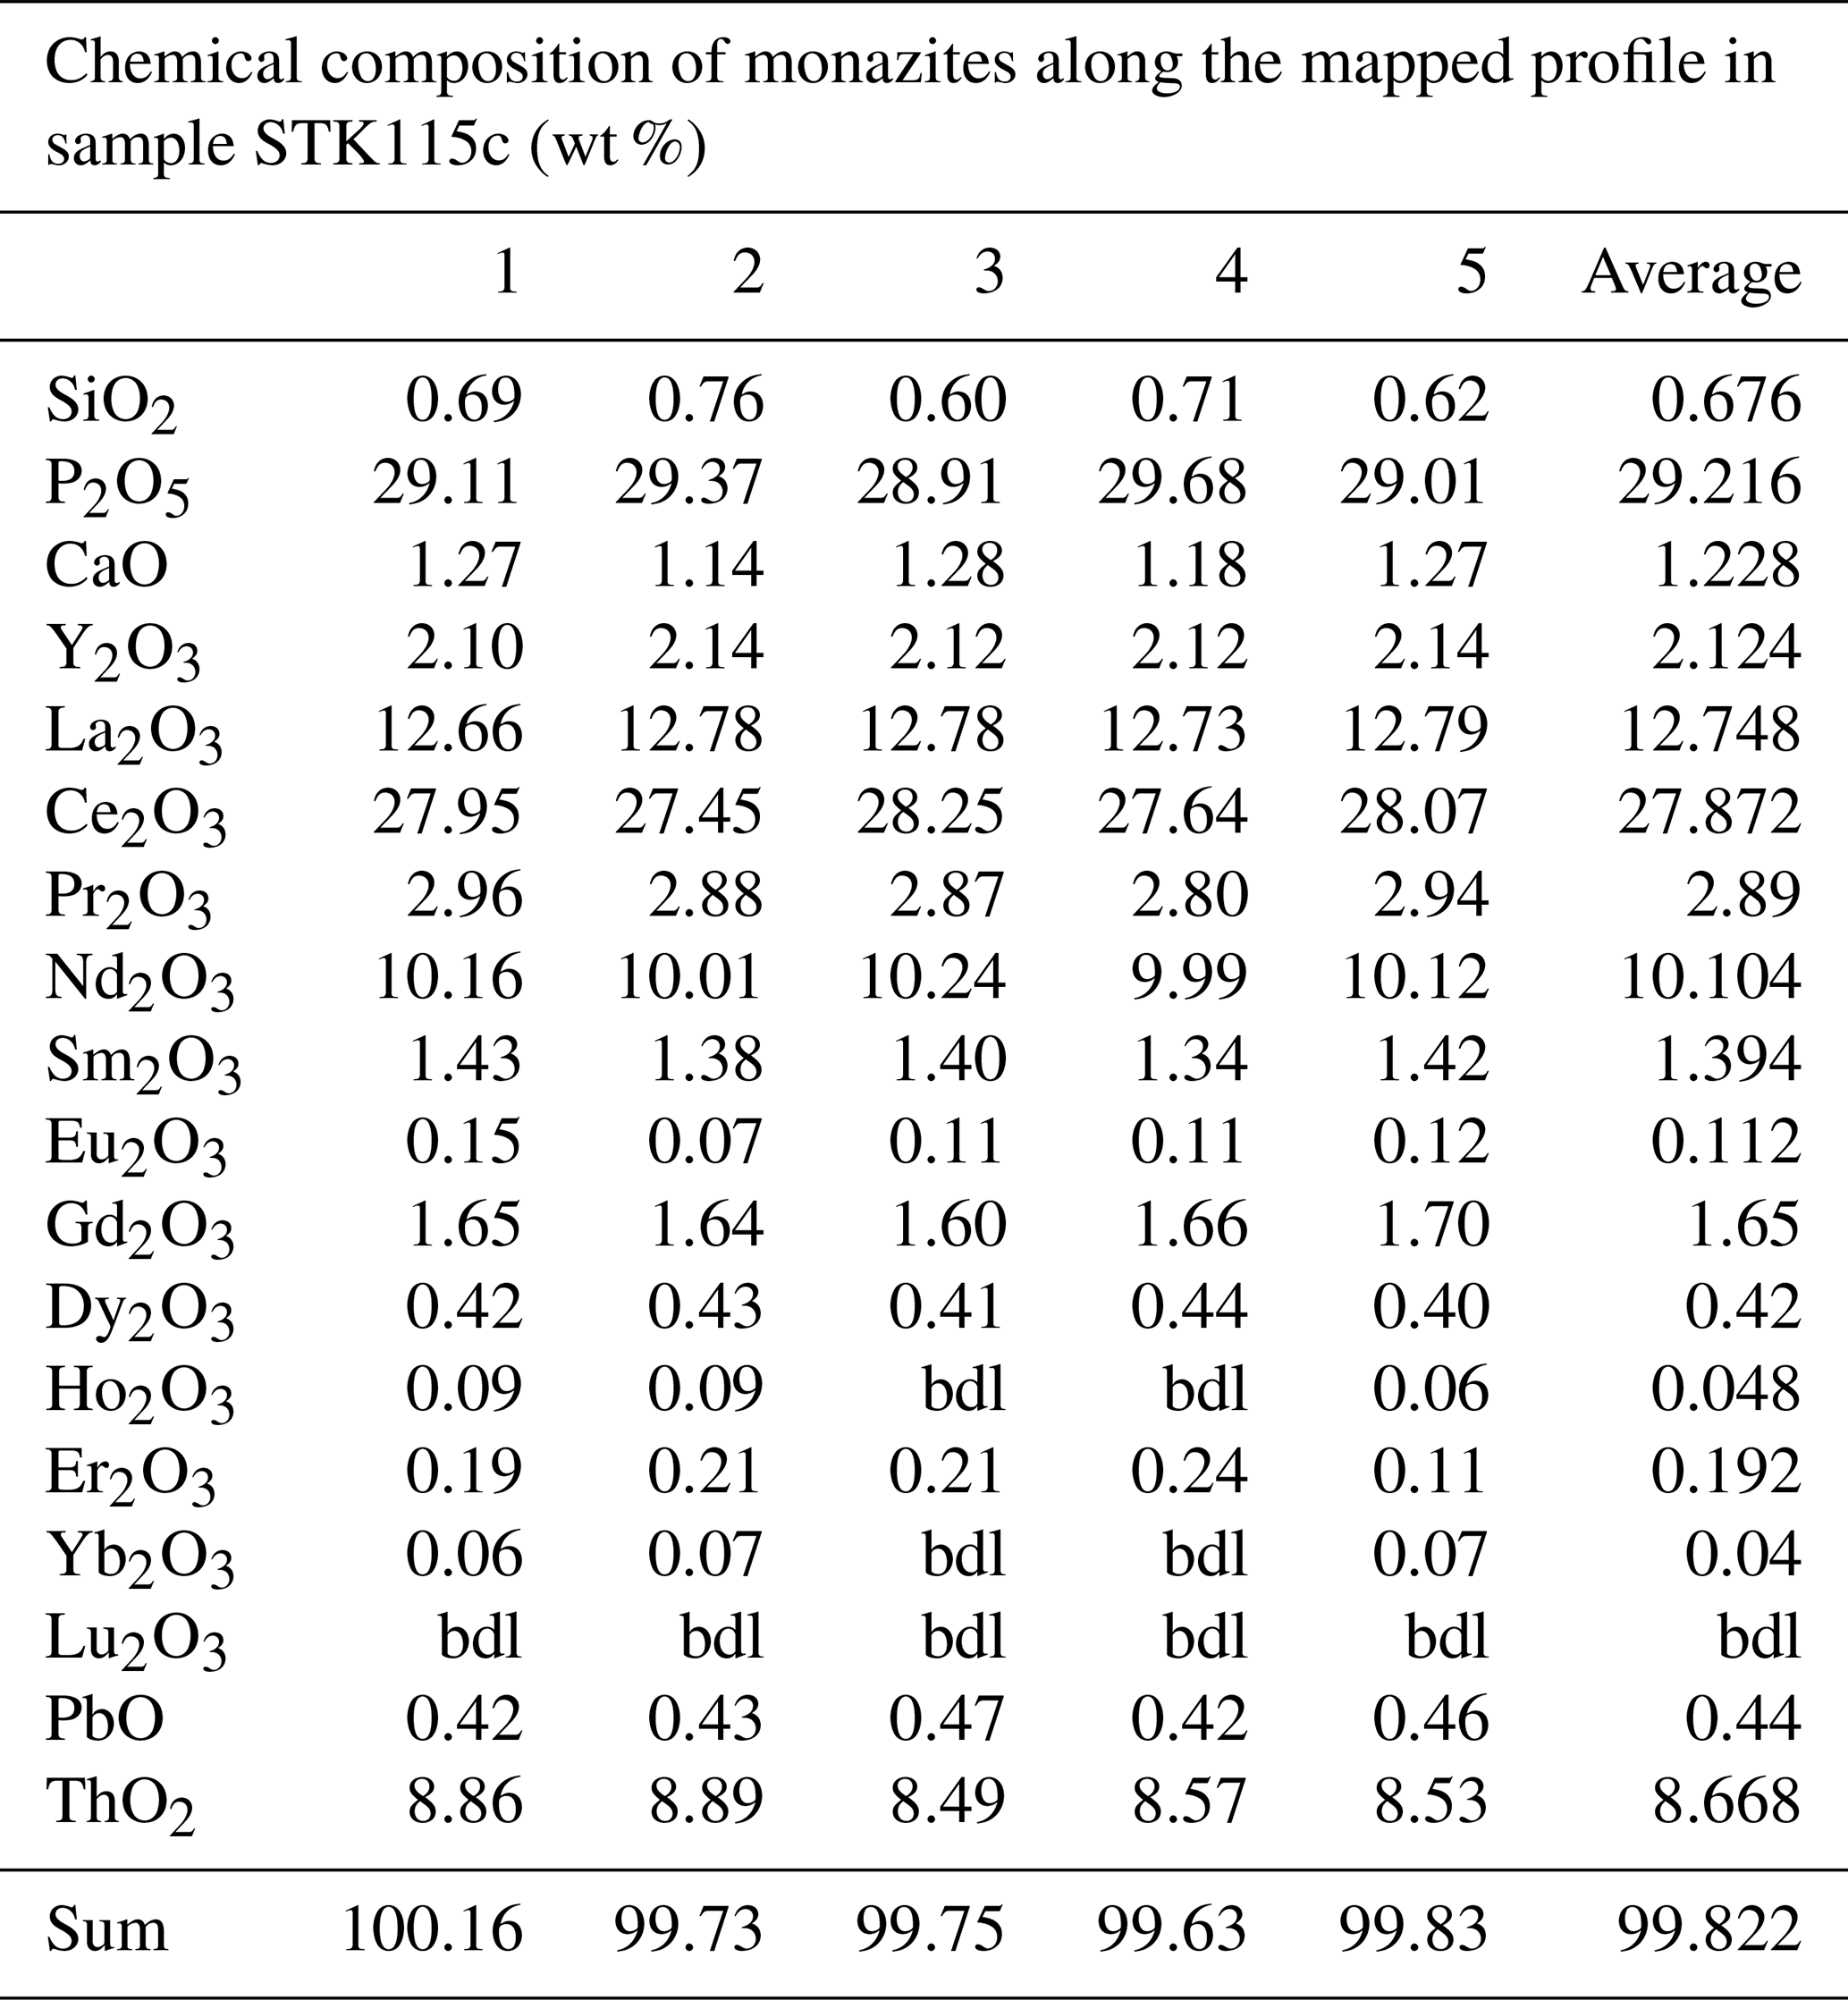
The thin section used (sample STK 115c) contains medium-grained monazite forming layers intergrown with quartz or allanite. In the monazite layers, pyrite occurs as an interstitial phase along monazite grain boundaries. Layers, adjacent to the monazite-rich part, are dominated by coarse-grained anhedral quartz and anhedral to euhedral pyrite or quartz–allanite rich layers. More fine-grained layers or coronas between quartz contain allanite (ca. 20 wt % LREE, Ce > Nd > La), monazite, and fluorapatite (Table 3, Figs. 2 and 5c).

Figure 2Thin section under crossed nicols (Mnz: monazite; Qtz: quartz; All: allanite + quartz + apatite; Py: pyrite). The monazites show strong birefringence (interference colors).
Table 3Chemical composition of the REE-bearing monazites (wt %) from five locations and the average of them (below detection limit (bdl) is counted as 0). Microprobe analyses.
4.2 Hyperspectral transmittance imaging microscopy (HyperTIM) results
The false color image in Fig. 3 is the result of the transmittance calculation. The RGB bands at R 603.91 nm, G 578.46 nm, and B 563.9 nm are displayed in order to highlight the monazites by one major absorption band (AM at ∼ 580 nm). Color saturation was adjusted (300 %). This image already enables a quick manual assessment of Nd-bearing monazites through the purple color as the greenish part of the RGB representation is absorbed (Fig. 3a). A comparison between the measured spectral signatures of a 3×3 pixel area on a monazite and a measured monazite from the USGS Spectral Library reveals that the absorption features share the same position and shape, only varying in feature depth (Fig. 3b). This similarity in reflectance and transmittance measurements is expected as the absorption feature positions are the same. Hence hyperspectral signal processing methods, other than a three-point band depth index, could also be used for analyzing the images as they can be treated as being very similar to more classical reflectance measurements, with the exception of opaque minerals. The false color RGB image calculated by the three-point band depth index (R: NdFD 1: Band 1 = ∼ 580 nm; G: NdFD 2: Band 2 = ∼ 740 nm; B: NdFD 3: Band 3 = ∼ 800 nm) displays and highlights the monazites through purple and bluish pixels, while other minerals remain dark (Fig. 4a). Color enhancement (Saturation 400 %) improved the visibility of the monazite. The NdFD image highlights Nd bound to monazite due to the three characteristic absorption bands of the embedded Nd (∼ 580, ∼ 740, ∼ 800 nm), whereas other minerals that do not contain Nd in detectable concentrations are displayed as dark. Hence, the relative absorption depth of the three bands (R: NdFD 1: Band 1 = ∼ 580 nm; G: NdFD 2: Band 2 = ∼ 740 nm; B: NdFD3: Band 3 = ∼ 800 nm) determine the brightness and color of the pixel. The variation from purple to blue for the monazites is the result of differences in the relative absorption depth of the three bands towards each other and might be caused by slight chemical variations in the monazite Nd content by two different temporal stages of formation or from different mineral orientations. The effects of slight variations in the relative feature depth is eliminated with the calculation of the NdBDI image by Eq. (4). In the NdBDI single-band greyscale image, the overall absorption depth of the three features determines the brightness of each pixel. Hence the stronger the cumulative absorption is, the brighter the pixel is displayed (Fig. 4b). The single-band greyscale image allows an easy comparison with standard analysis techniques such as SEM/BSE imaging. We interpret the greyscale feature depth image as a correlation-scale image representing the correlation towards the Nd bound to monazite. Our algorithm then uses the greyscale image to create the classification image, which displays the pixels identified as monazites in red and non-classified pixels in black (Fig. 4c). The resulting classification image can be overlaid with a true color RGB or over a crossed nicols image for easy context interpretation (Fig. 5a). The classified pixels are counted automatically, resulting in 363 522 pixels that have been classified as monazite through their Nd content by the algorithm. HyperTIM is able to detect Nd in all non-opaque crystals in the thin section through its spectral signature, but in order to calculate an estimated value for the total content of Nd in Eq. (5) (W(Nd) in µg) in the thin section by applying Eq. (5), this method requires an average concentration of the relative Nd content (wt %), which is here provided by an EMPA measurement.
where A(VNIR-Pixel) is pixel size: 24 µm × 24 µm = 576 (µm2); T is thickness of the thin section: 30 µm; N(Monazite) is number of pixels classified as monazite (through Nd content): 363 522; and ρ(Monazite(Ce)) is bulk density (electron density) of monazite:
(Webmineral, 2020). C(Nd) is the relative element concentration in the mineral:
(see Table 3).
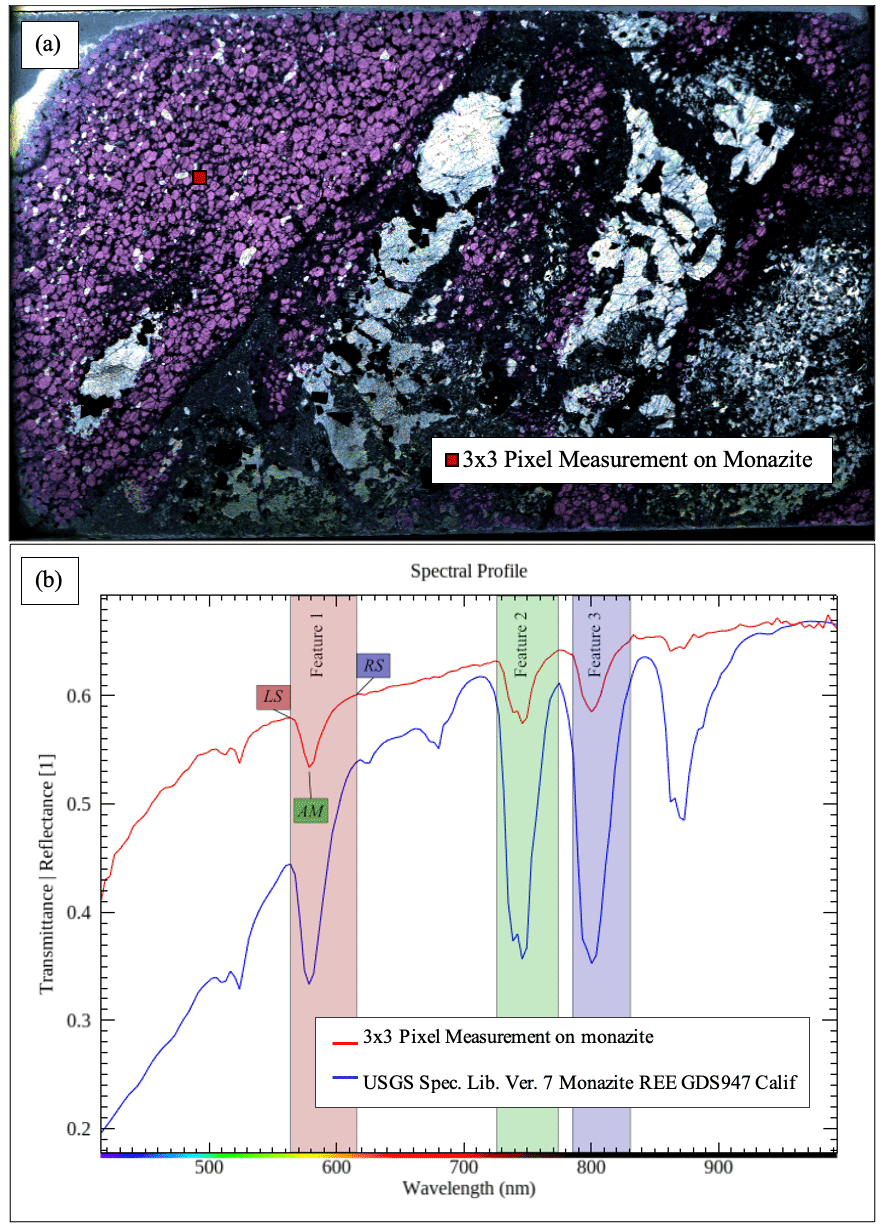
Figure 3(a) False color (saturation 300 %) hyperspectral transmittance image of the thin section to highlight the monazites by the first Nd absorption feature (Feature 1 in b) at R: LS: 563.91 nm; G: AM: 578.46 nm; and B: RS: 618.46 nm. (b) Comparison between the measured spectral signatures of a 3×3 pixel area on a monazite and a measured monazite from the USGS Spectral Library (modified based on Kokaly et al., 2017). The three main absorption features of Nd are highlighted, and the left shoulder (LS), the absorption maximum (AM), and the right shoulder (RS) of the first feature are indicated.
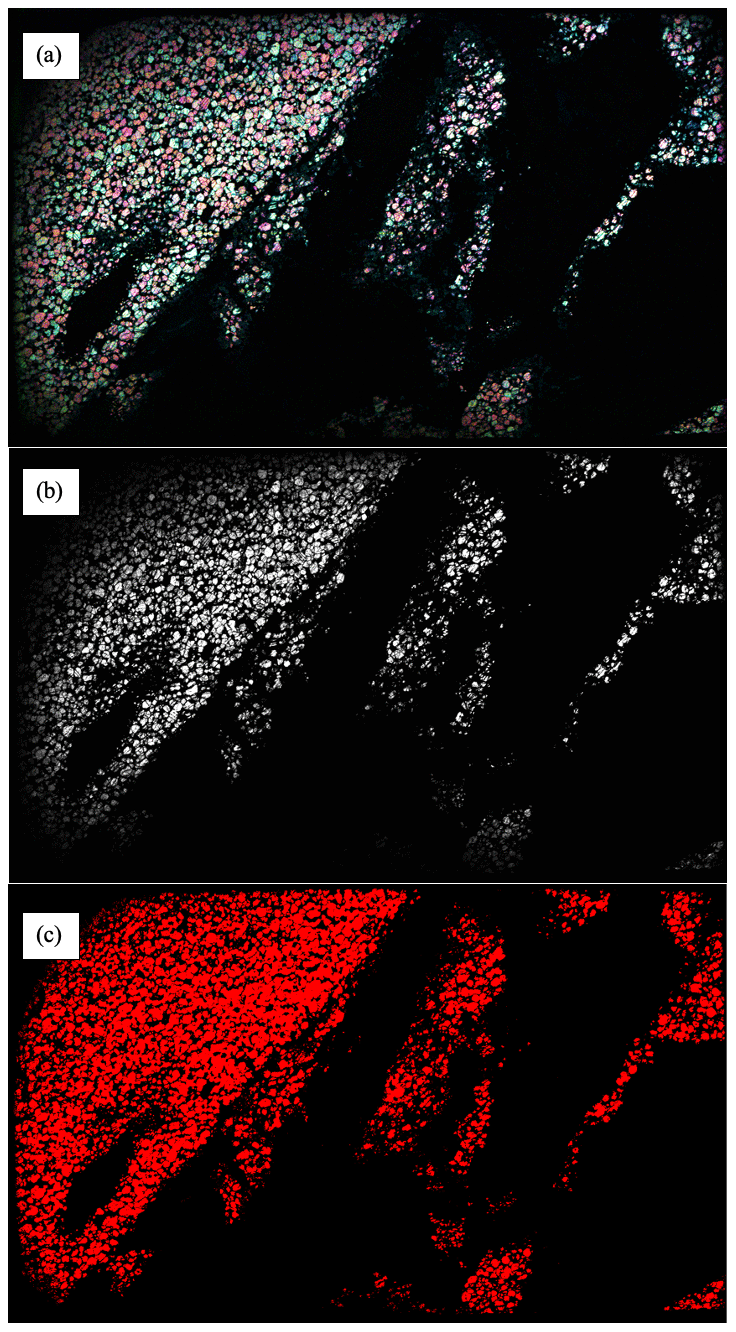
Figure 4(a) Three-point band depth index (R: NdFD 1: ∼ 580 nm; G: NdFD 2: ∼ 740 nm; B: NdFD 3: ∼ 800 nm) highlighting the monazites via light purple and blue pixels (saturation 400 %); other minerals appear dark. (b) Single-band greyscale image derived from the three-point band depth index image by Eq. (3). The overall absorption depth of the three features (∼ 580, ∼ 740, ∼ 800 nm) determines the brightness of each pixel. (c) Classification image/map. The pixels from the greyscale that show absorption at all three features are identified as monazite (Nd) (red), and other minerals/elements are not classified (black).
The total Nd (W(Nd)) content in the thin section was estimated/determined to be 2491.84 µg. The accuracy of this value is dependent on the accuracy of the classification and the assumption that the Nd concentration in the Monazite is 0.0866 on average. Further study would be required to geochemically validate and evaluate the accuracy of these measurements and calculations, which are only shown here as a first proof of the concept.
4.3 Comparison of the results
A comparison of the processed images (Figs. 3 and 4) with the XPL (cross-polarized light) image (Fig. 2) reveals that the images created by the three-point band depth index (RGB (NdFD) and greyscale (NdBDI)) (Fig. 4a and b) already enable a quick visual detection of the monazites. Figure 4a and b also have the advantage over classical XPL analysis by highlighting only Nd-bearing monazites, while the other minerals are not displayed. The classification image/map, on the other hand, also shows monazites at the edges of the thin section and others that are only slightly visible in the greyscale image. This is caused by a weaker absorption depth probably due to imperfect lighting, thickness variation, or a lower Nd content, but they still classify as monazites in the map as all three absorption bands are present. Figure 5 shows a side-by-side comparison of the HyperTIM classification and an area of the thin section that has been mapped with an electron microprobe (Fig. 5c). The result from Nd2O3 mapping by electron microprobe across the profile region shows that the highest Nd2O3 concentrations occur within the monazites (green) and lower concentrations within the allanites (blue) (Fig. 5c).

Figure 5(a) True color RGB (R: 640.27 nm; G: 549.36 nm; B: 458.44 nm) with monazite (Nd) map classification overlaid. Red pixels are classified as monazite (Nd). The other pixels are displayed according to their true color information (R: 640.27 nm; G: 549.36 nm; B: 458.44 nm). Area shown in (b) and (c) is indicated by a white rectangle. (b) Close up of (a) (indicated region). (c) Result of Nd2O3 mapping by electron microprobe across the profile region indicated in (a) (white rectangle), showing the highest Nd2O3 concentrations within monazites (green) and lower concentrations within allanites (blue).
In the following the advantages and disadvantage of HyperTIM are discussed and compared to chosen classical analytical methods used in this study such as XPL and EMPA.
4.4 Advantages of HyperTIM
The comparison shows that HyperTIM can accurately map non-opaque monazites based on their Nd content (Fig. 5). HyperTIM's largest advantage over classical methods is the time required to fully map a thin section. This is due to the automation of the mapping process. XPL requires a trained expert to manually look over a thin section. While analysis software for light microscopes automates the mapping to some degree, the complete automatized mapping of an entire thin section is a novel feature of the HyperTIM method presented here. Compared to EMPA, HyperTIM has the advantage that hyperspectral cameras are usable with less training, mostly cost less, and require less operating expense to use.
Thin sections analyzed with HyperTIM require no prior preparation or coating, while for EMPA a carbon coating of the thin sections is needed. A HyperTIM measurement of an entire thin section requires roughly 1 h (plus 30 min of classification/mapping), while electron microprobe element mapping for a small fraction (shown in Fig. 5c) of the thin section required 84 h. Hence, the time and preparation efficiencies of HyperTIM are the largest advantages over classical analytical methods. The full automation possibility and speed of HyperTIM measurements (unsupervised classification) of entire thin sections could be used to map large amounts of thin sections in a relatively short amount of time.
4.5 Disadvantages of HyperTIM
The biggest disadvantage of HyperTIM is that it is not possible to map opaque minerals. This can be seen in the case of the allanite present in the studied sample. The opaque allanite (< 10 Nd wt %) is mapped by the electron microprobe, while due to its opaque nature it was not mapped through HyperTIM. HyperTIM is also only able to map elements and minerals based on their spectral absorption properties and create classification (pixel-based location maps) of these. The total element content calculation we have demonstrated in this study relies on the average concentration of the relative Nd content (wt %). This was provided by an EMPA measurement. It is still unknown how many minerals and elements can or could be mapped with HyperTIM as this depends on the instrument used and wavelength ranges used for the measurements, and no mineralogical databank exists yet for hyperspectral transmittance measurements.
HyperTIM represents the first scanning transmittance measurement method that involves imaging microscopy for entire rock thin sections. This study shows that HyperTIM can be used to detect, classify, and map minerals and their associated elements such as Nd-bearing monazite in thin sections. The classification of the minerals is fully automated through the programming language Python. In the processing, a three-point band depth index algorithm is applied (NdFD), and a single-band greyscale image (NdBDI) is derived from it. A classification image/map is then derived from the greyscale image, which in combination with an average concentration of the relative Nd content (wt %) (from EMPA) is used to calculate an estimate of the total mass content of Nd in the entire thin section. HyperTIM is a time-efficient, novel method for destruction-free mineral and element detection, classification, and quantization in entire thin sections, which complements more classical methods and especially EMPA, which in combination allows for a more exact element quantization. While it is not possible to map opaque minerals using HyperTIM, it is a much more time and cost-effective method for mapping non-opaque minerals. The authors of this study therefore conclude that the ability of HyperTIM to map entire thin sections in relatively short time compared to classical methods and the ability to use automatic mapping algorithms to speed up analysis of thin sections are strong advantages over classical methods.
As this study intends to function as a first technical proof of concept for a novel analytical method, a thin section with an abundance of monazite and neodymium was chosen as a showcase. Further research with more thin sections is needed to assess the sensitivity and accuracy, as well as to validate the element content calculations/estimation geochemically. HyperTIM is a destruction-free process/method and can be applied to other minerals, elements, and substances with characteristic absorption bands, including REEs and other economically critical resources. The general methodology of HyperTIM can also be applied to other wavelength ranges including UV (ultra-violet), SWIR (short-wave infrared), or TIR (thermal infrared) if used with other hyperspectral instrumentation.
Although most absorption features of elements and minerals should share the same position in transmittance and reflectance measurements as explained in Sect. 3, their intensity could vary to such a degree that some might be exclusively measurable in transmittance. As HyperTIM measurements of rock thin sections are a novel field, absorption features of elements and minerals exclusive to transmittance measurements due to stronger crystal lattice effects and other absorption effects than present in reflectance measurements might present a possible new research field. This possible difference in measurable absorption in reflectance and transmittance of naturally occurring minerals is suggested by research in the field of crystallography, industrial applications, and in crystal thin film research. Also, a combination of reflectance and transmittance measurements is a possible future solution to map minerals that are opaque and do not allow transmittance measurements in the studied wavelength ranges. This makes HyperTIM very promising for further research and studies on absorption characteristics and element abundances in thin sections of all rock types.
All data derived from this research are available upon request from the corresponding author.
HLCD wrote and prepared the original draft, conceptualized and performed the hyperspectral transmittance microscope measurements, related calculations, and constructed the sample holder. CM contributed to the development of the band ratios. NK and ML performed the microprobe measurements and analysis. NK also helped with the calculations. CR was involved in the conceptualization and was consulting on the methodology. UA and MK provided mineralogical analysis and geological background on the sample and reviewed the manuscript. DEH reviewed the manuscript and consulted on the mineralogical background. MK and DEH provided the sample STK 115c for the measurements.
The contact author has declared that neither they nor their co-authors have any competing interests.
Publisher's note: Copernicus Publications remains neutral with regard to jurisdictional claims in published maps and institutional affiliations.
The authors thank the Helmholtz Centre Potsdam, GFZ German Research Centre for Geosciences, for making the measurements with the HySpex camera possible and in general for enabling the research. The authors also thank the University of Potsdam for making the measurements with their electron microprobe and use of their microscopes possible.
Supported within the funding program “Open Access Publikationskosten” Deutsche Forschungsgemeinschaft (DFG, German Research Foundation) – project number 491075472.
The article processing charges for this open-access publication were covered by the Helmholtz Centre Potsdam – GFZ German Research Centre for Geosciences.
This paper was edited by Alessandro Pavese and reviewed by Simona Ferrando and one anonymous referee.
Andreoli, M. A. G., Smith, C. B., Watkeys, M., Moore, J. M., Ashwal, L. D., and Hart, R. J.: The geology of the Steenkampskraal monazite deposit, South Africa; implications for REE-Th-Cu mineralization in charnockite-granulite terranes, Econ. Geol., 89, 994–1016, https://doi.org/10.2113/gsecongeo.89.5.994, 1994.
Andreoli, M. A. G., Hart, R. J., Ashwal, L. D., and Coetzee, H.: Correlations between U, Th Content and Metamorphic Grade in the Western Namaqualand Belt, South Africa, with Implications for Radioactive Heating of the Crust, J. Petrol., 47, 1095–1118, https://doi.org/10.1093/petrology/egl004, 2006.
Basson, I. J., Muntingh, J. A., Jellicoe, B. C., and Anthonissen, C. J.: Structural interpretation of the Steenkampskraal monazite deposit, Western Cape, South Africa, J. Afr. Earth Sci., 121, 301–315, https://doi.org/10.1016/j.jafrearsci.2016.05.027, 2016.
Bergsträsser, S., Fanourakis, D., Schmittgen, S., Cendrero-Mateo, M., Jansen, M., Scharr, H., and Rascher, U.: HyperART: non-invasive quantification of leaf traits using hyperspectral absorption-reflectance-transmittance imaging, Plant Methods, 11, 1, https://doi.org/10.1186/s13007-015-0043-0, 2015.
Boesche, N., Rogass, C., Lubitz, C., Brell, M., Herrmann, S., Mielke, C., Tonn, S., Appelt, O., Altenberger, U., and Kaufmann, H.: Hyperspectral REE (Rare Earth Element) Mapping of Outcrops – Applications for Neodymium Detection, Remote Sens., 7, 5160–5186, https://doi.org/10.3390/rs70505160, 2015.
Boesche, N. K., Rogass, C., Mielke, C., and Kaufmann, H.: Hyperspectral digital image analysis and geochemical analysis of a rare earth elements mineralized intrusive complex (fen carbonatite complex in Telemark region, Norway), EARSeL 34th Symposium Proceedings, 16–20 June 2014, EARSeL and University of Warsaw, https://doi.org/10.12760/03-2014-07, 2014.
De Waal, S. A. and Viljoen, E. A.: A Mineralogical Study of Eight Samples of Phosphate Ore from Steenkampskraal, Vanhynsdorp, Cape Province, Report, National Institute of Metallurgy, 950 pp., 1970.
Ekaterina, C. and Veronique, C.: Influence of mineral (prefered) orientation on composition mapping: Observed in IR range of transmission spectra, in: 2009 First Workshop on Hyperspectral Image and Signal Processing: Evolution in Remote Sensing, 2009 First Workshop on Hyperspectral Image and Signal Processing: Evolution in Remote Sensing (WHISPERS), Grenoble, 1–4, https://doi.org/10.1109/WHISPERS.2009.5289011, 2009.
Huang, M., Wan, X., Zhang, M., and Zhu, Q.: Detection of insect-damaged vegetable soybeans using hyperspectral transmittance image, J. Food Eng., 116, 45–49, https://doi.org/10.1016/j.jfoodeng.2012.11.014, 2013.
Hunt, G. R.: Spectral Signatures of Particulate Minerals in the Visible and Near Infrared, Geophysics, 42, 501–513, https://doi.org/10.1190/1.1440721, 1977.
Jones, I. and Burnett, M.: Technical Report and Mineral Resource Estimate, October 2013, Snowden Group Report 4224_J2170, 2013.
Jones, I. and Hancox, P. J.: Steenkampskraal Rare-earth Element Project, South Africa. Technical Report and Mineral Resource Estimate, Document Reference: 130307_F_JR001-03-2013_GWMG_SKK_ResEst_NI43-101, 145 pp., 2012.
Kilian, J. G.: The petrogenesis of the Steenkampskraal monazite deposit in Namaqualand, Unpublished MSc thesis, University Stellenbosch, South Africa, 44 pp., 2011.
Kokaly, R. F., Clark, R. N., Swayze, G. A., Livo, K. E., Hoefen, T. M., Pearson, N. C., Wise, R. A., Benzel, W. M., Lowers, H. A., Driscoll, R. L., and Klein, A. J.: USGS Spectral Library Version 7, Reston, VA, https://doi.org/10.3133/ds1035, 2017.
Leiva-Valenzuela, G. A., Lu, R., and Aguilera, J. M.: Assessment of internal quality of blueberries using hyperspectral transmittance and reflectance images with whole spectra or selected wavelengths, Innov. Food Sci. Emerg., 24, 2–13, https://doi.org/10.1016/j.ifset.2014.02.006, 2014.
Lenhard, K., Baumgartner, A., and Schwarzmaier, T.: Independent Laboratory Characterization of NEO HySpex Imaging Spectrometers VNIR-1600 and SWIR-320m-e, IEEE T. Geosci. Remote Sens., 53, 1828–1841, https://doi.org/10.1109/TGRS.2014.2349737, 2015.
Lorenz, M., Altenberger, U., Trumbull, R. B., Lira, R., López de Luchi, M., Günter, C., and Eidner, S.: Chemical and textural relations of britholite- and apatite-group minerals from hydrothermal REE mineralization at the Rodeo de los Molles deposit, Central Argentina, 104, 1840–1850, https://doi.org/10.2138/am-2019-6969, 2019.
Maturilli, A., Helbert, J., Ferrari, S., Davidsson, B., and D'Amore, M.: Characterization of asteroid analogues by means of emission and reflectance spectroscopy in the 1- to 100-µm spectral range, Earth Planets Space, 68, 113, https://doi.org/10.1186/s40623-016-0489-y, 2016.
Mielke, C., Boesche, N., Rogass, C., Kaufmann, H., Gauert, C., and de Wit, M.: Spaceborne Mine Waste Mineralogy Monitoring in South Africa, Applications for Modern Push-Broom Missions: Hyperion/OLI and EnMAP/Sentinel-2, Remote Sens., 6, 6790–6816, https://doi.org/10.3390/rs6086790, 2014.
Norsk Elektro Optikk (NEO): HySpex Website, https://www.hyspex.no, last access: 18 February 2020.
Pike, D. R.: The Monazite Deposits of the Van Rynsdorp Division, Cape Province, MSc Dissertation, University of Pretoria, 127 pp., 1959.
Read, D., Andreoli, M. A. G., Knoper, M., Williams, C. T., and Jarvis, N.: The degradation of monazite: Implications for the mobility of rare-earth and actinide elements during low-temperature alteration, Eur. J. Mineral., 14, 487–498, https://doi.org/10.1127/0935-1221/2002/0014-0487, 2002.
Rogass, C., Koerting, F., Mielke, C., Brell, M., Boesche, N., Bade, M., and Hohmann, C.: Translational Imaging Spectroscopy for Proximal Sensing, Sensors, 17, 1857, https://doi.org/10.3390/s17081857, 2017.
Thomas, S., Wahabzada, M., Kuska, M. T., Rascher, U., and Mahlein, A.-K.: Observation of plant–pathogen interaction by simultaneous hyperspectral imaging reflection and transmission measurements, Funct. Plant Biol., 44, 23, https://doi.org/10.1071/FP16127, 2017.
van der Meer, F. D., van der Werff, H. M. A., van Ruitenbeek, F. J. A., Hecker, C. A., Bakker, W. H., Noomen, M. F., van der Meijde, M., Carranza, E. J. M., de Smeth, J. B., and Woldai, T.: Multi- and hyperspectral geologic remote sensing: A review, Int. J. Appl. Earth Obs., 14, 112–128, https://doi.org/10.1016/j.jag.2011.08.002, 2012.
Webmineral: Monazite-(Nd) Mineral Data, Mineral Data, https://webmineral.com/data/Monazite-(Nd).shtml#.Xkv9uy2ZPOQ, last access: 18 February 2020.