the Creative Commons Attribution 4.0 License.
the Creative Commons Attribution 4.0 License.
 | 13 Apr 2022
Theoretical OH stretching vibrations in dravite
Yves Fuchs
Chloé Fourdrin
Etienne Balan
Density functional theory is used to investigate the vibrational stretching properties of OH groups in ideal and chemically disordered dravite models. Different schemes of cationic occupancy are considered, including the occurrence of vacancies at the X site and Mg–Al inversion between the Y and Z sites. The harmonic coupling between different OH groups is found to be smaller than 1 cm−1, indicating that the OH stretching dynamic in dravite can be described by considering a collection of nearly independent single OH oscillators. Their harmonic stretching frequency is linearly correlated with the corresponding OH bond length and most of the bands observed in the experimental vibrational spectra can be interpreted as consequences of the cationic occupancy of the sites coordinated to the OH group. The V(OH) and W(OH) stretching frequencies are affected by the Mg–Al inversion and by the presence of vacancies at the X site. In this last case, the frequencies depend on the isolated or more concentrated character of the X vacancy distribution along the c axis. Based on theoretical stretching frequencies, new interpretations are proposed for some of the bands experimentally observed in synthetic samples of dravite and magnesio-foitite.
- Article
(2242 KB) - Full-text XML
-
Supplement
(734 KB) - BibTeX
- EndNote


Tourmalines form a super-group of complex hydrous borosilicates with the following general formula: XY3Z6(T6O18)(BO3)3V3W (Henry et al., 2011). According to the chemical systematics reported by Henry et al. (2011), the most common ions (or vacancy) at each site are X = Na+, Ca2+, K+, and vacancy; Y = Fe2+, Mg2+, Mn2+, Al3+, Li+, Fe3+, and Cr3+; Z = Al3+, Fe3+, Mg2+, and Cr3+; T = Si4+, Al3+, and B3+; B = B3+; V = OH− and O2−; and W = OH−, F−, and O2−. Tourmaline samples thus correspond to solid solutions of a multitude of end-members (Henry et al., 2011). Even in samples close to end-member compositions, disordered cation distributions occur, as revealed by structure refinements based on X-ray diffraction data (e.g., Hawthorne et al., 1993; Bosi et al., 2016). Due to its crystal–chemical versatility, tourmaline is an important indicator of petrogenetic conditions (Van Hinsberg et al., 2011) and has promising environmental applications (Liang et al., 2021).
Information about the local structure of tourmaline-group minerals can be obtained from the spectroscopic study of the OH stretching modes which lead to characteristic bands in the Fourier transform infrared (FTIR) or Raman spectra (e.g., Gonzalez-Carrenño et al., 1988; Fantini et al., 2014; Bosi et al., 2016; Berryman et al., 2016; Watenphul et al., 2016). Compared with lattice modes, the high frequency and weak dispersion of OH stretching modes result in a localized character typical of hard modes (e.g., Salje and Bismayer, 1997), which facilitates their use as probes of short-range order in minerals. Accordingly, the OH stretching spectra of chemically complex natural tourmaline samples could provide relevant information to identify specific cationic configurations and to relate them to the corresponding end-members (e.g., Watenphul et al., 2016). Two categories of structural OH groups can be distinguished in tourmaline (e.g., Gatta et al., 2014). The W(OH) shares its oxygen atom (O1) with the three octahedral Y sites and points to the X site along the [001] direction (Fig. 1). The 3 times more abundant V(OH) groups are coordinated to two Z and one Y octahedral sites with a weak H bonding interaction with the distant O5 oxygen bridging two tetrahedral sites (Gatta et al., 2014). Due to the sensitivity of OH stretching frequencies to their atomic-scale environment, a diversity of vibrational spectra is observed in the typical range of OH stretching frequencies (3000–3800 cm−1) reflecting the variability in tourmaline chemical composition (e.g., Watenphul et al., 2016). For example, dravite, with nominal chemical composition XNaYMg3ZAl6(TSi6O18)(BO3)(OH)3W(OH), displays a series of weak narrow bands between ∼ 3600 and 3800 cm−1 and a broad and asymmetric stronger band spread between 3400 and ∼ 3600 cm−1 (e.g., Fantini et al., 2014; Bosi et al., 2016; Berryman et al., 2016; Watenphul et al., 2016). Whereas the former bands have been related to the W(OH) site and the latter to V(OH) site, their assignment to specific atomic-scale environments is still debated, and two different models have been proposed to interpret the V(OH) stretching spectrum of tourmaline.
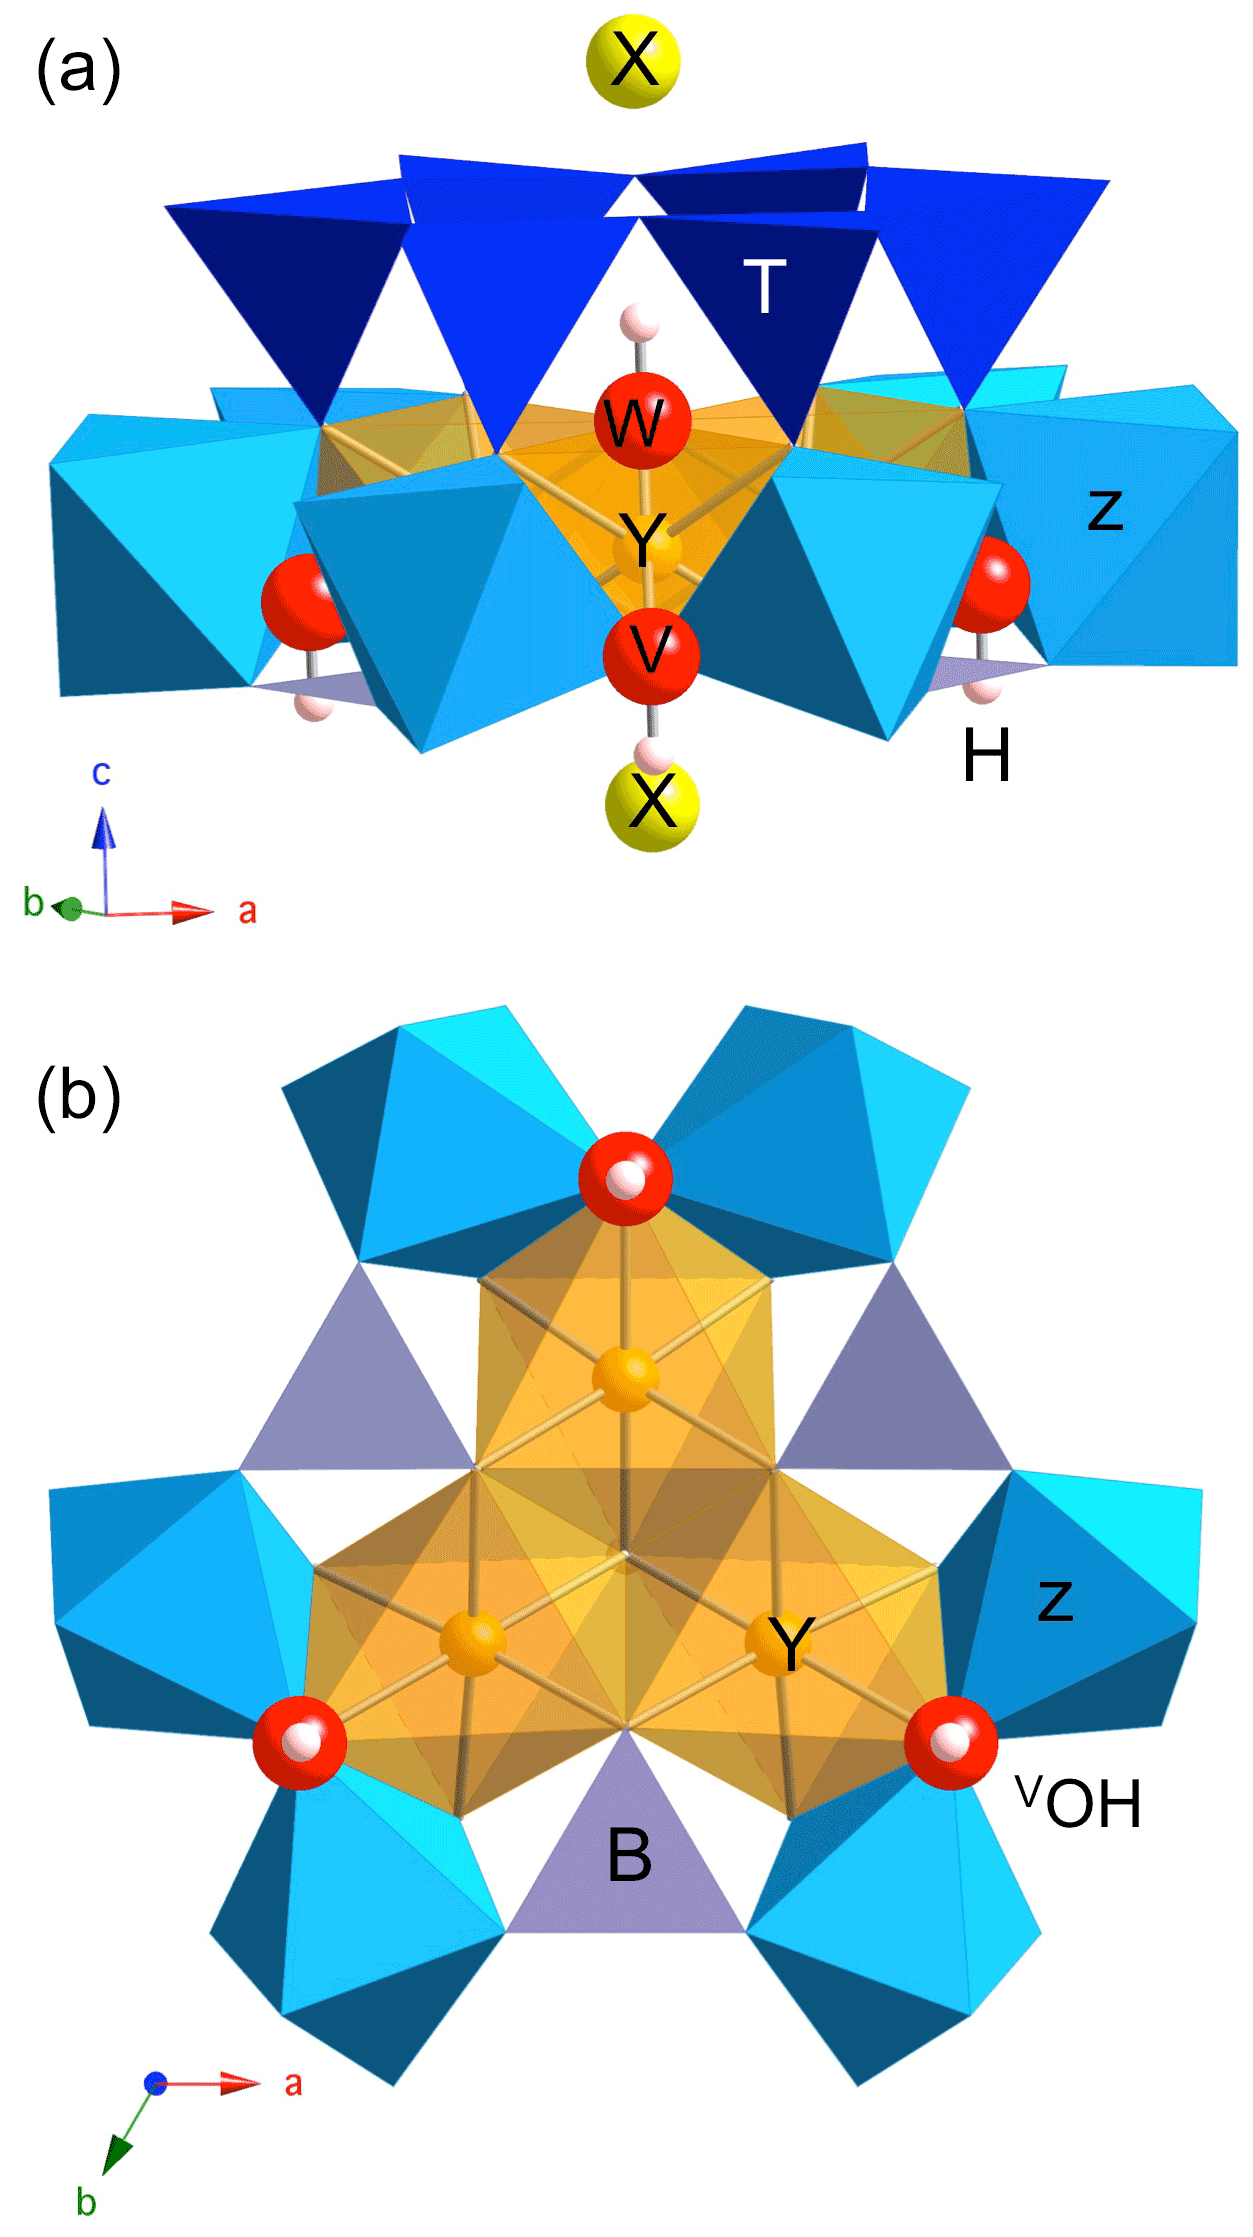
Figure 1Dravite cluster displaying the main sites exerting a control on the OH stretching frequencies: lateral view (a) and projection along the [001] direction (b). The three symmetrically equivalent V(OH) groups are coordinated to one Y and two Z sites, whereas the W(OH) group is coordinated to three Y sites. The purple grey triangles at the base of the Z and Y sites correspond to BO3 units. O and H atoms belonging to OH groups are represented as red and white spheres, respectively (radii are only illustrative).
In the “traditional” model (e.g., Gonzalez-Carrenño et al., 1988; Fantini et al. 2014; Berryman et al., 2016; Kutzschbach et al., 2017; Pieczka et al., 2020), the V(OH) stretching frequency is dominantly determined by the nature of cations coordinated to the OH group. This model is based on the observation that for a constant H bonding environment, the OH stretching frequency is primarily affected by the characteristics of the chemical bond that the oxygen atom shares with neighboring cations, through bond valence requirements, and to a lesser extent by the perturbations arising from substitutions at more distant sites (e.g., Hawthorne, 2016; Bronzova et al., 2019). A different interpretation of the V(OH) bands has however been proposed by Watenphul et al. (2016) and further used by Bosi et al. (2016). In this interpretation, it is suggested that the V(OH) stretching mode frequency is determined by the chemistry of the cluster formed by the YZZ sites which are symmetrically related by the 3-fold rotation axis in the rhombohedral unit cell (Fig. 1) and not by the chemistry of a sole YZZ species. This assumption implies a collective response of the three V(OH) groups of the cluster to chemical disorder (Hawthorne, 2016). To illustrate the difference between the two models (Bosi et al., 2016), a YMgZAlZAl-YMgZAlZAl-YAlZAlZAl cluster is expected to lead to two different V(OH) stretching bands in the traditional model (one for the YMgZAlZAl environment and one for the YAlZAlZAl environment), whereas the “YZZ-triplet” model predicts a single V(OH) band for this cluster. In this latter case, experimental observations suggest that the frequency related to a 2YMgZAlZAl-YAlZAlZAl cluster in dravite would be smaller than that related to a 3YMgZAlZAl cluster by ∼ 40 cm−1 (Watenphul et al., 2016).
According to Watenphul et al. (2016), the theoretical basis proposed for the YZZ-triplet model relates to the vibrational properties of mixed crystals, as reviewed by Chang and Mitra (1971). A property shared by the mixed crystals investigated by Chang and Mitra (1971) is their lattice-type dynamic, which in its simplest expression is analogous to that of a linear chain of point masses connected to each other by springs. Depending on the interplay of atomic masses and spring constants, these systems can present a continuous shift of long-wavelength phonon frequencies as a function of their chemical composition (one-mode behavior; e.g., NaxK1−xCl) or two sets of phonon frequencies close to those of the end-members (two-mode behavior; e.g., CdSxSe1−x). However, the influence of chemical disorder on the vibrational properties of crystals with molecular units, such as tourmaline-group minerals, could differ from that observed on the crystals with a lattice-type dynamic investigated by Chang and Mitra (1971). When the frequency of the internal vibrations is significantly higher than that of the lattice phonon branches, intermolecular interactions act as a perturbation of the single molecule properties (e.g., Farmer, 1974; Califano et al., 1981). Collective properties are then related to the harmonic coupling between single oscillators, as well illustrated by the OH stretching phonons in, for example, brucite (Mitev et al., 2010). In this picture, the local or collective character of the response to chemical disorder depends on the respective magnitude of the intermolecular coupling and chemically induced local perturbation. In the weak coupling limit, chemical disorder can differently influence the vibration of single units, whereas a more collective response is expected when the vibrational coupling is stronger than the perturbation.
In the present study, we theoretically investigate at a quantum chemical level the influence of chemical disorder on the OH stretching modes of dravite. The modeling is based on density functional theory (DFT) which is a level of theory accurate enough to assign the OH stretching bands of hydrous minerals to specific vibrational modes involving the coupled motions of OH groups (e.g., Balan et al., 2001, 2002, 2005). Among the various end-members of tourmaline, we selected dravite because of the well-tested performances of DFT in the modeling of Al and Mg hydrous minerals (e.g., Balan et al., 2001, 2002, 2005; Mitev et al., 2010; Blanchard et al., 2018). We first confirm that the OH stretching modes in ideal dravite are almost fully decoupled from the other vibrational modes, and we determine the magnitude of the harmonic vibrational coupling between single OH oscillators. We then determine the theoretical stretching frequencies of OH groups in models with cationic occupancies that vary from ideal dravite, showing that their response to a chemical perturbation is consistent with the “traditional” interpretation proposed for the V(OH) stretching bands. Based on the theoretical frequencies, revised interpretations are proposed for some of the W(OH) and V(OH) bands experimentally observed in synthetic samples.
Relevant properties were obtained using the density functional theory (DFT) and the generalized gradient approximation (GGA) to the exchange–correlation functional (XC functional) as proposed by Perdew, Burke and Ernzerhof (PBE) (Perdew et al., 1996). The modeling was done using a plane-wave and pseudo-potential scheme, as implemented in the PWscf and PHonon codes from the Quantum ESPRESSO package (Giannozzi et al., 2009; http://www.quantum-espresso.org, last access: 3 April 2022). The ionic cores were described by optimized norm-conserving pseudo-potentials from the SG15 ONCV library (Hamman, 2013; Schlipf and Gigy, 2015). The wave functions and the charge density were expanded in plane waves with 80 and 480 Ry cutoffs, respectively. The discrete sampling of the Brillouin zone for electronic integration was performed using a k-point grid for the primitive rhombohedral cell. It was restricted to a single k point with coordinates (0.0, 0.0, −1.1063832) in 2 units for the hexagonal cells and to the Γ point for the hexagonal supercells. Relaxation of atomic positions was performed until the residual forces on atoms were less than 10−4 Ry a.u.−1.
The relaxed R-centered hexagonal cell parameters (a=16.11 Å, c= 7.28 Å) of ideal dravite (space group R3m) overestimate by ∼ 1 % the corresponding experimental values (e.g., a= 15.9297 Å, c= 7.2064 Å; Bosi et al., 2016). This overestimation is consistent with previous studies of other minerals performed at the same theoretical level (e.g., Balan et al., 2019). Models corresponding to chemically disordered dravite have been built by varying the site occupancies of a single 3YZZ-X cluster in the hexagonal cell of dravite. The structure of the chemically disordered models (Supplement) was then obtained by relaxing all the atomic coordinates. The cell parameters were kept equal to those of ideal dravite to avoid unwanted distortions of the periodic lattice due to the locally induced symmetry lowering. Due to the moderate value of the c cell parameter of the hexagonal cell (7.28 Å), some interaction can however occur between the periodic images of the modified sites along the c axis. Accordingly, the most pertinent configurations of disordered dravite have been also investigated using hexagonal supercells, which contain 323 or 324 atoms depending on the model.
For the models with heterovalent substitutions, the macroscopic neutrality of the periodic system was ensured by a compensating homogeneous electrostatic background spread over the cell. This electrostatic correction avoids the divergence of the total energy but is not expected to affect the microscopic properties of ionic systems (e.g., Leslie and Gillan, 1985).
Harmonic vibrational properties (atomic displacements and frequencies of the transverse optical modes at the Brillouin zone center) were calculated from the second-order derivatives of the total energy with respect to atomic displacements using the linear response theory (Baroni et al., 2001) as implemented in the PHonon code (Giannozzi et al., 2009). The eigendisplacements of OH stretching modes are reported in the Supplement. Note that coordinates of eigendisplacement vectors correspond to the coordinates of the dynamical matrix eigenvectors divided by the square root of the relevant atomic mass.
3.1 Theoretical properties of OH stretching modes in ideal dravite
To ascertain that the OH stretching modes in dravite are decoupled from other vibrational modes occurring at lower frequency, the full dynamical matrix of the primitive rhombohedral cell was diagonalized, leading to four OH stretching modes among a total of 159 vibrational modes. These four modes correspond to the W(OH) stretching mode at 3856 cm−1 and to one and two V(OH) modes belonging to the A1 and E irreducible representations, respectively, as determined by the group theory analysis of Watenphul et al. (2016). The A1 mode at 3653.4 cm−1 corresponds to the in-phase displacement of the three symmetrically equivalent V(OH) groups and the doubly degenerated E modes at 3653.5 cm−1 to their out-of-phase displacements. The infrared or Raman intensities are carried by the A1 mode because the three V(OH) groups are almost parallel to each other. Then, the diagonalization of a partial dynamical matrix was performed by only considering the displacements of the oxygen and hydrogen atoms belonging to the OH groups, setting to zero all other coefficients. The OH stretching frequencies obtained using the partial matrix differ by less than 0.15 cm−1 from those resulting from the full computation (Supplement Table S1), which attests to the quality of the approximation. Accordingly, the OH stretching modes form a subset of vibrational modes decoupled from all the other modes. This also implies that the mass of the other atoms does not play any significant role in the OH stretching dynamic. This property is specific to the stretching modes, which are well separated from the other modes occurring at lower frequency (e.g., Balan et al., 2005, 2017). The other OH vibrations, corresponding to two libration and three hindered translation displacements per OH group, cannot be determined in such a straightforward manner because they can couple to other atomic motions due to their lower frequency.
The OH stretching vibrations, being decoupled from the other degrees of freedom, can be described by solely considering the OH stretch coordinates (e.g., Califano et al., 1981; Mitev et al., 2010). The zone-center transverse optical stretching modes then relate to a harmonic cell Hamiltonian with diagonal terms depending on the sum of single bond contributions and out-of-diagonal terms accounting for the bilinear coupling between OH groups. In such local mode description, the splitting of the A1 and E stretching modes of three symmetrically equivalent V(OH) groups is determined by a single parameter λ measuring their harmonic coupling: λ= (ω(A1)- (see Supplement). If the dominant interactions occur within the 3(YZZ) cluster, the local mode description is formally equivalent to that of the potential coupling of three equivalent X–H groups in a C3V molecule, where X is a heavier atom (e.g., Halonen and Child, 1983). Accordingly, the very small splitting (∼ 0.1 cm−1) observed between the A1 and E V(OH) stretching modes denotes the weakness of the coupling interaction between the V(OH) oscillators in dravite. Inspection of the eigendisplacement vectors also indicates that the W(OH) stretching is not significantly coupled to the V(OH) stretching. It is thus arguable that the OH stretching dynamic in dravite is better described by a collection of nearly independent oscillators than by collective atomic motions typical of lattice modes.
The hexagonal cell offers the possibility to assess the vibrational interaction between OH groups belonging to different W(OH)-Y(Mg)3–V(OH)3–Z(Al)6 clusters. For that purpose, the full dynamical matrix of the hexagonal cell was diagonalized, leading to 12 OH stretching modes among a total of 483 vibrational modes. These 12 modes correspond to 3 W(OH) stretching modes and to 3 A1 and 6 E V(OH) modes. Vibrational interactions lead to a spreading over ∼ 0.04 and ∼ 1.4 cm−1 of the three W(OH) and nine V(OH) frequencies of the full system, respectively (Table S2). Using a partial dynamical matrix reduced to the four OH groups belonging to a single cluster, the W(OH) stretching mode is calculated at 3856.2 cm−1, whereas the A1 and E V(OH) modes are calculated at 3653.2 and 3652.3 cm−1 (Table S2). These frequencies differ by less than 0.2 cm−1 from the mean frequency of the modes with corresponding symmetry in the full dynamical system. They are also within 1.5 cm−1 from those obtained on the rhombohedral cell using a comparatively denser k-point grid.
3.2 Influence of cationic ordering and X site vacancies on OH groups in dravite
The considered models of non-ideal dravite (Table 1) include vacant X site, Mg for Al substitution at Z site, Al for Mg substitution at Y site and Al–Mg inversion involving Y and Z sites. Models combining a vacant X site with one or two Al substitutions in nearby Y sites or Al–Mg inversion have also been considered. In these cases, two configurations occur in the hexagonal supercell depending on the relative position of the vacant X site and modified Y and Z sites along the c axis. All the models have a local charge disequilibrium smaller than or equal to one (Table 1). Note that the local charge imbalance induced by heterovalent substitutions or X vacancies (Table 1) is compensated by a countercharge homogeneously spread over the system. Although not explicitly accounting for coupled substitutions, this approach makes it possible to disentangle the influence on the OH stretching modes of individual contributions to the chemical disorder.
Table 1Local charge imbalance, theoretical OH stretching frequencies (ωOH) and theoretical O–H distances (d(OH)) in dravite models obtained using the hexagonal cell or a larger hexagonal supercell.
n: number of symmetrically equivalent OH groups, leading to n modes with frequencies within 1.3 cm−1.
As supported by the weakness of the vibrational coupling between single OH oscillators, the OH stretching frequencies in non-ideal dravite models are obtained by restricting the calculation to the dynamical matrix coefficients involving the O and H atoms belonging to the four OH groups of the chemically disordered cluster. In the vacancy-bearing models using a supercell, only the stretching modes of W(OH) or V(OH) groups of the perturbed cluster and occurring as nearest neighbors of the vacant site are reported in Table 1. Based on the analysis of ideal dravite properties, it can be assumed that the OH stretching frequencies are within ∼ 1 cm−1 from those obtained using the full dynamical matrix. This approach is similar to the partial Hessian techniques which are commonly used to analyze the vibrational properties and contribution to zero point energy of selected parts of extended systems (e.g., Li and Jensen, 2002; Svelle et al., 2008; Ghysels et al., 2010; De Moor et al., 2011; Tao et al., 2018; Pascale et al., 2018; Kraka et al., 2020). Their accuracy has been demonstrated for highly localized vibrations, such as OH stretching modes (e.g., Li and Jensen, 2002; Ghysels et al., 2010).
Influence of cationic substitutions at Y and Z sites
Cationic substitutions affecting the Y or Z sites and vacancies at the X site (Fig. 1) modify the geometry of the cluster, and the specific contribution of an OH group to a given mode can be identified by inspecting the related eigendisplacement vectors (Supplement). When the 3-fold symmetry is preserved (Fig. 1), the V(OH) stretching modes correspond to three modes at similar frequencies belonging to the A1 or E representations as in ideal dravite (Table 1). When the symmetry is reduced to a mirror symmetry, one mode corresponds to the OH group located on the mirror plane. The two other OH groups lead to two modes at similar frequencies corresponding to their in-phase or out-of-phase motion (Table 1). Among these two modes, the spectroscopic activity is concentrated in the mode with the in-phase motion of OH groups. For a lower symmetry, the three OH groups are no more equivalent, and three modes are observed at different frequencies (Table 1). It is also noteworthy that the presence of chemical disorder has an effect on the OH stretching frequencies whose magnitude can significantly exceed the weak coupling between single OH oscillators (Table 1). Therefore, it is not possible to establish a symmetry-based filiation between the vibrational patterns in most of the disordered models and those of ideal dravite.
Considering the results obtained for the large hexagonal supercell (Table 1), the theoretical stretching frequency of the W(OH) group decreases to 3808 cm−1 when Al is substituted for Mg at the Y site. The stretching of the V(OH) coordinated to three Al cations is calculated at 3573 cm−1. The two other V(OH) groups coordinated to one YMg and two ZAl cations (as in ideal dravite) are symmetrically equivalent by a mirror symmetry. The two nearly degenerated modes, corresponding to their in-phase or out-of-phase motions, are observed at ∼ 3650 cm−1. This frequency is close to that determined for the similar environment in ideal dravite (3653 cm−1). In the case of the substitution of Mg for Al at the Z site, the cluster looses its 3-fold axial and mirror symmetries. The theoretical stretching frequency of the W(OH) group is calculated at 3860 cm−1, close to the frequency of ideal dravite (3856 cm−1) in which the W(OH) group has a similar local environment. This highlights the fact that the W(OH) site is not significantly influenced by the Z site occupancy. The stretching frequency of the V(OH) group coordinated to YMgZMgZAl cations increases to 3692 cm−1. The two remaining V(OH) groups associated with YMgZAlZAl configurations are no longer symmetrically equivalent (Fig. 1) and lead to modes at 3655 and 3657 cm−1, which is still close to the V(OH) stretching frequency in ideal dravite (3653 cm−1). These results attest to a dominant influence of the occupancy of the nearest-neighbor cationic sites and to a smaller influence (∼ 3 cm−1) of the occupancy of the next-nearest-neighbor sites on the OH stretching frequency.
Influence of Al–Mg inversion
A series of models with different configurations corresponding to Al–Mg disorder over the Y and Z sites (Fig. 1) has been investigated in restricting the calculation to the simple hexagonal cell. Among these configurations (Supplement Table S2), only the one with a Mg–Al inversion at neighboring Y and Z sites has been found to be energetically competitive with the ideal dravite configuration, with an increase in the total energy limited to 13.4 kJ mol−1 (Table S2). The other configurations are significantly less stable (by more than 40 kJ mol−1; Table S2) and therefore less likely to occur at thermodynamic equilibrium, even at temperatures as high as 800 ∘C. This temperature is beyond the low-pressure stability domain of tourmaline (Van Hinsberg et al., 2011) and corresponds to that of the dravite thermal treatment of Bosi et al. (2016). It is higher than the synthesis temperature (600 ∘C) of Berryman et al. (2016).
The properties of the most stable Mg–Al inversion in which YAl and ZMg occur at neighboring sites have then been computed using the larger hexagonal supercell. The W(OH) frequency (3811 cm−1; Table 1) is very close to that determined for the Al substitution at Y site (3808 cm−1; Table 1). The two V(OH) groups coordinated to two ZAl and one YMg lead to frequencies of 3652 and 3654 cm−1, still within 2 cm−1 from those in ideal dravite (3653 cm−1). In contrast, the frequency of the V(OH) group in a YAlZMgZAl environment is calculated at 3611 cm−1, significantly lower than that determined for the YMgZAl2 environment (3653 cm−1). The lower frequency in the inversion model is correlated with a longer OH bond (0.975 vs. 0.972 Å in ideal dravite; Fig. 2), which likely arises from shorter Al–OH distances (1.95 and 1.97 Å) in the inverted configuration than in ideal dravite (1.99 Å). Accordingly, iso-chemical configurations corresponding to various distributions of Al and Mg cations over the Y and Z sites cannot be assumed to be energetically degenerated.
Influence of X site vacancies
In the dravite model with a vacant X site (X□), the vibrational pattern is similar to that of ideal dravite, but OH stretching frequencies are shifted to lower values (Table 1). The W(OH) and V(OH) stretching modes are computed at 3754 and 3628 cm−1, respectively, corresponding to a significant decrease in the stretching frequency of the OH groups in the nearest environment of the vacant site. The presence of a vacancy combined with Al for Mg substitutions at Y sites or Al–Mg inversion also reduces the stretching frequencies with respect to the similar environments in Na-bearing systems (Table 1). For the W(OH) groups, the frequency decrease ranges from approximately −80 to −100 cm−1.
Finally, the interactions between chemically disordered clusters can be assessed by comparing the stretching frequencies obtained for the hexagonal supercell with those obtained for the same configurations but using the smaller simple hexagonal cell (Fig. 3). The differences are within ± 15 cm−1 for the majority of the OH groups. However, larger variations in the stretching frequency, up to 27 cm−1, are observed for both the W(OH) and V(OH) groups in the models combining Al substitutions at Y sites and vacancies at X sites, as well as for the V(OH) group in YAlZAl2-XNa and YAlZAlZMg-X□ configurations. These more significant frequency variations are related to a change in the OH bond length (reaching −0.0018 Å), which indicates that they originate from static interactions between modified clusters in adjacent cells. These observations are particularly significant for the vacancy-bearing models because they suggest that the ordering scheme of X vacancies along the c axis could have a significant effect on the stretching frequencies of the W(OH) and V(OH) groups.
4.1 General properties of OH stretching modes in dravite
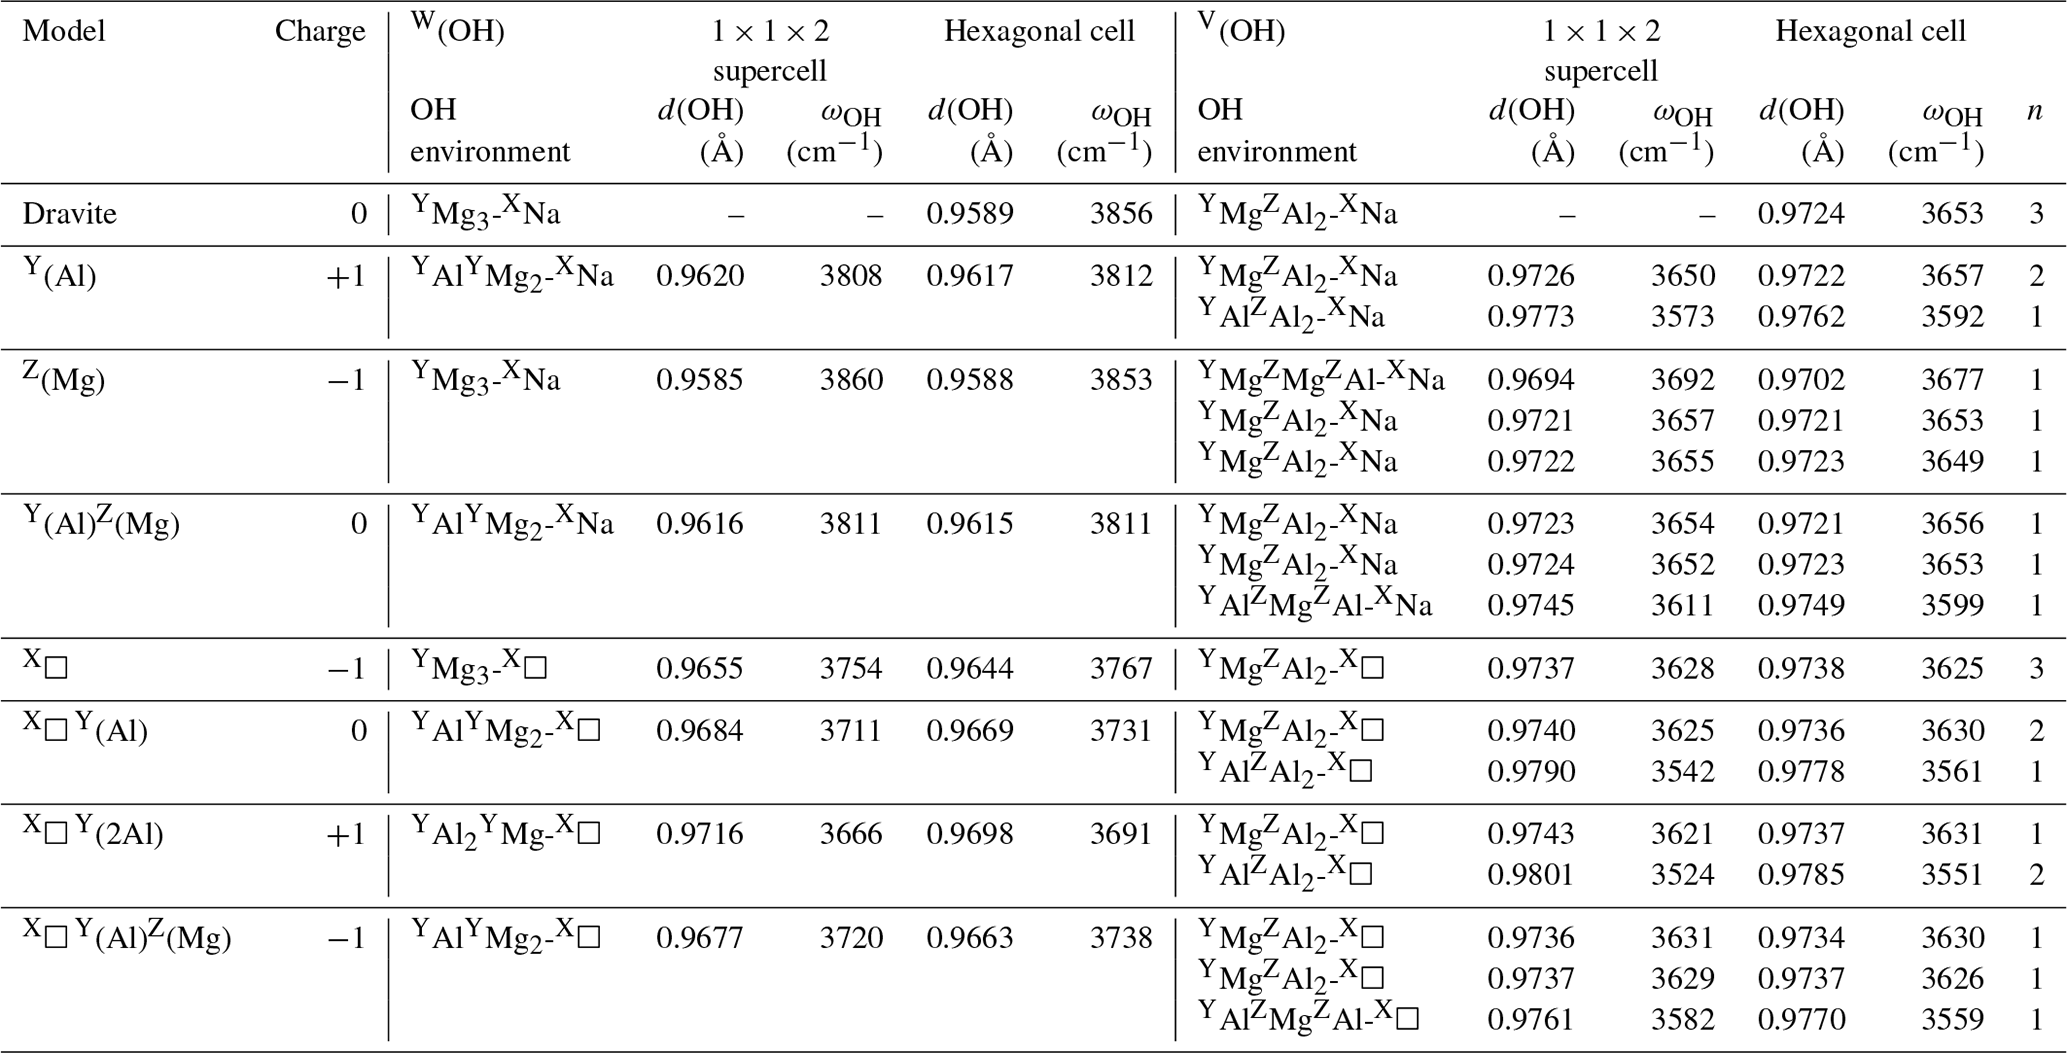
The marginal coupling between single OH stretching vibrations in dravite implies that their frequency is essentially determined by the force constant of the OH bond. Consistently, the OH stretching frequencies in dravite are linearly correlated with the corresponding bond lengths (Fig. 2). The slope of the correlation (−15447 cm−1 Å−1; Fig. 2) is consistent with that theoretically determined for an OH− ion submitted to an external electric field (−16000 cm−1 Å−1) by Hermansson (1993), as well as with those theoretically determined, for example, for OH defects in quartz (−17270 cm−1 Å−1; Jollands et al., 2020) and corundum (−18878 cm−1 Å−1; Balan, 2020). Through the modifications of the OH bond length, the stretching frequencies depend on the chemical nature of atoms in their local environment, with a lesser influence of the occupancy of sites beyond the first coordination sphere. However, it is noteworthy that the expected relation between the OH stretching frequency and the sum of nearby cationic charges is not strictly followed. This is particularly the case for the Mg–Al inversion, in which the stretching frequency of the V(OH) group in a YAlZAlZMg-XNa environment (3611 cm−1) is significantly lower than that corresponding to a YMgZAlZAl-XNa environment (3653 cm−1). Similar frequency variations are observed for the equivalent configurations with X vacancies (Table 1).
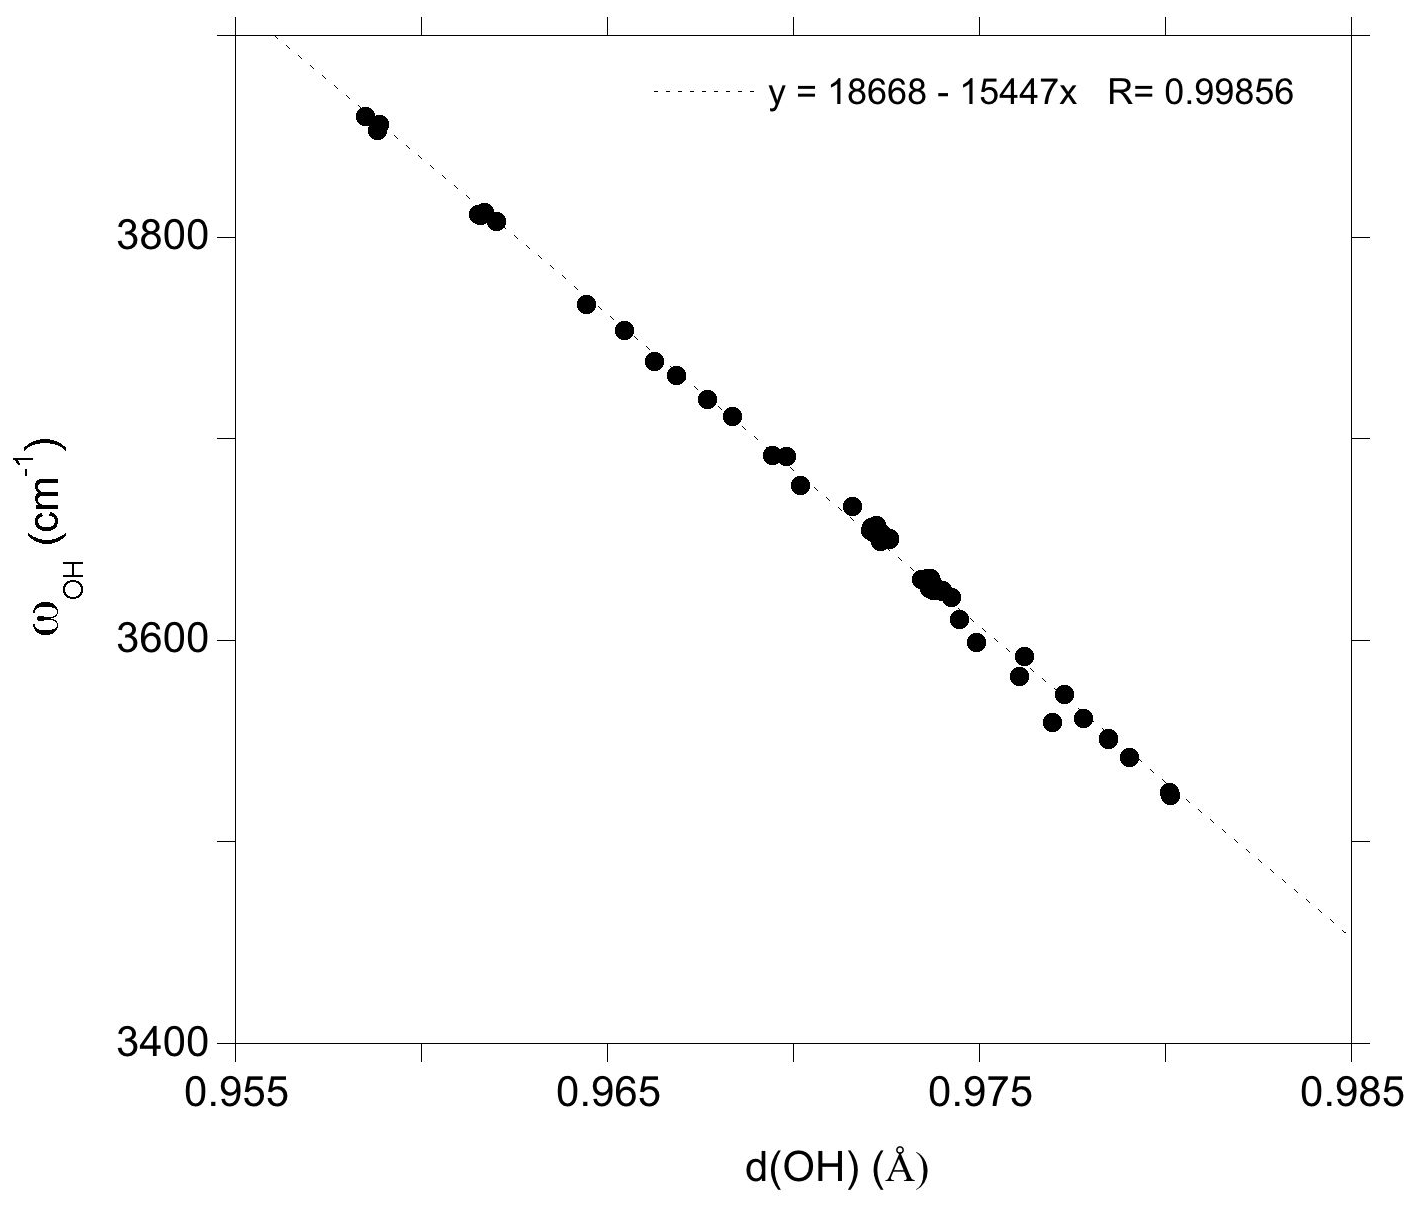
Figure 2Relation between theoretical OH stretching frequency (ωOH) and OH bond length (d(OH)) in dravite models ( supercell and hexagonal cell; Table 1).
Figure 3Difference between the OH stretching frequencies computed using a simple hexagonal cell and a larger supercell () reported as a function of the frequencies computed for the supercell (Table 1). Squares: V(OH) groups; circles: W(OH) groups. Full symbols: models with a vacant X site; open symbols: models with full Na occupation of X sites.
Modifications of Y or Z site occupancies, which shift the stretching frequency of the neighboring OH group by typically more than 20 cm−1, are significantly stronger than the vibrational coupling between single OH groups (<1 cm−1). Thus, these modifications cannot be considered as a weak perturbation of the vibrational properties of the ideal system. This shift however still corresponds to a weak perturbation of the internal stretching of single OH groups (>3400 cm−1), supporting the use of OH stretching modes as a local probe of chemical disorder. This behavior differs from that of lattice excitations in mixed crystals, which present a collective response to local mass or force constant variations (Chang and Mitra, 1971). In particular, it does not appear necessary to consider a collective response of all three V(OH) groups belonging to a given 3(YZZ) cluster in the interpretation of the V(OH) stretching bands. The present theoretical results support a traditional interpretation of observed V(OH) frequencies based on the cationic occupancy of the sites coordinated to the OH group (e.g., Berryman et al., 2016; Kutzschbach et al., 2017; Piecza et al., 2020).
Although the OH groups of a specific cluster are not vibrationally coupled to each other or to those of other clusters, the local modification of cationic occupancies can affect the properties of more distant OH groups through electrostatic interactions or propagation of structural distortions. The influence of chemical disorder on OH groups in the medium range of the modified sites can be assessed by examining the bond length of the W(OH) and V(OH) groups associated with the ideal YMg3-XNa and YMgZAl2-XNa environments, respectively, in the chemically disordered models. In this case, departure from the bond lengths determined in ideal dravite can be ascribed to the chemical modification of sites beyond their first coordination sphere. Using the correlation between stretching frequency and bond length, it then possible to assess the related distribution of stretching frequencies (Fig. 4). For the supercell models (Table 1), most of the stretching frequencies of the W(OH) in YMg3-XNa environment occur within a ∼ 15 cm−1 range. A similar range is observed for the V(OH) groups in YMgZAl2-XNa environment. Excluding the specific interactions involving the ordering of X site vacancies, these ranges are consistent with the magnitude of interactions inferred for the modified clusters by comparing the stretching frequencies in the supercell and the smaller hexagonal cell (Fig. 3).

Figure 4Distribution of the theoretical OH stretching frequencies determined from the length of OH bonds in ideal local configurations in chemically disordered models ( supercells). The theoretical frequencies of ideal dravite are reported. The observed distributions attest to the static interaction between the sites with modified occupancies and their medium-range environment.
The distribution of frequencies related to the occupancy of sites beyond the nearest-neighbor environment of OH groups can contribute to the broadening of the OH stretching signals for ∼ 15 cm−1. This value has been assessed from a limited number of cationic configurations, and it is likely that the higher number of configurations in real samples further increases the broadening. In addition, extended chemical variations as observed in solid solutions can lead to variations in the cell geometry (e.g., Bosi and Lucchesi, 2004). Local strain contributions not accounted for in the present modeling (performed at constant volume) can also indirectly influence the V(OH) and W(OH) stretching frequencies, contributing to their distribution in chemically complex samples. In comparison, the homogeneous broadening of the OH stretching bands is expected to be of smaller magnitude. This broadening is due to the finite lifetime of the vibrational excitations. It arises from anharmonic phonon–phonon interactions related to coupling terms involving third- and higher-order derivatives of the total energy with respect to atomic displacements. In general, the high frequency of OH stretching modes limits energy decay processes and favors dephasing processes related to phonon–phonon scattering (e.g., Bonn et al., 1996). These anharmonic effects usually induce a moderate broadening of the OH stretching bands as a function of temperature (e.g., Zhang et al., 2007; Balan et al., 2010). The weak temperature dependence of the OH stretching line shape in the Raman and infrared spectra of tourmaline reported by Zhao et al. (2012) and Watenphul et al. (2017) confirms that homogeneous broadening mechanisms should not play a dominant role in the observed linewidth. Accordingly, inhomogeneous contributions related to disorder have a most likely dominant control on the width of the FTIR or Raman OH stretching bands in tourmaline.
4.2 Interpretation of the dravite vibrational spectra in the OH stretching range
Turning to the interpretation of experimentally observed bands, we mainly focus on synthetic samples because their controlled chemical composition reduces the number of possible configurations, facilitating the interpretation. However, the proposed interpretations should also hold for natural samples close to end-members such as those investigated by Bosi et al. (2016) and Watenphul et al. (2016). Note that reported experimental frequencies can also vary within a few wavenumbers depending on the studies and investigated samples.
The W(OH) bands reported by Berryman et al. (2016) at 3778 and 3739 cm−1 in synthetic dravite (sample EB28 with composition Na0.84K0.02□ 0.13Mg2.52Al6.73Si5.72O18(BO(OH)(OH)) can be ascribed to YMg3-XNa and YAlYMg2-XNa environments, respectively. A consensus exists on these assignments (Berryman et al., 2016; Watenphul et al., 2016; Bosi et al., 2016), which correspond to an upshift of theoretical frequencies with respect to their experimental counterparts amounting to ∼ 75 cm−1 (Fig. 5). Similar systematic shifts have been observed in previous theoretical studies of OH defects in quartz, corundum and diopside with values ranging from ∼ 10 to 125 cm−1, depending on the system (Jollands et al., 2020; Balan et al., 2020; Balan, 2020). Such a systematic difference between the theoretical and observed OH stretching frequencies results from the approximate cancelation of errors introduced by the use of the PBE XC functional and the neglect of OH anharmonicity (Balan et al., 2007).
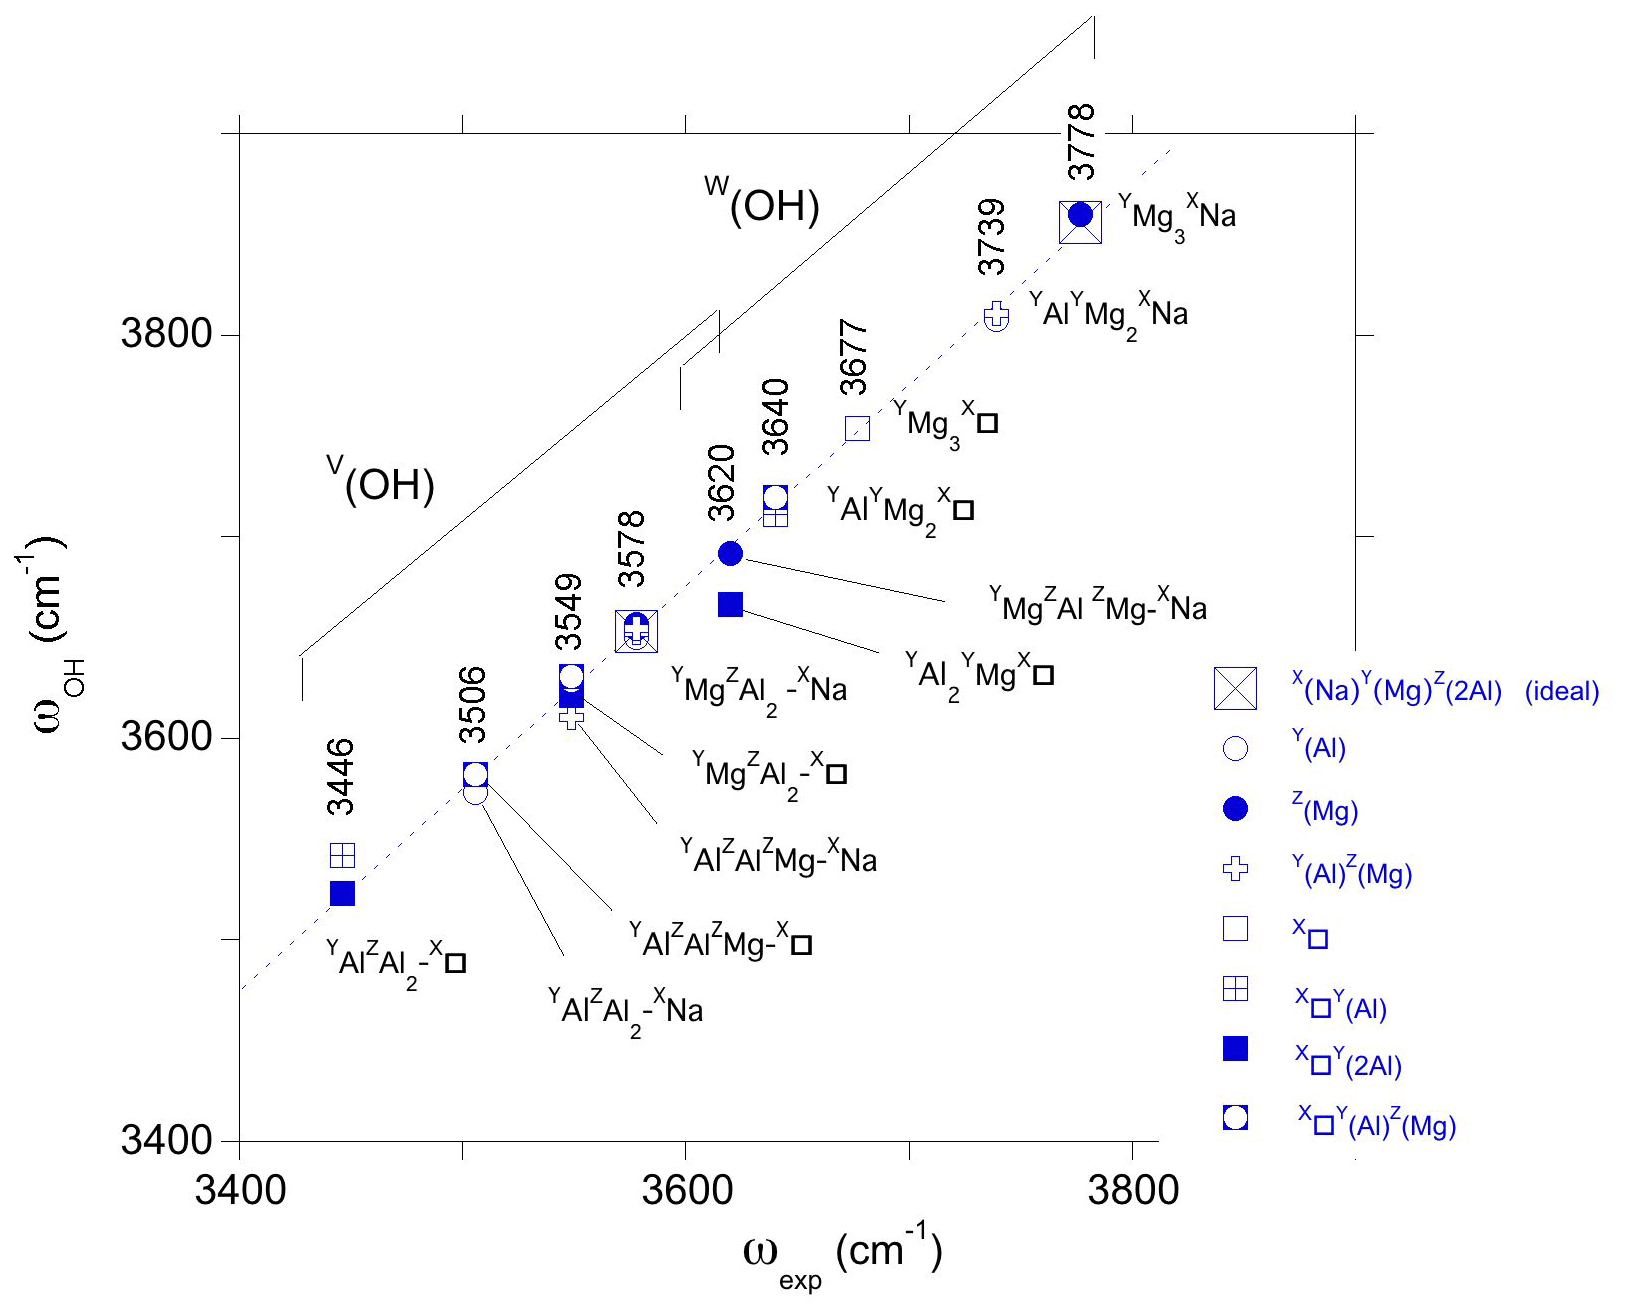
Figure 5Relation between theoretical (ωOH, Table 1) and experimental (ωexp) OH stretching frequencies in dravite. The theoretical frequencies are those of the larger supercell models. Experimental frequencies are indicated (sample EB28 of Berryman et al., 2016, except the 3677 cm−1 frequency from Gourdant and Robert, 1997). The dotted line corresponds to the equation cm−1.
Assuming that the shift is systematic and holds for the other types of OH environments, the present results support the following assignments. The band at 3677 cm−1 reported in synthetic dravite samples by Gourdant and Robert (1997) can be ascribed to W(OH) in a YMg3-X□ environment. Similarly, the band at 3640 cm−1 reported by Berryman et al. (2016) can be related to W(OH) in a YAlYMg2-X□ environment. These two interpretations are consistent with those previously proposed from the analysis of experimental data. Based on the present results, the weaker band at 3620 cm−1 (Berryman et al., 2016) could however better correspond to V(OH) groups in a YMgZAlZMg-XNa environment than to W(OH) groups in a YAl2YMg-X□ environment. This last YAl2YMg-X□ environment in dravite is expected to lead to a band at lower frequency, overlapping with the strong band related to V(OH) groups (Fig. 5).
Still assuming that the systematic difference between theoretical and experimental frequencies is valid for the V(OH) groups, the three components identified in the broad V(OH) band by Berryman et al. (2016) can be assigned to specific environments of OH groups. The highest component at 3577–3578 cm−1 is ascribed to a YMgZAlZAl-XNa environment, and the broad component at 3549 cm−1 arises from contributions of YAlZAlZMg-XNa (i.e., Mg–Al inversion) and YMgZAl2-X□ environments. The component at 3506–3513 cm−1 is associated with both YAlZAl2-XNa and YAlZAlZMg-X□ environments. Finally, the weaker component at 3446 cm−1 could be assigned to a YAlZAl2-X□ environment.
The present theoretical results also suggest that the W(OH) and V(OH) stretching frequencies are sensitive to the ordering of X vacancies along the c axis. Accordingly, the frequencies determined for a more dilute configuration corresponding to the hexagonal supercell were compared to observations made on dravite samples. In contrast, those obtained using the smaller hexagonal cell should be more relevant to samples with a high concentration of X vacancies. This is the case of magnesio-foitite, which is an Al-rich Mg–Al tourmaline with vacant X site. The Raman spectrum of the synthetic MF2 sample of Berryman et al. (2016) with a Na0.01□0.98Mg1.97Al7.24Si5.83O18(BO(OH)4 composition displays two well-defined bands at 3619 and 3657 cm−1 and a strong band at 3551 cm−1. A broader asymmetric band has been fitted using two components at 3459 and 3511 cm−1, the latter having a full-width at half maximum (FWHM) of ∼ 100 cm−1. A comparison of theoretical and experimental frequencies can thus be done using the frequencies of vacancy-bearing models determined using the simple hexagonal cell (Fig. 6). In this comparison, the potential effect of the small unit-cell contraction experimentally observed between dravite and magnesio-foitite (−0.7 %; Berryman et al., 2016) is neglected. On the basis of the correlation between theoretical and experimental frequencies established for dravite, the two bands at 3619 and 3657 cm−1 could be related to W(OH) groups in YAl2YMg-X□ and YAlYMg2-X□ environments, respectively. In this case, the upshift of the W(OH) frequency due the X site vacancy ordering explains why the dravite band at 3640 cm−1 is not observed in synthetic Mg-foitite, which has X sites almost vacant (Veličkov, 2002; Berryman et al., 2016). Compared with dravite, the lack of YAlZMg2-XNa environments and the upshift of the YAl2YMg-X□ W(OH) frequency lead to the well-defined band at 3619 cm−1. This is a further indication that the 3620–3622 cm−1 component in dravite does not correspond to W(OH) groups in an YAl2YMg-X□ environment. On the same level, the band at 3551 cm−1 can be ascribed to V(OH) in a YMgZAl2-X□ environment, and the component at 3459 cm−1 corresponds to V(OH) in a YAlZAl2-X□ environment. Finally, the broad component at 3511 cm−1 is more difficult to assign to a single environment. Contributions from the YAlZAlZMg-X□ environment can be expected (Fig. 6), but its width indicates that multiple configurations, for example, related to ordered X vacancies interacting with disordered Al–Mg occupations over the Y and Z sites along the c-axis, likely contribute to this component.
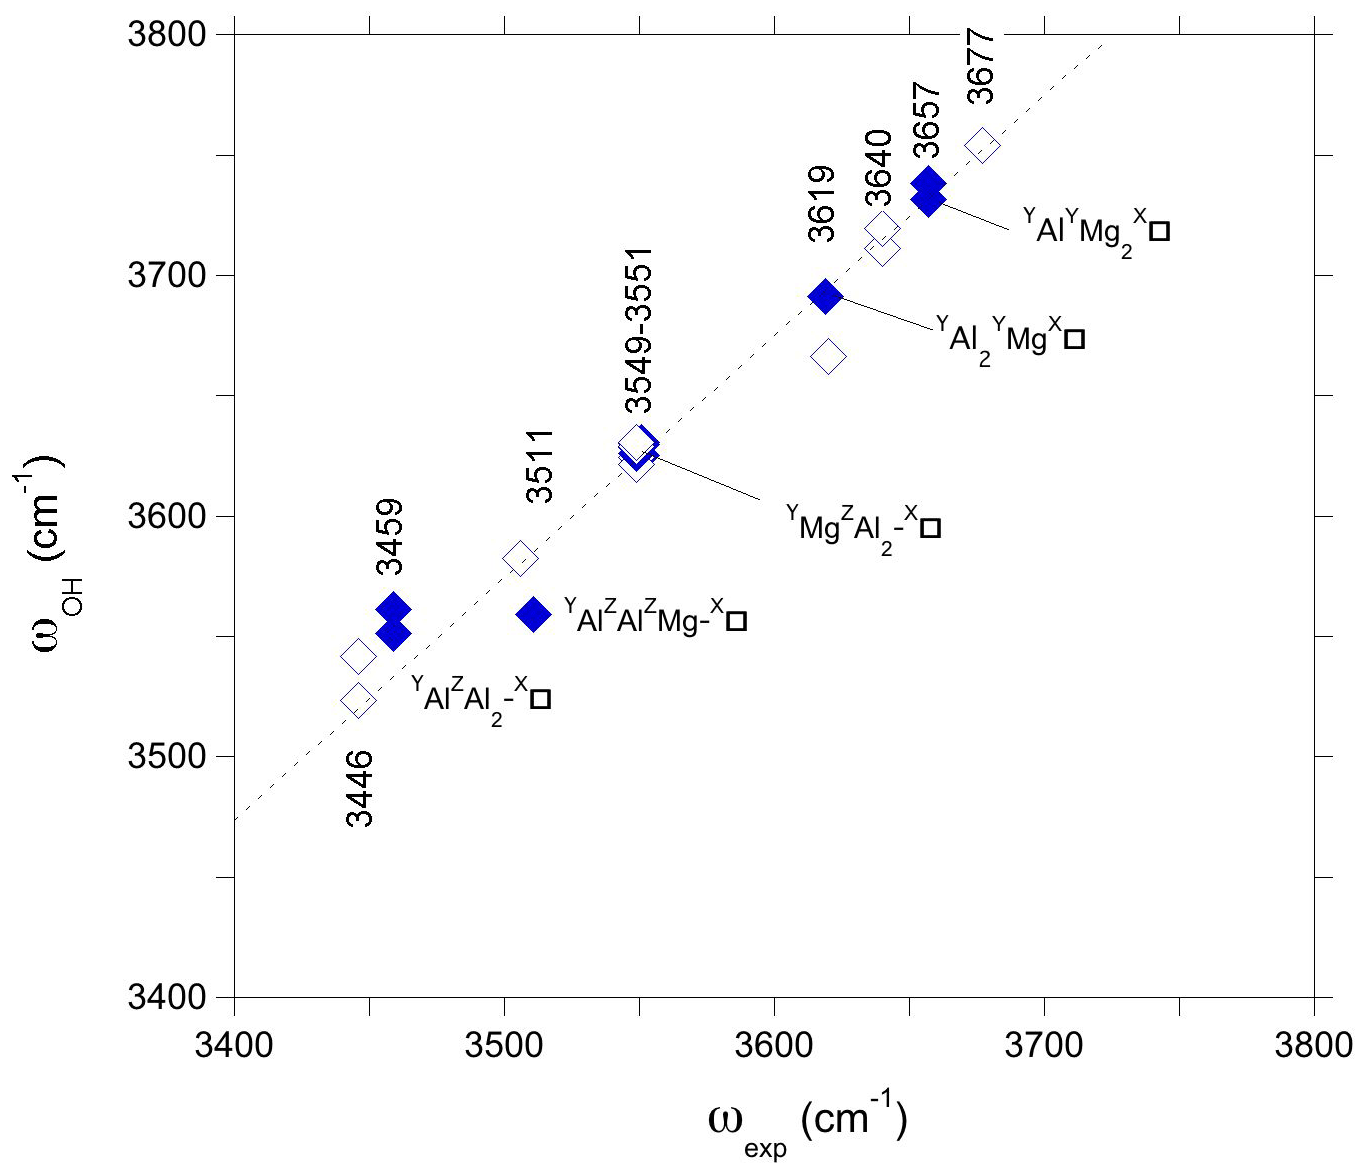
Figure 6Theoretical OH stretching frequencies of models with vacant X sites obtained using the simple hexagonal cell (Table 1) (full symbols) reported as a function of the experimental (ωexp) OH stretching frequencies of the Mg-foitite MF2 sample of Berryman et al. (2016). For comparison with Fig. 5, the theoretical frequencies obtained for the larger supercell (corresponding to a more dilute vacancy concentration) are reported as a function of the experimental frequencies of dravite (open symbols). The dotted line corresponds to the equation cm−1.
Although the present assignments (Table 2) partly differ from those previously proposed by Berryman et al. (2016) and Bosi et al. (2016) using the “traditional” approach, they could help resolve the apparent inconsistency between the relative area of the spectroscopic components identified in the V(OH) band and a realistic inter-site distribution of cations (Bosi et al., 2016). The fit reported by Berryman et al. (2016) leads to a relative area reaching 37 % for the high-frequency component at 3577–3578 cm−1, and its counterpart reported by Bosi et al. (2016) at 3563 cm−1 in a natural dravite sample has a relative area of 63 %, far from the occurrence probability expected for YMgZAlZMg-XNa environments (17 %) in this sample. The present assignment of the high-frequency components of the V(OH) band to the local YMgZAl2-XNa environment is thus more consistent with a higher occurrence probability of the ideal environment in dravite samples close to end-member compositions (estimated at 39 % in Bosi et al., 2016). In the same line, the assignment of the bands at 3619 and 3657 cm−1 to W(OH) groups in YAl2YMg-X□ and YAlYMg2-X□ environments, respectively, is consistent with the Al-rich character of magnesio-foitite.
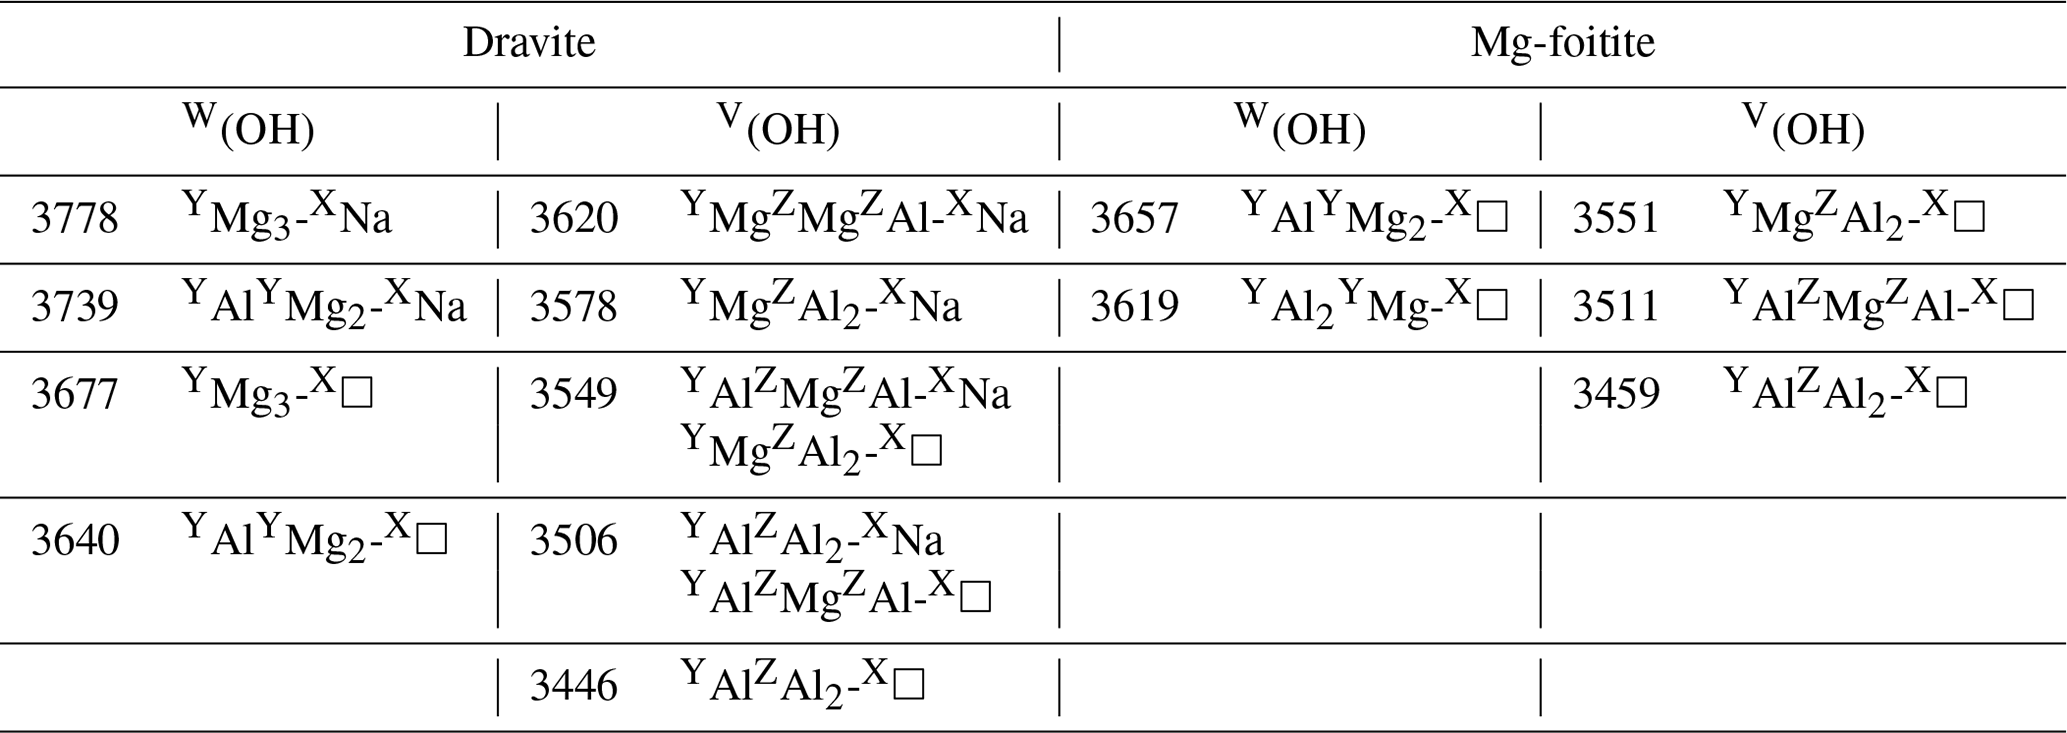
Table 2Proposed interpretations of experimental bands in synthetic dravite and magnesio-foitite. Experimental frequencies (cm−1) are those of samples EB28 and MF2 of Berryman et al. (2016), except the 3677 cm−1 frequency from Gourdant and Robert (1997). The broad component at 3511 cm−1 in Mg-foitite likely corresponds to multiple configurations.
In natural samples, the F for OH substitution and the partial deprotonation of OH groups related to Ca2+ incorporation at the X site also contribute to challenges in constraining compositions from OH stretching band areas. In addition, the fit of broad and asymmetric bands such as the V(OH) band depends on the assumptions made on the number and line shape of individual components and on the baseline subtraction (Meier, 2005). The corresponding uncertainty in the relative area of individual components thus complicates the use of vibrational spectroscopy to infer reliable inter-site distribution of cations in natural or synthetic samples when the corresponding signals overlap and form broad spectroscopic bands. In this context, the theoretical shifts of V(OH) frequencies predicted for specific YZZ or X occupancies could be used as independent constraints to fit the experimental V(OH) signal.
We have theoretically analyzed the OH stretching properties of a series of ideal and chemically disordered dravite models using DFT. The results show that the OH stretching dynamic in this system can be understood by considering an ensemble of weakly coupled single oscillators.
Localization is a general feature of OH stretching modes related to the low mass of the H atom, which ensures their significant frequency separation and related minimal coupling with the other vibrational modes. This frequency separation is commonly observed in hydrous minerals and hydrous defects in oxides and nominally anhydrous minerals (e.g., Farmer, 1974; Wöhlecke and Kovács, 2001; Libowitzky and Beran, 2006). It supports the use of partial Hessian techniques to analyze the OH stretching modes in extended systems while keeping the computational cost at a reasonable level (e.g., Ghysels et al., 2010).
The weak harmonic coupling observed between single V(OH) oscillators in dravite is consistent with their relatively distant positions within a single cluster (∼ 6.5 Å) or between adjacent clusters (∼ 5.5 Å). For comparison, OH groups located in the same oxygen plane in talc are ∼ 5.3 Å apart, and it is well established that their stretching frequency is locally determined by the occupancy of neighboring sites in chemically disordered samples (e.g., Farmer, 1974; Petit et al., 2004; Blanchard et al., 2018).
The present results thus support a traditional interpretative model which assumes that the local environment of a single OH group has a determining influence on its stretching frequency (e.g., Berryman et al., 2016; Kutzschbach et al., 2017; Piecza et al., 2020). Vacancies at the X site were however found to affect the W(OH) and V(OH) frequencies on a longer scale, contributing to the differences observed between the dravite and Mg-foitite spectra (Berryman et al., 2016). The same theoretical approach could be used in conjunction with a combination of other experimental techniques sensitive to short- or long-range crystal order to unravel the complex cationic ordering in other tourmaline groups or other complex hydrous silicates such as amphiboles (Hawthorne, 2016).
PWscf and PHonon codes (Giannozzi et al., 2009) are available at http://www.quantum-espresso.org/. The pseudo-potentials (Schlipf and Gygi, 2015) are available at http://www.quantum-simulation.org/potentials/sg15_oncv/. Structures and eigendisplacement vectors of OH stretching modes are provided in the Supplement. Structure drawings have been done using the VESTA software (https://jp-minerals.org/vesta/en/, Momma and Izumi, 2011). Specific requests should be addressed to Etienne Balan (etienne.balan@sorbonne-universite.fr).
The supplement related to this article is available online at: https://doi.org/10.5194/ejm-34-239-2022-supplement.
YF, CF and EB contributed to the conception of the study, discussion of the results and preparation of the manuscript. EB performed the calculations.
At least one of the (co-)authors is a member of the editorial board of European Journal of Mineralogy. The peer-review process was guided by an independent editor, and the authors also have no other competing interests to declare.
Publisher's note: Copernicus Publications remains neutral with regard to jurisdictional claims in published maps and institutional affiliations.
We thank Eleanor Berryman for her insightful review of an initial version of the manuscript. Calculations have been performed using the computing resources of IMPMC (Sorbonne Université, CNRS, MNHN) and the HPC resources of IDRIS under the allocation 2021-A0080910820 attributed to GENCI (Grand Equipement National de Calcul Intensif).
This paper was edited by Tiziana Boffa Ballaran and Reto Gieré and reviewed by Eleanor Berryman and two anonymous referees.
Balan, E.: Theoretical infrared spectra of OH defects in corundum (α-Al2O3), Eur. J. Mineral., 32, 457–467, https://doi.org/10.5194/ejm-32-457-2020, 2020.
Balan, E., Saitta, A. M., Mauri, F., and Calas, G.: First-principles modeling of the infrared spectrum of kaolinite, Am. Mineral., 86, 1321–1330, https://doi.org/10.2138/am-2001-11-1201, 2001.
Balan, E., Saitta, A. M., Mauri, F., Lemaire, C., and Guyot, F.: First-principles calculation of the infrared spectrum of lizardite, Am. Mineral., 87, 1286–1290, https://doi.org/10.2138/am-2002-1003, 2002.
Balan, E., Lazzeri, M., Saitta, A. M., Allard, T., Fuchs, Y., and Mauri, F.: First-principles study of OH stretching modes in kaolinite, dickite and nacrite, Am. Mineral., 90, 50–60, https://doi.org/10.2138/am.2005.1675, 2005.
Balan, E., Lazzeri, M., Delattre, S., Meheut, M., Refson, K., and Winkler, B.: Anharmonicity of inner-OH stretching modes in hydrous phyllosilicates: assessment from first-principles frozen- phonon calculations, Phys. Chem. Miner., 34, 621–625, https://doi.org/10.1007/s00269-007-0176-4, 2007.
Balan, E., Delattre, S., Guillaumet, M., and Salje, E. K. H.: Low-temperature infrared spectroscopic study of OH stretching modes in kaolinite and dickite, Am. Mineral., 95, 1257–1266, https://doi.org/10.2138/am.2010.3447, 2010.
Balan, E., Blanchard, M., Lazzeri, M., and Ingrin, J.: Theoretical Raman spectrum and anharmonicity of tetrahedral OH defects in hydrous forsterite, Eur. J. Mineral., 29, 201–212, https://doi.org/10.1127/ejm/2017/0029-2599, 2017.
Balan, E., Créon, L., Sanloup, C., Aléon, J., Blanchard, M., Paulatto, L., and Bureau, H.: First-principles modeling of chlorine isotope fractionation between chloride-bearing molecules and minerals, Chem. Geol., 525, 424–434, https://doi.org/10.1016/j.chemgeo.2019.07.032, 2019.
Baroni, S., de Gironcoli, S., Dal Corso, A., and Giannozzi, P.: Phonons and related crystal properties from density-functional perturbation theory, Rev. Mod. Phys., 73, 515–561, https://doi.org/10.1103/RevModPhys.73.515, 2001.
Berryman, E. J., Wunder, B., Ertl, A., Koch-Müller, M., Rhede, D., Scheidl, K, Giester, G., and Heinrich, W.: Influence of the X-site composition on tourmaline's crystal structure: investigation of synthetic K-dravite, dravite, oxy-uvite, and magnesio-foitite using SREF and Raman spectroscopy, Phys. Chem. Miner., 43, 83–102, https://doi.org/10.1007/s00269-015-0776-3, 2015.
Blanchard, M., Meìheut, M., Delon, L., Poirier, M., Micoud, P., Le Roux, C., and Martin, F.: Infrared spectroscopic study of the synthetic Mg-Ni talc series, Phys. Chem. Miner., 45, 843–854, https://doi.org/10.1007/s00269-018-0966-x, 2018.
Bonn, M., Brugmans, M. J., Kleyn, A. W., van Santen, R. A., and Bakker, H. J.: Vibrational dephasing mechanisms in hydrogen-bonded systems, Phys. Rev. Lett., 76, 2440–2443, https://doi.org/10.1103/PhysRevLett.76.2440, 1996.
Bosi, F. and Lucchesi, S.: Crystal chemistry of the schorl-dravite series, Eur. J. Miner., 16, 335–344, https://doi.org/10.1127/0935-1221/2004/0016-0335, 2004.
Bosi, F., Skogby, H., and Balić-Žunić, T.: Thermal stability of extended clusters in dravite: a combined EMP, SREF and FTIR study, Phys. Chem. Miner., 43, 395–407, https://doi.org/10.1007/s00269-016-0804-y, 2016.
Bronzova, Y., Babushkina, M., Frank-Kamenetskaya, O., Vereshchagin, O., Rozhdestvenskaya, I., and Zolotarev, A.: Short-range order in Li–Al tourmalines: IR spectroscopy, X-ray single crystal diffraction analysis and a bond valence theory approach, Phys. Chem. Miner., 46, 815–825, https://doi.org/10.1007/s00269-019-01042-0, 2019.
Califano, S., Schettino, V., and Neto, N.: Lattice dynamics of molecular crystals, Lecture Notes in Chemistry, 26, Springer-Verlag, Berlin, https://doi.org/10.1007/978-3-642-93186-4, 1981.
Chang, I. F. and Mitra, S. S.: Long wavelength optical phonons in mixed crystals, Adv. Phys., 20, 359–404, https://doi.org/10.1080/00018737100101271, 1971.
De Moor, B. A., Ghysels, A., Reyniers, M. F., Van Speybroeck, V., Waroquier, M., and Marin, G. B.: Normal mode analysis in zeolites: Toward an efficient calculation of adsorption entropies, J. Chem. Theory Comput., 7, 1090–1101, https://doi.org/10.1021/ct1005505, 2011.
Fantini, C., Tavares, M., Krambrock, K., Moreira, R., and Righi, A.: Raman and infrared study of hydroxyl sites in natural uvite, fluor-uvite, magnesio-foitite, dravite and elbaite tourmalines, Phys. Chem. Miner., 41, 247–254, https://doi.org/10.1007/s00269-013-0642-0, 2014.
Farmer, V. C.: The infrared spectra of minerals, Mineralogical Society Monograph, Mineralogical Society, London, https://doi.org/10.1180/mono-4, 1974.
Gatta, G. D., Bosi, F., Mcintyre, G. J., and Skogby, H.: First accurate location of two proton sites in tourmaline: A single-crystal neutron diffraction study of oxy-dravite, Miner. Mag., 78, 681–692, https://doi.org/10.1180/minmag.2014.078.3.15, 2014.
Ghysels, A., Van Speybroeck, V., Pauwels, E., Catak, S., Brooks, B. R., Van Neck, D., and Waroquier, M.: Comparative study of various normal mode analysis techniques based on partial Hessians, J. Comput. Chem., 31, 994–1007, https://doi.org/10.1002/jcc.21386, 2010.
Giannozzi, P., Baroni, S., Bonini, N., Calandra, M., Car, R., Cavazzoni, C., Ceresoli, D., Chiarotti, G. L., Cococcioni, M., Dabo, I., Dal Corso, A., de Gironcoli, S., Fabris, S., Fratesi, G., Gebauer, R., Gerstmann, U., Gougoussis, C., Kokalj, A., Lazzeri, M., Martin-Samos, L., Marzari, N., Mauri, F., Mazzarello, R., Paolini, S., Pasquarello, A., Paulatto, L., Sbraccia, C., Scandolo, S., Sclauzero, G., Seitsonen, A. P., Smogunov, A., Umari, P., and Wentzcovitch, R. M.: Quantum ESPRESSO: a modular and open-source software project for quantum simulations of materials, J. Phys.-Cond. Mat., 21, 395502, https://doi.org/10.1088/0953-8984/21/39/395502, 2009 (code available at: http://www.quantum-espresso.org/, last access: 13 March 2022).
Gonzalez-Carrenño, T., Fernandez, M., and Sanz, J.: Infrared and electron microprobe analysis of tourmalines, Phys. Chem. Miner., 15, 452–460, https://doi.org/10.1007/BF00311124, 1988.
Gourdant, J.-P. and Robert, J.-L.: Tourmalines in the system Na2O–MgO–Al2O3–Ga2O3–B2O3–SiO2–H2O: an experimental and crystal–chemical investigation, in: Tourmaline 1997: international symposium on Tourmaline (Nové Město na Moravě, Czech Republic), Abstracts, Ministry of Education, Czech Republic, 30–31, 1997.
Halonen, L. and Child, M. S.: Local mode theory for C3V molecules: CH3D, CHD3, SiH3D, and SiHD3, J. Chem. Phys., 79, 4355, https://doi.org/10.1063/1.446317, 1983.
Hamann, D. R.: Optimized norm-conserving Vanderbilt pseudopotentials, Phys. Rev. B, 88, 085117, https://doi.org/10.1103/PhysRevB.88.085117, 2013.
Hawthorne, F. C.: Short-range atomic arrangements in minerals, I: The minerals of the amphibole, tourmaline and pyroxene supergroups, Eur. J. Mineral., 28, 513–536, https://doi.org/10.1127/ejm/2016/0028-2538, 2016.
Hawthorne, F. C., MacDonald, D. J., and Burns, P. C.: Reassignment of cation site occupancies in tourmaline: Al-Mg disorder in the crystal structure of dravite, Am. Mineral., 78, 265–270, 1993.
Henry, D. J., Novák, M., Hawthorne, F. C., Ertl, A., Dutrow, B. L., Uher, P., and Pezzotta, F.: Nomenclature of the tourmaline-supergroup minerals, Am. Mineral., 96, 895–913, https://doi.org/10.2138/am.2011.3636, 2011.
Hermansson, K.: Redshifts and blueshifts of OH vibrations, Int. J. Quant. Chem., 45, 747–758, https://doi.org/10.1002/qua.560450621, 1993.
Jollands, M. C., Blanchard, M., and Balan, E.: Structure and infrared spectra of OH-defects in quartz, Eur. J. Mineral., 32, 311–323, https://doi.org/10.5194/ejm-32-311-2020, 2020.
Kraka, E., Zou, W., and Tao, Y.: Decoding chemical information from vibrational spectroscopy data: Local vibrational mode theory, WIREs Comput. Mol. Sci., 10, 1480, https://doi.org/10.1002/wcms.1480, 2020.
Kutzschbach, M., Wunder, B., Krstulovic, M., Ertl, A., Trumbull, R., Rocholl, A., and Giester, G.: First high-pressure synthesis of rossmanitic tourmaline and evidence for the incorporation of Li at the X site, Phys. Chem. Miner., 44, 353–363, https://doi.org/10.1007/s00269-016-0863-0, 2017.
Leslie, M. and Gillan, M. J.: The energy and elastic dipole tensor of defects in ionic crystals calculated by the supercell method, J. Phys. Chem., 18, 973–982, https://doi.org/10.1088/0022-3719/18/5/005, 1985.
Li, H. and Jensen, J.: Partial Hessian vibrational analysis: the localization of the molecular vibrational energy and entropy, Theor. Chem. Acc., 107, 211–219, https://doi.org/10.1007/s00214-001-0317-7, 2002.
Liang, Y., Tang, X., Zhu, Q., Han, J., and Wang, C.: A review: Application of tourmaline in environmental fields, Chemosphere, 281, 130780, https://doi.org/10.1016/j.chemosphere.2021.130780, 2021.
Libowitzky, E. and Beran, A.: The structure of hydrous species in nominally anhydrous minerals: Information from polarized IR spectroscopy, Rev. Mineral. Geochem., 62, 29–52, https://doi.org/10.2138/rmg.2006.62.2, 2006.
Meier, R. J.: On art and science in curve-fitting vibrational spectra, Vib. Spectrosc., 39, 266–269, https://doi.org/10.1016/j.vibspec.2005.03.003, 2005.
Mitev, P. D., Hermansson, K., and Briels, W. J.: Calculation of anharmonic OH phonon dispersion curves for the Mg(OH)2 crystal, J. Chem. Phys., 133, 034120, https://doi.org/10.1063/1.3458001, 2010.
Momma, K. and Izumi, F.: VESTA 3 for three-dimensional visualization of crystal, volumetric and morphology data, J. Appl. Crystallogr., 44, 1272–1276, https://doi.org/10.1107/S0021889811038970, 2011 (software available at: https://jp-minerals.org/vesta/en/, last access: 3 April 2022).
Pascale, F., Salustro, S., Ferrari, A. M., Rérat, M., D'Arco, P., and Dovesi, R.: The Infrared spectrum of very large (periodic) systems: global versus fragment strategies – the case of three defects in diamond, Theor. Chem. Acc., 137, 1–7, https://doi.org/10.1007/s00214-018-2380-3, 2018.
Perdew, J. P., Burke, K., and Ernzerhof, M.: Generalized gradient approximation made simple, Phys. Rev. Lett., 77, 3865–3868, https://doi.org/10.1103/PhysRevLett.77.3865, 1996.
Petit, S., Martin, F., Wiewiora, A., De Parseval, P., and Decarreau, A.: Crystal-chemistry of talc: a near infrared (NIR) spectroscopy study, Am. Mineral., 89, 319–326, https://doi.org/10.2138/am- 2004-2-310, 2004.
Pieczka, A., Ertl, A., Gołębiowska, B., Jeleń, P., Kotowski, J., Nejbert, K., Stachowicz, M., and Giester, G.: Crystal structure and Raman spectroscopic studies of OH stretching vibrations in Zn-rich fluor-elbaite, Am. Mineral., 105, 1622–1630, https://doi.org/10.2138/am-2020-7360, 2020.
Salje, E. K. H. and Bismayer, U.: Hard mode spectroscopy: The concept and applications, Phase Transit., 63, 1–75, https://doi.org/10.1080/01411599708228789, 1997.
Schlipf, M. and Gygi, F.: Optimization algorithm for the generation of ONCV pseudopotentials, Comput. Phys. Commun., 196, 36–44, https://doi.org/10.1016/j.cpc.2015.05.011, 2015 (pseudopotentials available at: http://www.quantum-simulation.org/potentials/sg15_oncv/, last access: 12 March 2022).
Svelle S., Tuma C., Rozanska, X., Kerber, T., and Sauer, J.: Quantum chemical modeling of zeolite-catalyzed methylation reactions: Toward chemical accuracy for barriers, J. Am. Chem. Soc., 131, 816–825, https://doi.org/10.1021/ja807695p, 2009.
Tao, Y., Tian, C., Verma, N., Zou, W., Wang, C., Cremer, D., and Kraka, E.: Recovering intrinsic fragmental vibrations using the generalized subsystem vibrational analysis, J. Chem. Theory Comput., 14, 2558–2569, https://doi.org/10.1021/acs.jctc.7b01171, 2018.
Van Hinsberg, V. J., Henry, D. J., and Marschall, H. R.: Tourmaline: an ideal indicator of its host environment, Can. Mineral., 49, 1–16, https://doi.org/10.3749/canmin.49.1.1, 2011.
Veličkov, B.: Kristallchemie von Fe,Mg-turmalinen: Synthese und spektroskopische untersuchungen, Dissertation, Technische Universität Berlin, https://doi.org/10.14279/depositonce-501, 2002.
Watenphul, A., Burgdorf, M., Schlüter, J., Horn, I., Malcherek, T., and Mihailova, B.: Exploring the potential of Raman spectroscopy for crystallochemical analyses of complex hydrous silicates: II. Tourmalines, Am. Mineral., 101, 970–985, https://doi.org/10.2138/am-2016-5530, 2016.
Watenphul, A., Malcherek, T., Wilke, F. D. H., Schlüter, J., and Mihailova, B.: Composition–thermal expandability relations and oxidation processes in tourmaline studied by in situ Raman spectroscopy, Phys. Chem. Miner., 44, 735–748, https://doi.org/10.1007/s00269-017-0894-1, 2017.
Wöhlecke, M. and Kovács, L.: OH− ions in oxide crystal, Cr. Rev. Sol. State, 25, 1–86, https://doi.org/10.1080/20014091104161, 2001.
Zhang, M., Salje, E. K. H., Carpenter, M. A., Wang, J. Y., Groat, L. A., Lager, G. A., Wang, L., Beran, A., and Bismayer, U.: Temperature dependence of IR absorption of hydrous/hydroxyl species in minerals and synthetic materials, Am. Mineral., 92, 1502–1517, https://doi.org/10.2138/am.2007.2586, 2007.
Zhao, C., Liao, L., Xia, Z., and Sun, X.: Temperature-dependent Raman and infrared spectroscopy study on iron–magnesium tourmalines with different Fe content, Vib. Spectrosc., 62, 28–34, https://doi.org/10.1016/j.vibspec.2012.04.010, 2012.