the Creative Commons Attribution 4.0 License.
the Creative Commons Attribution 4.0 License.
 | 17 Dec 2021
Vibrational spectroscopic study of three Mg–Ni mineral series in white and greenish clay infillings of the New Caledonian Ni-silicate ores
Emmanuel Fritsch
Etienne Balan
Sabine Petit
Farid Juillot
This study presents and discusses infrared spectroscopic data of well characterised, naturally occurring trioctahedral layer silicates of the serpentine (Srp), talc (Tlc), and sepiolite (Sep) mineral groups, which are found in reactivated faults and sequences of white and green clay veins (deweylite and garnierite) of the New Caledonian Ni-silicate ores. Bands assigned to the OH stretching vibrations of these 1:1 and 2:1 layer silicates in both the fundamental and first overtone regions of mid- and near-infrared (MIR and NIR) spectra, respectively, are compared to those reported in the literature for synthetic Mg–Ni series of the Srp and Tlc mineral groups. They are also presented according to the sequences of infillings recognised in the white and green veins of the Ni-silicate ores. The study reveals that serpentine-like (SL) minerals of the first sequences of clay infillings are residues of larger crystals of serpentines (lizardite, chrysotile, and antigorite) and that the newly formed talc-like (TL) minerals and Sep are the main Ni-bearing carriers of the Ni-silicate ores. Decreasing crystal size and order in serpentine species have major effects on vibrational bands. They favour the broadening of the OH stretching bands, the degradation of the signals assigned to the interlayer OH, and the enhancement of the signal related to weakly bound water molecules. The replacement of Mg by Ni in octahedral sites of the 2:1 layer silicates (TL, Sep) of the greenish clay infillings can be traced by specific OH stretching bands related to the Mg3OH, Mg2NiOH, MgNi2OH, and Ni3OH configurations in the fundamental (MIR) and first overtone (NIR) regions of the spectra. The dominance of the Mg3OH and Ni3OH configurations with respect to mixed configurations in the Mg–Ni mineral series of the clay infillings (mostly in the dominant TL minerals) suggests that Mg and Ni segregation is related to separate Mg-rich and Ni-rich mineral phases rather than to a cationic clustering within the individual particles. This segregation of Mg and Ni in discrete mineral phases is related to Mg–Ni oscillatory zoning patterns (banded patterns) and is reproduced at the scale of the Ni-silicate ores between the white (deweylite) and greenish (garnierite) veins of the reactivated faults.
- Article
(10841 KB) - Full-text XML
-
Supplement
(5851 KB) - BibTeX
- EndNote


White and green (Mg-rich and Ni-rich) clay infillings (deweylite and garnierite) of the New Caledonian Ni-silicate ore deposits are commonly found at depth in crosscutting veins (“minerai quadrillé”) from peridotite saprock of thick lateritic profiles (Cluzel and Vigier, 2008; Wells et al., 2009; Fritsch et al., 2016, 2019; Cathelineau et al., 2017; Muñoz et al., 2019). They represent on average one-quarter of the global nickel resources of the world (Elias, 2001). As reported in other peridotitic formations, these clay infillings mostly consist of ill-ordered hydrous 1:1 and 2:1 Mg−Ni layer silicates of the serpentine (Srp) and talc (Tlc) mineral groups, the so-called serpentine-like (SL) and talc-like (TL) minerals (e.g. Brindley and Hang, 1973; Brindley and Maksimović, 1974; Bish and Brindley, 1978; Wiewiora et al., 1981; Villanova-de-Benavent et al., 2011, 2014; Fritsch et al., 2016; Maubec et al., 2021). In some veins, Mg−Ni sepiolite (Sep) partly or totally replaces the Mg−Ni TL minerals (Wiewiora et al., 1981; Dunbinska et al., 2000; Tauler et al., 2009; Fritsch et al., 2016).
In New Caledonia, two sequences of clay infillings have been recognised in the crosscutting veins of the saprock (Fritsch et al., 2016, 2019). They were attributed to two major periods of tectonic activity, following the dismantling and cooling of the ophiolite nappe and related to the early alteration of the serpentine (Srp) network of the peridotites (Mg−Fe 1:1 layer silicates) into fine-grained and ill-ordered SL and TL minerals (locally Sep) (Fritsch et al., 2016). This transformation of 1:1 into 2:1 layer silicates has been limited during the first period of faulting producing mixtures of SL and TL minerals (here referred to as STL infillings) and almost achieved during the second (TL infillings). A third period of tectonic activity has generated silica infillings and enabled the crystallisation of druzy quartz. Detailed geochemical investigations carried out on these serpentine veins and associated clay infillings (Fritsch et al., 2019) have also shown that the removal of Mg and Fe (or residual accumulation of silica) and the massive redistribution of Ni along the fault network have mostly occurred during the first period of tectonic activity. This early redistribution of chemical elements is considered the major driver of the differentiation of the white (deweylite) and greenish (garnierite) coatings on the fault walls.
Due to the diversity of alteration products (mostly SL, TL, and Sep) and residual mineral phases (Srp) commonly found in the mineralised veins of the Ni-silicate ores, their identification by means of spectroscopic tools remains a difficult task. This is especially true for the first sequence of clay infilling where mixed spectral patterns are commonly the rule, rendering the identification of each mineral contribution quite challenging, more specifically for the Srp mineral group. However, an identification of the 1:1 and 2:1 layer silicates successively found in the sequence of white and green clay infillings is of major importance for a better understanding of the mechanisms involved in the formation of the Ni-silicate ores.
Fourier transformed infrared (FTIR) spectroscopy and Raman spectroscopy in the OH stretching region (Brindley et al., 1979; Wiewiora et al., 1981; Gerard and Herbillon, 1983; Wilkins and Ito, 1967; Kloprogge et al., 2000; Petit et al., 2004; Madejová et al., 2011; Cathelineau et al., 2015; Baron and Petit, 2016; Blanchard et al., 2018; Capitani and Ventruti, 2018; Muñoz et al., 2019; Compagnoni et al., 2021) and lattice region of vibrational spectra (Yariv and Heller-Kallai, 1975; Brindley et al., 1979; Gerard and Herbillon, 1983; Villanova-de-Benavent et al., 2019; Muñoz et al., 2019) are among the most frequently used methods in the characterisation of these 1:1 and 2:1 layer silicates. The characteristic bands related to the OH stretching modes of FTIR and Raman spectra are of particular interest as they have proven to be sensitive probes to local perturbations in the structure and chemical composition of the layer silicates. In this regard, spectroscopic studies in both the fundamental and first overtone regions of OH stretching modes have been carried out successfully to infer the distribution of cations in synthetic Mg–Ni mineral series of the 1:1 and 2:1 layer silicates (Wilkins and Ito, 1967; Petit et al., 2004; Baron and Petit, 2016; Blanchard et al., 2018).
These studies focused on the inner OH stretching modes recognised in the 1:1 and 2:1 layer silicates, which are sensitive to the octahedral occupancies of divalent cations, such as Mg, Fe, and Ni. In these trioctahedral layer silicates, the inner OH groups are linked to three octahedral cations and stretched perpendicularly to the layers (Wilkins and Ito, 1967). They behave as isolated oscillators leading to well-defined absorption bands. The frequency at which these bands are observed depends on the crystal structure of the layer silicate and the relative proportions of octahedral coordinated divalent cations such as Mg, Ni, and Fe. For each mineral species, the frequency of the band decreases sequentially with the gradual replacement of Mg by Ni (or Fe). This leads to four types of chemical environments and frequencies for the inner OH stretching bands: Mg3OH, Mg2ROH, MgR2OH, and R3OH (with R = Ni or Fe).
In the 1:1 layer silicates of the serpentine mineral group, the occurrence of a second category of OH groups complicates the interpretation of the vibrational spectra. These OH groups are present on the outer face of the trioctahedral layer establishing an H bond with O atoms of the basal plane of the next T–O layer. Such interlayer OH groups are closer to each other than the inner OH groups are. The description of their vibrational properties should include a moderate coupling between adjacent interlayer OH oscillators and a collective behaviour due to long-range electrostatic interactions (e.g. Balan et al., 2002a; Prencipe et al., 2009). Structural parameters (bond strength), as well as macroscopic parameters (shape, size, and aggregation state of particles), affect the vibrational properties and contribute to the diversity of OH stretching spectra recognised in crystalline serpentines (e.g. Lz: lizardite; Ctl: chrysotile; Atg: antigorite) (Balan et al., 2021a, b; Fritsch et al., 2021). Compared with the more symmetric Lz variety, the OH stretching modes in the tubular-shaped Ctl (and also in the polygonal serpentine) display two contributions, one being ascribed to a local OH environment similar to that observed in Lz and the other reflecting a distribution of the OH bond lengths likely due to structural misfits between adjacent T–O layers (Fritsch et al., 2021). In the corrugated Atg, lower crystal symmetry and greater structural distortion reduce the frequency of the inner OH stretching modes in both the Mg3OH and Mg2ROH configurations (with R = Ni or Fe) and develop broader signals for the inner and interlayer OH stretching vibrations (Balan et al., 2021b; Fritsch et al., 2021). In the present study, special attention is given to the OH stretching modes reported in the first sequence of clay infillings from the Ni-silicate ores, where particles of crystalline serpentines (Lz, Ctl, Atg) are intimately mixed with fine-grained and ill-ordered SL minerals.
In the first section of the paper, representative spectra of SL minerals, TL minerals, and Sep recognised in some infillings of the New Caledonian Ni-silicate ores are interpreted in light of previous studies performed on synthetic Mg–Ni mineral series of 1:1 and 2:1 layer silicates (Wilkins and Ito, 1967; Petit et al., 2004; Blanchard et al., 2018; Baron and Petit, 2016). This comparison is established for the fundamental and first overtone vibrations in the mid-infrared (MIR) and near-infrared (NIR) ranges, respectively. The efficiency and limits of both spectroscopic techniques for differentiating the three major components of the clay infilling (SL, TL, and Sep) are then established, as well as the aptitude of these components to store Ni in their octahedral sites. In the second section, the gradual changes reported for the inner and interlayer OH vibrations of the clay minerals in their fundamental and overtone states are analysed in detail according to the sequence of infillings reported by Fritsch et al. (2016) in both the white and greenish patches of the reactivated faults. Modification of the spectroscopic signals for each mineral series and sequence of infillings is used to better decrypt the mechanisms involved in the formation of the Ni-silicate ores.
Bulk samples selected for this study belong to the large set of serpentine veins and clay infillings collected by Fritsch et al. (2016) in the saprock of thick Ni-laterite deposits of New Caledonia (Fig. 1a, b). The samples were grouped according to their mineralogical and chemical compositions and their relative distribution from the outer to the inner parts of the veins. For the white patches of the Ni-silicate ores (deweylite), they comprise the following (Fig. 1c): (i) the white SL infillings with dominant SL minerals and serpentine (Srp) remains, and (ii) the white STL infillings with mixed SL and TL minerals. For the greenish patches of the same Ni-silicate ores (garnierite), they comprise the following (Fig. 1d): (i) the olive green STL infillings with mixed SL and TL minerals and (ii) the bluish green (turquoise) TL infillings with dominant TL minerals. Infillings with dominant sepiolite (Sep) rather than TL minerals were also analysed. High-resolution transmission electron microscopy (HRTEM) images of the coarse serpentine particles (i.e. Lz: lizardite; Ctl: chrysotile; Atg: antigorite) and fine-grained SL and TL minerals are displayed in Fritsch et al. (2016).
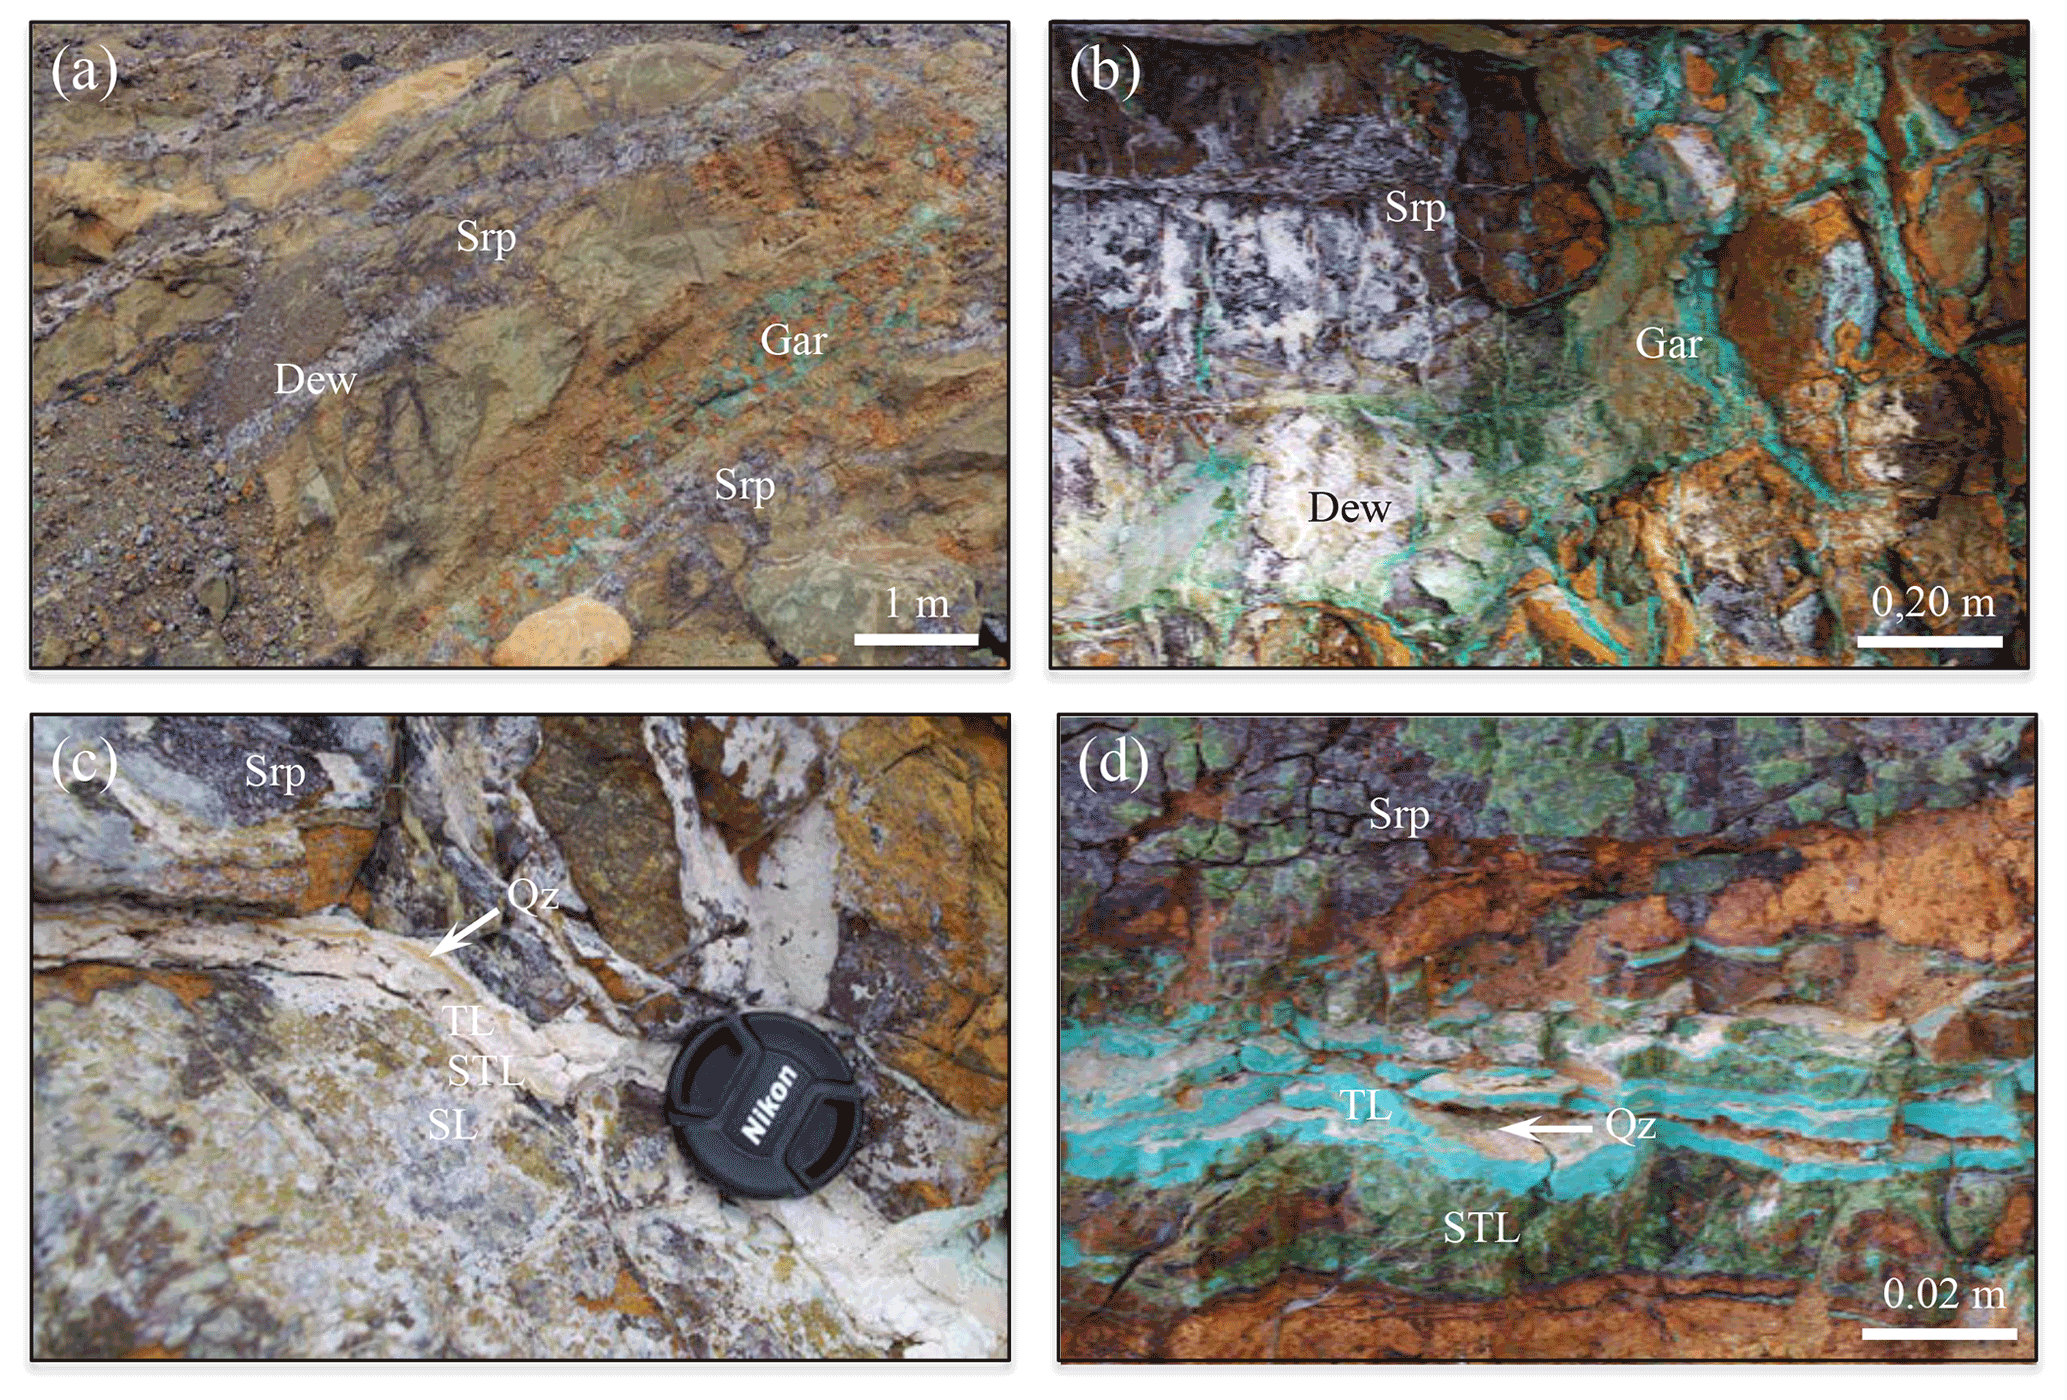
Figure 1(a) Black serpentine veins (Srp) in the saprock of thick Ni-laterites showing central and radial crackings with thin white (Dew: Deweylite) and green (Gar: Garnierite) infillings, (b) juxtaposition of white (Dew) and greenish (Gar) infillings in crosscutting veins of black serpentines (Srp), (c) sequence of white (SL, STL, TL) and grey (Qz) infillings in the deweylite veins, and (d) sequence of olive green (STL), turquoise (TL), and grey (Qz) infillings in the garnierite veins.
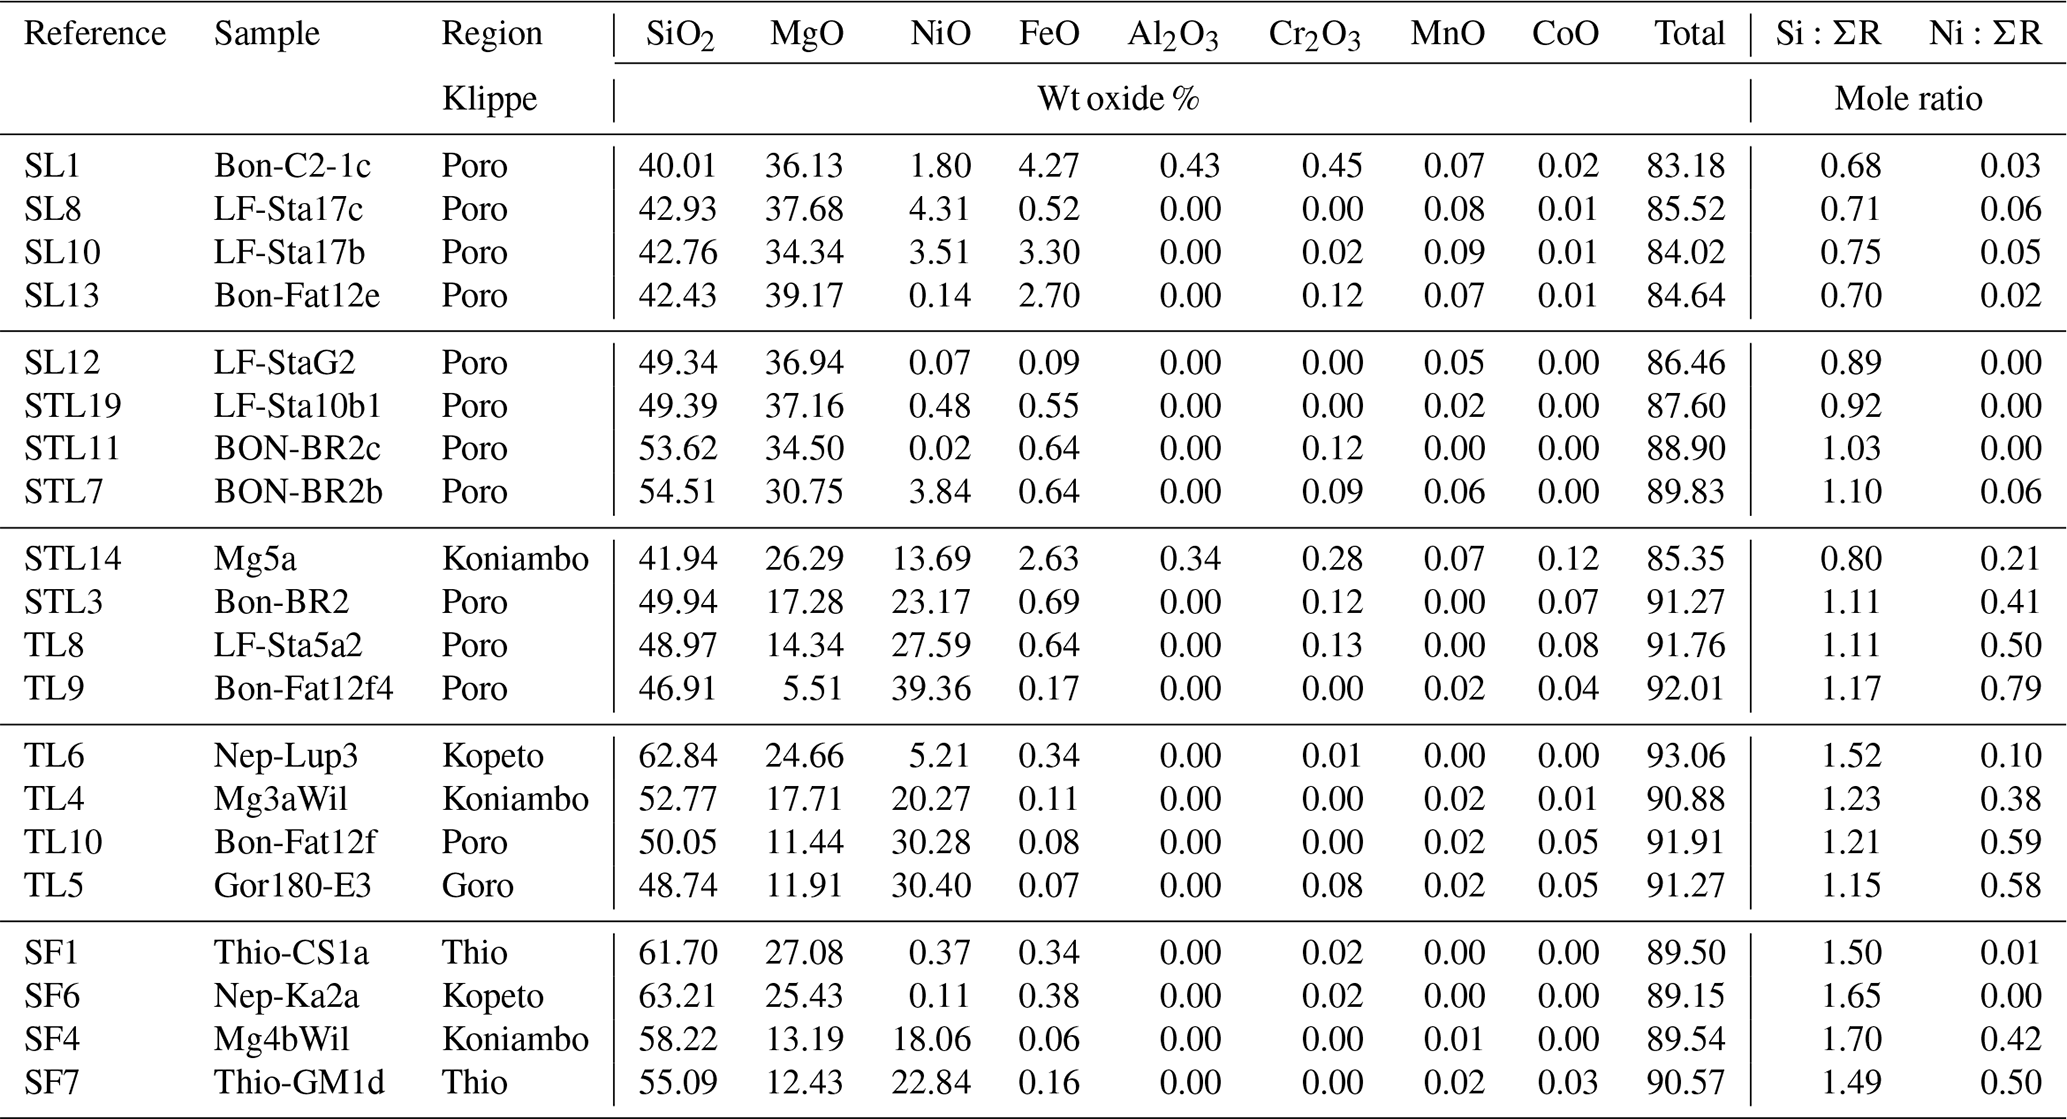
The samples were ground with an agate pestle and mortar and air-dried prior to chemical and mineralogical investigations. Chemical analyses of bulk samples were performed using a Perkin Elmer 1100b atomic-absorption spectrophotometer (AAS) after acid digestion of 1000 mg of a finely powdered aliquot in a high-pressure TFM Teflon vessel using an ETHOS 1600 Milestone microwave system. Chemical compositions of these samples are displayed in Table 1.
Table 1Chemical composition of the clay samples with serpentine-like (SL) minerals, mixed serpentine-like and talc-like (STL) minerals, talc-like (TL) minerals, and sepiolite (SF) from white (deweylite) and greenish (garnierite) infillings associated with serpentine veins of the New Caledonian peridotite formations (BON: Bonini; LF: La Française; C2; BR; STA: Stanislas; ISA: Isabelle; FAT Fatma; MG: Menguen; CS: Champs des sapins; GM: Grand Massif; GOR: Goro; ΣR = Mg + Fe + Ni). Plot of the data in ternary diagrams in Figs. 4b, 5b, 6b, 7b, and 8b.
X-ray diffraction (XRD) was performed on randomly oriented powders of bulk samples, previously sieved at 50 µm, using a Bruker D8 Advance diffractometer equipped with a LynxEye detector (Cu Kα radiation, 40 kV, 30 mA). Data were recorded in step-scan mode between 4 and 65∘2θ with 0.016∘ steps and counting 480 s per step.
Mid-infrared (MIR) spectroscopy was performed in the transmission mode on pellets, 2 cm in diameter, prepared with 1 mg of sample and 150 mg of KBr salt. The mixture was pressed for 5 min and dried overnight in an oven at 110 ∘C. MIR spectra were collected with a Thermo Scientific Nicolet 760 FTIR spectrometer equipped with an EverGlo source, a KBr beam splitter, and a deuterated triglycine sulfate DTGS-KBr detector. The spectra were recorded over the 400–4000 cm−1 range with a resolution of 4 cm−1 and co-additions of 100 scans.
Near-infrared (NIR) spectroscopy was performed on powder samples without any dilution. NIR spectra were obtained using a Thermo Scientific Nicolet 6700 FTIR spectrometer equipped with a white light source, a CaF2 beam splitter, and a Thermo Scientific Smart NIR integrating sphere equipped with an internal InGaAs detector. Powder samples were analysed in diffuse-reflectance mode. The resulting NIR spectra are the sum of the 100 scans collected over the 3850–7500 cm−1 range at a resolution of 4 cm−1.
3.1 OH stretching vibrations in representative natural samples and comparison with synthetic mineral series
Figure 2 displays the OH stretching spectra of representative SL, TL, and Sep samples from fracture infillings of the New Caledonian Ni-silicate ores, while Table 2 compares the average frequencies reported for the four inner OH stretching modes (Mg3OH, Mg2NiOH, MgNi2OH, Ni3OH) of the natural samples with those given in the literature for synthetic Mg–Ni series of the Srp (Baron and Petit, 2016) and Tlc (Wilkins and Ito, 1967; Petit et al., 2004; Blanchard et al., 2018) mineral groups. As far as we know, frequencies of synthetic Mg–Ni Sep series have not been reported in the literature. For the Srp mineral group, we will mostly rely on the synthetic Mg–Ni series investigated by Baron and Petit (2016), as OH stretching modes involving Ni could not be related to well-defined peaks from our set of samples containing SL minerals (i.e. SL and STL infillings).
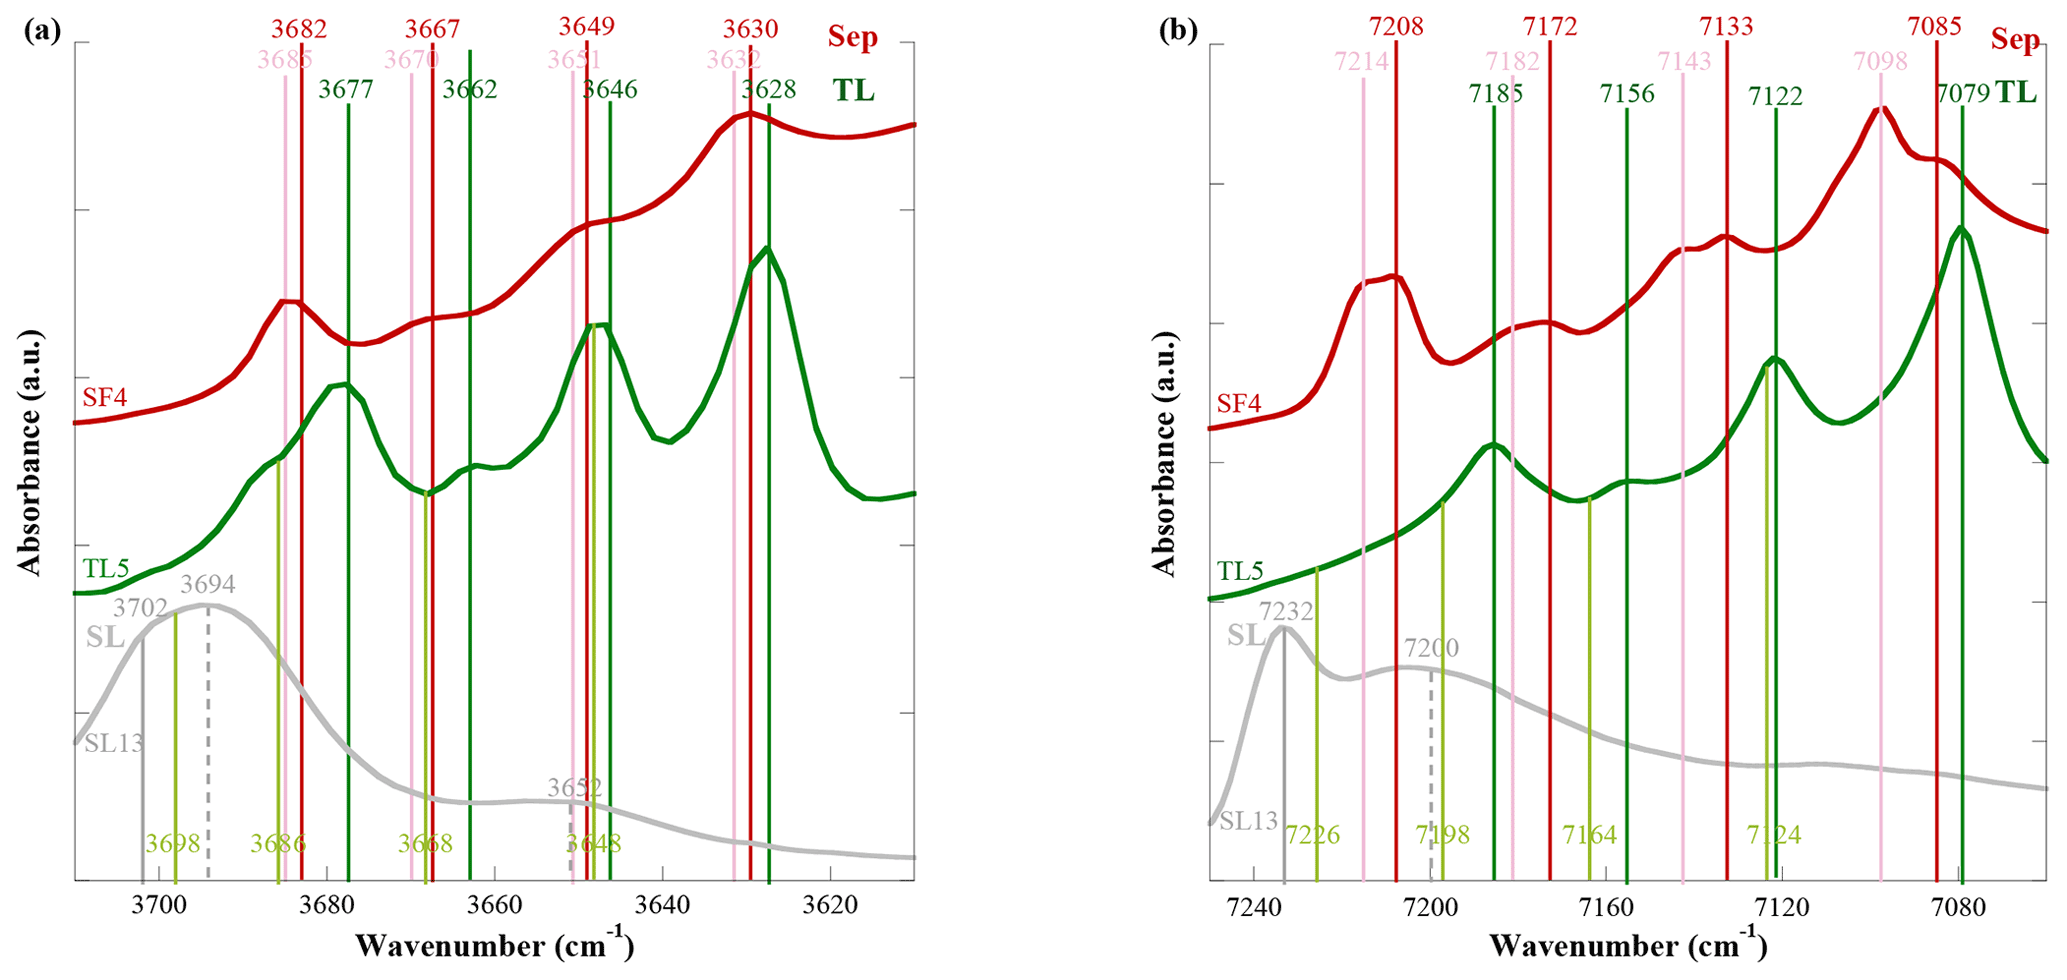
Figure 2Representative (a) mid-infrared and (b) near-infrared spectra of a SL infilling (sample SL13), TL infilling (sample TL5), and Sep infilling (sample SF4) of the New Caledonian Ni-silicate ores. Dark green and pale and dark red vertical lines mark the positions of the four inner OH stretching bands (Mg3OH, Mg2NiOH, MgNi2OH, Ni3OH) for TL minerals and Sep. For SL minerals, the pale green vertical lines correspond to frequencies provided by Baron and Petit (2016). Plain lines correspond to inner OH vibrations and dashed lines to interlayer OH vibrations. SL: serpentine-like; TL: talc-like; Sep: sepiolite.
Table 2Frequencies (W cm−1) of the four inner OH stretching bands (Mg3OH, Mg2ROH, MgR2OH, R3OH) from Mg–R series of three mineral groups (Srp: serpentine; Tlc: talc; Sep: sepiolite) in the fundamental (vOH) and first overtone (2vOH) regions of MIR and NIR spectra (synthetic minerals from literature and natural samples from this study). Lz: lizardite; Nep: nepouite; TL: talc-like minerals; X cm−1: anharmonicity parameter (in italic); R = Ni except for the Mg–Fe Tlc series of Petit et al. (2004). The anharmonicity parameters are in italics.

As illustrated by sample SL13, SL minerals commonly display in the MIR range (Fig. 2a) a dominant band at 3694 cm−1 ascribed to interlayer OH and, in the NIR range (Fig. 2b), a narrower inner OH band at 7232 cm−1 and a broader interlayer OH band at 7200 cm−1. These vibrations are similar to those reported by Baron and Petit (2016) for the Mg end-member of their lizardite-nepouite mineral series and are therefore characteristic of an Mg3OH environment. Sample TL5 is representative of a Ni-rich TL infilling (Table 1). It displays in both the MIR range (Fig. 2a) and NIR range (Fig. 2b) four characteristic OH stretching vibrations. These vibrations are similar to those determined on synthetic Mg–Ni series of the Tlc mineral group (Wilkins and Ito, 1967; Baron and Petit, 2016; Blanchard et al., 2018), indicating that the four dominant bands in the MIR and NIR spectra of the TL samples correspond to the occurrence of the four Mg3OH, Mg2NiOH, MgNi2OH, and Ni3OH configurations. Note that the small magnitude of the shift of the OH stretching bands towards lower frequencies (∼ 1 cm−1) when Fe replaces Ni (see Mg–Fe series from Petit et al., 2004 in Table 2) makes a spectroscopic distinction of the two substitutions challenging. It is worth reporting that the anharmonicity parameters calculated between the fundamental and first overtone vibrations of these TL minerals are similar for the natural clay infillings and synthetic materials and are also very close to those calculated by Baron and Petit (2016) for the Mg–Ni series of the Srp mineral group (Table 2). The last sample SF4 is representative of a Ni-rich Sep infilling (Table 1). Its FTIR spectrum is consistent with that of natural Ni-bearing sepiolite reported by Villanova-de-Benavent et al. (2019) and Maubec et al. (2021). As for the former TL infillings, four characteristic Mg3OH, Mg2NiOH, MgNi2OH, and Ni3OH bands occur in the MIR and NIR ranges (Fig. 2). A splitting of the vibrations in two sets of OH stretching transitions (Sep1 and Sep2 in Table 2) is also observed. The splitting of these transitions is weakly detectable in the MIR range (Fig. 2a) and more obvious in the NIR range (Fig. 2b), more specifically at low frequencies for the MgNi2OH and Ni3OH configurations. It is most likely related to varying hydration states of the channel framework of these fibrous minerals (Post et al., 2007; Bukas et al., 2013). The anharmonicity parameters calculated between the fundamental and first overtone vibrations of these Sep materials are slightly smaller than those reported for the TL minerals (Table 2).
Figure 3 displays the amplitude of the shift with respect to the pure Mg composition of the three characteristic OH stretching bands (Mg2NiOH, MgNi2OH, Ni3OH) for the three mineral series (SL, TL, and Sep) as a function of the frequencies of the vibrations. It is noteworthy that although the absolute OH stretching frequencies differ from one mineral to the other and from one type of OH group to the other, the down shifts induced by the incremental Ni for Mg replacement in the vicinity of the OH group are similar, ranging from ∼ 14 to ∼ 17 and ∼ 20 cm−1 for the first, the second, and the third substitution (Mg3OH → Mg2NiOH → MgNi2OH → Ni3OH), respectively (Fig. 3a). Concomitantly, the shifts of the overtone bands in the NIR range are ∼ 29, ∼ 35, and ∼ 42 cm−1, respectively (Fig. 3b).
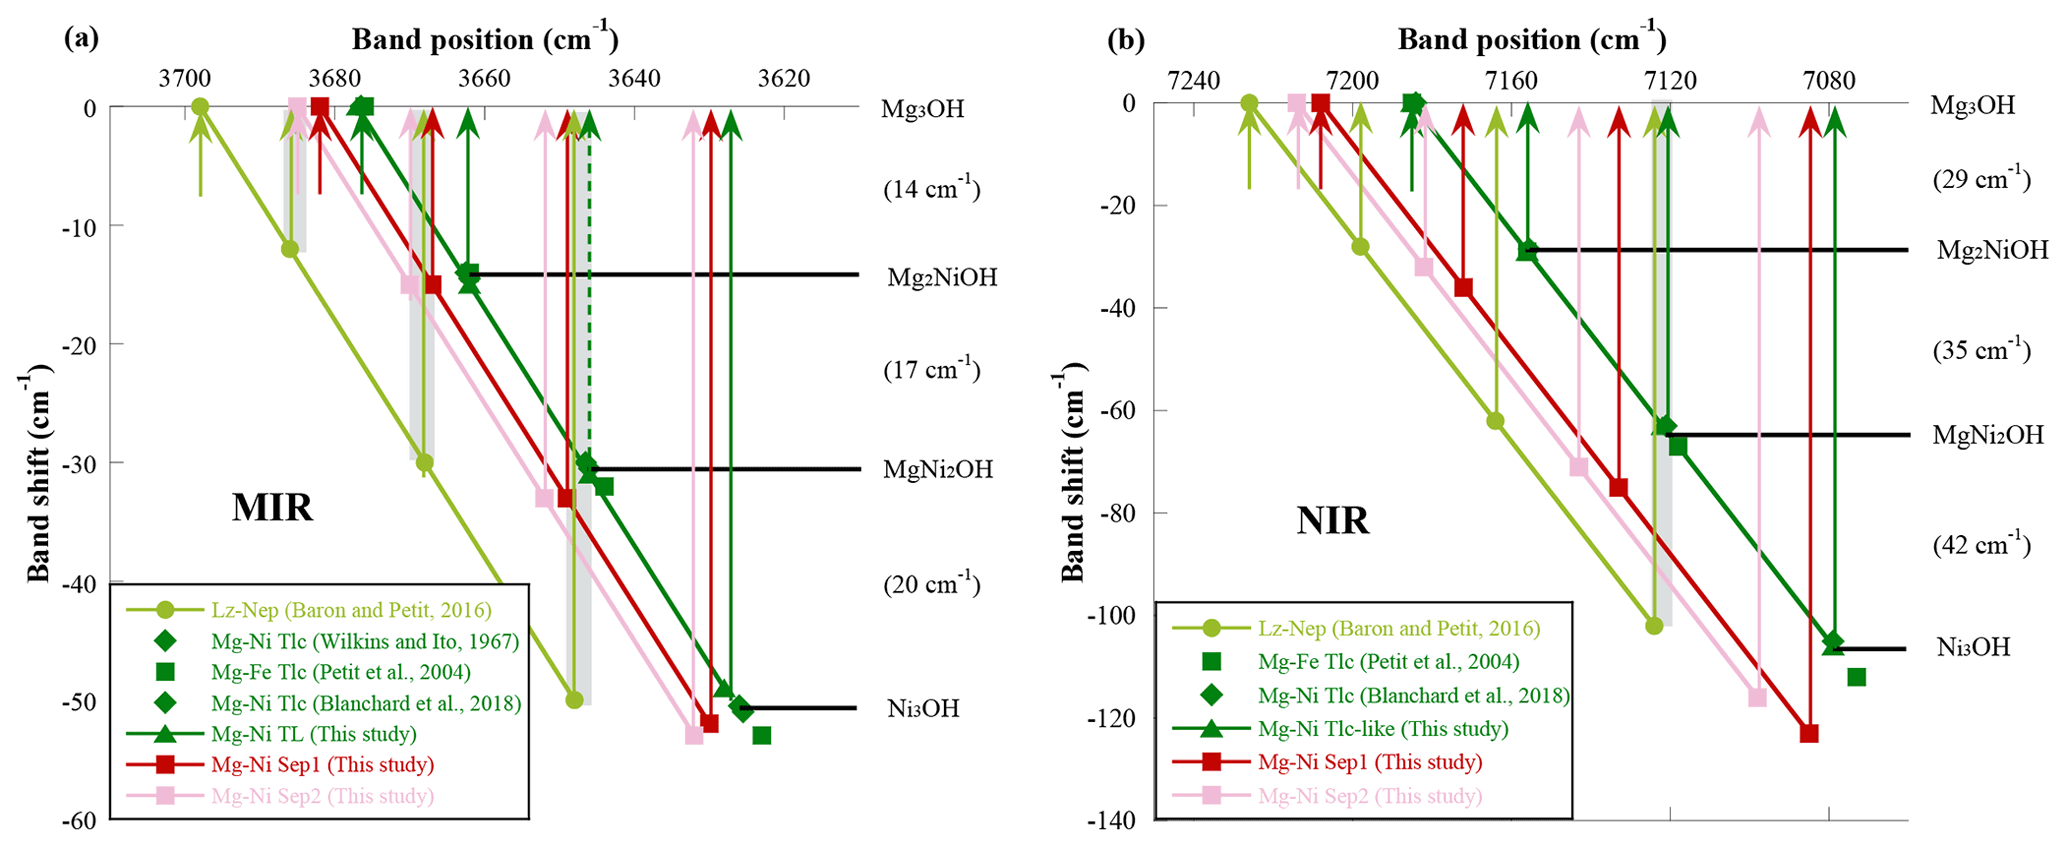
Figure 3Position (frequencies or wavenumbers) and shift of the four inner OH stretching bands (Mg3OH, Mg2NiOH, MgNi2OH, Ni3OH) for the three Mg–Ni mineral series of the Ni-silicate ores in the (a) fundamental (vOH) and (b) first (2vOH) overtone regions of MIR and NIR spectra (synthetic minerals from the literature and natural samples from this study). Lz: lizardite; Nep: nepouite; Tlc: talc; TL: talc-like; Sep: sepiolite.
Figure 3 also shows that the four OH stretching bands are observed at higher frequencies for the Srp-SL mineral series than for the TL mineral series. The positions of these bands on both MIR and NIR spectra then enable differentiation of these 1:1 and 2:1 layer silicates, which are the most common mineral phases reported in the clay infillings of the New Caledonian Ni-silicate ores (Wells et al., 2009; Fritsch et al., 2016; Cathelineau et al., 2015). Furthermore, their relative intensity also enables the assessment of Ni distribution (random versus cluster) in the octahedral sites of both types of layer silicates (e.g. Wilkins and Ito, 1967; Wiewiora et al., 1981; Petit et al., 2004). The two other sets of OH stretching bands for Sep (i.e. Sep1 and Sep2) are observed at intermediate positions between those of the Srp-SL and TL mineral series. They are closer to those of the TL minerals in the range of fundamental transitions (Fig. 3a) and to those of the SL minerals in the first overtone region of the infrared spectra (Fig. 3b). Although quite close to each other, their positions enable the identification of the additional occurrence of sepiolite in the clay infillings and the establishment of the proportion and distribution of Ni in this third mineral phase. Nevertheless, some of the inner OH stretching bands of the three Mg–Ni mineral series (Srp-SL, TL, and Sep) overlap or are observed at nearly the same frequency. This is the case in three narrow ranges of frequencies on MIR spectra (three grey slots in Fig. 3a) and only one range of frequency on NIR spectra (one grey slot in Fig. 3b). Figure 3 reveals therefore the greater potential of NIR spectroscopy to differentiate the OH stretching bands of the three Mg–Ni mineral series. It also shows that the Ni3OH vibration in SL minerals cannot be distinguished from the Mg2NiOH vibration in TL minerals, which are both observed at nearly the same frequencies in the fundamental (∼ 3646 cm−1) and first overtone (∼ 7124 cm−1) regions of MIR and NIR spectra. This uncertainty can only be lifted with additional crystallographic investigations (e.g. using XRD).
3.2 Mineral composition and OH stretching modes in the first sequence of clay infillings
3.2.1 White clay infillings (deweylite) with SL minerals
The replacement of Mg−Fe serpentine species (Srp) by SL minerals in the first generation of white infillings is correlated on XRD patterns to significant decreasing, broadening, and spreading towards smaller angles of the 00l basal reflections of the 7 Å (or 1:1) layer silicates, as well as to a degradation of the sharp 202 reflections at ∼ 36∘ 2θ and their replacement by a very broad two-dimensional diffraction band (from SL1 to SL13 in Fig. 4a). These modifications of the XRD patterns of serpentines are the result of a significant decrease in their particle size and development of crystal defects (such as stacking faults) (Brindley, 1980; Fritsch et al., 2016). On these XRD patterns, the overlapping of sharp 202 reflections of crystalline serpentines (Lz, Ctl, Atg) on the broad two-dimensional diffraction band (20) of the SL minerals attests to the occurrence of Srp remnants in these white infillings. Such occurrences likely correspond on HRTEM images to the largest crystal particles intimately mixed with the fine-grained materials of the clay infillings (Fritsch et al., 2016). Moreover, detailed observation of the 202 reflections shows that Srp residues are mostly composed of Ctl in sample SL1 (major peak at d spacing of 2.45 Å), mixture of Ctl and Lz in sample SL8 (additional sharp peak at d spacing of 2.51 Å), and Atg in sample SL10 (major peak at d spacing of 2.55 Å) (Fig. 4a) (Fritsch et al., 2016, 2021). These sharp reflections of crystalline Srp almost disappear in sample SL13, whereas the broad 20 diffraction band of the SL minerals becomes largely prominent. As shown in the ternary diagram of Fig. 4b, the chemical compositions of these white infillings (grey triangles) are very close to those of the black to greenish brown Srp veins of the peridotites (black dots).
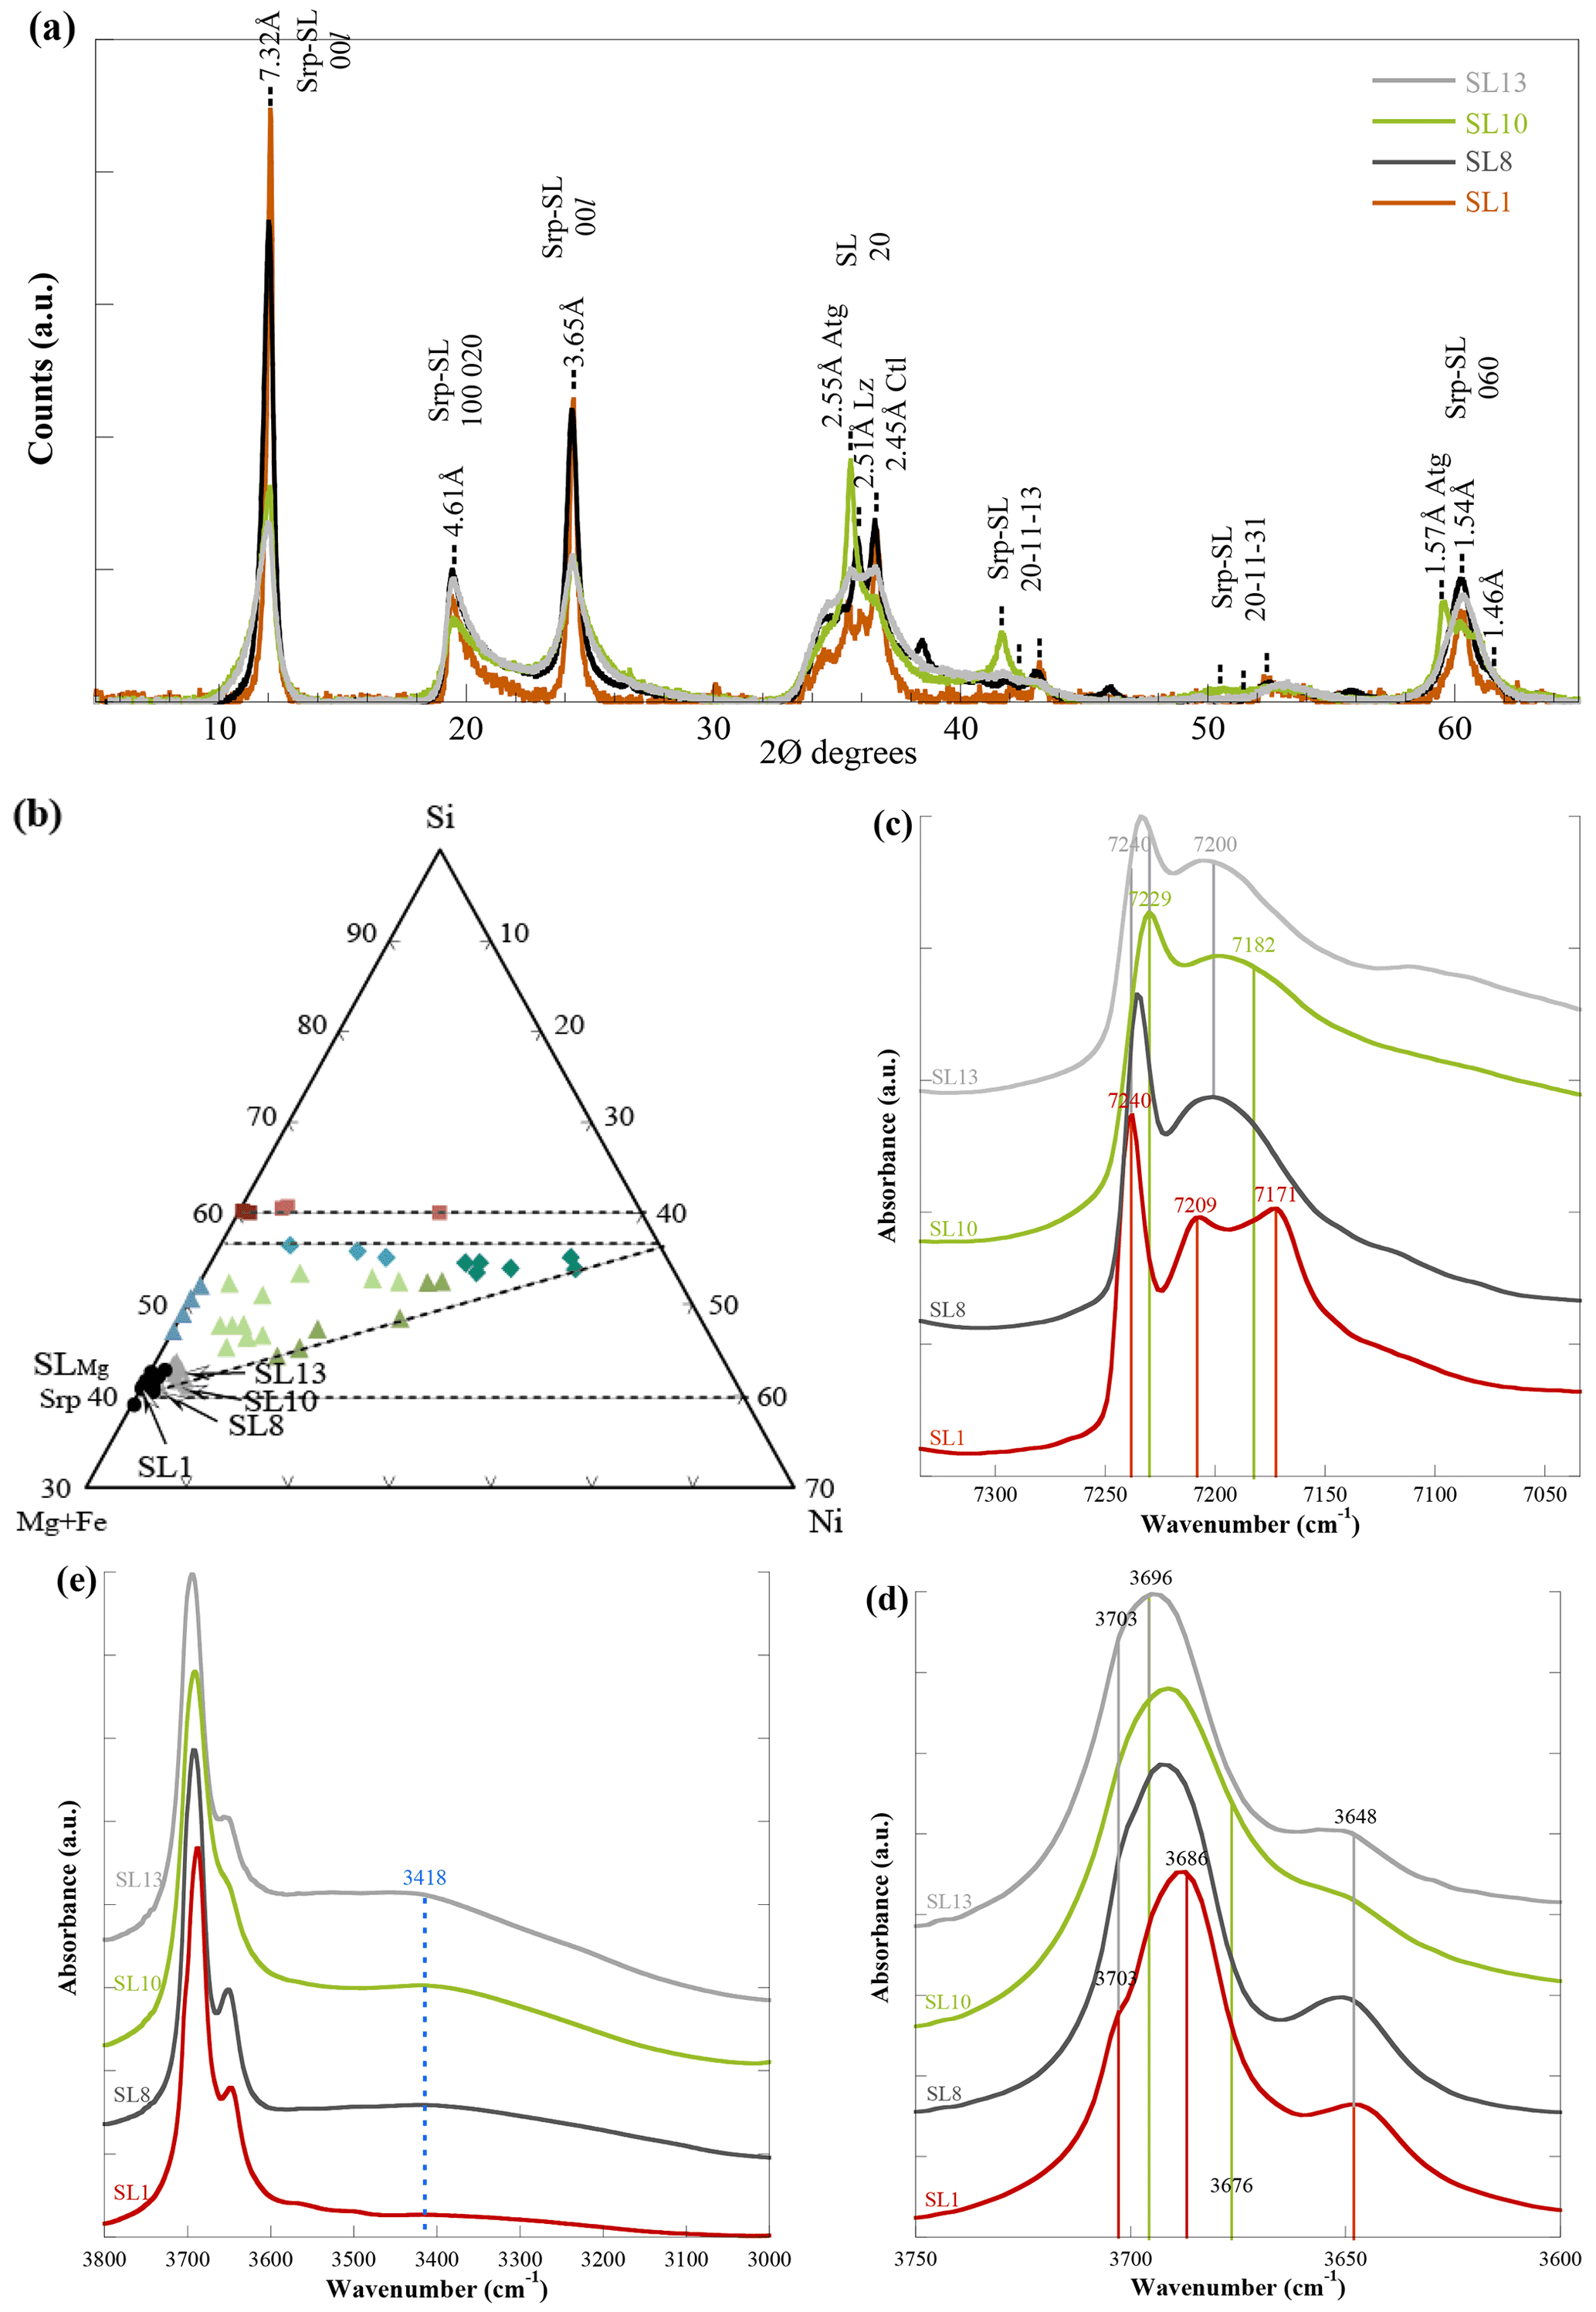
Figure 4White clay samples with dominant serpentine species (Srp) and serpentine-like (SL) minerals (SL1, SL8, SL10, SL13): (a) XRD analysis of mineral composition, (b) chemical composition reported in a ternary diagram, (c) OH stretching bands in the first overtone of NIR spectra, (d) OH stretching bands in the fundamental state of MIR spectra, and (e) enlarged view showing the broad signal related to weakly bound water molecules (MIR spectra).
Fritsch et al. (2021) have recently investigated the structural and chemical parameters controlling the OH stretching signals of the Srp and highlighted the potential of combining different spectroscopic techniques for a consistent assignment of their vibrational modes. Modification of the OH stretching signals in the white infillings composed exclusively of 1:1 layer silicates (Srp-SL) is discussed here in both the first overtone and fundamental regions of NIR (Fig. 4c) and MIR (Fig. 4d) spectra. As for the basal reflections of the XRD patterns, the individualisation in the infillings of ill-ordered SL minerals is related to an intensity decrease and broadening of the inner OH stretching overtone band on NIR spectra (Fig. 4c). The position of this overtone band is sensitive to the nature of the Srp remnants for each infilling. It ranges from 7240 cm−1 for samples comprising Ctl and Lz remnants (SL1 and SL8) to 7229 cm−1 for samples containing mainly Atg remnants (SL10) (Fritsch et al., 2021). This overtone, related to the dominant Mg3OH configuration in Srp, is clearly dissociated from those reported at lower frequencies for the other OH stretching modes. This is not the case for the fundamental inner OH band, which is barely detectable on MIR spectra and is present as a shoulder on the high-frequency side of the dominant band related to interlayer OH groups (Fig. 4d). Consistent with the observations made on the overtone bands, the shoulder corresponding to the inner OH is positioned at 3703 cm−1 for samples comprising Ctl and Lz remnants (SL1 and SL8) and is not detectable for samples containing mainly Atg remnants (SL10) due to its larger width and lower frequency, leading to a strong overlap with the dominant signal assigned to interlayer OH groups. This interpretation of the MIR and NIR spectra of Srp species (Lz, Ctl, Atg) in the infillings is consistent with the XRD data.
A second set of spectral modification is reported at lower frequency. The modification of the vibrations is once again more clearly established on the overtones of NIR spectra than on the fundamentals of MIR spectra. Figure 4c notably displays two main signals at ∼ 7209 and 7171 cm−1 in the less altered infilling (SL1), which disappear in the others infillings, and their replacement by a very broad signal centred at ∼ 7200 cm−1. The vibration at 7209 cm−1 has been attributed to the inner OH overtone of the less abundant Mg2MOH configuration (with M = Fe or Ni) of the Srp (Balan et al., 2021a). It overlaps with a broader contribution at 7200 cm−1, which together with the 7171 cm−1 band are ascribed to overtone vibrations of interlayer Mg3OH groups (Fritsch et al., 2021). The sharper interlayer overtone at 7171 cm−1 was found to be common to all serpentine minerals, including Atg, whereas the large signal centred at 7200 cm−1 has been attributed to structural misfits for the OH stretching due to the unrolling of the T–O layers in Ctl nanotubes (Fritsch et al., 2021). Both signals have their equivalent interlayer OH stretching modes at 3696 and 3686 cm−1 in the fundamental region of MIR spectra (Fritsch et al., 2021), and the removal of the latter is then illustrated in Fig. 4d by a gradual shift of the main band from 3686 to 3696 cm−1. In the white infilling mostly made of Atg (SL10), the fundamental band of the interlayer OH at 3674 cm−1 (and not at 3686 cm−1 as for the other Srp species) also disappears, whereas the characteristic overtone band at 7229 cm−1 for the inner OH remains. In the white infilling composed almost exclusively of SL minerals (SL13), we notice the residual occurrence of a broad fundamental band at 3696 cm−1 and overtone at 7200 cm−1,
It is therefore challenging to assign the modification of the inner and interlayer OH stretching bands to structural changes in the fundamental region of MIR spectra of these white infillings without the assistance of their overtone equivalents on NIR spectra. Both techniques reveal similar variations for the interlayer OH groups, which strengthen therefore our interpretations: (i) the removal of the sharp signals at 7171 and 3686 cm−1 specific to crystalline Srp (3674 cm−1 for the fundamental band of Atg) and (ii) the persistence or development of broader and weaker signals at 7200 and 3696 cm−1, which were attributed by Fritsch et al. (2021) to structural misfits in Ctl and are dominant in the SL minerals. Furthermore, the degradation of the OH stretching bands of the 1:1 layer silicates, more specifically of their interlayer OH vibrations at 7171 and 3686 cm−1 (3674 cm−1 in Atg) (Fig. 4c, d), is also correlated with an enhancement of the very large signal centred at ∼ 3418 cm−1 (Fig. 4e) attributed to weakly bound water molecules in the interlayer space of these layer silicates (Fritsch et al., 2021).
3.2.2 White clay infillings (deweylite) with mixed SL and TL minerals
The conversion of serpentine minerals into TL minerals in the white clay infillings (deweylite) of reactivated faults marks a second step in the transformation of the 1:1 layer silicates. It is illustrated in XRD patterns by a gradual decrease in the reflections of the 7 Å type layer silicates (Srp and SL) and their replacement by those of the 10 Å type layer silicates (TL). Such variations mainly concern the 00l basal reflections of these layer silicates, whereas the broad two-dimensional band common to both types of minerals (20-13) remains almost unchanged (Fig. 5a). Moreover, the sharp reflections assigned to crystalline Srp, which were present on the broad two-dimensional band of the SL minerals, are weakly expressed in this second category of white infillings. The removal of these sharp reflections and the enhancement of the two-dimensional band suggest therefore that most of the Srp species (Lz, Ctl, and Atg) have converted into SL minerals. In a ternary diagram (Fig. 5b), chemical data of these white infillings are spread between the Mg−Fe serpentine (SLMg) and Mg-rich TL minerals (i.e. kerolite). This trend belongs therefore to a Ni-free environment where the production of TL minerals in the clay infillings can be traced by an increase in the molar Si:ΣR ratio (with R = Mg+Fe) (Fritsch et al., 2019).

Figure 5White clay samples with mixed serpentine-like (SL) and talc-like (TL) minerals (SL12, STL19, STL11, STL7): (a) XRD analysis of mineral composition, (b) chemical composition reported in a ternary diagram, (c) OH stretching bands in the first overtone of NIR spectra, (d) OH stretching bands in the fundamental state of MIR spectra, and (e) enlarged view showing the broad signals related to weakly bound water molecules (MIR spectra).
The NIR and MIR spectral patterns of the 1:1 layer silicates of these white infillings also show that the interlayer OH bands of the Srp species at 7171 and 3686 cm−1 (mostly for Lz and Ctl, at 3674 cm−1 for Atg) are no longer present, whereas those of the SL minerals at 7205 and 3696 cm−1 remain. These spectral changes support the conversion of the Srp species into SL minerals inferred on the basis of XRD data. However, spectral inheritance from serpentine parent materials can be traced back using the position of the inner OH vibration. As for the former white infillings exclusively made of 1:1 layer silicates, the frequency of the inner OH vibration in the NIR range varies from 7229 cm−1 in samples resulting from the alteration of Atg (SL12, STL19) to 7240 cm−1 in those derived from the other Srp species (STL11, STL7). This distinction is consistent with observations in the MIR range, where the frequency of the fundamental inner OH is at 3703 cm−1 for the second set of samples (STL11, STL7), whereas it is superimposed on that of the interlayer OH at 3696 cm−1 for the first set of samples (SL12, STL 19). Finally, it is worth pointing out that both vibrations for the inner and interlayer OH of these SL minerals correspond exclusively to the Mg3OH configuration.
In these white infillings, the replacement of SL minerals by TL minerals is illustrated on both NIR and MIR spectra by a gradual decrease in the inner and interlayer OH stretching bands of the SL minerals (see vertical grey lines in Fig. 5c, d) and a concomitant increase in the inner OH stretching band of the TL minerals at 7184 and 3677 cm−1 for the Mg3OH configuration (see the vertical blue line in Fig. 5c, d). These variations are better expressed on NIR spectra than on MIR spectra due to a smaller contribution in the former of the interlayer OH stretching mode. As for the SL minerals, the other inner OH stretching bands associated with the incorporation of Ni in octahedral sites of the TL minerals (Mg2NiOH, MgNi2OH, Ni3OH) are absent or barely detectable (see vertical dashed blue lines in Fig. 5c, d), which is in agreement with the expected Ni-free character of these minerals.
Lastly, the additional formation of TL minerals in these white infillings leads to a greater proportion of weakly bound water molecules, which is attested on MIR spectra by an overall enhancement of the broad signals centred at ∼ 3424 and 3220 cm−1 (vertical dashed blue lines in Fig. 5e). This last trend is in agreement with the expected larger ability of the ill-ordered SL and TL minerals to store water molecules compared to the crystalline serpentines and talcs. This property has repeatedly been pointed out in the literature (e.g. Brindley and Wan, 1975; Brindley et al., 1979; Gerard and Herbillon, 1983) and quantified by thermogravimetric and differential thermal analyses (e.g. Brindley and Hang, 1973; Fritsch et al., 2016).
3.2.3 Olive green clay infillings (garnierite) with mixed SL and TL minerals
As for the white clay infillings (deweylite), the replacement of serpentines by TL minerals in the olive green clay infillings is illustrated on XRD patterns by a gradual decrease in the diffraction peaks of the 7 Å type layer silicates (Srp and SL) and their replacement by those of the TL minerals (Fig. 6a). However, it is not straightforward to obtain a quantitative estimate of the mineral fractions from XRD data as the incorporation of Ni in the structure of these layer silicates (mainly TL minerals as discussed later) leads to an enhancement of the basal reflections of the TL minerals as compared to those of the SL minerals (compare Figs. 5a and 6a) (Brindley et al., 1979; Blanchard et al., 2018). Chemical data of these green infillings plotted in a ternary diagram (Fig. 6b) are spread between those of the Mg−Fe serpentines (SLMg) and Ni-rich TL minerals (i.e. pimelite). In such a crystal chemical trend, the increase in the Si:ΣR ratio is closely linked to a loss of Mg and Fe, which is partly compensated by a gain of Ni (Fritsch et al., 2019).
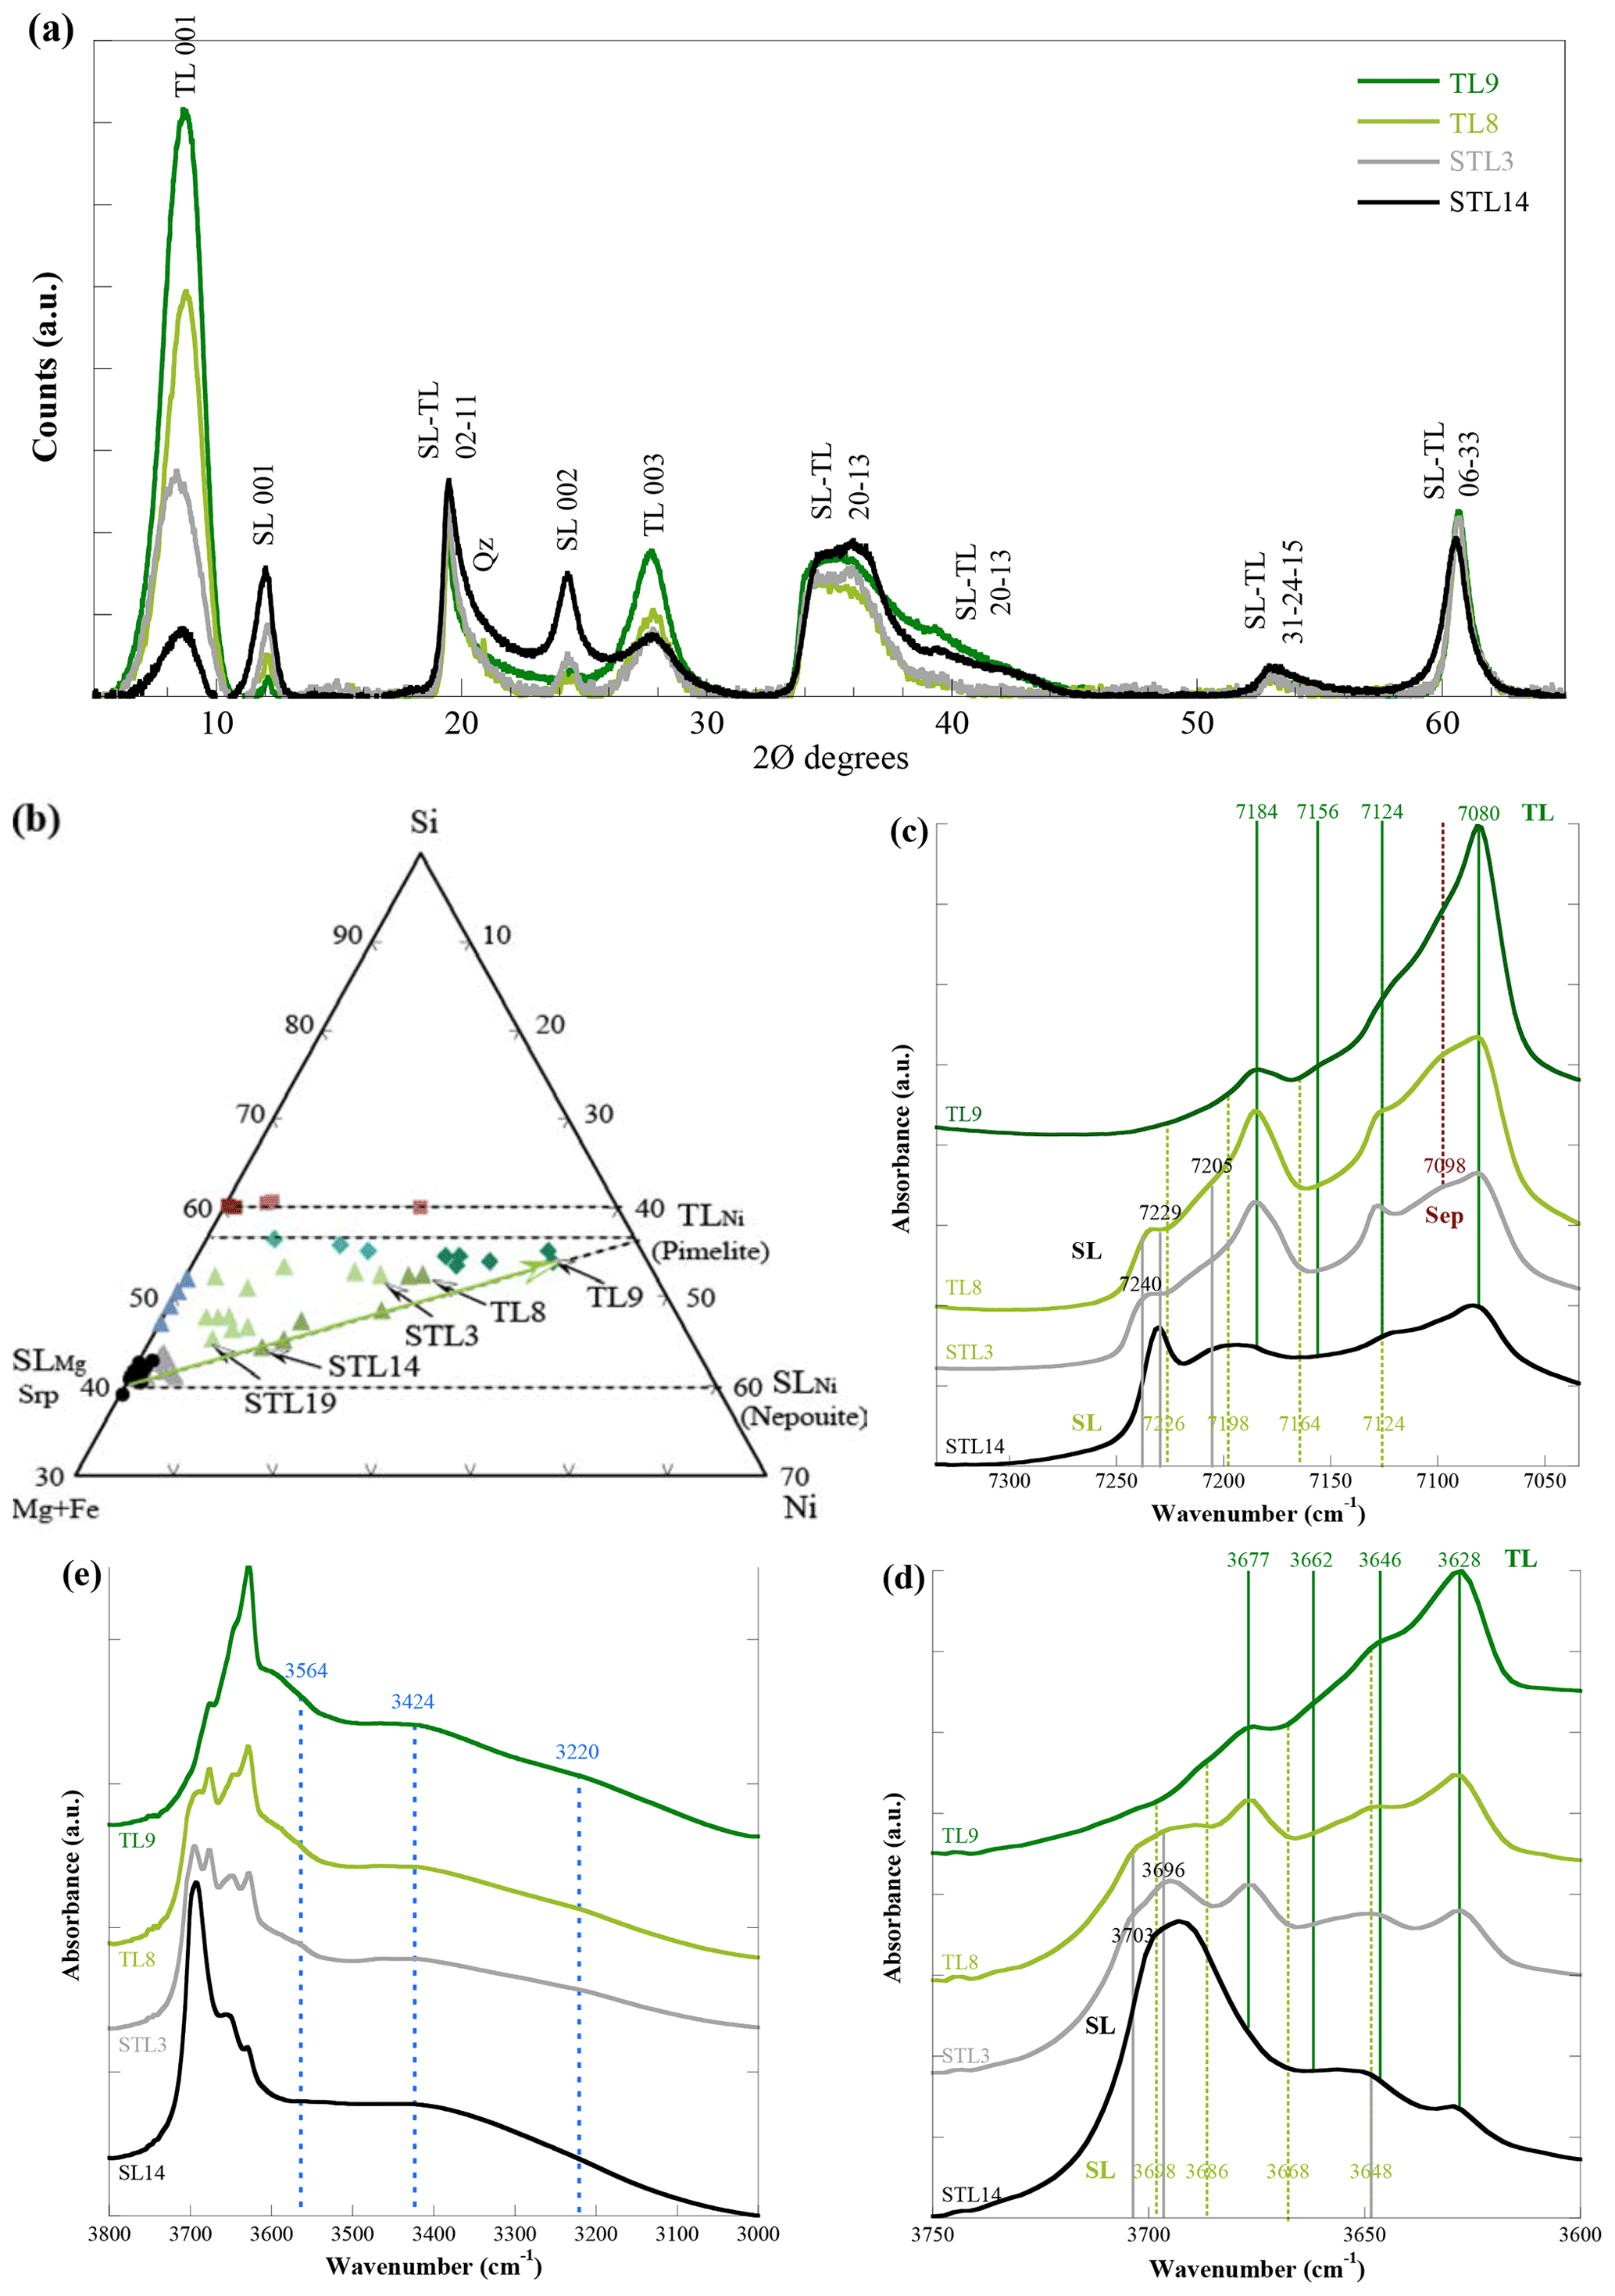
Figure 6Olive green clay samples with mixed serpentine-like (SL) and talc-like (TL) minerals (STL14, STL3, TL8, TL9): (a) XRD analysis of mineral composition, (b) chemical composition reported in a ternary diagram, (c) OH stretching bands in the first overtone of NIR spectra, (d) OH stretching bands in the fundamental state of MIR spectra, and (e) enlarged view showing the broad signals related to weakly bound water molecules (MIR spectra). Sep: sepiolite.
The NIR and MIR spectra of the 1:1 layer silicates for the olive green infillings present major similarities to those previously presented for the white infillings (Fig. 6c, d). Indeed the vibrations of the inner and interlayer OH groups are characteristic of the Mg3OH configuration in SL minerals. The broad interlayer OH stretching at 3696 cm−1 is the dominant SL vibration on MIR spectra (Fig. 6d), whereas its first overtone at 7205 cm−1 corresponds to a broad signal on NIR spectra (Fig. 6c). According to the nature of the parent material (mixture of Lz and Ctl versus Atg), the inner OH stretching mode of the Mg3OH configuration varies from 7240 to 7229 cm−1 in the first overtone region of NIR spectra (Fig. 6c) and from 3703 to 3696 cm−1 in the fundamental region of MIR spectra (Fig. 6d). The other inner OH stretching bands associated with the incorporation of Ni in octahedral sites of the SL minerals (Mg2NiOH, MgNi2OH, Ni3OH) are absent or barely detectable on both NIR and MIR spectra (vertical dashed olive green lines in Fig. 6c, d).
In these olive green infillings, the replacement of SL by TL minerals is illustrated on both NIR and MIR spectra by a gradual collapse of the inner and interlayer OH stretching bands of the SL minerals (see vertical grey lines in Fig. 6c, d) and a concomitant development of the inner OH stretching bands of the TL minerals (vertical dark green lines in Fig. 6c, d). More precisely, both NIR and MIR spectra show that the first and fourth bands for the Mg3OH and Ni3OH configurations at respectively 3677 and 7184 cm−1 and 3628 and 7080 cm−1, although changing in intensity from one sample to another, correspond to the dominant OH stretching vibrations of the TL minerals. As initially reported by Brindley et al. (1979) and Wiewiora et al. (1981) in similar Mg–Ni mineral series, the second band at 3662 and 7156 cm−1 for the Mg2NiOH configuration is barely detectable, and the third band at 3646 and 7124 cm−1 for the MgNi2OH configuration is weak.
As for the white clay infillings, the ability of the cryptocrystalline SL and TL minerals of the olive green infillings to store water molecules is attested to on MIR spectra by large and overlapping bands at ∼ 3424 and 3220 cm−1 (Fig. 6e).
3.3 Mineral composition and OH stretching modes in the second sequence of clay infillings
3.3.1 White and turquoise clay infillings with dominant TL minerals
According to XRD patterns, this second generation of clay infillings consists mainly of TL minerals, with broad 00l basal reflections and very broad two-dimensional bands (Fig. 7a). Chemical data of these infillings plotted in a ternary diagram (Fig. 7b) are spread between the Mg and Ni poles of TL minerals (kerolite and pimelite respectively). Nevertheless, all the chemical data fall just below the theoretical line for talc (horizontal dashed line in the diagram). This shift reveals a slightly lower Si:ΣR ratio than the theoretical value of 1.33 for talc. As confirmed by XRD (Fig. 7a), this is due to a minor occurrence of SL minerals in these white and turquoise TL infillings. The shift is even larger towards the Ni pole of the chemical trend (Fig. 7b), pointing therefore to a greater proportion of SL minerals in the turquoise infillings (garnierite) of the Ni-silicate ores.
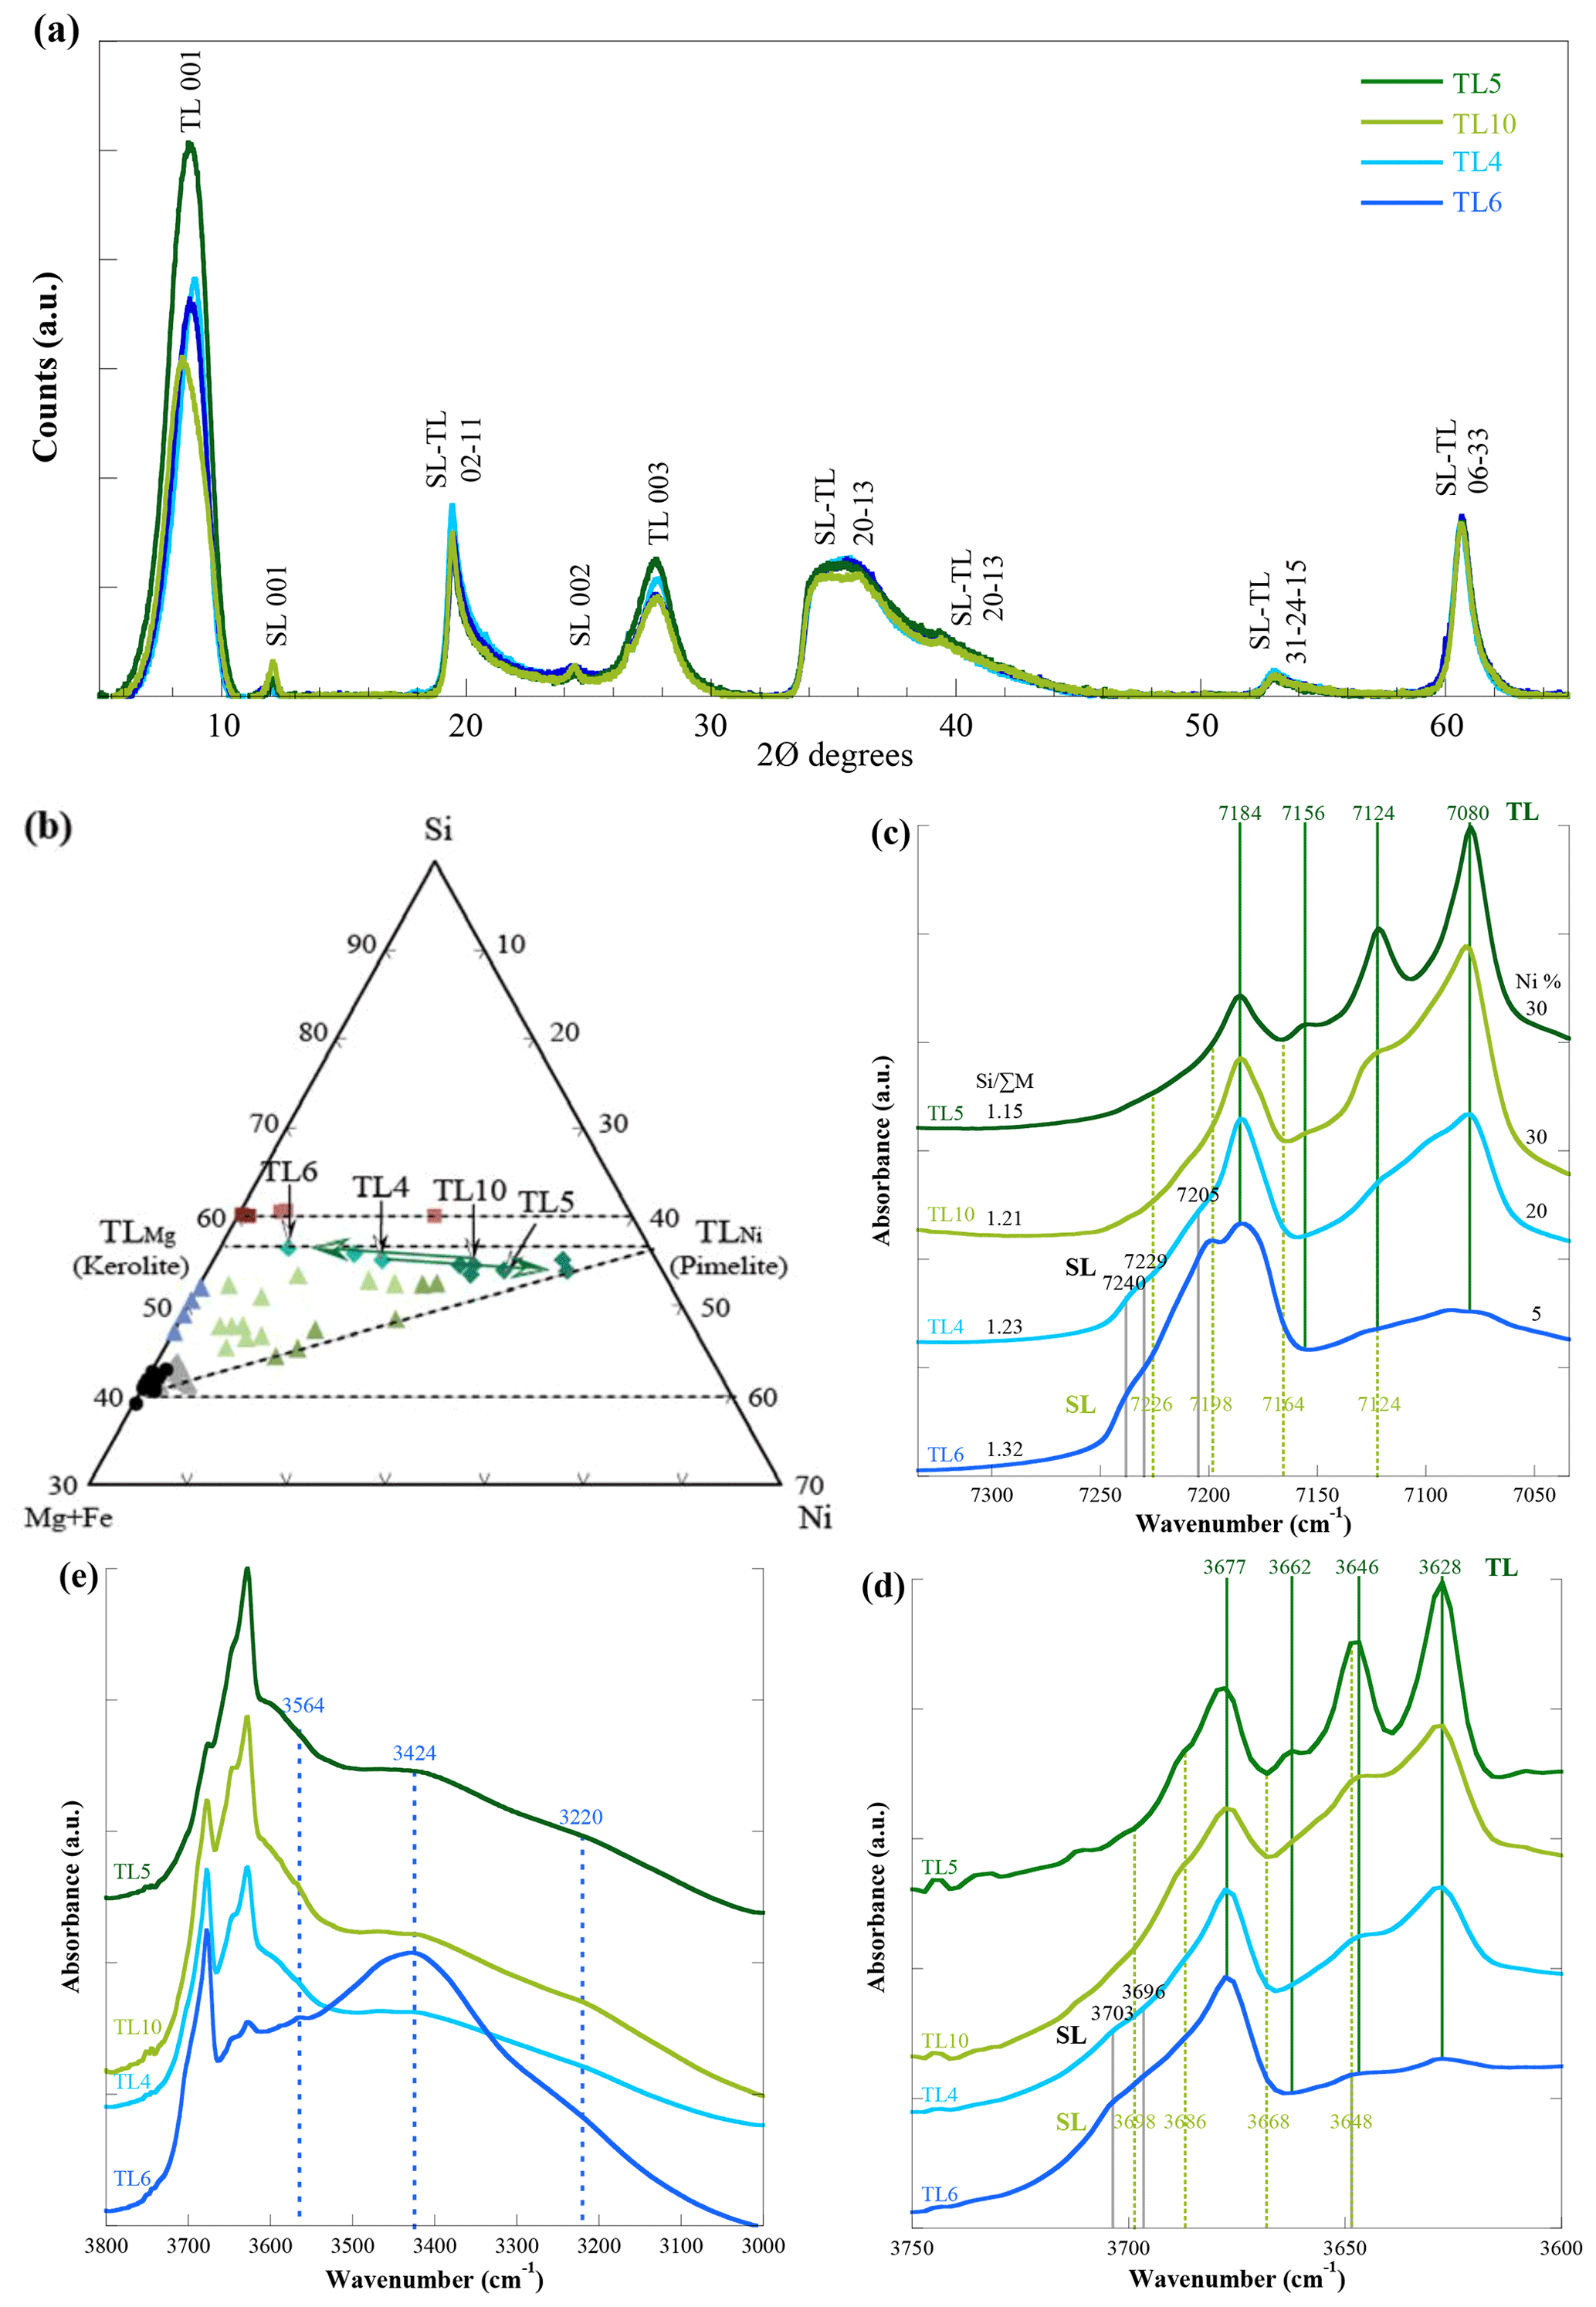
Figure 7White and turquoise clay samples with dominant talc-like (TL) minerals (TL6, TL4, TL10, TL5): (a) XRD analysis of mineral composition, (b) chemical composition reported in a ternary diagram, (c) OH stretching bands in the first overtone of NIR spectra, (d) OH stretching bands in the fundamental state of MIR spectra, and (e) enlarged view showing the broad signals related to weakly bound water molecules (MIR spectra). SL: serpentine-like minerals.
The main spectral variations reported on both NIR and MIR spectra illustrate the Ni for Mg substitution in octahedral sites of TL minerals from the white to the turquoise clay infillings (from TL6 to TL5 or bottom to top of Fig. 7c, d). However, both cations (i.e. Mg and Ni) remain largely segregated in these TL infillings. Indeed, the inner OH stretching bands for the Mg3OH configuration of TL at 7184 and 3677 cm−1 remains intense in all samples. Almost exclusive in the white infillings (TL6 in Fig. 7c, d), they are gradually replaced by the bands at 7080 and 3628 cm−1 of the Ni3OH configuration in the turquoise infillings (TL4, TL10, and TL5 in Fig. 7c, d). As for the olive green infillings, the intermediate bands for the Mg2NiOH configuration are barely detectable on both NIR and MIR spectra for the turquoise samples TL4 and TL10, and those for the MgNi2OH configuration are weak. However, the latter at 7124 cm−1 for the first overtone region (Fig. 7c) and at 3646 cm−1 for the fundamental region (Fig. 7d) are abnormally high in the Ni-rich sample TL5. As highlighted previously, this intense band could be due to inner OH vibrations either in an MgNi2OH configuration of TL minerals or in a Ni3OH configuration of SL minerals, or both. XRD data confirm the occurrence of 1:1 layer silicates in the clay infillings (Fig. 7a), suggesting therefore the segregation of Ni in both SL and TL minerals (i.e. preferential occurrence of the Ni3OH configuration in both types of layer silicates).
As for the first sequence of clay infilling (white or olive green), MIR spectra of this second sequence of clay infillings display very intense bands for water molecules, which interfere at higher frequency with the sharper peaks assigned to the OH stretching bands of the layer silicates (Fig. 7e). The greater contribution of the band centred at 3424 cm−1 in the sample T6 (Fig. 7e) points to variable proportions of weakly bound water molecules in TL minerals. This latter point is in agreement with contrasting shrinking and swelling capacity of the clays, mostly controlled by the amount of octahedral vacancies in the 2:1 layer silicates (Fonteneau et al., 2020).
3.3.2 White and green clay infillings with dominant sepiolite
Figure 8a displays the XRD patterns of this optional and ultimate sequence of white and greenish clay infillings where sepiolite (Sep) becomes dominant over TL minerals. The white infillings (SF1, SF6) mostly consist of Sep, whereas the greenish infilling (SF7) contains in addition minor amounts of TL and SL minerals. Both the white and greenish infillings also contain a small but variable quantity of quartz. Chemical data of the clay infillings plotted in a ternary diagram are superimposed on the theoretical line of the Mg−Ni solid solution of the Sep mineral group (horizontal dashed line in Fig. 8b). They are stretched between the Mg and Ni end-members of this mineral series (sepiolite and falcondoite, respectively). The Si:ΣR ratios of these samples (higher than those calculated for the TL infillings) are very close to the theoretical value of 1.50 for Sep (Table 1).
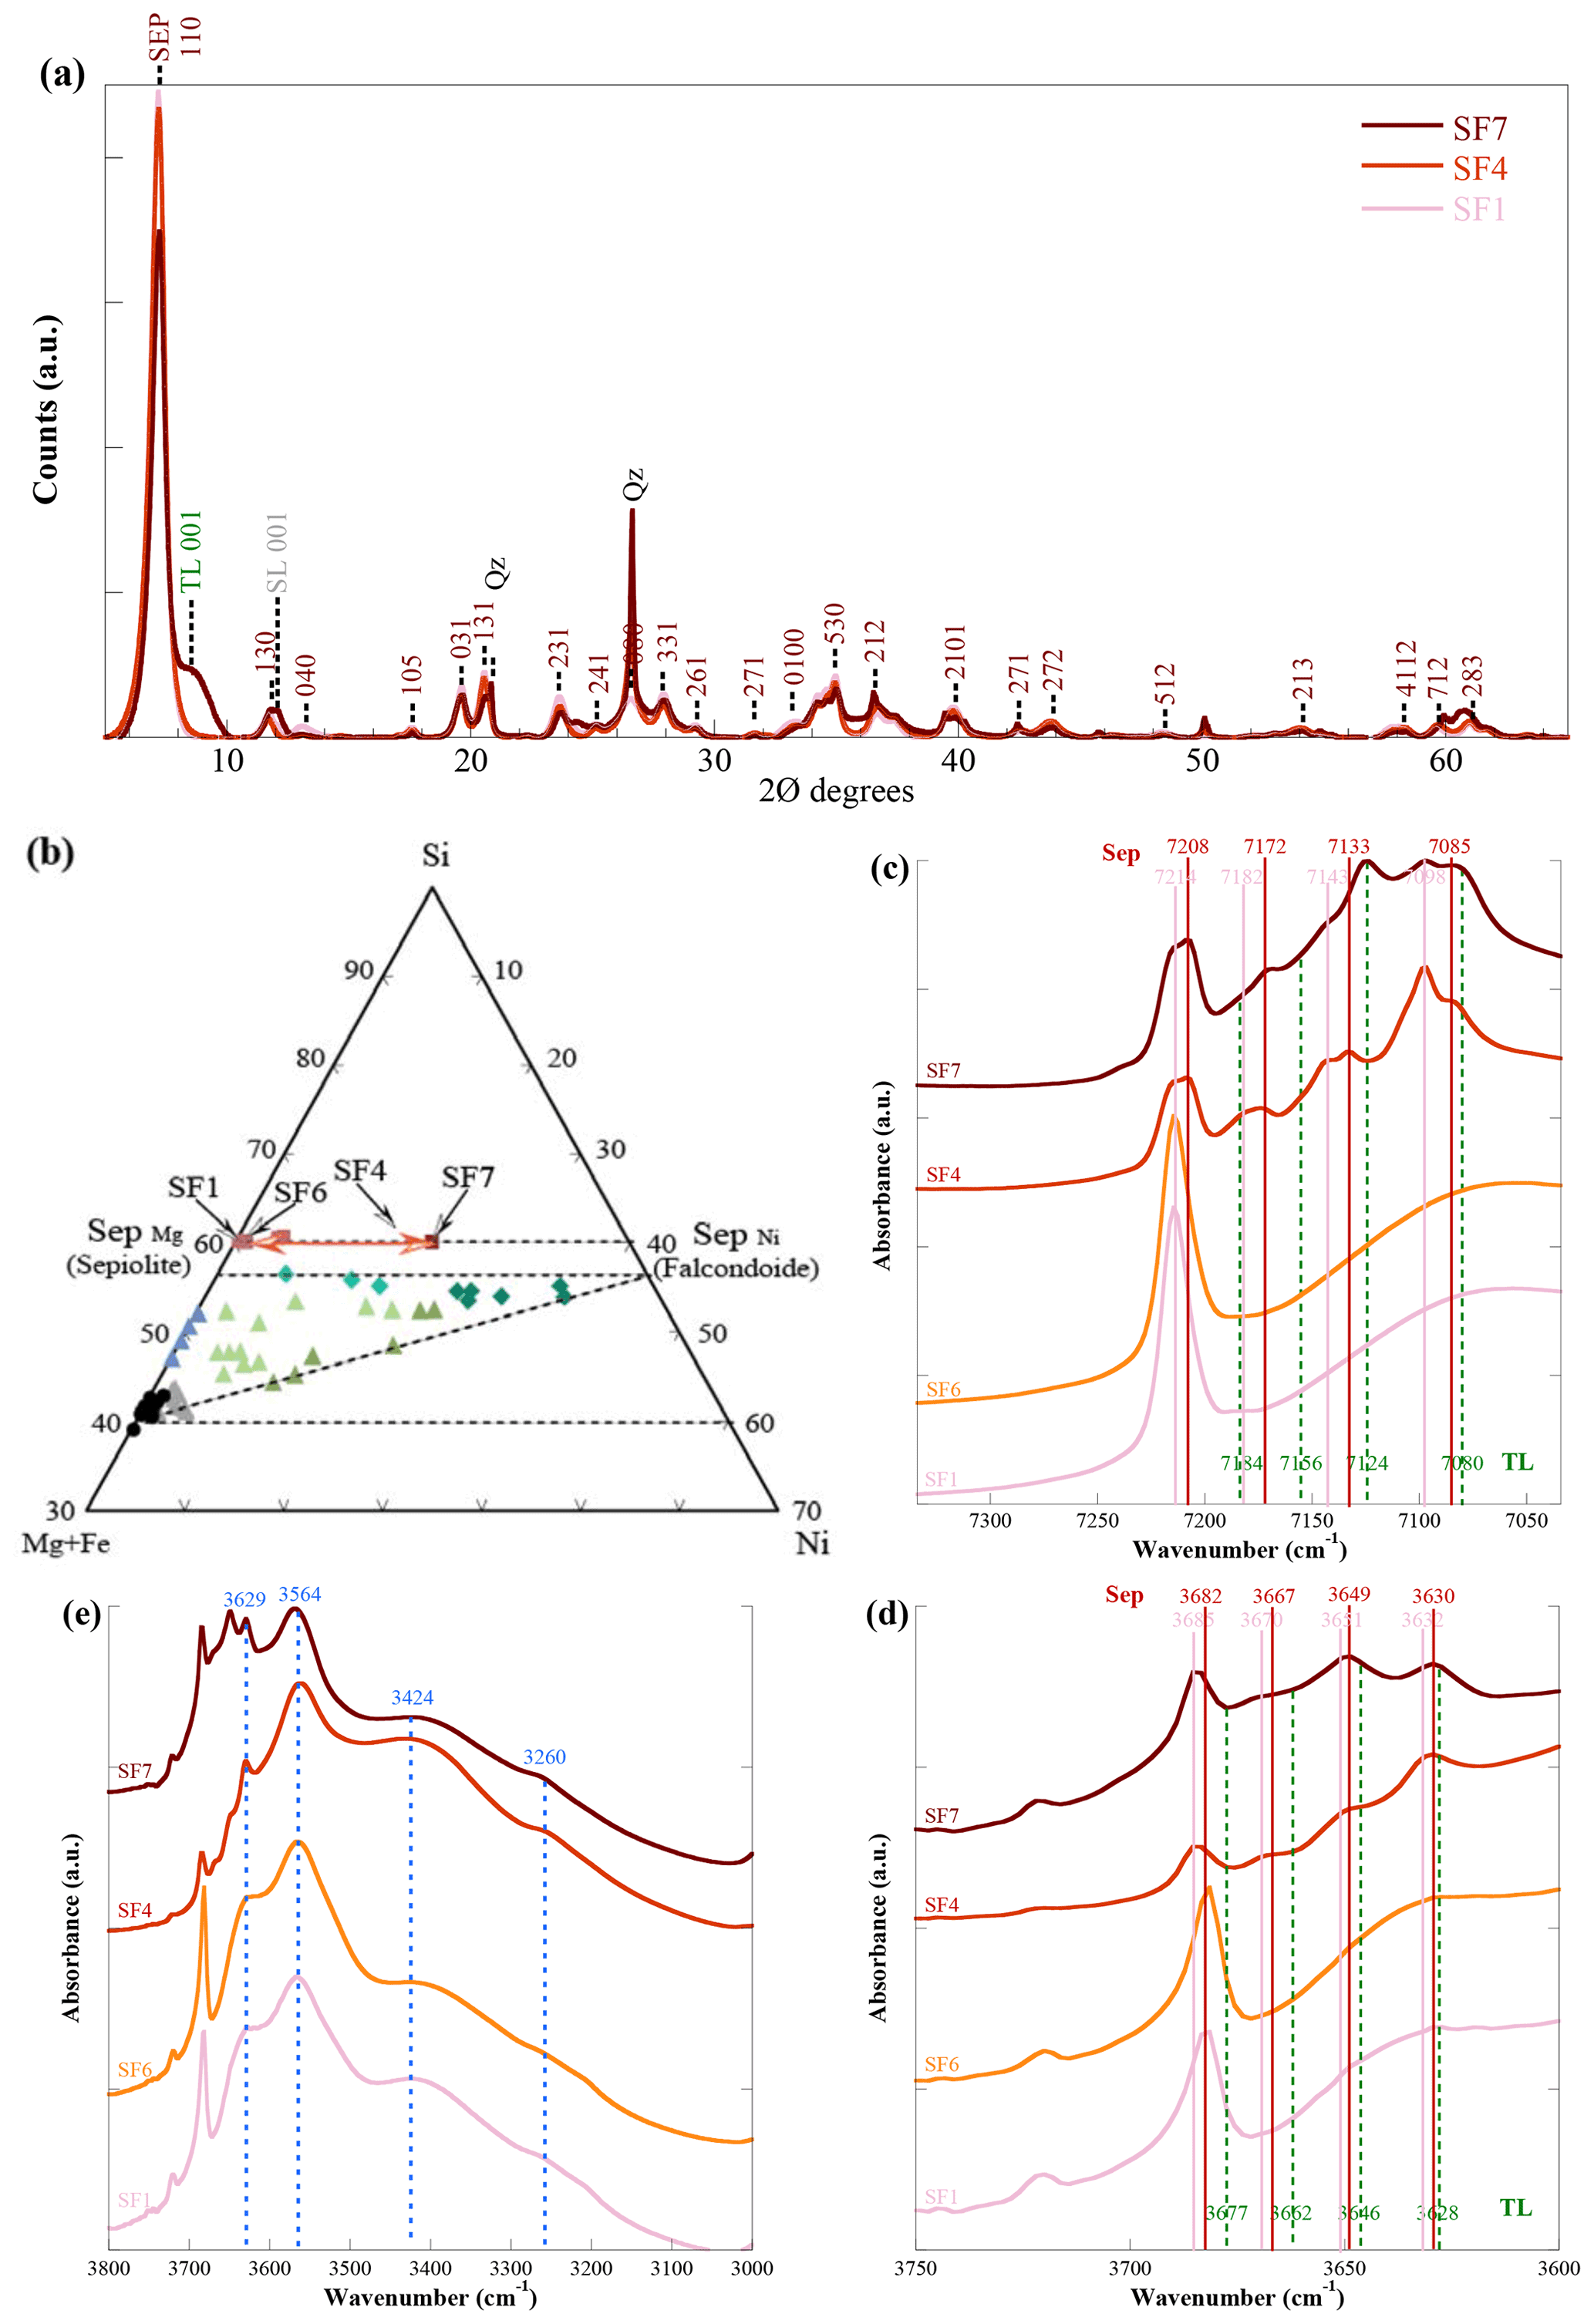
Figure 8White and greenish clay samples with dominant Sep (SF1, SF6, SF4, SF7): (a) XRD analysis of mineral composition, (b) chemical composition reported in a ternary diagram, (c) OH stretching bands in the first overtone of NIR spectra, (d) OH stretching bands in the fundamental state of MIR spectra, and (e) enlarged view showing the broad signals related to weakly bound water molecules (MIR spectra). Sep: sepiolite; TL: talc-like minerals; SL: serpentine-like minerals.
The spectra of these Sep infillings (Fig. 8c, d, e) exhibit relevant differences with those previously reported for the more common TL infillings of the Ni-silicate ores (Fig. 7c, d, e). The most remarkable difference is the much larger quantity of structural water in the samples (up to 17 wt % H2O in pure Sep). Structural water is assigned on MIR spectra to four intense, broad, and overlapping bands centred at 3629, 3564, 3424, and 3260 cm−1 (Fig. 8e). These bands strongly interfere at higher frequency with the sharper peaks of the OH stretching vibrations of these 2:1 layer silicates (mainly Sep but also TL). By analogy with what has been established for TL minerals and for similar sepiolite samples by infrared spectroscopy and thermogravimetric and differential thermal analyses (Brauner and Preisinger, 1956; Frost et al., 2001; Yeniyol, 2014; Fritsch et al., 2016), the first band at 3629 cm−1 is attributed to OH stretching vibrations of water molecules weakly bonded to Si–O, the second and third bands at 3564 and 3424 cm−1 to zeolitic water (i.e. crystallographically bound water in the channels of Sep), and the fourth band at 3260 cm−1 to water sorbed at the edges of the channels.
At higher frequency, NIR and MIR spectra display the two sets of OH stretching bands (Sep1 and Sep2 in Table 2) for Sep (vertical light and dark purple lines in Fig. 8c, d). For the white (Ni-free) infillings (SF1, SF6), only the band specific to the OH stretching vibration at Mg3OH sites of Sep is present. The first overtone at ∼ 7214 cm−1 (NIR) belongs to the high-frequency vibration of the first set (Sep1) of OH stretching bands (vertical light red lines in Fig. 8c). The fundamental vibration at ∼ 3682 cm−1 (MIR) corresponds to the second set (Sep2) of OH stretching bands (vertical dark red lines in Fig. 8d). In the greenish (Ni-rich) infillings (SF4, SF7), the splitting of the inner OH stretching vibration in two transitions for the other three sites of Sep (Mg2NiOH, MgNi2OH, Ni3OH) is larger and better expressed on NIR spectra (Fig. 8c) than on MIR spectra (Fig. 8b). In sample SF7, one shoulder at 7080 cm−1 is noticed for Ni3OH in TL minerals (vertical dashed dark green lines in Fig. 8c, d). In the same sample, another band is observed at 7124 cm−1, which could correspond to OH stretching vibrations in MgNi2OH sites of TL minerals and/or in Ni3OH sites of SL minerals. As for the turquoise TL infillings, the residual occurrence in the greenish Sep infillings of SL minerals (Fig. 8a) suggests that the segregation of Ni (or predominance of Ni3OH sites) is the rule in the ultimate sequence of clay infillings for the three mineral series of the Ni-silicate ores.
4.1 Residual mineral phases of the Ni-silicate ores
This spectroscopic study sheds light on the nature of the SL minerals of the clay infillings in the Ni-silicate ores. These SL minerals must be considered as residual products of larger crystals of serpentines found as separate or mixed species (Lz, Ctl, and Atg) in serpentine veins of peridotites (Fritsch et al., 2016) rather than a new generation of serpentine materials associated with the vertical development of thick lateritic profiles (e.g. Villanova-de-Benavent et al., 2014, 2016; Muñoz et al., 2019). Indeed, the various serpentine species at the origin of the production of ill-ordered and fine-grained SL minerals can be traced back from the frequency of the inner OH stretching mode of the dominant Mg3OH configuration of these 1:1 layer silicates. The frequency of this vibration on MIR and NIR spectra ranges from 3696 and 7129 cm−1 in samples mostly composed of Atg to 3703 and 7140 cm−1 in samples composed of Lz and Ctl. Spectroscopic patterns of the fine-grained SL minerals differ from those of the crystalline serpentines by an enlargement of the OH stretching bands, as well as a decrease in the signals assigned to the interlayer OH and a concomitant increase in the signal related to weakly bound water molecules. The dominant interlayer OH bands at 3686 and 7171 cm−1 related to the crystalline serpentines (3674 cm−1 for Atg) tend to disappear in favour of broader bands related to greater crystal disorder (or distortion) at higher frequencies (3696 and 7200 cm−1). On MIR spectra, the greater contribution of the interlayer OH vibration mode and the possible overlap with the signal arising from the inner OH vibration mode (more specifically at 3696 cm−1) render the identification of individual mineral phases difficult. NIR spectroscopy allows us to overcome this uncertainty, underlying therefore the interest of combining both techniques for a detailed characterisation of the 1:1 layer silicates of the Ni-silicate ores.
Our study also shows that the SL minerals of the Ni-rich (garnierite) and Ni-free (deweylite) sections of the veins in the Ni-silicate ores are identical. In both cases, the signals of the inner and interlayer OH vibrations are the same and limited to the Mg3OH configuration. The weak NIR signal at 7209 cm−1 assigned to inner OH vibration in a Mg2NiOH configuration in the serpentine species (Lz, Ctl, and Atg) has disappeared. The disappearance of this signal likely results from the preferential removal of domains in the octahedral layers containing chemical impurities such as Fe or Ni. The local removal of these domains is also consistent with a crystal disorder in this kind of low-temperature environment involving cationic vacancies (Christidis and Mitsis, 2006; Fonteneau et al., 2020).
4.2 Neoformation of Ni-bearing phases
The major spectral changes in the white and green clay infillings of the Ni-silicate ores are related to the sequential decrease in the inner and interlayer OH bands of the SL minerals and their gradual replacement by the inner OH bands of the 2:1 layer silicates (mainly TL minerals, locally Sep). These spectral changes illustrate therefore the conversion of 1:1 layer silicates into 2:1 layer silicates, which is limited in the first sequence of clay infillings (STL) and almost completed in the second (TL). In the white veins (deweylite) of the reactivated faults, the inner OH vibration of the 2:1 layer silicates is limited to the Mg3OH configuration. In the greenish veins (garnierite) of the Ni-silicate ores, the Ni for Mg substitution in the octahedral sites of the newly formed 2:1 layer silicates leads to a splitting of the inner OH stretching vibration into as many as four bands, corresponding to the following change in configurations: Mg3OH → Mg2NiOH → MgNi2OH → Ni3OH. These results indicate that the main Ni-bearing phases of the Ni-silicate ores are the Ni-rich TL minerals (pimelite). The occurrence of Ni-rich SL minerals (nepouite) is only suspected in the second sequence of turquoise infillings, where both Ni-rich TL and Ni-rich SL minerals are finely mixed. As suggested by Fritsch et al. (2019), Ni-rich SL minerals could arise from the removal of one silica sheet from pimelite associated with the redistribution of Si in the oscillatory zoning patterns of the Ni-silicate ores.
4.3 Segregation of Mg and Ni
Our results also lead us to conclude that the segregation of Mg and Ni can be established at different scales. At the scale of the plateaux hosting the Ni-silicate ores, the differentiation of sections of white (Ni-free) and greenish (Ni-rich) patches along the fault network of the saprock (e.g. Cluzel and Vigier, 2008) testifies to localised redistributions of Ni and exports of Mg and Fe (Fritsch et al., 2019). At the scale of the clay minerals, our results underline the preferential occurrence of the Mg3OH and Ni3OH configurations in the three mineral series of the clay infillings (mostly in the dominant TL minerals). This segregation of Ni in these 1:1 and 2:1 layer silicates has already been established elsewhere by various spectroscopic methods (optical absorption spectroscopy, infrared spectroscopy, X-ray absorption spectroscopy) (Wiewiora et al., 1981; Gerard and Herbillon, 1983; Manceau and Calas, 1985; Manceau et al., 1986; Muñoz et al., 2019). It was either attributed to nano-clusters of Ni in octahedral sites of these layer silicates or to mixed layers with Mg and Ni octahedral sheets (i.e. kerolite and pimelite) (Manceau and Calas, 1985; Manceau et al., 1986). The second interpretation is consistent with the present results and those of the detailed textural and geochemical investigations of Ni-bearing silicates from New Caledonia by Fritsch et al. (2019). Magnesium and Ni would therefore not be individualised as clusters (or domains) in the layer silicates but rather as separate mineral phases, more specifically in the Mg–Ni oscillatory zoning patterns (or banded patterns) of the clay infillings (Fritsch et al., 2019).
Here, we briefly present and discuss the vibrational bands reported in the 1200–400 cm−1 range of MIR spectra for the 1:1 and 2:1 layer silicates (Srp, SL, TL, and Sep) identified in the clay infillings of the Ni-silicate ores (Fig. A1). These bands can be grouped in three categories of vibrations (from left to right in the graphs of Fig. A1): (I) the stretching of Si–O bonds including the apical (out-of-plane) vibrations for both categories of layer silicates and the additional basal (in-plane) vibrations for the 1:1 layer silicates (Farmer and Russell, 1964; Yariv and Heller-Kallai, 1975; Fuch et al., 1998), (II) the libration motions of OH groups (Russell et al., 1970; Yariv and Heller-Kallai, 1975; Golightly, 1979; Ishida, 1990), as well as at lower frequency the hindered translation of OH along a direction perpendicular to the layers, and (III) the bending of Si–O bonds (Wilkins and Ito, 1967).
The diversity of vibrational signals is high in clay infillings predominantly made of 1:1 layer silicates (Srp, SL) (Fig. A1a), low in clay infillings composed mostly of TL minerals (Fig. A1b), and intermediate in clay infillings with dominant sepiolite (Fig. A1c). Spectra of clay infillings with mixed mineral phases are the most complicated to interpret, more specifically those composed of mixed SL and TL minerals (Fig. A1d, e).
As established before with the OH stretching vibrations, serpentine parent material can be identified from the shape and frequency of the Si–O stretching vibrations of the dominant 1:1 layer silicates (Srp-SL) of the white clay infillings (Fig. A1a). From this point of view, the less altered SL1 sample displays characteristic spectral patterns of chrysotile (Ctl) (Balan et al., 2002b; Fritsch et al., 2021) with an apical Si–O vibration at 1082 cm−1 and a sharp signal at 953 cm−1 for the dominant basal Si–O vibration. A second weaker basal Si–O vibration at 1015 cm−1 is also present and characteristic of the tubular shape of Ctl (Balan et al., 2002b). In the other white infillings of Fig. A1a, change in parent materials can be deduced from the position of the dominant basal Si–O vibration. This vibration is observed at 993 cm−1 in samples SL10 and SL13 comprising Atg residues and at intermediate frequency (970 cm−1) in sample SL8 containing lizardite. The presence of Atg is also suggested from weak signals at 628 and 564 cm−1 for libration and hindered translation of OH groups, respectively. All these crystallographic signals led therefore to the same mineralogical interpretations as those established previously by XRD analysis. Moreover, the degradation of these signals by the broadening and merging of the apical and basal Si–O vibrations also marks the transformation of these serpentine species into ill-ordered SL minerals (degradation optimal in samples SL10 and SL13).
In the infillings mostly composed of TL minerals, only one signal related to the apical Si–O vibration is observed at 1020 cm−1 (Fig. A1b). This signal is intense and extremely wide due to the ill-ordered nature of the TL minerals. The same type of signal is observed for the infillings predominantly made of Sep (Fig. A1c), with nevertheless three satellite vibrations at 1104, 1078, and 980 cm−1 likely due to the channel structure of the mineral. These 2:1 layer silicates also display at lower frequencies doublets characteristic of OH libration motions. For the TL minerals, the first band at 667 cm−1 is commonly attributed to Mg–OH libration motion, while the second at 711 cm−1 corresponds to OH libration motion involving both Mg and Ni (Brindley et al., 1979; Ishida, 1990; Blanchard et al., 2018). In our set of samples, the first band at 667 cm−1 is seen alone in the white (Ni-free) clay infillings made of mixed SL and TL minerals (Fig. A1d). The second band at 711 cm−1 gradually increases with the content of Ni in the olive green infillings made of a mixture of SL and TL minerals (Fig. A1e), as well as in the white and turquoise infillings composed predominantly of TL minerals (Fig. A1b). In sepiolite, the doublet shifts at lower frequency (Fig. A1c). The first type of band at 651 cm−1 is more intense than the second at 691 cm−1 in the Mg-rich sepiolite, whereas it is the reverse in Ni-rich sepiolite (i.e. falcondoite). Moreover, the bands of the doublet are sharp in the Mg-rich samples (SF1 and SF6) and wide in the Ni-rich samples made of both Sep and TL minerals (SF7 and SF4) likely due to lower crystallinity and smaller particle sizes in the greenish sections of the Ni-silicate ores (Fritsch et al., 2019).
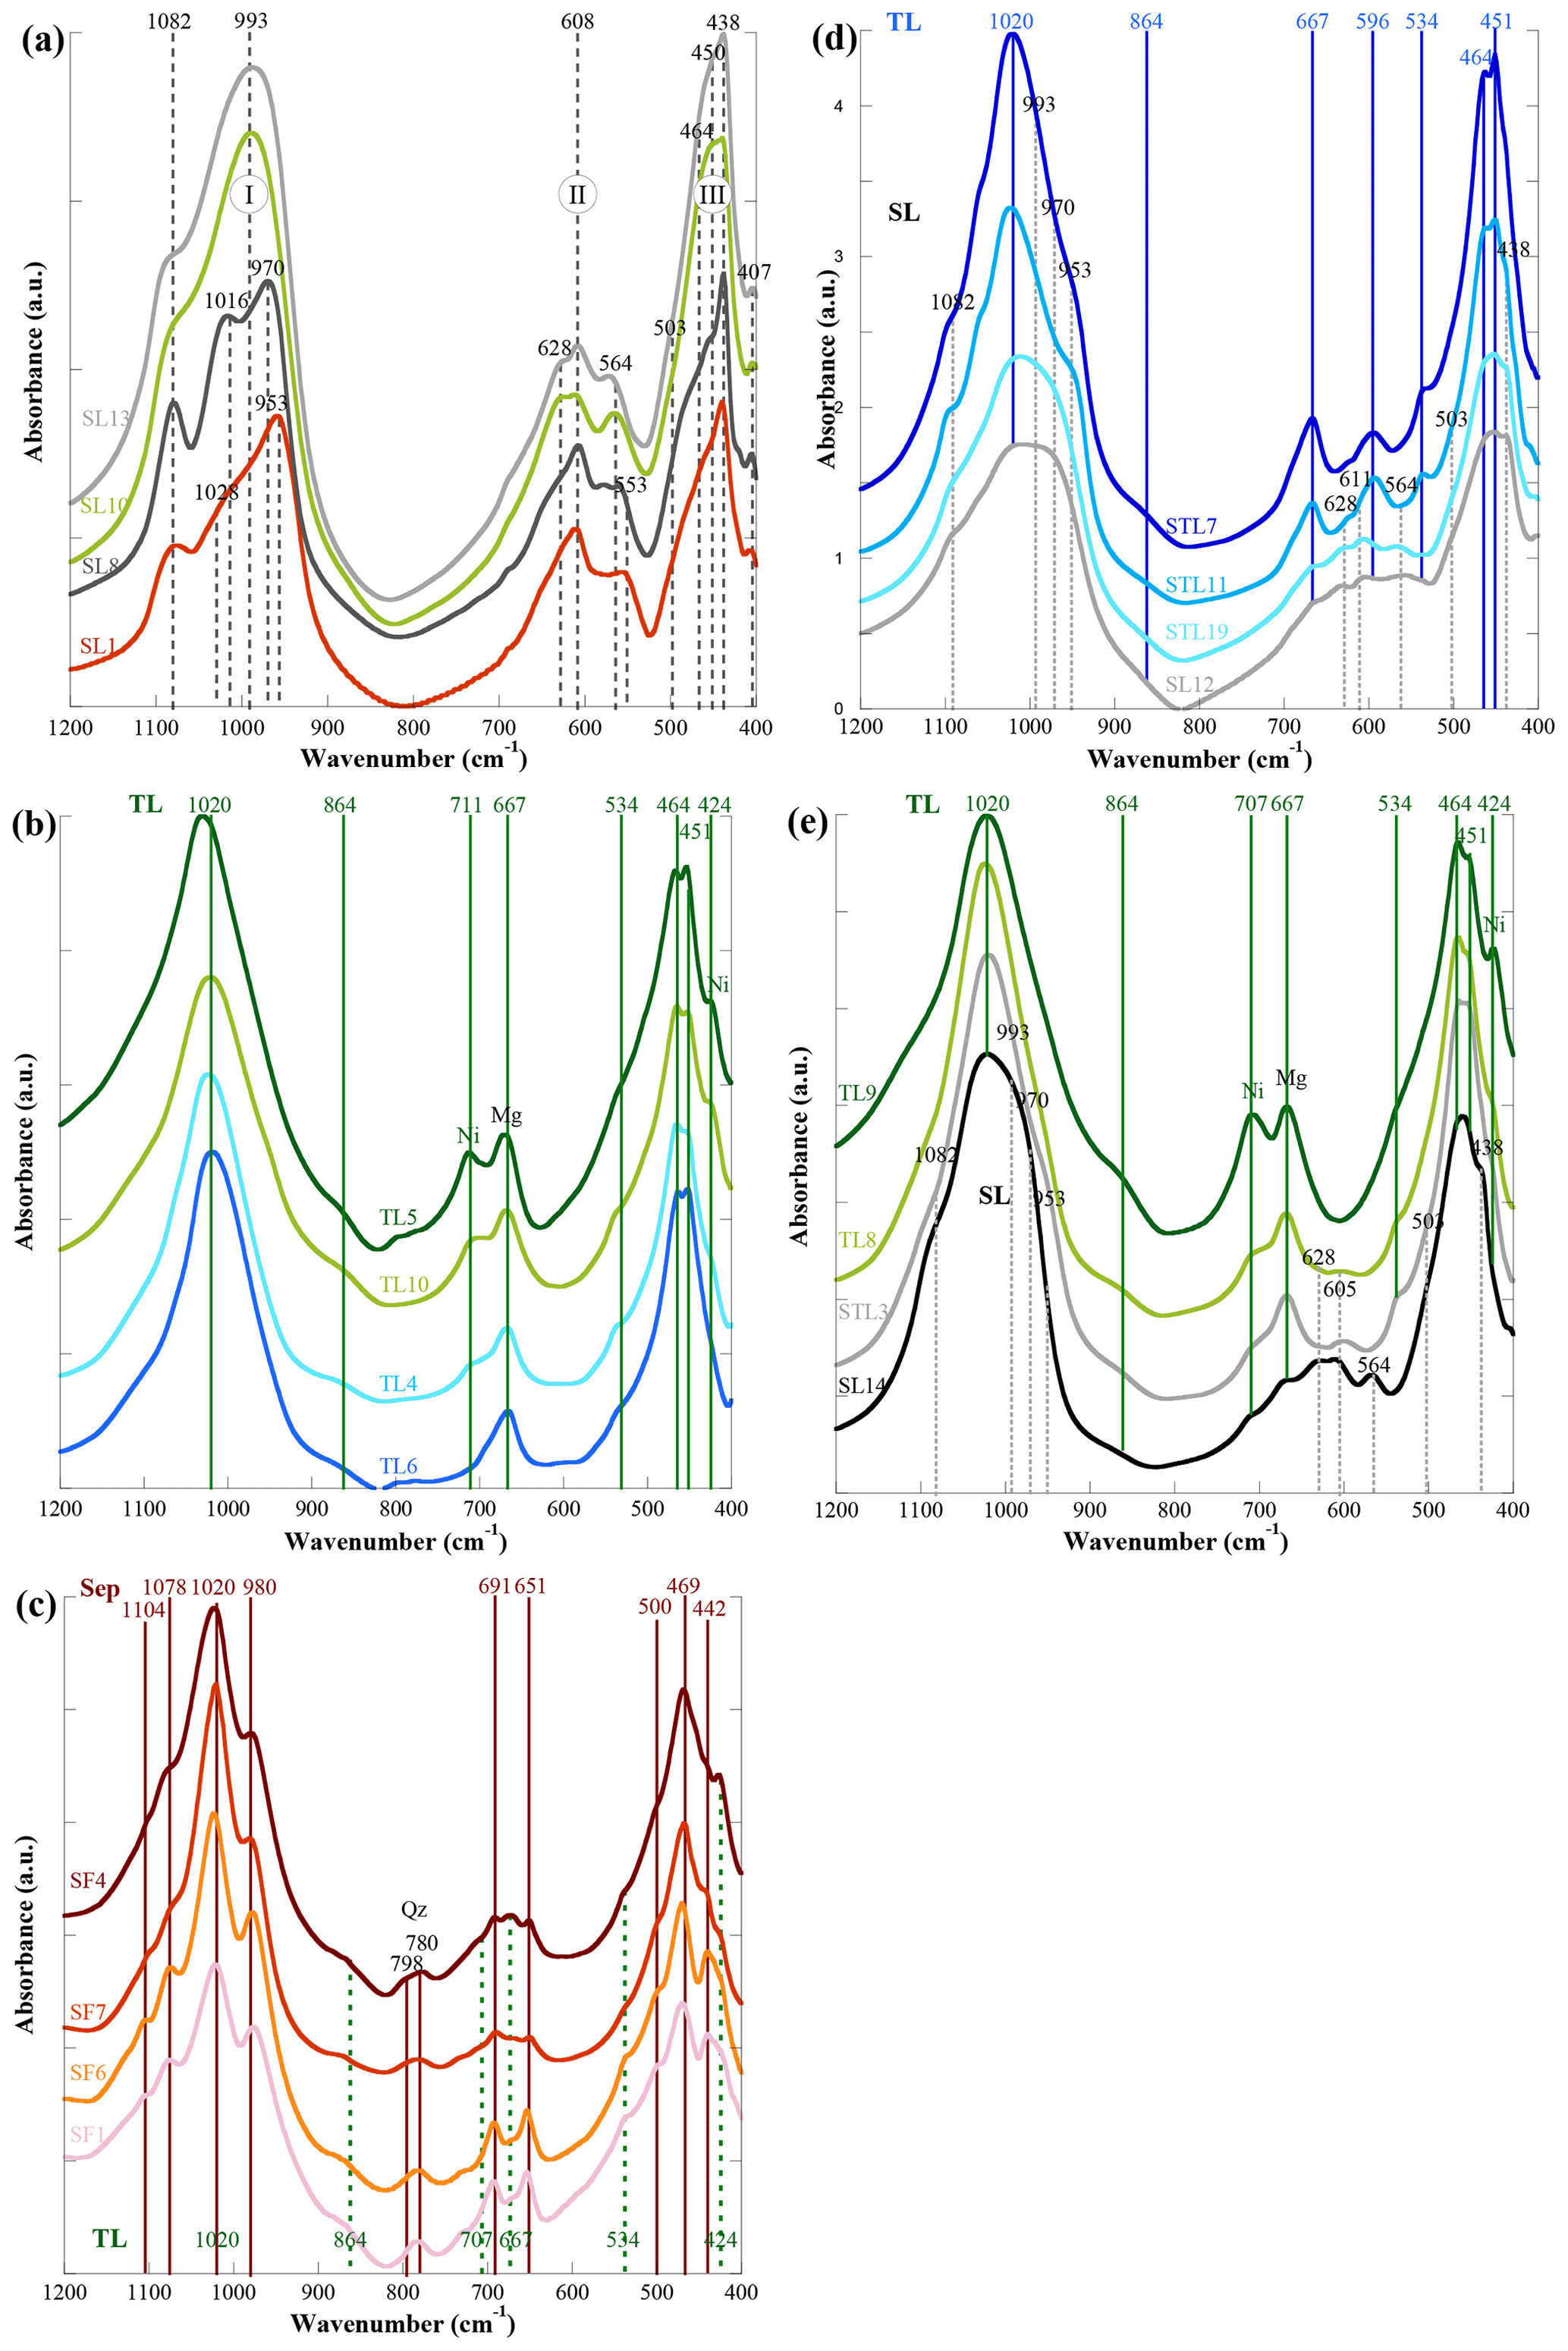
Figure A1(a) Lattice vibrations of the Mg−Ni 1:1 and 2:1 layer silicates (Srp: serpentine; SL: serpentine-like; TL: talc-like; Sep: sepiolite) of the selected samples from the Ni-silicate ores: (a) white clay samples with dominant SL minerals (OH stretching bands in Fig. 4c, d), (b) white and turquoise clay samples with dominant TL minerals (OH stretching bands in Fig. 7c, d), (c) white and greenish clay samples with dominant sepiolite (OH stretching bands in Fig. 8c, d), (d) white clay samples with mixed SL and TL minerals (OH stretching bands in Fig. 5c, d), and (e) white and olive green clay samples with mixed SL and TL minerals (OH stretching bands in Fig. 6c, d). Qz: quartz.
All data used in this article to construct the XRD diagrams and FTIR spectra can be found in the Supplement. Additional requests should be addressed to Emmanuel Fritsch.
The supplement related to this article is available online at: https://doi.org/10.5194/ejm-33-743-2021-supplement.
EF, EB, SP, and FJ have all contributed to the interpretation of the MIR and NIR spectra. EF and SP have performed in addition the field and experimental works. All authors have contributed to the discussion of the results and preparation of the manuscript.
Etienne Balan is associate editor of European Journal of Mineralogy. The peer-review process was guided by an independent editor, and the authors also have no other competing interests to declare.
Publisher’s note: Copernicus Publications remains neutral with regard to jurisdictional claims in published maps and institutional affiliations.
The authors thank Fabien Trotet, Pierre Epinoux, Philippe Bains, Philippe Hoffler, Giles Monteil (SLN), Julie Michaud (SMT/SMCB), Yann Dijkstra, René Feré (CFTMC), Clément Couteau, Fédéric Villedieu (KNS), and Christian Tessarolo (Goro-VALE) who provided helpful technical reports and assisted with access to mining sites. Pierre Chansigaud (IC2MP spectroscopy platform, University of Poitiers) is thanked for technical assistance in the production of the MIR and NIR spectra. We thank the two anonymous reviewers for their detailed and insightful comments.
This research has been supported by the Centre National de la Recherche Scientifique (CESSUR 2010: project “Conditions of formation of silicate ores from New Caledonia”), the Centre National de Recherche Technologique Nickel et son environnement (CNRT – Nickel and its environment 2010–2014: project “Ni/Co mineralization factors of laterites derived from ultramafic rocks of New-Caledonia”), and the European Union (ERDF) “Région Nouvelle Aquitaine”.
This paper was edited by Alessio Langella and reviewed by two anonymous referees.
Balan, E., Saitta, A. M., Mauri, F., Lemaire, C., and Guyot, F.: First-principles calculation of the infrared spectrum of lizardite, Am. Mineral., 87, 1286–1290, https://doi.org/10.2138/am-2002-1003, 2002a.
Balan, E., Mauri, F., Lemaire, C., Brouder, C., Guyot, F., Marco Saitta, A., and Devouard, B.: Multiple ionic-plasmon resonances in naturally occurring multiwall nanotubes: Infrared spectra of chrysotile asbestos, Phys. Rev. Lett., 89, 177401, https://doi.org/10.1103/PhysRevLett.89.177401, 2002b.
Balan, E., Fritsch, E., Juillot, F., Allard, T., and Petit, S.: Local mode interpretation of the OH overtone spectrum of 1:1 phyllosilicates, Eur. J. Mineral., 33, 209–220, https://doi.org/10.5194/ejm-33-209-2021, 2021a.
Balan, E., Fritsch, E., Radtke, G., Paulatto, L., Juillot, F., and Petit, S.: First-principles modeling of the infrared spectrum of antigorite, Eur. J. Mineral., 33, 389–400, https://doi.org/10.5194/ejm-33-389-2021, 2021b.
Baron, F. and Petit, S.: Interpretation of the infrared spectra of the lizardite-nepouite series in the near and middle infrared range, Am. Mineral., 101, 423–430, https://doi.org/10.2138/am-2016-5352, 2016.
Bish, D. L. and Brindley, G. W.: Deweylites, mixtures of poorly crystalline hydrous serpentine and talc-like minerals, Mineral. Mag., 42, 75–79, https://doi.org/10.1180/minmag.1978.042.321.09, 1978.
Blanchard, M., Méheut, M., Delon, L., Poirier, M., Micoud, P., Le Roux, C., and Martin, F.: Infrared spectroscopic study of the synthetic Mg-Ni talc series, Phys. Chem. Miner., 45, 843–854, https://doi.org/10.1007/s00269-018-0966-x, 2018.
Brauner, K. and Preisinger, A.: Struktur und entstehung des sepioliths, Tscher. Miner. Petrog., 6, 120–140, https://doi.org/10.1007/BF01128033, 1956.
Brindley, G. W.: The structure and chemistry of Hydrous Nickel-containing silicate and Nickel-Aluminium Hydroxy minerals, B. Mineral., 103, 161–169, 1980.
Brindley, G. W. and Hang, P. T.: The nature of garnierite–I Structure, chemical compositions and color characteristics, Clay. Clay Miner., 21, 11–15, https://doi.org/10.1346/CCMN.1973.0210106, 1973.
Brindley, G. W. and Maksimović, Z.: The nature and nomenclature of hydrous nickel-containing silicates, Clay Miner., 10, 271–277, https://doi.org/10.1180/claymin.1974.010.4.05, 1974.
Brindley, G. W. and Wan, H. M.: Composition, structures and thermal behaviour of nickel-containing minerals in the lizardite-nepouite series, Am. Mineral., 60, 863–871, 1975.
Brindley, G. W., Bish, D., and Wan, H. M.: Compositions, structures, and properties of nickel-containing minerals in the kerolite–pimelite series, Am. Mineral., 64, 615–625, 1979.
Bukas, V. J., Tsampodimou, M., Gionis, V., and Chryssikos, G. D.: Synchronous ATR infrared and NIR-spectroscopy investigation of sepiolite upon drying, Vib. Spectrosc., 68, 51–60, https://doi.org/10.1016/j.vibspec.2013.05.009, 2013.
Capitani, G. C. and Ventruti, G.: Ni-serpentine nanoflakes in the garnierite ore from Campello Monti (Strona Valley, Italy): Népouite with some pecoraite outlines and the processing of Ni-containing ore bodies, Am. Mineral., 103, 629–644, https://doi.org/10.2138/am-2018-6229, 2018.
Cathelineau, M., Caumon, M-C., Massei, F., Brie, D., and Harlaux, M.: Raman spectra of Ni-Mg kerolite: effect of Ni-Mg substitution on O-H streching vibrations, J. Raman Spectrosc., 46, 933–940, https://doi.org/10.1002/jrs.4746, 2015.
Cathelineau, M., Myagkiy, A., Quesnel, B., Boiron, M. C., Gautier, P., Boulvais, P., Ulrich, M., Truche, L., Golfier, F., and Drouillet, M.: Multistage crack seal vein and hydrothermal Ni enrichment in serpentinized ultramafic rocks (Koniambo massif, New Caledonia), Miner. Deposita, 52, 961–978, https://doi.org/10.1007/s00126-016-0695-3, 2017.
Christidis, G. E. and Mitsis, I.: A new Ni-rich stevensite from the ophiolite complex of Othrys, Central Greece, Clay. Clay Miner., 54, 653–666, https://doi.org/10.1346/CCMN.2006.0540601, 2006.
Cluzel, D. and Vigier, B.: Syntectonic mobility of supergene nickel ores from New Caledonia (Southwest Pacific), Evidences from faulted regolith and garnierite veins, Resour. Geol., 58, 161–170, https://doi.org/10.1111/j.1751-3928.2008.00053.x, 2008.
Compagnoni, R., Cossio, R., and Mellini, M.: Raman anisotropy in serpentine minerals, with a caveat on identification, J. Raman Spectrosc., 52, 1334–1345, https://doi.org/10.1002/jrs.6128, 2021.
Dubinska, E., Sakharov, B. A., Kapron, G., Bylina, P., and Kozubowski, J.: A. Layer silicates from Szklary (Lower Silesia): from ocean floor metamorphism to continental chemical weathering, Geol. Sudetica, 33, 85–105, 2000.
Elias, M.: Global laterite resources, Australian Journal of Mining, 16, 64–65, 2001.
Farmer, V. C. and Russell, J. D.: The infra-red spectra of layer silicates, Spectrochim. Acta, 20, 1149–1173, https://doi.org/10.1016/0371-1951(64)80165-X, 1964.
Fritsch, E., Juillot, F., Dublet, G., Fonteneau, L, Fandeur, D., Martin, E., Caner, L. Auzende A-L., Grauby, O., and Beaufort, D.: An alternative model for the formation of hydrous layer silicates (“deweylite”/“garnierite”) in faulted peridotites of New Caledonia: I. Texture and mineralogy of a paragenetic succession of silicate infillings, Eur. J. Mineral., 28, 295–311, https://doi.org/10.1127/ejm/2015/0027-2503, 2016.
Fritsch, E., Balan, E., Petit, S., and Juillot, F.: Structural, textural, and chemical controls on the OH stretching vibrations in serpentine-group minerals, Eur. J. Mineral., 33, 447–462, https://doi.org/10.5194/ejm-33-447-2021, 2021.
Fritsch, E. J. C., Juillot, F., Dublet, G., Fonteneau, L., Fandeur, D., Martin, E., Caner, L., Auzende, A. L., and Beaufort. D.: An alternative model for the formation of hydrous layer silicates (“deweylite”/“garnierite”) in faulted peridotites of New Caledonia: II. Petrography and chemistry of white and green clay infillings, Eur. J. Mineral., 31, 945–962, https://doi.org/10.1127/ejm/2019/0031-2869, 2019.
Fonteneau, L., Caner, L., Petit, S., Juillot, F., Ploquin, F., and Fritsch, E.: Swelling capacity of mixed talc-like/stevensite layers in white/green clay infillings (“deweylite”/“garnierite”) found in serpentine veins of faulted peridotites (New Caledonia), Am. Mineral., 105, 1536–1546, https://doi.org/10.2138/am-2020-6984, 2020.
Fuch, Y., Linares, J., and Mellini, M.: Mössbauer and infrared spectrometry of lizardite-1T from Monte Fico, Elba, Phys. Chem. Miner., 26, 111–115, https://doi.org/10.1007/s002690050167, 1998.
Frost, R. L., Locos, O. B., Ruan, H., and Kloprogge, J. T.: Near-infrared and mid-infrared spectroscopic study of sepiolites and palygorskites, Vib. Spectrosc., 27, 1–13, https://doi.org/10.1016/S0924-2031(01)00110-2, 2001.
Gerard, P. and Herbillon, A.: Infrared studies of Ni-bearing clay minerals of the kerolite-pimelite series, Clay. Clay Miner., 31, 143–151, https://doi.org/10.1346/CCMN.1983.0310209, 1983.
Golightly, J. P.: The chemical composition and infrared spectrum of nickel- and iron-substituted serpentine from a nickelferous laterite profile, Soroako, Indonesia, Can. Mineral., 17, 719–728, 1979.
Ishida, K.: Identification of infrared OH librational bands of talc-willemseite solid solution and AL(IV)-free amphiboles through deuteration, Mineral. J., 15, 93–104, https://doi.org/10.2465/minerj.15.93, 1990.
Kloprogge, J. T., Ruan, H., and Frost, R. L.: Near-infrared spectroscopic study of synthetic and natural pyrophylite, Neues Jb. Miner. Monat., 8, 337–347, 2000.
Madejová, J., Balan, E., and Petit, S.: Application of vibrational spectroscopy (IR and Raman) on the characterization of industrial minerals, EMU Notes in Mineralogy, Advances in the Characterization of Industrial Minerals, 9, 171–226, https://doi.org/10.1180/EMU-notes.9, 2011.
Manceau, A. and Calas, G.: Heterogeneous distribution of nickel in hydrous silicates from New Caledonia ore deposits, Am. Mineral., 70, 549–558, 1985.
Manceau, A., Calas, G., and Decarreau, A.: Nickel-bearing clay minerals: II Intercrystalline distribution of nickel: an X-ray absorption study, Clay Miner., 21, 341–360, 1986.
Maubec, N., Orberger, B., Blaineau, P. G., Villanova-de-Benavent, C., Da Silva Alves, A., Duée, C., Wille, G., and Delchini, S.: Garnierite characterization for open mineral databases, J. Geochem. Explor., 231, 106874, https://doi.org/10.1016/j.gexplo.2021.106874, 2021.
Muñoz, M., Ulrich, M., Cathelineau, M., and Mathon, O.: Weathering processes and crystal chemistry of Ni-bearing minerals in saprock horizons of New Caledonia ophiolite, J. Geochem. Explor., 198, 82–99, https://doi.org/10.1016/j.gexplo.2018.12.007, 2019.
Petit, S., Martin, F., Wiewiora, A., De Parseval, P., and Decarreau, A.: Crystal-chemistry of talc: a near infrared (NIR) spectroscopy study, Am. Mineral., 89, 319–326, https://doi.org/10.2138/am-2004-2-310, 2004.
Post, J. E., Bish, D. L., and Heaney, P. J.: Synchrotron powder X-ray diffraction study of the structure and dehydration behavior of sepiolite, Am. Mineral., 92, 91–97, https://doi.org/10.2138/am.2007.2134, 2007.
Prencipe, M., Noel, Y., Bruno, M., and Dovesi, R.: The vibrational spectrum of lizardite-1T [Mg3Si2O5(OH)4] at the Γ point: A contribution from an ab initio B3LYP calculation, Am. Mineral., 94, 986–994, https://doi.org/10.2138/am.2009.3127, 2009.
Russell, J. D., Farmer, V. C., and Velde, B.: Replacement of OH by OD in layer silicates, and identification of the vibrations of these groups in infra-red spectra, Mineral. Mag., 37, 869–879, https://doi.org/10.1180/minmag.1970.037.292.01, 1970.
Tauler, E., Proenza, J. A., Galí, S., Lewis, J. F., Labrador, M., Garcia-Romero, E., Suarez, M., Longo, F., and Bloise, G.: Ni-sepiolite-falcondoite in garnierite mineralization from the Falcondo Ni-laterite deposit, Dominican Republic, Clay Miner., 44, 435–454, https://doi.org/10.1180/claymin.2009.044.4.435, 2009.
Villanova-de-Benavent, C., Proenza, J. A., Galí, S., and Tauler, E.: Talc- and serpentine-like “garnierites” in the Falcondo Ni-laterite deposit, Dominican Republic, Let's talk ore deposits, 11th Biennial Meeting SGA 2011, Antofagasta, Chile, 3 pp., 2011.
Villanova-de-Benavent, C., Proenza, J. A., Galí, S., García-Casco, A., Tauler, E., Lewis, J. F., and Longo, F.: Garnierites and garnierites: Texture, mineralogy and geochemistry in the Falcondo Ni-laterite deposit, Dominican Republic, Ore Geol. Rev., 58, 91–109, https://doi.org/10.1016/j.oregeorev.2013.10.008, 2014.
Villanova-de-Benavent, C., Jawhari, T., Roqué-Rosell, J., Galí., S., and Proenza, J. A.: Ni-bearing phyllosilicates (“garnierite”): New insights from thermal analysis, µ Raman and IR spectroscopy, Appl. Clay Sci., 175, 47–66, https://doi.org/10.1016/j.clay.2019.03.036, 2019.
Wells, M. A., Ramanaidou, E. R., Verrall, M., and Tessarolo, C.: Mineralogy and crystal chemistry of “garnierites” in the Goro lateritic nickel deposit, New Caledonia, Eur. J. Mineral., 21, 467–483, https://doi.org/10.1127/0935-1221/2009/0021-1910, 2009.
Wiewiora, A., Dubinska, E., and Iwasinska, I.: Mixed-layering in Ni-containing talc-like minerals from Szklary, Lower Silesia, Poland, in: International Clay Conference 1981, edited by: van Olphen, H. and Veniale, F., Developments in Sedimentology, Elsevier, Amsterdam, 35, 111–125, 1981.
Wilkins, R. W. T. and Ito, J.: Infrared spectra of some synthetic talcs, Am. Mineral., 52, 1649–1661, 1967.
Yariv, S. and Heller-Kallai, L.: The relationship between the I.R. spectra of serpentines and their structures, Clay. Clay Miner., 23, 145–152, https://doi.org/10.1346/CCMN.1975.0230210, 1975.
Yeniyol, M.: Characterization of two forms of sepiolite and related Mg-rich clay minerals Yenidogan (Sivrihisar, Turkey), Clay Miner., 49, 91–108, https://doi.org/10.1180/claymin.2014.049.1.08, 2014.
- Abstract
- Introduction
- Materials and methods
- Results and discussion
- Genetic implications
- Appendix A: FTIR spectra of lattice bands in the Mg−Ni 1:1 and 2:1 layer silicates
- Data availability
- Author contributions
- Competing interests
- Disclaimer
- Acknowledgements
- Financial support
- Review statement
- References
- Supplement