the Creative Commons Attribution 4.0 License.
the Creative Commons Attribution 4.0 License.
 | 20 Aug 2021
Textural and genetic relationships between glauconite and celadonite at the nanoscale: two different structural-compositional fields
Fernando Nieto
Isabel Abad
Blanca Bauluz
Matías Reolid
Glauconite and celadonite coexist at the nanometre scale in Early Jurassic submarine volcanic rocks of the Betic Cordillera (southern Spain) as a result of microbial activity. Samples from the limit between the two micas, recognizable in scanning electron microscopy, have been extracted using the focussed ion beam technique and studied by high-resolution analytical electron microscopy. Both micas are present as randomly oriented differentiated small crystals in the boundary area. They define clearly distinct compositional fields with gaps affecting to Fe, Mg and K. At the lattice scale, celadonite shows a high degree of order, with homogeneous orientation of the visible lattice parameters being a difference from glauconite, formed by packets no more than 10-layers thick. Smectite layers were also detected alongside glauconite packets, in accordance with X-ray diffractograms which indicate that glauconite is a mica–smectite interstratification being more than 90 % mica layers. The compositional gap indicates that celadonite is not the endmember of the glauconitic series and the two micas represent two different structural tendencies of mica, with glauconite having more distorted octahedral sheets, indicated by systematically higher b parameters than celadonite.
- Article
(14826 KB) - Full-text XML
- BibTeX
- EndNote


Glauconites are green micas particularly significant in sedimentary environments. Their restricted genetic conditions give them the status of key minerals for palaeoenvironmental interpretations; they usually form in shallow-marine settings (water depths < 500 m) in semi-confined microenvironments with partially reducing conditions in the sediment pore water, and their complete maturation needs long residence time with low sedimentation rate (Odin and Matter, 1981; Odin et al., 1988; Odin and Fullagar, 1988; Amorosi, 1995). According to the rules of international committees, like IMA (International Mineralogical Association; Rieder et al., 1998) and AIPEA (Association Internationale Pour I'Étude des Argiles; Bailey, 1980), they are interlayer-deficient micas with low Al tetrahedral substitution, which allows roughly half of their octahedral sites to be occupied by divalent cations (Mg2+ and Fe2+) in spite of their dioctahedral character; this Tschermak-type substitution, together with Fe3+ as the dominant trivalent cation instead of Al3+, differentiates them from illites. The dominant interlayer cation is K+.
The equivalent non-interlayer-deficient mica, having all the crystal-chemical characteristics described in the previous paragraph, would be celadonite, according to the IMA classification. As the chemical composition of a given glauconite is dependent on its maturation degree (Odin and Matter, 1981; Baldermann et al., 2013), approaching that of celadonite with residence time, this latter mineral has been traditionally contemplated as a possible endmember for glauconites (e.g. Parron and Amouric, 1990). However, celadonite typically has a different origin, linked to the ocean floor hydrothermal alteration of intermediate and basic volcanic rocks (Odin et al., 1988).
Another ubiquitous characteristic of glauconites is the presence of interstratified smectite layers. According to data from Baldermann et al. (2013) and López-Quirós et al. (2020), during maturation, the K content of glauconite evolves with the proportion of mica layers in the mica–smectite mixed layer following a logarithmic function, being asymptotic for 100 % mica layers at a value of K = 0.8 a.p.f.u. (atoms per formula unit); therefore, the composition of celadonite would never be reached, even in the hypothetical case of a glauconite completely free of smectite layers, which, anyhow, has never been described in nature (López-Quirós et al., 2020). Therefore, in spite of their chemical and structural similarities, the actual crystal-chemical relationships between glauconite and celadonite remains unknown.
Reolid and Abad (2014) described glauconites and celadonites in close physical association, which were not linked to the usual sedimentary origin of glauconites but related to Early Jurassic submarine volcanism. The described case may be a clue to understanding the genetic and crystal-chemical relationships between glauconite and celadonite as (1) the two minerals coexist in contact, being differentiable at the scanning electron microscopy (SEM) scale, but their compositions are neatly different and separated by a compositional gap; (2) glauconite has a K content equivalent to the maximum one described in the compilation of data by Baldermann et al. (2013) and López-Quirós et al. (2020).
The aim of the work is the characterization of the textural-genetic relationships between glauconite and celadonite from Reolid and Abad (2014) at the nanoscale with the use of focused ion beam (FIB). This technique offers the possibility of extracting in the SEM nanometre-sized lamellas from the areas where the two minerals occur and to study them with high-resolution transmission electron microscopy (TEM) techniques, which allows for the nanoscale characterization of the textural-genetic relationships between the two minerals. As a complementary tool, Raman spectroscopy was also used to try to characterize structural features related to the OH stretching of both micas that could justify the existence of a compositional gap.
The studied green minerals are located in the Subbetic, Betic Cordillera, southern Spain (Fig. 1a). This mountain range is the westernmost European chain related to the Alpine Orogeny and is divided in external and internal zones. The Subbetic corresponds to the external zone of the Betic Cordillera and is constituted mainly of marine sedimentary rocks deposited in the Southern Iberian Palaeomargin from the Triassic to the Miocene. However, from the Early to Late Jurassic the palaeomargin was affected by intense submarine volcanic activity in wide sectors of the pelagic basin. The deposits related to the submarine volcanism are basaltic pillow-lava flows, interbedded with pyroclastic rocks and pelagic sediments. The analysed phyllosilicates of this study are associated with pillow-lava deposits. These volcanic rocks present a WSW–ENE orientation with an almost continuous outcrop around 85 km long and a maximum of 5 km wide. The maximum thickness of these volcanic rocks, described in the literature, is over 300 m (Vera et al., 1997). The Lower Jurassic submarine volcanic rocks of the Median Subbetic are considered as transitional alkaline, originated in an extensional process of crustal thinning (Portugal et al., 1995; Vera et al., 1997). The main minerals in the pillow lava are olivine, Ti-augite, plagioclase (variable from bytownite to oligoclase) and minor biotite, Ti-hornblende, apatite, and Fe–Ti oxides (Puga et al., 1989; Morata et al., 1996).
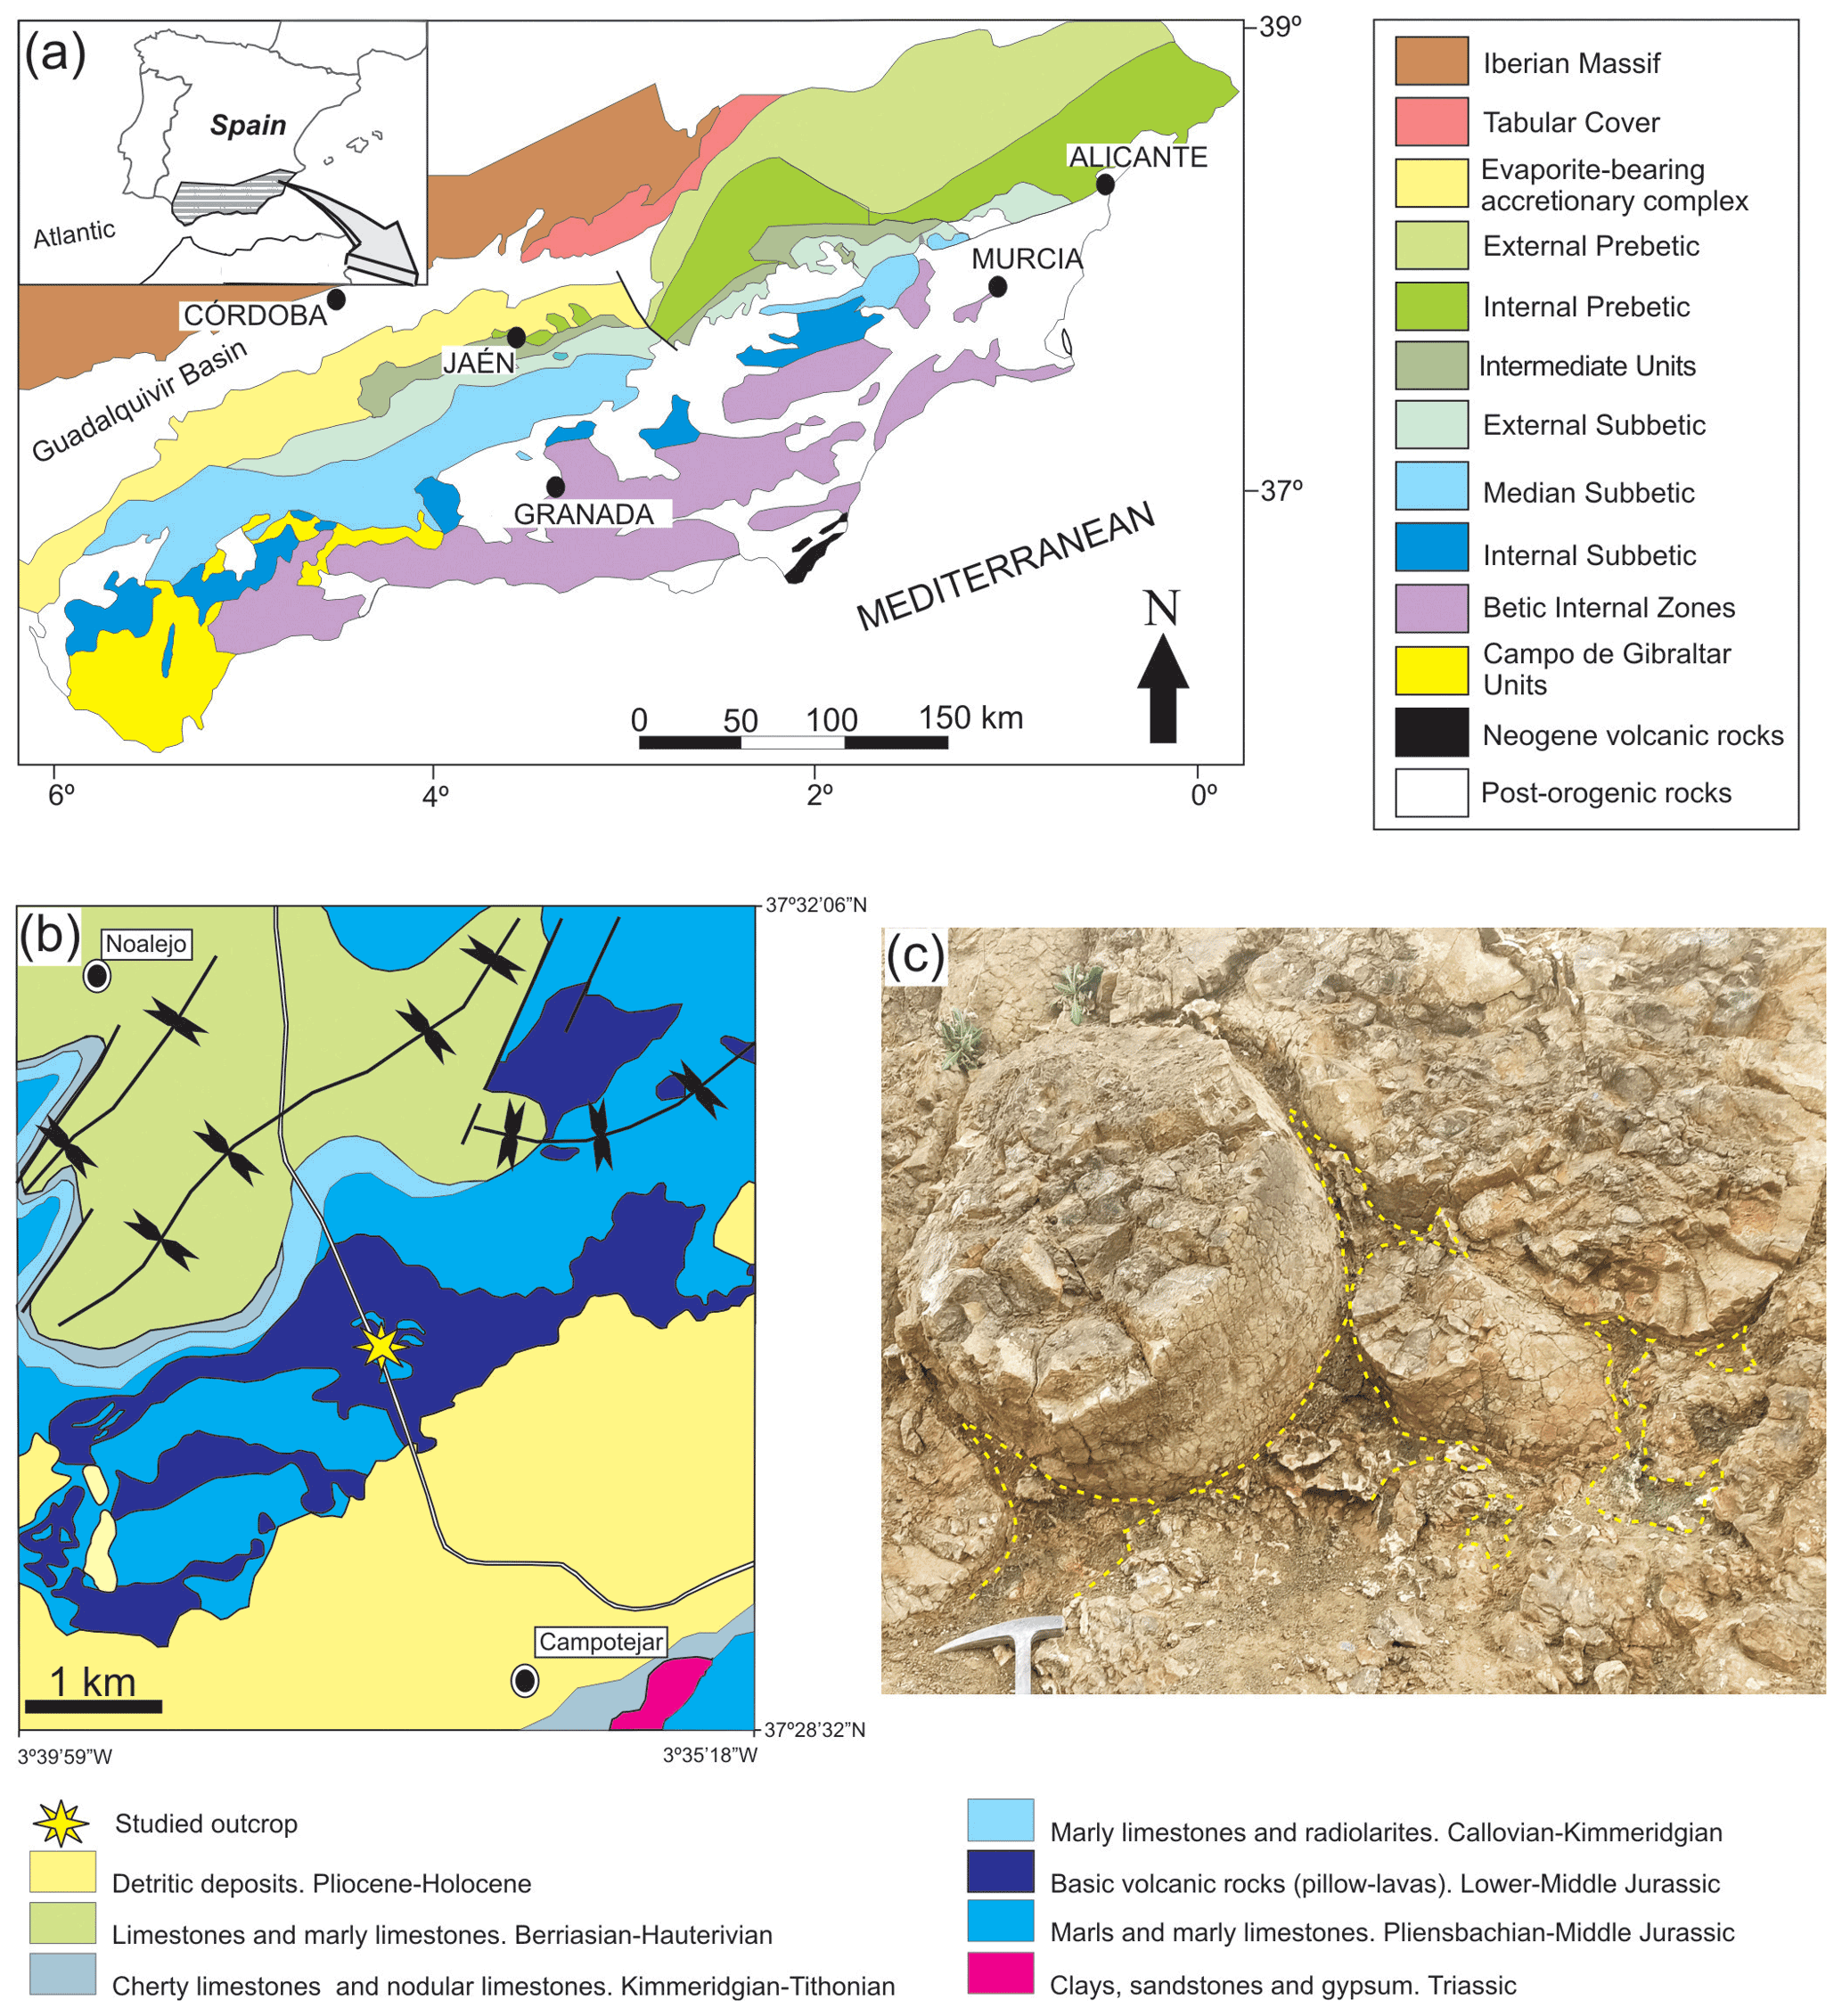
Figure 1Location of the outcrop where samples were collected: (a) regional location, (b) detailed geological setting of the Campotéjar pillow-lava outcrop and (c) detail of the outcrop of pillow lavas with the studied voids among them (yellow lines).
These rocks are well exposed close to the A-44 motorway at kilometre 79, between the cities of Jaén and Granada, in the so-called Campotéjar outcrop (Granada province, coordinates N, W) (Fig. 1b). Pillow-lava bodies are well exposed in the highway trench and in an old quarry. Reolid and Abad (2014) analysed the mineralogy of the voids among the pillows, commonly filled with a variety of material, including broken-up fragments of glassy lava, sediment materials (limestones, marls) and secondary vein minerals with calcite, quartz, glauconite, celadonite and saponite. These minerals are forming characteristic green laminated crusts (see Fig. 3 in Reolid and Abad, 2014) that are the subject of this work.
The studied samples were retrieved from the mineralizations that infill the voids among pillow-lava bodies. These voids are generally irregular spaces with curved surfaces due to the surface of the pillow-lava bodies (Fig. 1c). The veins with selected mineralizations developed in these spaces are generally less than 15 cm long. The hand-scale observations were made on 13 polished slabs, and they are detailed in Reolid and Abad (2014). A total of 26 thin sections were used for petrographic observations. The X-ray diffraction (XRD) data of the < 2 µm fraction samples corresponding to the green crusts were obtained from oriented aggregates. The < 2 µm fraction were separated by centrifugation, and oriented aggregates were prepared by settling a dispersion on a glass holder. The EG-treated (ethylene-glycol) sample diagrams were obtained on the same specimen as air-dried (AD) ones to allow an exact superposition of the two diffractograms. After AD analysis, the specimen was treated in EG atmosphere for 24 h at 60 ∘C. The diffractograms were obtained in a PANalytical X'Pert Pro diffractometer (CuKα radiation, 45 kV, 40 mA) equipped with an X'Celerator solid-state linear detector, using a step increment of 0.008∘ 2θ and a total counting time of 10 s per step. A scan between 3 and 50∘ 2θ was done on the dry samples. Decomposition routines included in the HighScore software were applied to identify the superposition of peaks from the two micas and also smectite mixed layering observable at the d001 peak at 10 Å. Peaks were fitted through an asymmetric Voigt function (mixed Gaussian and Lorentzian) using constraints to realistic values. Various combinations of peaks were tested until the best fit within the constrained values was obtained. Intensity, width at half-height and peak position were approximated by the least-squares method until they optimally retraced the peak course of the original profile.
Textural and chemical observations were made on carbon-coated polished thin sections in a scanning electron microscope (SEM) using back-scattered electrons (BSE) in atomic number contrast mode. BSE images were acquired at 15 kV with a working distance of 8 mm using an angle-selective backscatter (AsB) detector in a Merlin Carl Zeiss electron microscope at the Centro de Instrumentación Científico-Técnica (CICT, Universidad de Jaén). Microprobe analyses of green micas on the polished thin sections were performed using wavelength-dispersive spectroscopy (WDX) on a Cameca SX100 at the Centro de Instrumentación Científica (CIC, Universidad de Granada). The instrument was set at an accelerating voltage of 15 kV with a beam current of 15 nA and an electron beam diameter of < 5 µm. Data were reduced using the procedure of Pouchou and Pichoir (1985) and the standards used were albite, sanidine, periclase, diopside, quartz, vanadinite, rutile, fluorite and synthetic oxides (Al2O3, Fe2O3, NiO and MnTiO3). The structural formulae of micas were calculated on the basis of two octahedral plus four tetrahedral cations and 22 positive charges. Fe2+ and Fe3+ in the formulae were calculated by stoichiometry.
For the textural and chemical characterization at the nanometre scale, selected samples according to XRD analysis and SEM observations were prepared for transmission electron microscopy (TEM) study. A dual beam Helios 600 focused ion beam scanning electron microscope (FIB-SEM) was used (LMA, Universidad de Zaragoza). The objective of using this technique is to identify the most interesting areas for observation while keeping the texture of the sample. Four lamellas were extracted from one of the thin sections previously analysed by SEM. One lamella corresponds to the glauconitic zone and another one to the celadonitic zone, and two more lamellas were extracted including the contact between the glauconitic and celadonitic areas. The selected areas were marked and trenched using a focused beam of Ga+ ions (Overwijk, 1993). The initial intensity for trenching was set to 1.6 nA, and in the last stage of the process to thin the lamella the intensity was set to 0.4 nA. The procedure leaves a narrow slice standing and pending by one of the uncut edges. The slice was then welded and was fixed to a half-copper washer for TEM observation. The final dimensions of the lamellas were approximately 9 µm × 5 µm × 50 nm.
The TEM data were obtained using the high angle annular dark field (HAADF) FEI Titan G2 microscope, operated at 300 kV and with a point-to-point resolution of 0.08 nm in the TEM mode and 0.2 nm in the scanning transmission electron microscopy (STEM) mode (CIC, Universidad de Granada). Chemical analyses were obtained, using STEM mode, with a SuperX detector. Compositional maps were obtained from the whole interesting area, and the individual spectra of each pixel of homogeneous areas of the maps summed up to produce the average spectrum of all the area. In addition, scan windows including the entire analysed particle were used for the chemical analyses on the basis of high-angle annular dark field (HAADF) images.
Raman spectra were recorded on a Renishaw (inVia Reflex) spectrometer (CICT, Universidad de Jaén) equipped with a Peltier-cooled (−70 ∘C) charge-coupled device (CCD) detector and a Leica DM2700 microscope (objectives 5×, 20×, 50× and 100×) to focus the laser on the sample, and a colour video camera allowed for the positioning of the sample and selection of a specific region of the thin section for investigation. A diode-pumped solid-state laser (532.0 nm) was used for excitation. The number of scans (5–20), counting times (5–15 s) and laser power (a maximum of 50 %) varied as a function of several factors like fluorescence, background noise or heat damage. The spectra were obtained in two regions with bands related to the octahedral cations and polyhedra. The wavenumber region from 50 to 1200 cm−1, with special emphasis on the 195 cm−1 band, is related to the internal vibrations of the octahedral polyhedra (XO6) whose intensity is highly dependent on the orientation of the mica layers (Tlili et al., 1989); hence, it can be used to identify this orientation. The hydroxyl stretching region (3500–3700 cm−1) shows bands strictly dependent on the nature of octahedral cations.
4.1 X-ray diffraction
The X-ray diffraction diagram of the < 2 µm fraction of the studied samples is dominated by the succession of nearly rational orders of the 10 Å reflection, compatible with micas, together with minor signs of smectite and calcite (Fig. 2a). Decomposition of the 10 Å peak (Fig. 2b) shows that the 10 Å reflection includes peaks corresponding to the two micas described by Reolid and Abad (2014) as major constituents of the sample: celadonite and glauconite. After the ethylene-glycol (EG) treatment, the 10 Å peak shows a change in shape and width (Fig. 2a), which indicates that at least one of the micas, presumably the glauconite, includes a minor swelling component. Decomposition of the 10 Å area of the EG-treated specimen (Fig. 2c) shows that the reflection includes two very close peaks in the area of 10 Å and a shoulder between 10 and 11 Å. One of the 10 Å peaks is equivalent, within the decomposition error, to that of celadonite (9.95 Å); hence, it is not affected by the EG treatment. The other peak (9.82 Å) and the shoulder (10.77 Å) are compatible with the characteristic diagram of an R3 mixed-layer clay presented in the Fig. 8.7 of Moore and Reynolds (1997), as also previously interpreted for an Antarctic glauconitic sample by López-Quirós et al. (2020) in their Fig. 4. Given the vicinity and the complexity of the decomposed clay low-angle peaks, the results of the decomposition need to be considered reliable only to a certain extent; they are compatible with the existence and nature of the two micas, but the exact position, intensity and width of the peaks may be subjected to significant errors. To sum up, the < 2 µm fraction of the samples is mainly composed of non-swelling celadonite together with glauconite containing less than 10 % smectitic layers, like the most mature glauconites described in the literature (Baldermann et al., 2013; López-Quirós et al., 2020).
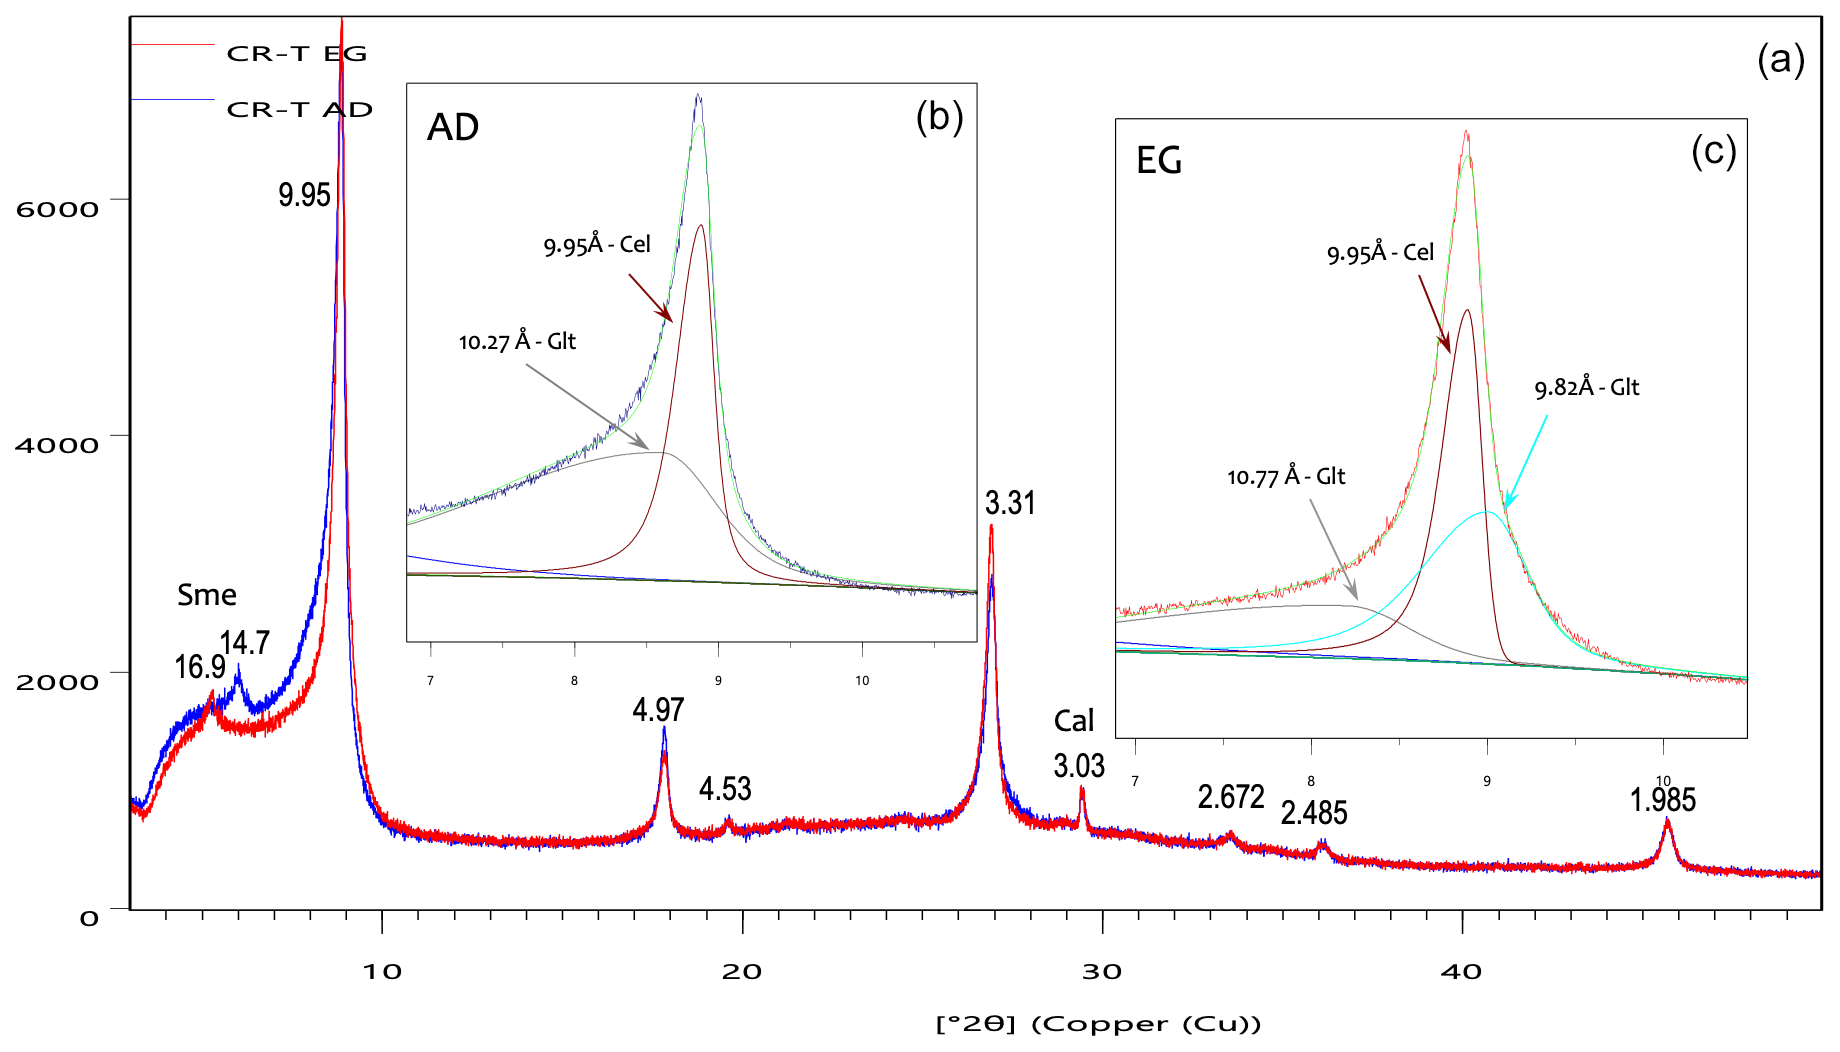
Figure 2X-ray diffraction diagrams of the < 2 µm fraction of the CR-T sample: (a) superposition of the diagrams corresponding to the air-dried (AD, blue) and ethylene-glycol-treated (EG, red) specimens, which show a clear change in the 10 Å peak with the treatment; (b) decomposition of the air-dried specimen diagram; (c) decomposition of the EG treated specimen diagram. Sme – smectite; Cal – calcite; the rest of the peaks correspond to micas.
4.2 SEM and electron microprobe analysis (EMPA) observations
A detailed textural description of the studied material using SEM can be found in Reolid and Abad (2014). Here, we have focused on the transition zone between glauconite and celadonite crystals inside the green laminated crusts which are in turn composed of filaments. At the micrometre scale, these are cylindrical filaments constituted of a coat surrounding a hollow. The wall of these filaments is constituted of two parts: the inner one without textural traits and an outer part consisting of a ring of needle-like crystals disposed as a coating around the inner part (Fig. 3). Actually, the inner part is composed of very small lath-like crystals (< 1 µm length) of glauconite randomly organized (glauconitic zone) and the outer part by larger lath-like crystals (> 5 µm length) of celadonite, oriented perpendicular to the filament (celadonitic zone). In any case, and in spite of the predominance of glauconite in the inner part, some celadonite grains have been detected in this domain. In contrast, in the external coating only celadonite was detected.
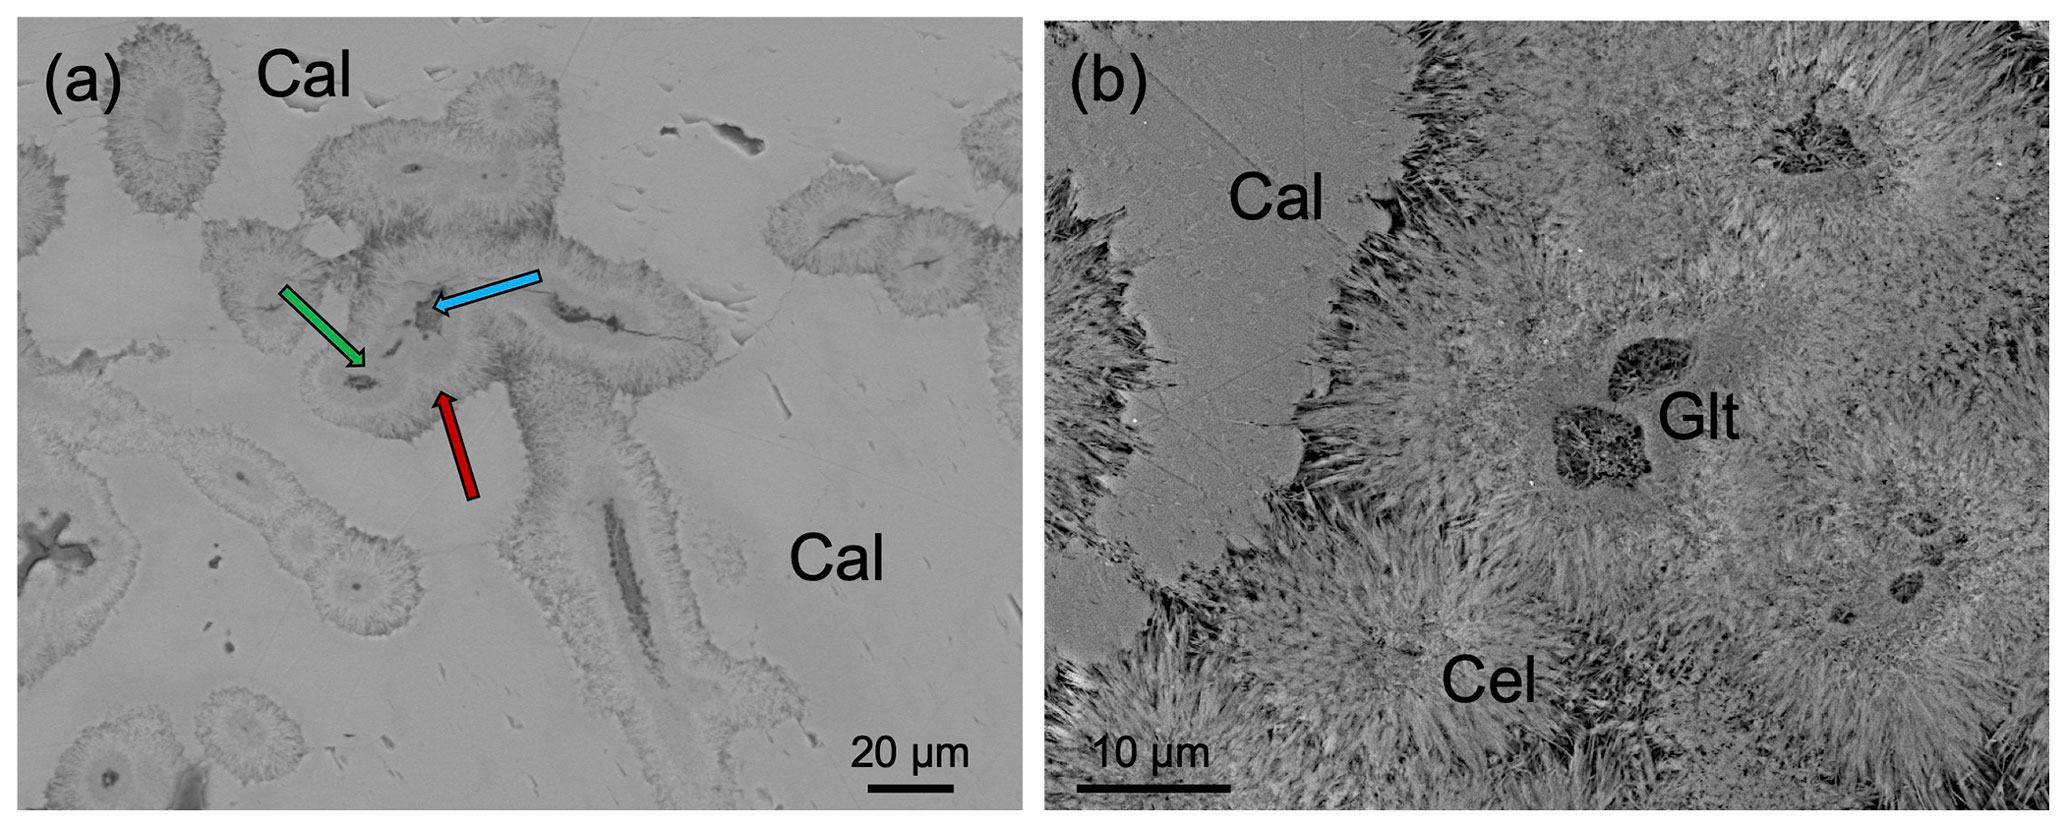
Figure 3BSE images of the green micas surrounded by calcite: (a) view of different sections of filaments in which the inner voids (blue arrow), surrounded by a dark grey material (glauconite, green arrow), and the external one composed of celadonite (red arrow) can be differentiated; (b) detail of the green micas showing the radial disposition of the celadonite lath-like crystals that make up the outer coating. Cal – calcite; Cel – celadonite; Glt – glauconite.
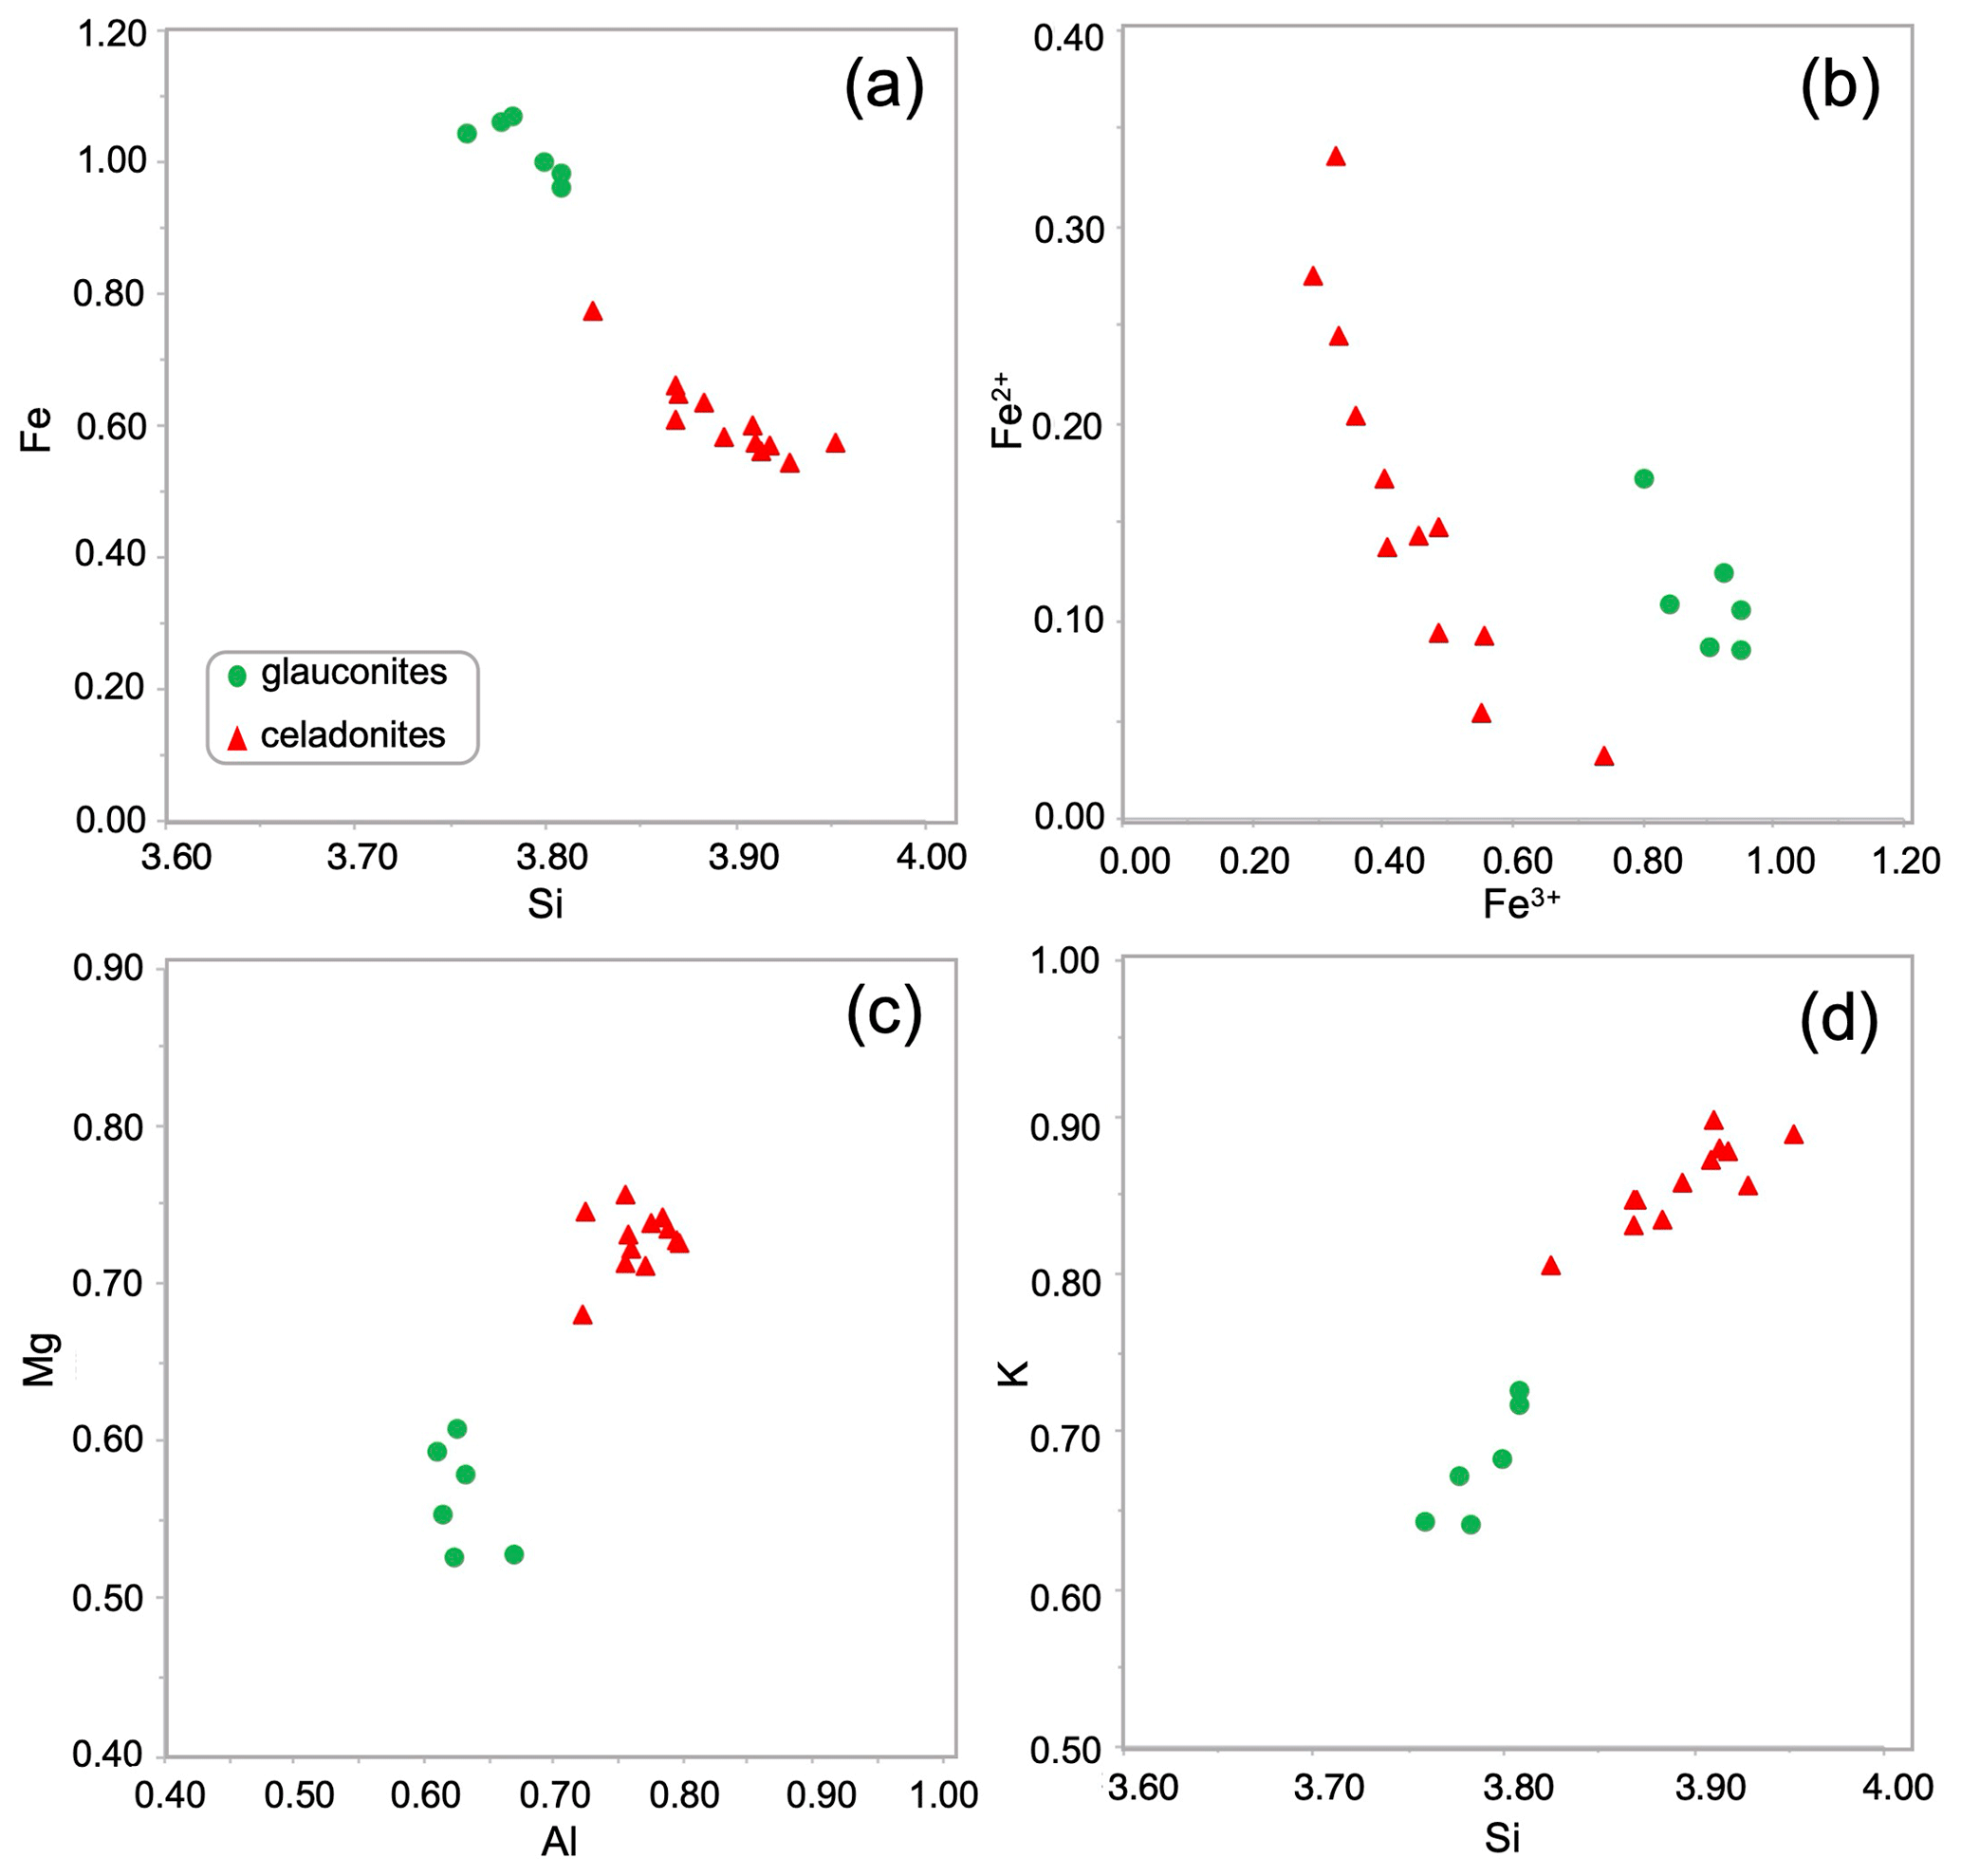
The green micas' structural formulae based on microprobe analyses (Table 1) easily allow the identification of the two dioctahedral micas: glauconite and celadonite. In general, for these green micas the Si content is always > 3.75 atoms per formula unit (a.p.f.u.) and the amount of K is ≥ 0.60 a.p.f.u. The octahedral sheet is characterized by Fe contents of 0.54–1.06 a.p.f.u., and Al and Mg contents are in a similar range (0.5–0.8 a.p.f.u.).
Table 1Structural formulae for green micas normalized to six cations (IV+VI) based on WDX data (EMPA analyses). Fe distributed as Fe2+ and Fe2+ by charge balance.
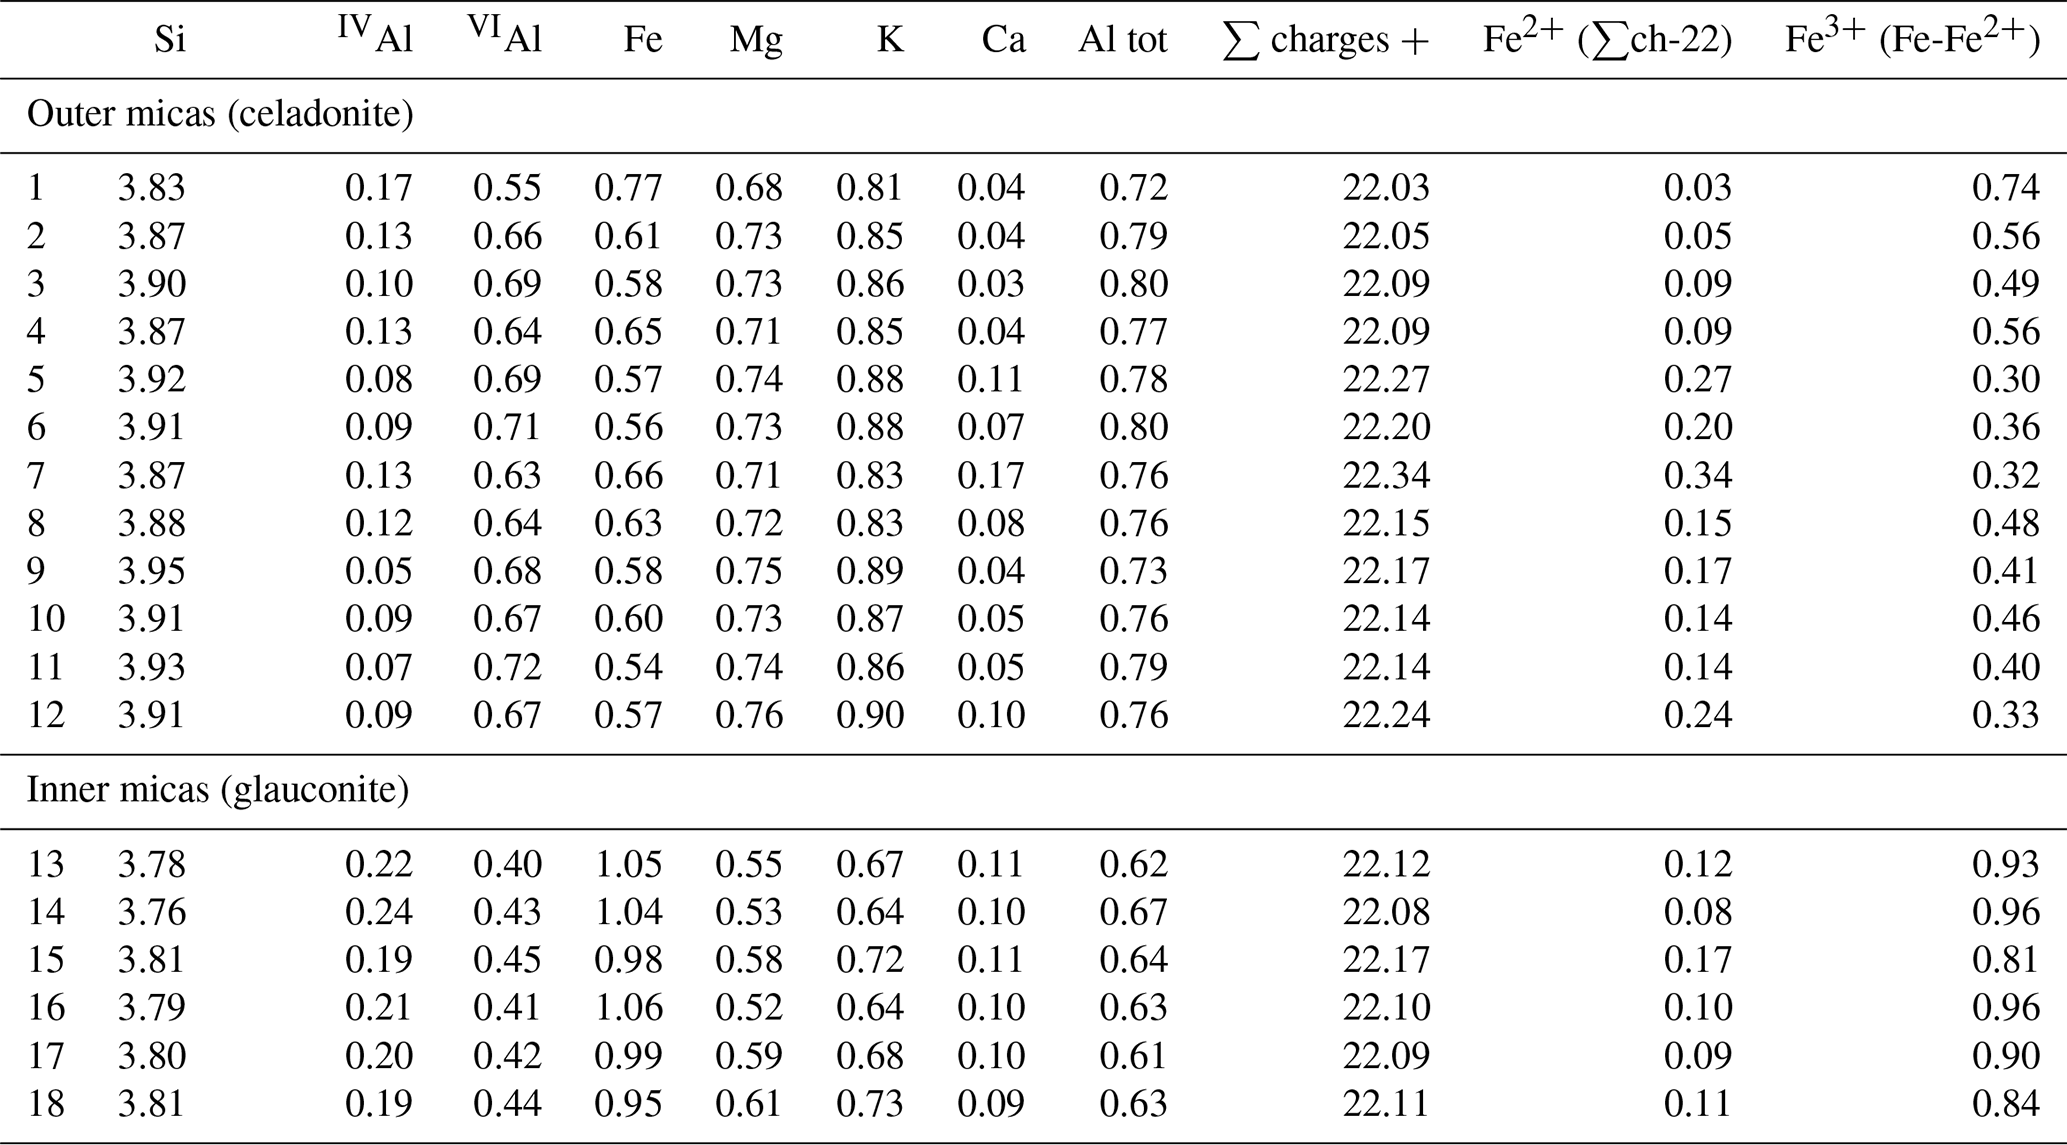
However, two different populations are identified as observed in the Fig. 4. The outer lath-like crystals corresponding to the celadonitic zone show lower Fe contents (< 0.80 a.p.f.u. with an average content of 0.61 a.p.f.u.) than the inner crystals corresponding to the glauconitic zone (≥ 0.95 a.p.f.u.) with an average content of 1.01 a.p.f.u. (Table 1, Fig. 4a). Only one tenth of glauconitic Fe is Fe2+, which is different from celadonite in which one quarter is Fe2+ (Table 1, Fig. 4b). Al and Mg contents are higher in the celadonitic zone than in the glauconitic zone with a clear Mg gap between both micas (Table 1, Fig. 4c). In addition, there are clear differences in the K content of these two mineral phases of green micas. In the outer crystals, analyses reveal K contents in the range of 0.81–0.90 a.p.f.u., which are greater than in the inner glauconitic zone, where WDX analyses show K contents of 0.64–0.73 a.p.f.u. (Table 1, Fig. 4d).
4.3 TEM observations
The characterization of the transition between the glauconitic zone and the celadonitic zone in lamellas extracted with FIB from thin sections in the TEM has allowed us to establish the main features of both minerals at the nanoscale.
In low-magnification images, both green micas show a similar aspect, organized in clusters of platy crystals randomly oriented (Fig. 5), although glauconite crystals appear to be thinner and less crystalline. In any case, these subtle differences at that scale are very evident in the lattice-fringe images (Figs. 6 and 7). At the lattice scale, celadonite shows a high degree of order, with homogeneous orientation of the two visible lattice parameters displayed in Fig. 6b. The 1M polytype can be identified in all the images, with only a few stacking defects. The same characteristics can be recognized in the reciprocal space (inset Fig. 6b). The 1M polytype is the usual one of celadonite according to all the structural determinations in the literature (Zvyagin, 1957; Zhukhlistov et al., 1977; Tsipurskii and Drits, 1986; Zhukhlistov, 2005). In addition, celadonite crystals are thicker (more than 20 layers, that is > 20 nm thick) than the glauconitic laths, which reach no more than 10 nm in thickness, ranging from 3 to 10 layers of 1 nm (Fig. 7). In some cases, smectite layers were also detected next to glauconite layers (Fig. 7b) with a spacing of 1.3 nm, which suggests the presence of areas of interstratified smectitic material in agreement with the observations from the X-ray diffractograms. As a consequence, celadonites are more perfectly crystallized, whereas in glauconite packets stacking defects, layer terminations and slightly curved layers have been observed (Fig. 7a).
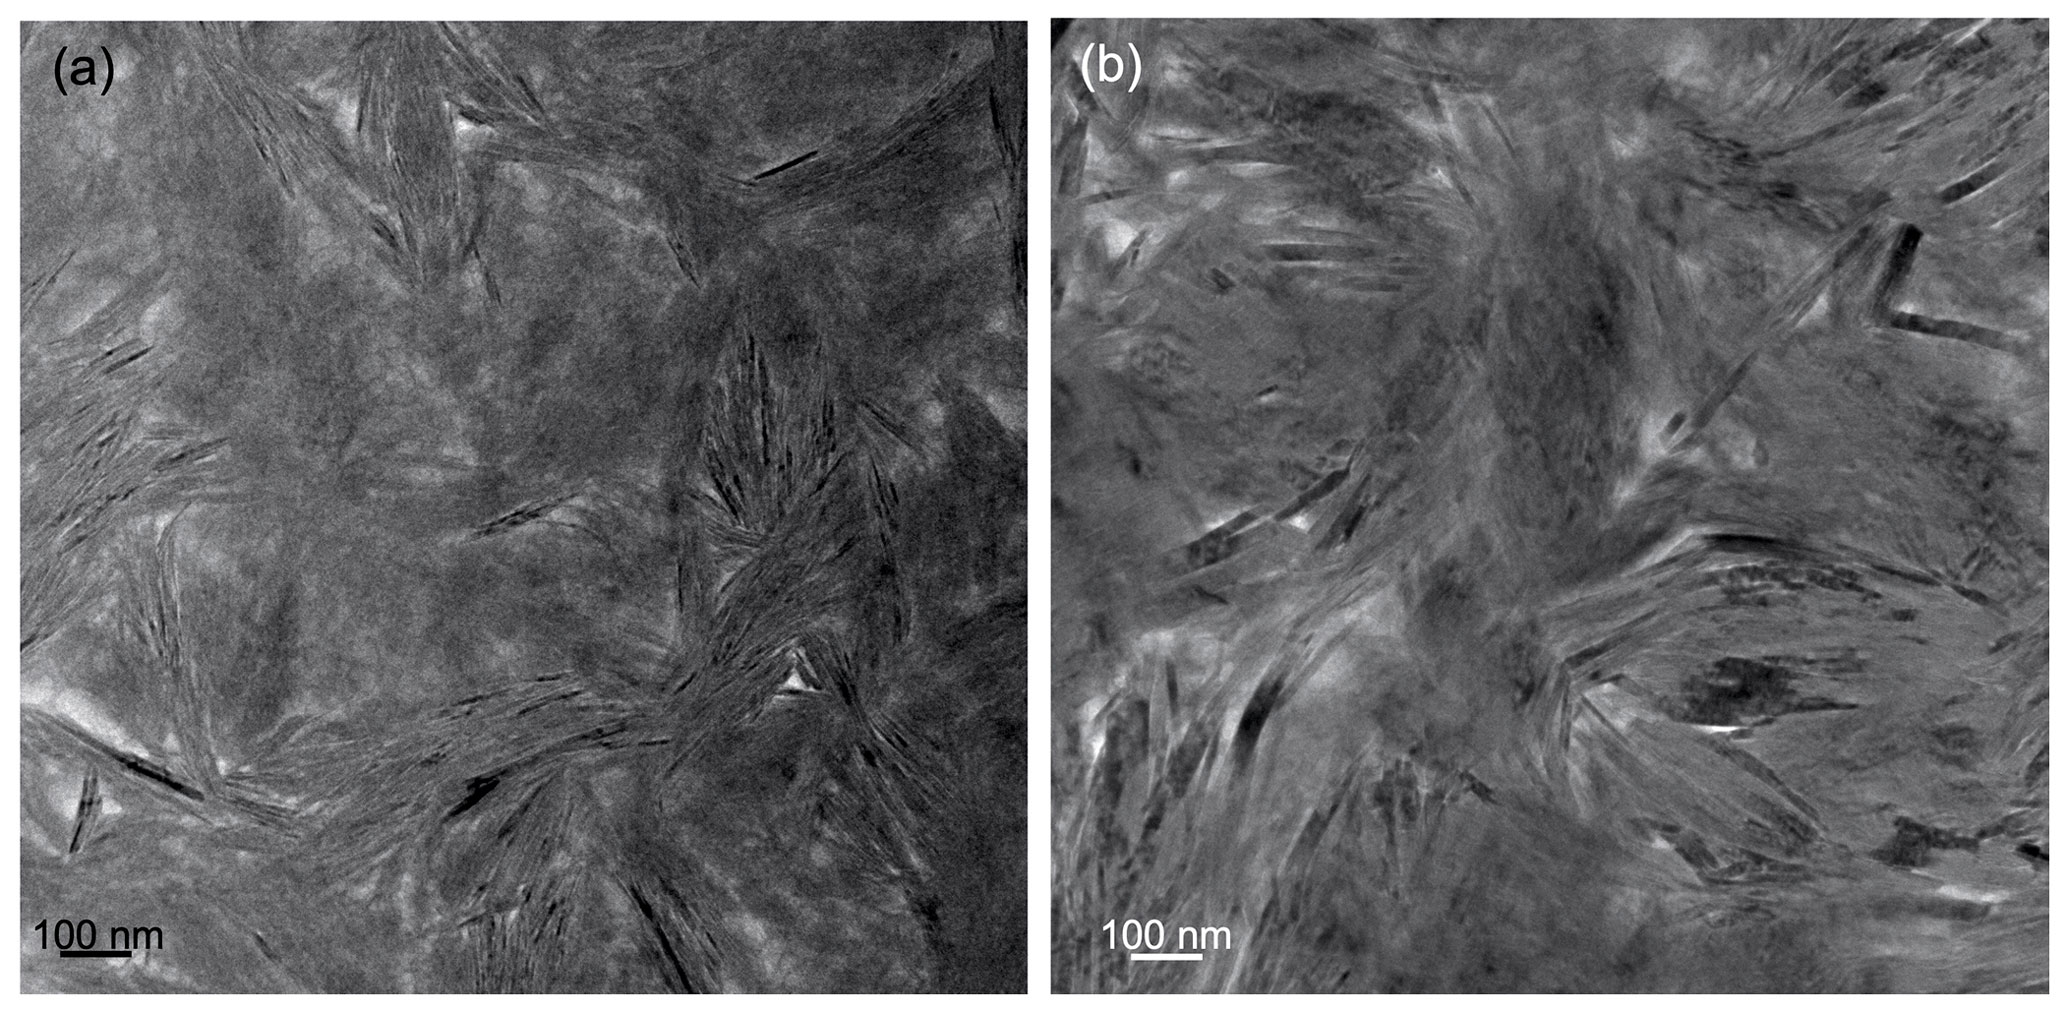
Figure 5TEM low-magnification images showing the general aspect of glauconitic zone (a) and celadonitic zone (b).
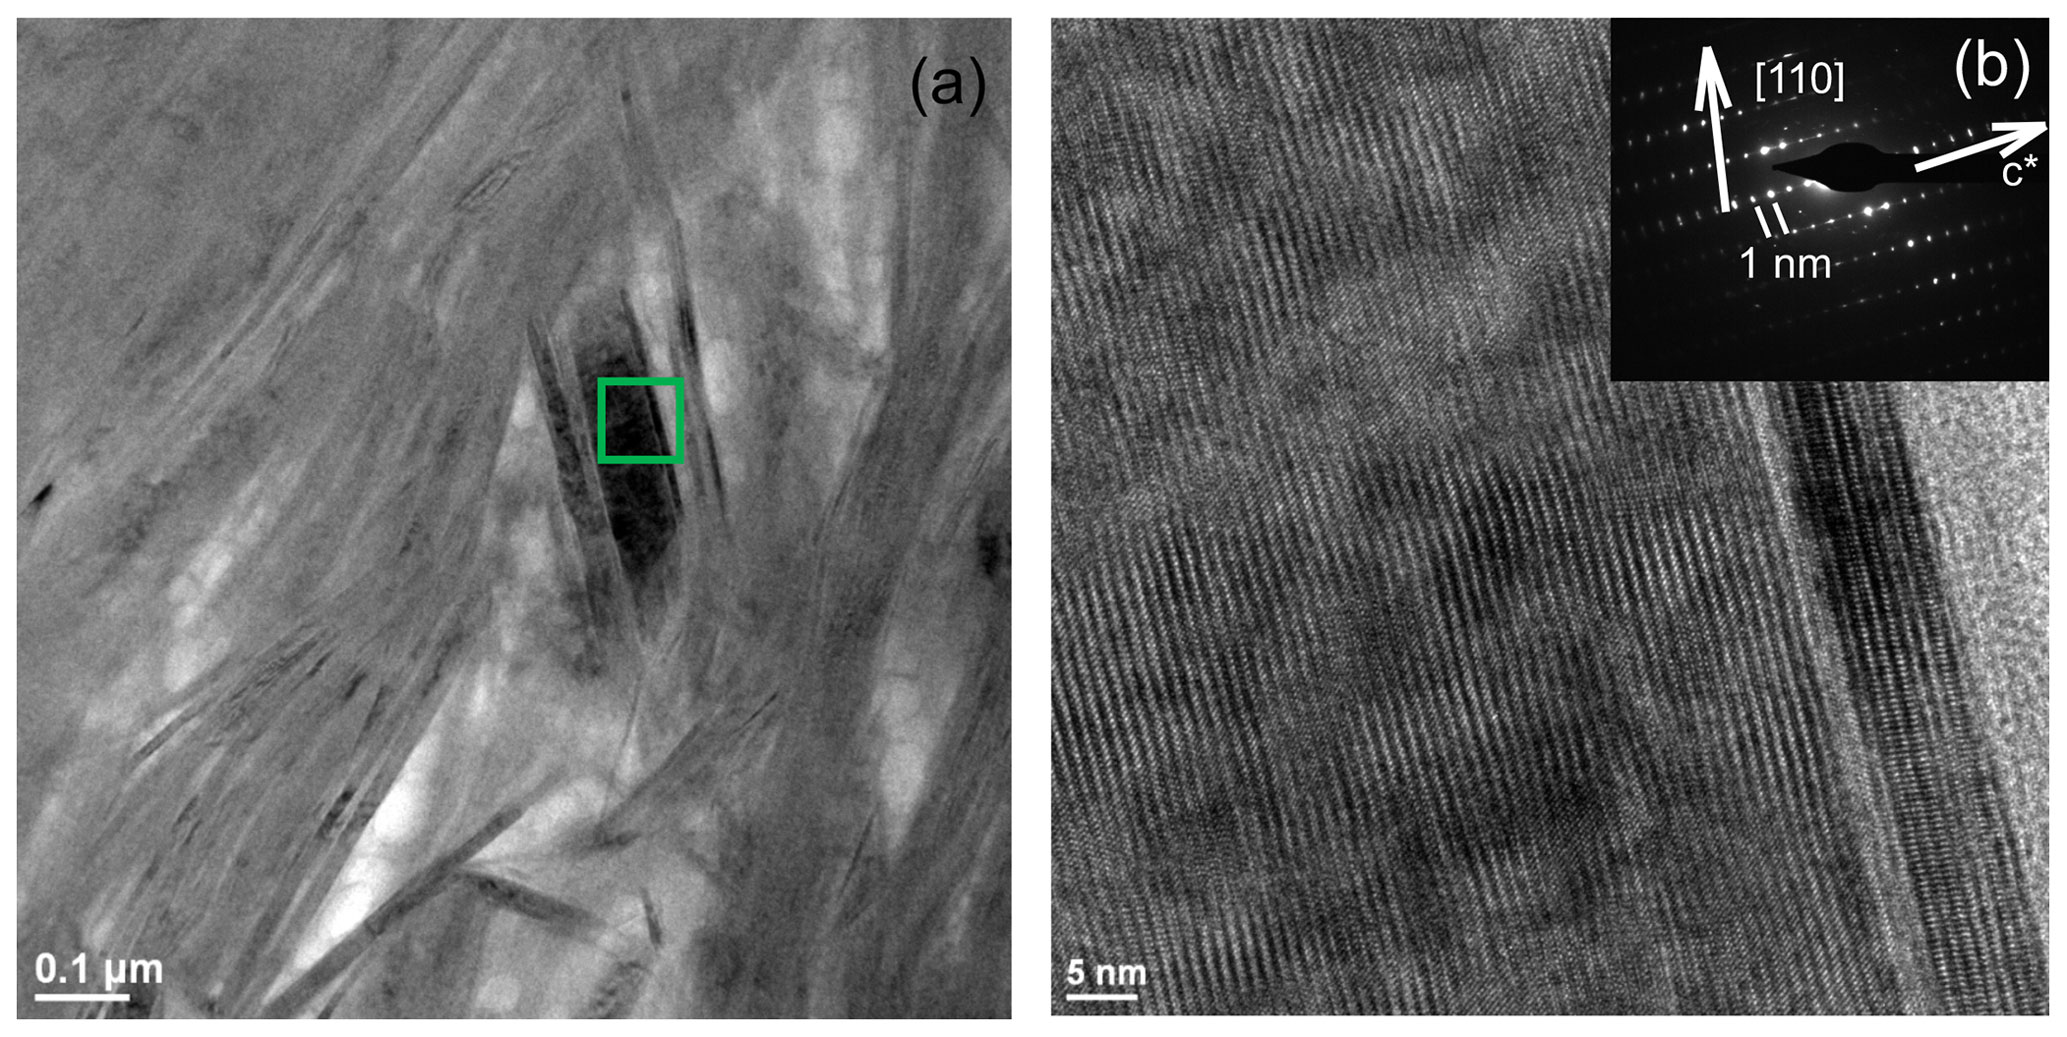
Figure 6TEM images corresponding to celadonites: (a) low-magnification image of long celadonite crystals forming aggregates; (b) detail of the green square corresponding to a celadonite crystal composed of more than 50 layers with a spacing of 1 nm as the selected area electron diffraction (SAED) pattern corroborates. Polytype 1M can be identified both in SAED and high-resolution TEM (HRTEM).
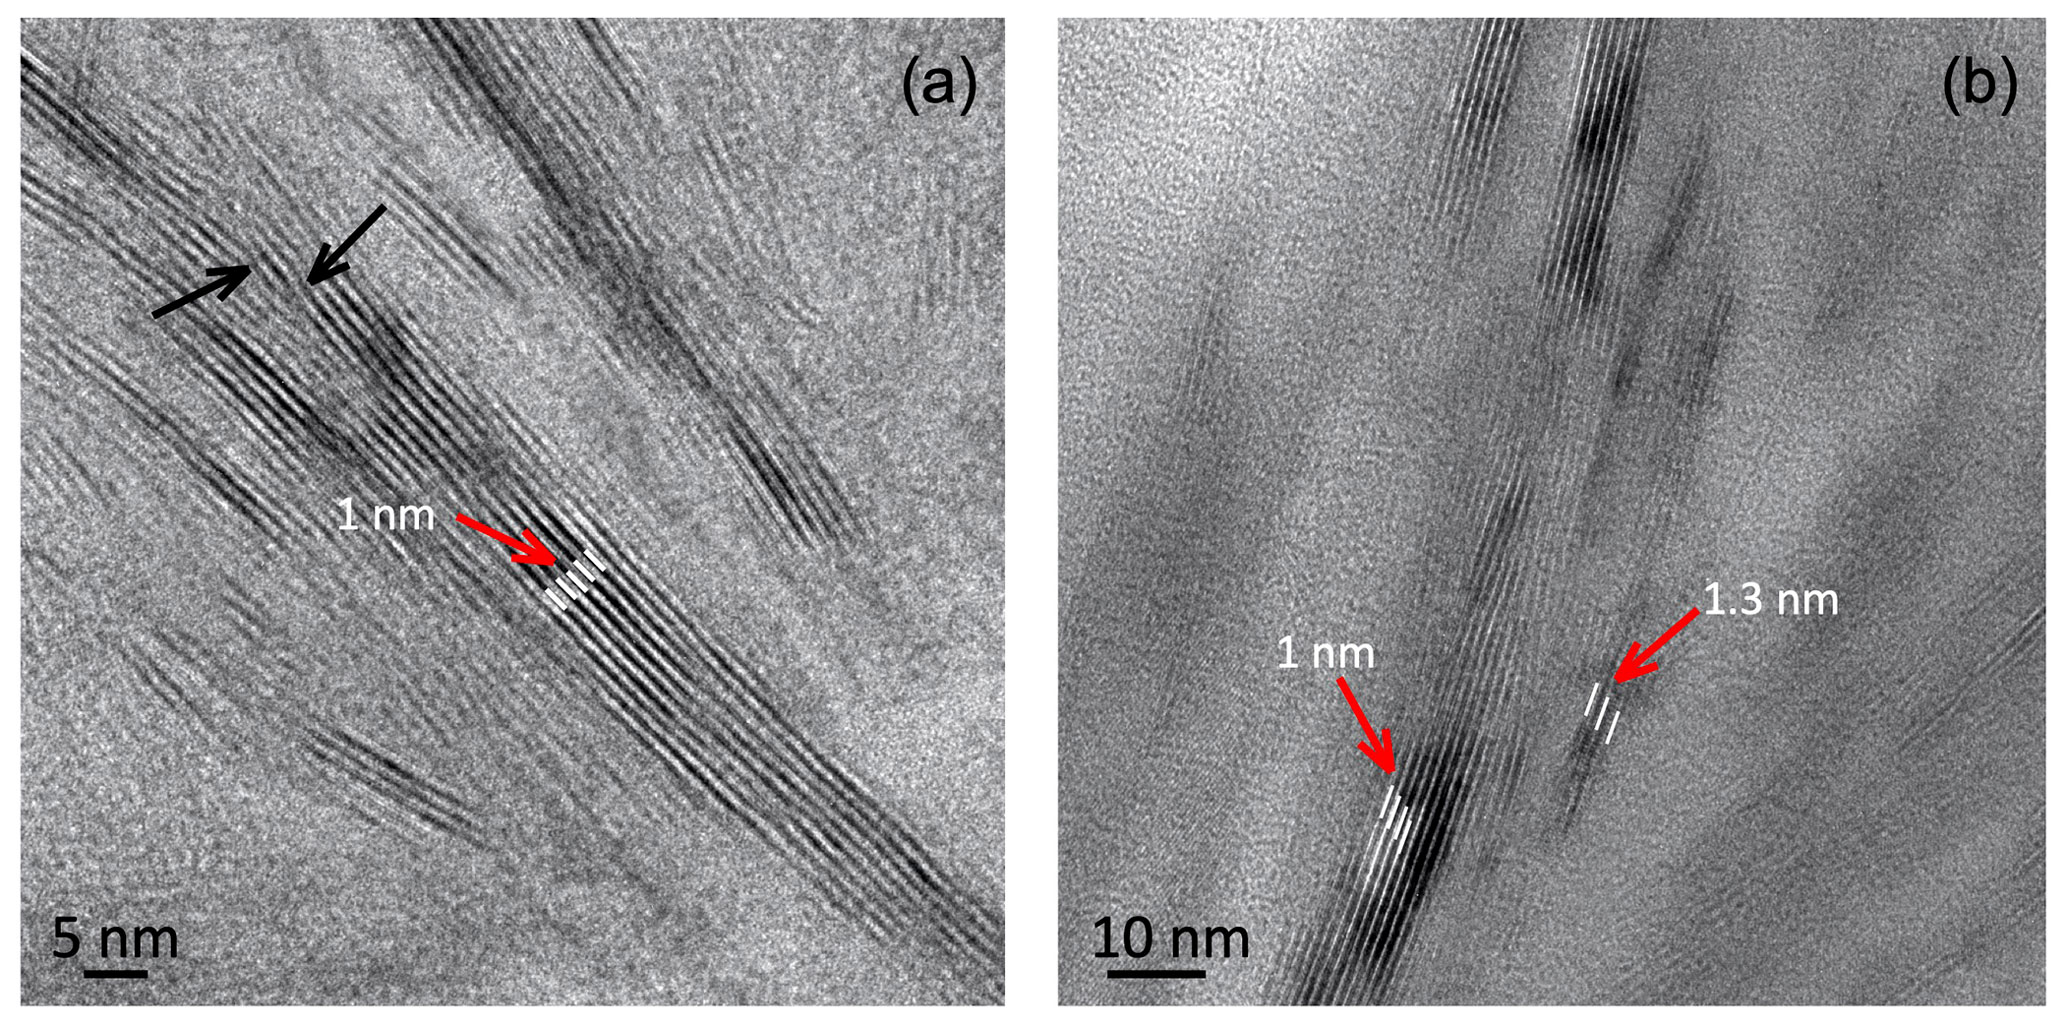
Figure 7TEM images corresponding to glauconite: (a) aspect of the glauconite crystals with no more than 10 layers (1 nm thick) and showing defects, namely, layer terminations (black arrows); (b) thin packets of glauconite (1 nm layers) with smectitic layers next to them (1.3 nm layers).
At the transition zone from glauconite to celadonite, the configuration of particles is chaotic, although the differentiation of the two green micas here was possible thanks to the differences in the chemistry, mainly the K and Fe contents, as shown by energy-dispersive X-ray (EDX) spectra (Fig. 8a). The domain which includes both micas shows clusters of crystals with different orientations and compositions without a clear organization among them (Fig. 8b, c). Nevertheless, the STEM-EDX maps show a net boundary between glauconite and celadonite (Fig. 8d), which confirms a compositional gap between them (Fig. 8a, d).
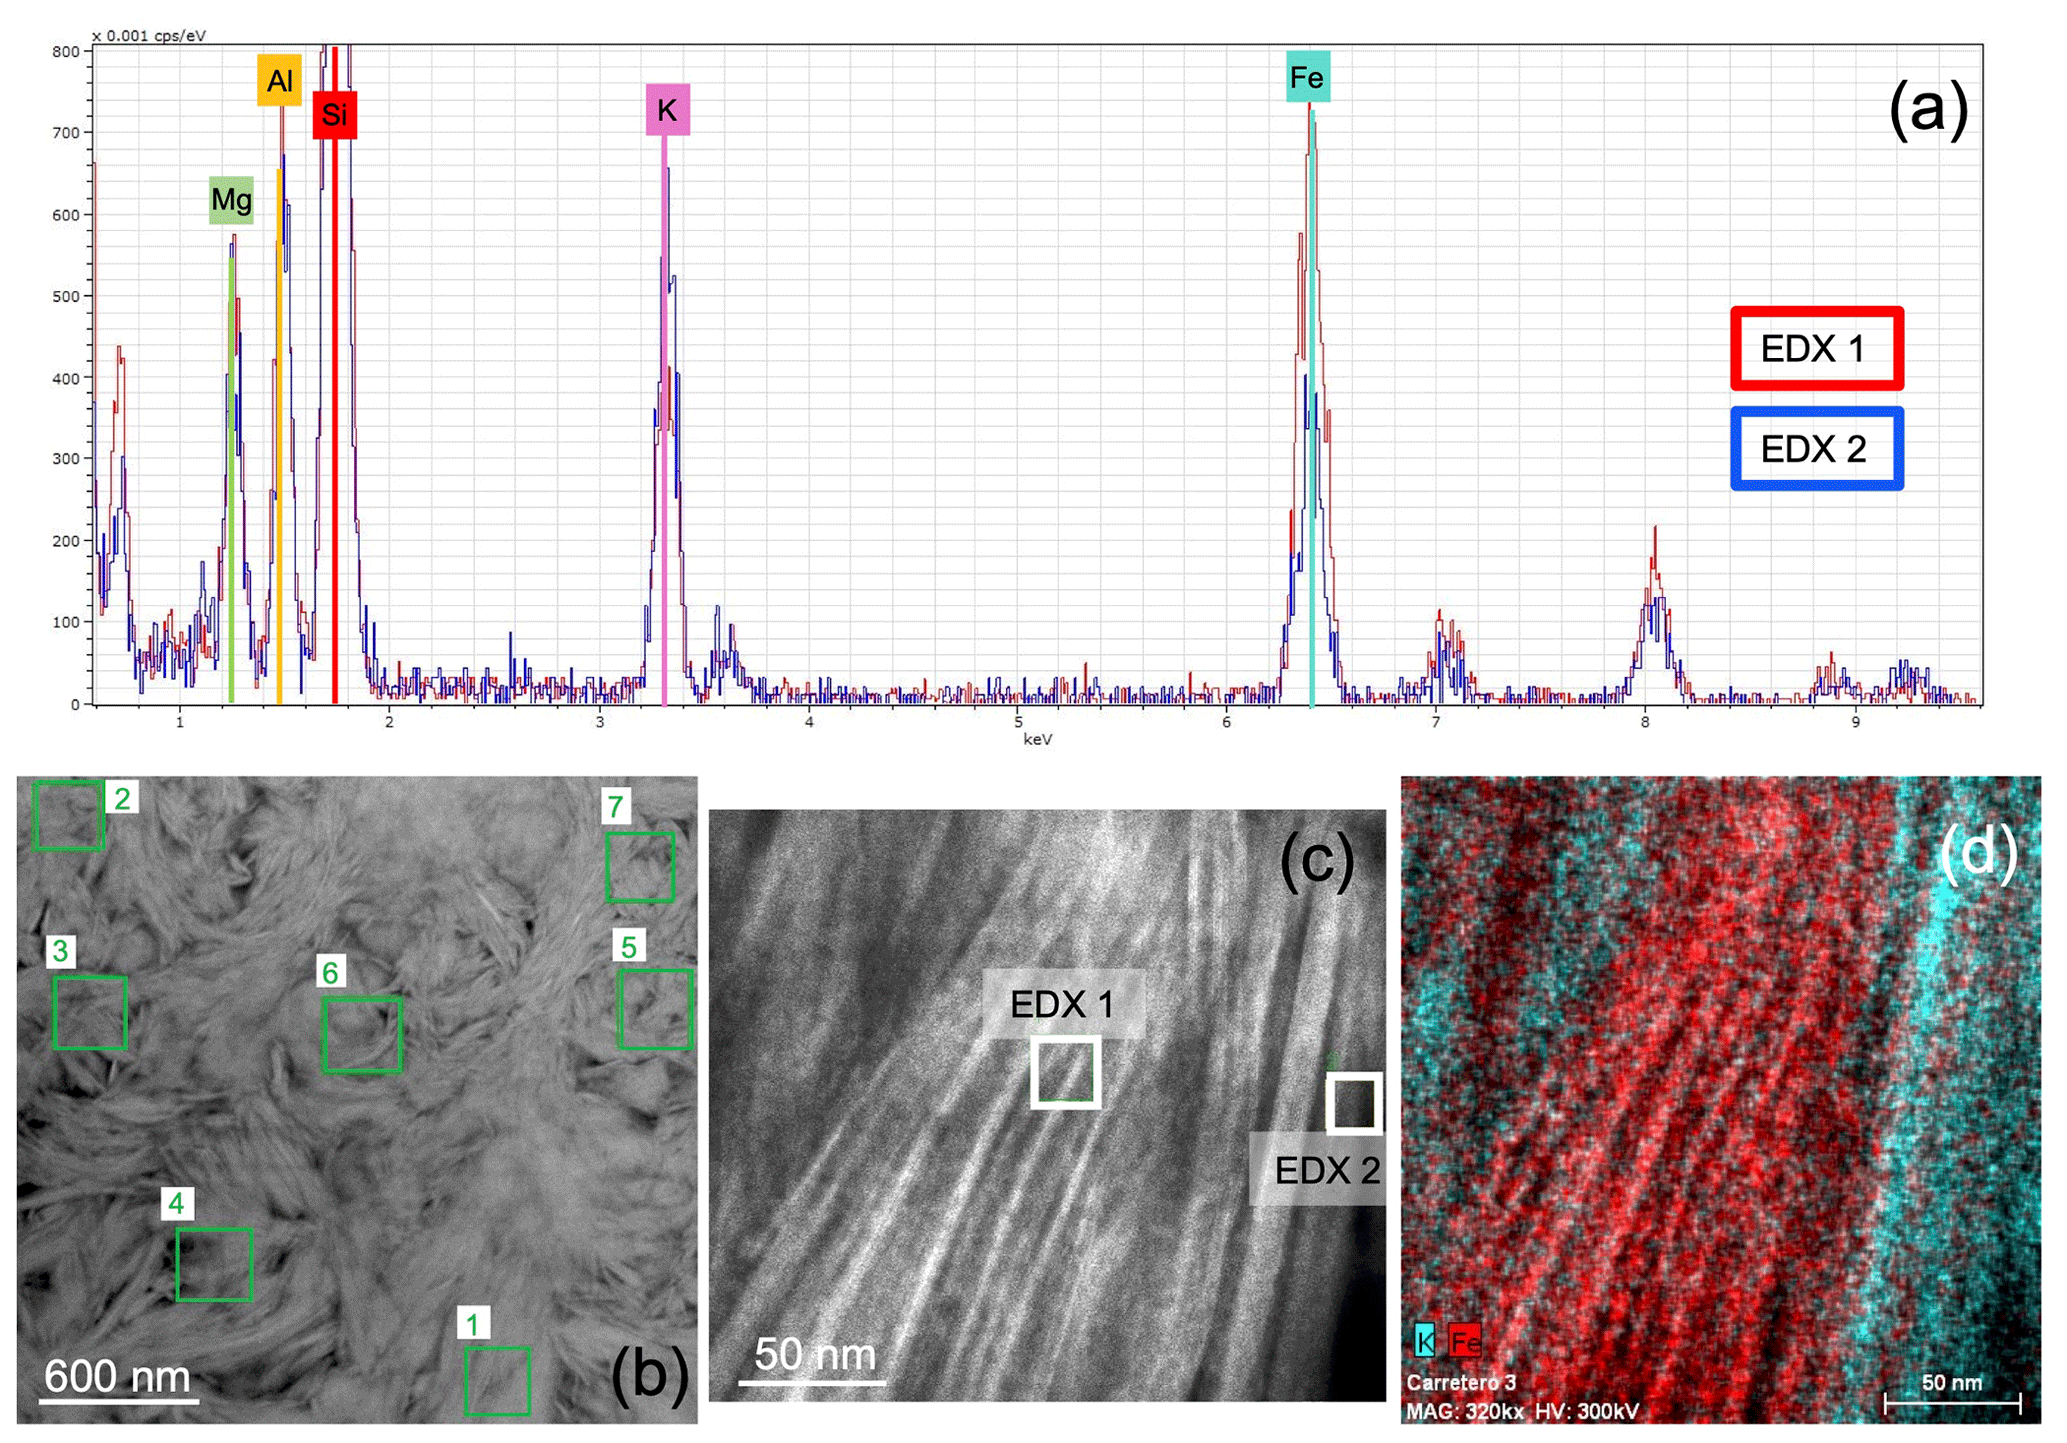
Figure 8(a) Two overlapped energy-dispersive X-ray (EDX) spectra corresponding to the two micas: the red line is glauconite and the blue line celadonite; (b) HAADF image with location of analyses corresponding to glauconites (1, 2 and 6) and celadonites (3, 4, 5 and 7); (c) image showing an area including the two types of micas; (d) STEM-EDX map of the area (the K-rich area corresponds to celadonite and the Fe-rich area to glauconite).
4.4 Raman spectroscopy data
Figure 9 displays representative spectra corresponding to the 50–1200 and 3500–3700 cm−1 regions for the glauconite and celadonite studied in this work. In general, the poor resolution of the glauconite peaks does not allow us to establish the exact position of bands, and the small deviations may not be meaningful. Despite this, there is a parallelism between the two spectra with only some subtle differences. In the region between 90 and 100 cm−1 two different peaks are present in the celadonite spectrum, whereas only a broad band is in the glauconite one. Furthermore, the Raman spectrum of glauconite shows a broad band around 190 cm−1, whereas a better-defined band around 184 and 217 cm−1 is observed in the celadonite spectrum. Henceforth, the spectra show three more bands (450, 560 and 700 cm−1) with a small band at 600 cm−1 in the glauconite spectrum (Fig. 9a) which is absent in the celadonite one (Fig. 9b). This region is related to the internal vibrations of the octahedral (XO6) polyhedra (Loh, 1973; Tlili et al., 1989; Ospitali et al., 2008); therefore, several of the splittings described in the celadonite spectrum could be related to some differences between the two micas in the geometry of their respective octahedra. In relation to the OH-stretching region (3500–3700 cm−1), which depends on the nature of octahedral cations, the glauconite spectrum is only showing weak bands not always noticeable around 3560, 3575 and 3610 cm−1 (Fig. 9a). Nevertheless, the Raman spectrum of celadonite shows four bands in this region: 3533, 3560, 3580 and 3607 cm−1 (Fig. 9b). The small wavenumber differences between the two minerals when comparing both spectra are possibly related to the differences of composition between the two micas.
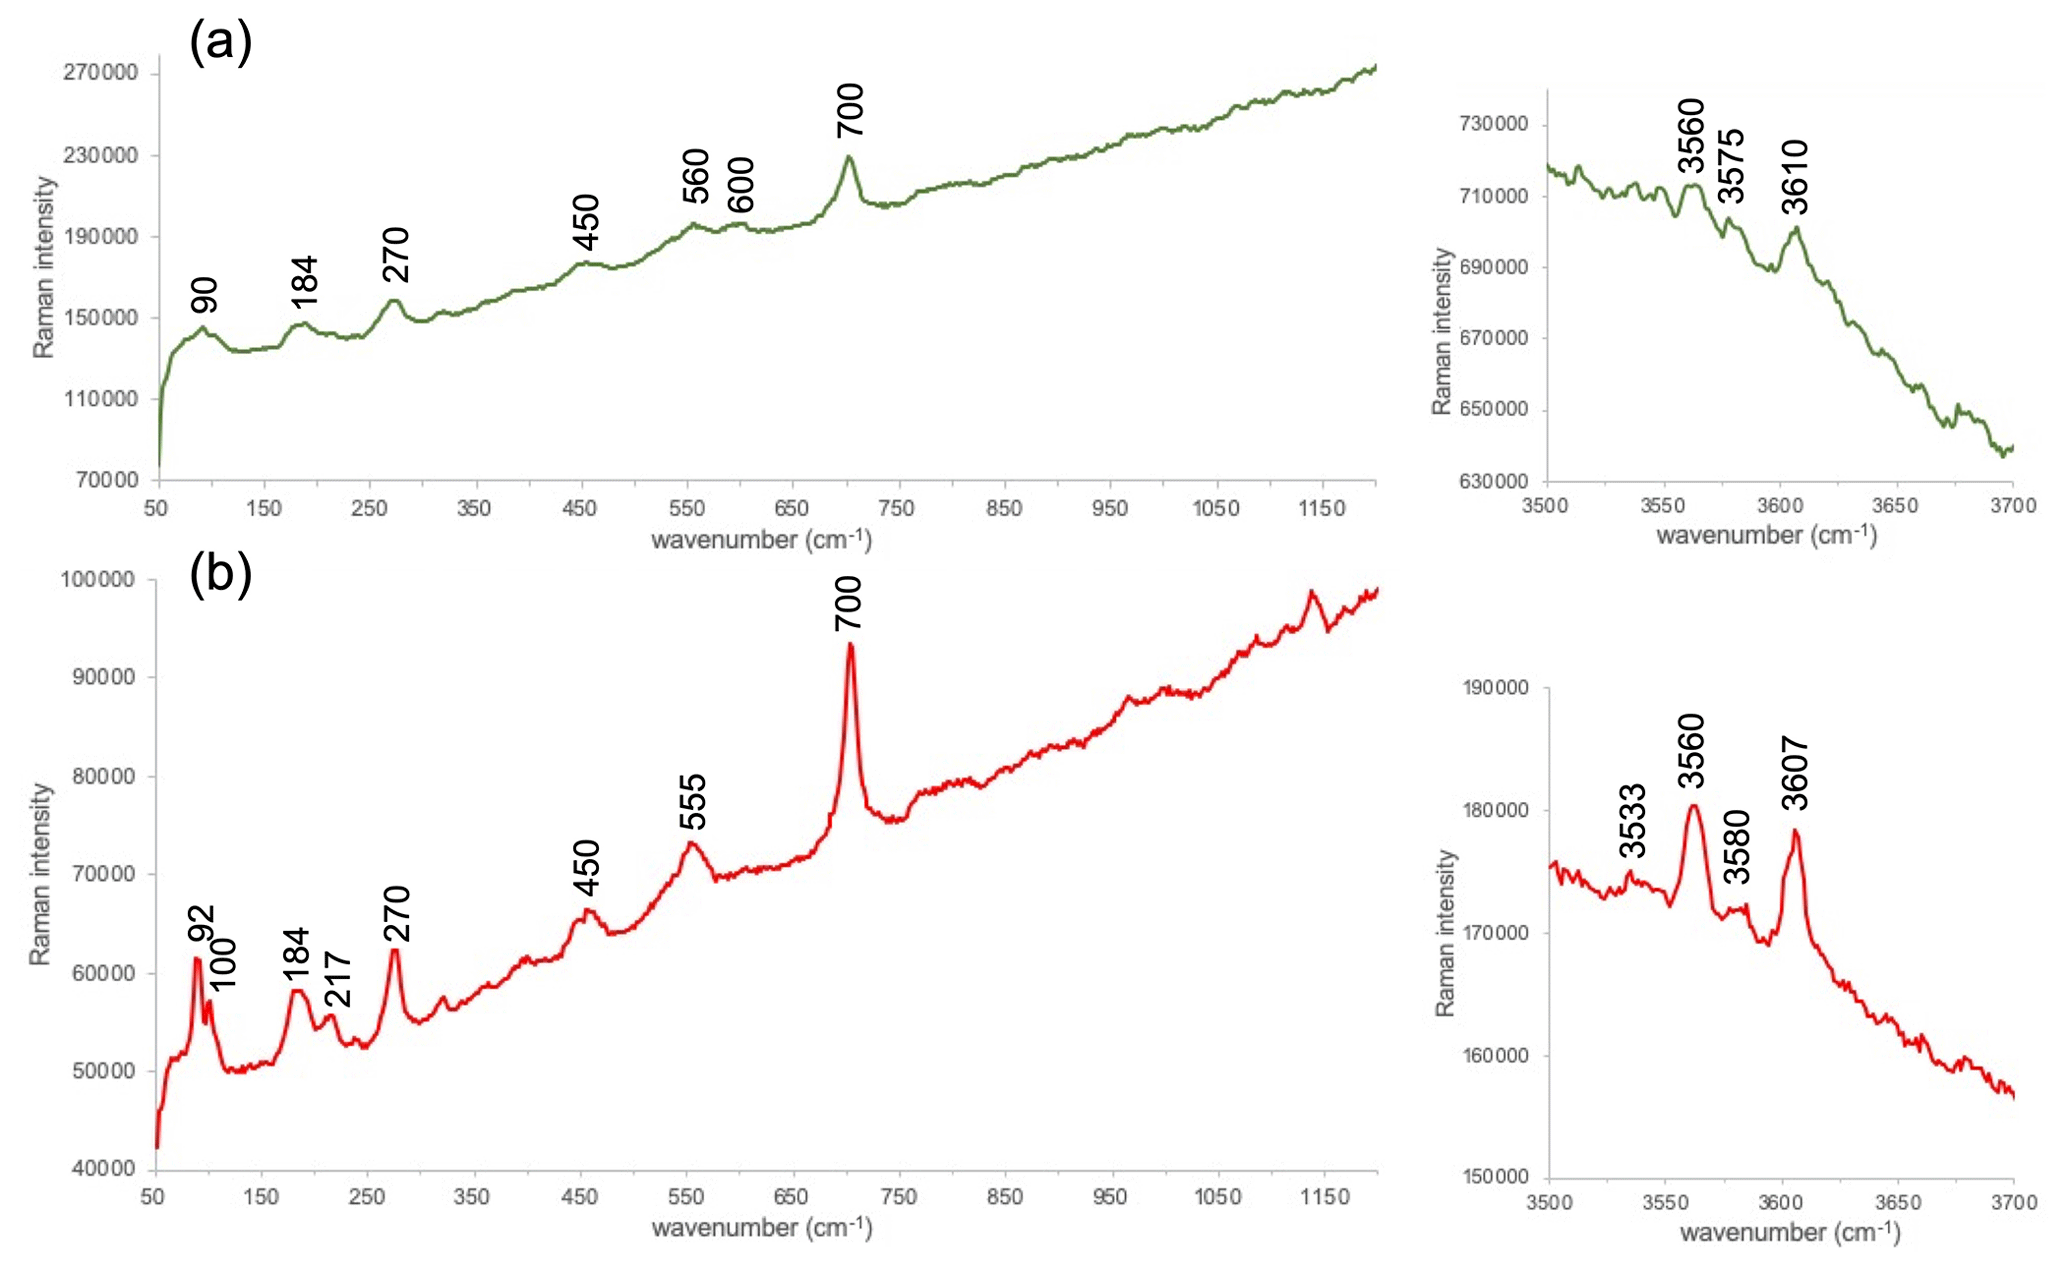
Figure 9Representative Raman spectra of the two types of green micas: glauconite (a) and celadonite (b) obtained at the 532 nm excitation wavelength and corresponding to two regions (see “Methods” for explanation). The intensity scale is in total counts.
In consequence, and although spectra from both green micas are very similar, probably the celadonite features described at nanoscale (more crystalline, less defects) indicative of a more ordered structure imply better-defined bands in the Raman spectra.
5.1 The origin of the two micas
Reolid and Abad (2014) pointed to the relation between the filamentous morphologies of the green micas and a possible microbial origin. Glauconite and celadonite crystallized forming a coating around organic filaments that have disappeared, leaving the void space within the elongated mineral structures (no more than a few tens of micrometres long) with rounded sections a few micrometres in diameter (Fig. 3). This makes sense with the microbial communities ubiquitously recorded on pillow lavas in recent ocean crust (e.g. Edwards et al., 2005; Santelli et al., 2008; Santelli, 2009). According to Reolid and Abad (2014) the microbes that lived in the spaces between the pillow lavas were extremophile, chemoorganotrophic organisms. In this frame, the chemical reactions related to the basalt alteration are capable of supplying enough energy for the chemoorganotrophic growth of microbes (Bach and Edwards, 2003; Santelli et al., 2008).
Textural observations of the mineral sequence coating the inner voids of the filaments indicate that glauconite, which is closer to the inner voids of the filaments, started to crystallize first. However, the transition from glauconite to celadonite through a domain (4–5 µm thick) which is a chaotic mix of both phases indicates that there was an interval in which the genesis of both green micas was coetaneous. Eventually, the only presence of celadonite crystals in the most external part of the filament coating reveals its final precipitation in absence of glauconite. The main change during the formation of the green minerals' coating could be related to the input of Fe, which should come from the chemoorganotrophic microorganisms. After their death, the Fe in the environment decreased, promoting the crystallization of celadonite instead of glauconite.
As indicated before, there is a transitional zone where glauconite and celadonite coexist at the nanometre scale (Fig. 8); nevertheless, a continuous solid solution between the two phases does not exist. From a chemical point of view, a compositional gap between the two micas exists mainly in the K, Fe and Mg contents (Fig. 4). Assuming that the microorganisms got energy from redox reactions involving Fe, the metabolic Fe-rich byproducts could have been accumulated in the cellular walls, contributing to the glauconite genesis around them. Probably when the growth of the glauconitic coatings reached a critical thickness, the microorganisms were isolated, contributing to their death as there was no possible exchange with the environment. Then the input of Fe decreased, more Mg and K entered the structure, and, instead of glauconite, celadonite was formed. However, not only the chemical gradient from microbial filament that conditions the elements available in the environment but also the different structural characteristics of both micas suggested by the existence of a compositional gap controlled the crystallization of both phases.
According to Reolid and Abad (2014) the genesis of both micas was related to a low-temperature hydrothermal activity with an open circulation regime, oxidizing conditions and a high seawaterrock ratio. The source of Fe in the system should be the hydrothermal fluids, and the source of K was seawater (Clayton and Pearse, 2000; D'Antonio and Kristensen, 2005; Baker et al., 2012). In addition, as the volcanic edifices of the Median Subbetic are composed of K-rich pillow lavas (Vera et al., 1997), they were also potential sources of K, as well as Fe. The crystallization temperature for glauconite and celadonite was probably the same, around 30–63 ∘C (Stakes and O'Neil, 1982; Odin et al., 1988; Clayton and Pearce, 2000; D'Antonio and Kristensen, 2005; Clauer et al., 2011).
At a later stage, the environmental conditions in the spaces among pillow lavas changed due to the deposition of marine sediments or new pillow lava. Therefore, the isolation from the seawater favoured the increase in T and the reducing conditions. In this phase, Reolid and Abad (2014) described the formation of smectites (saponite), calcite and quartz which generally completed filling the voids among the pillow lavas. In some cases, the voids between the pillow-lava bodies were not completely infilled and formed quartz and calcite geodes. For D'Antonio and Kristensen (2005), glauconite characterizes hydrothermal alteration under oxidizing conditions, whereas saponite and calcite characterize alteration under reducing conditions. There are significant similarities between the minerals of low temperature hydrothermal alteration of the Jurassic pillow lavas studied here and those from ocean-ridge basalts (Alt, 1999; Clayton and Pearce, 2000; D'Antonio and Kristensen, 2005), with the presence of early Fe-rich dioctahedral micas followed by a later formation of saponite and carbonates.
The peculiar origin of glauconite described above, which is not the typical one (Odin and Matter, 1981; Odin and Fullagar, 1988; Amorosi, 1995), allowed its coexistence with celadonite. Both micas are usually linked to different genetic environments: semi-confined microenvironments in the sediment pore water vs. ocean floor hydrothermal alteration of volcanic rocks. Therefore, the idea of celadonite as a possible endmember of the glauconitic series has been chiefly based in the chemical tendency of glaucony during its maturation, which roughly points to celadonite. Nevertheless, to our knowledge, this complete evolution has never been described in nature. It is for this that the described example from southern Spain offers a unique opportunity to describe the chemical and structural differences between the two micas at the nanometre scale.
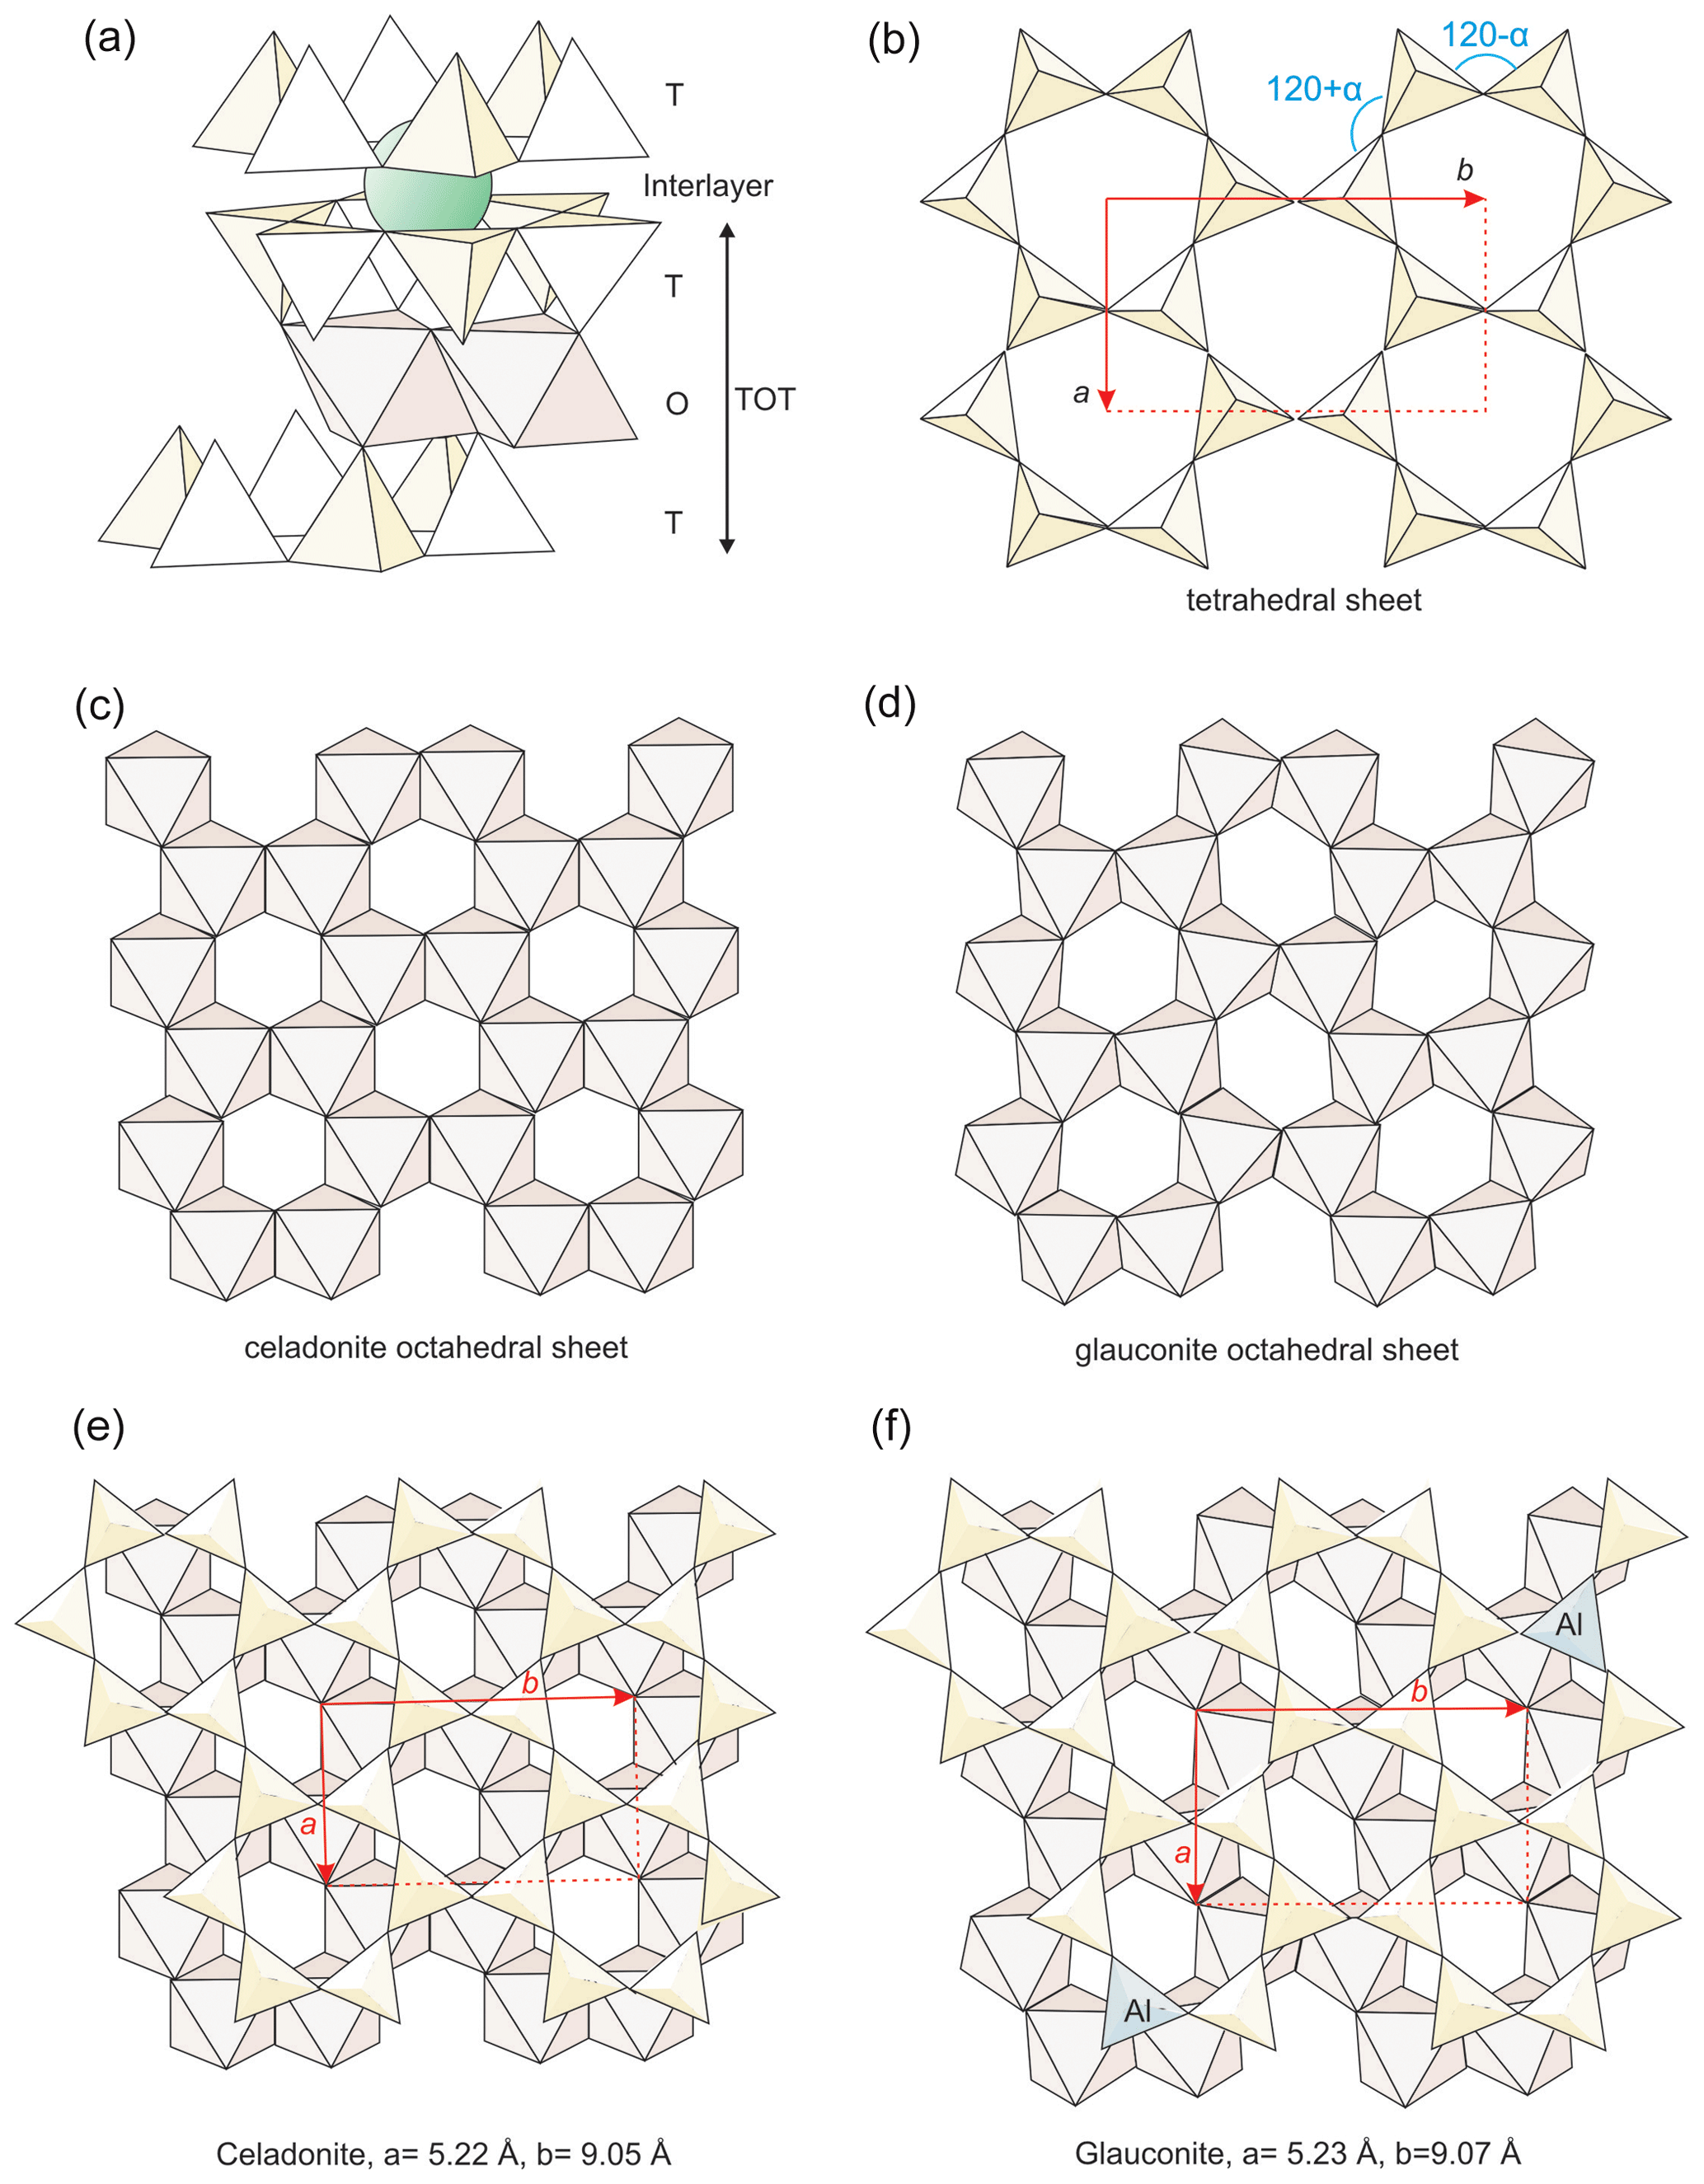
Figure 10Structural details of micas to show the differences between celadonite and glauconite: (a) general structure of micas; (b) geometry of the tetrahedral sheet with the ditrigonal distortion angle (α) indicated; (c, d) octahedral sheets respectively of celadonite and other dioctahedral phyllosilicates; (e, f) matching between tetrahedral and octahedral sheets of the two kinds of micas, with the difference of lattice parameters indicated.
5.2 Compositional gap and structural relationships between glauconite and celadonite
Normally, the existence of a compositional gap between two mineral phases having similar structures is due to small structural differences motivated for the necessity of the structure to accommodate different chemical populations (Bloss, 1994). This includes the well-known cases of albite vs. K-feldspars or paragonite vs. muscovite. In the two cases the significant differences of ionic radii between Na+ and K+ render it impossible that the two endmembers have exactly the same structure. Therefore, the general geometries are the same, but, in detail, each extreme term presents a different arrangement of atomic distances and bonding angles to accommodate the smaller and the greater cations. The case of glauconite vs. celadonite is not so obvious and, to our knowledge, has not yet been described. In part, the small grain size and defective crystalline character of the two minerals have precluded the existence of a wide basis of structural knowledge.
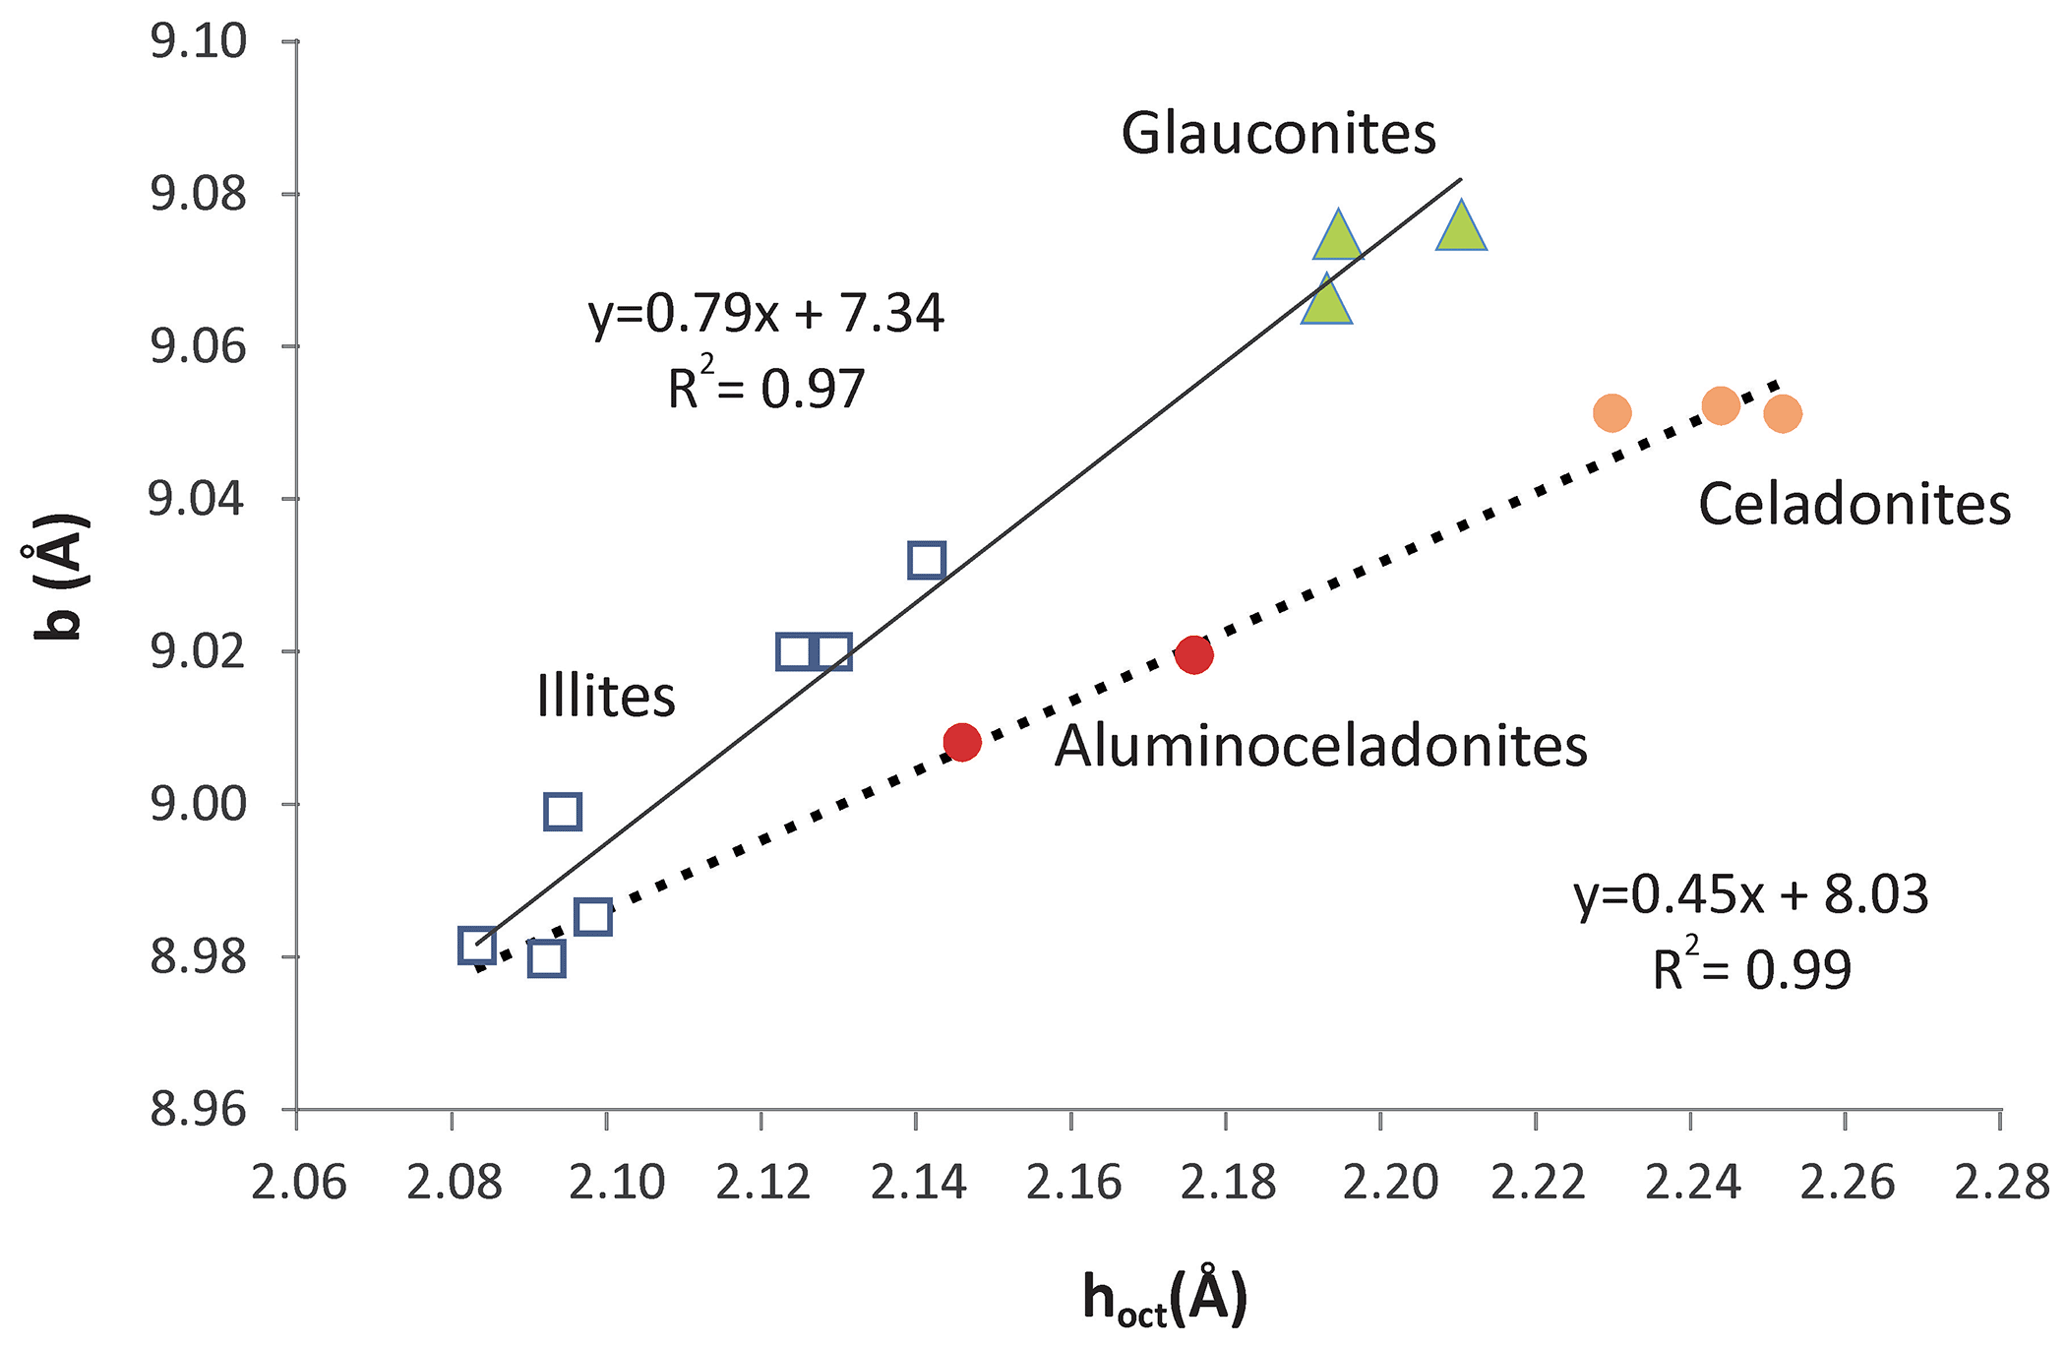
Figure 11Relationship between the mean thickness of the octahedral sheet and b parameter of illites (squares), aluminoceladonites (red circles), celadonites (orange circles) and glauconites (green triangles). Data from Drits et al. (2010).
The mica structure is composed of TOT (tetrahedral–octahedral–tetrahedral) layers linked through electrostatic charge by cations (Fig. 10a). Hence, the basal spacing (d001) parameter is basically determined by the interlayer cationic size and charge. Nevertheless, the TOT also shows internal structural differences related to its chemical composition, including its thickness. Drits et al. (2010) determined various structural parameters, which describe in detail the TOT layer, for a series of samples containing illites, aluminoceladonites, glauconites and celadonites. They found continuous linear relationships between them, with the distribution of the different samples along the various correlation lines linked to their compositions, that is, a behaviour coherent with a continuous series of solid solution including the four studied compositional varieties of micas.
Nevertheless, all these parameters refer to the c direction of the structure. In contrast, when the lateral b parameter is considered, glauconites and celadonites show different relationships with the mean thickness of the octahedral sheet (Fig. 11) and represent the distinct trends of two sets of samples with compositional differences. Similar pairs of relationships (not shown) between b and other parameters related to the c direction of the structure, like the flattening angle of the octahedral sheet and the corrugation of the basal oxygen surface, can be found after a careful analysis of the data of Drits et al. (2010).
From the data in Fig. 11, glauconites are characterized by more distorted octahedrons (longer in the b direction) than celadonites, and the two micas represent the extremes of two compositional series in the structural evolution of micas (continuous and dashed lines in Fig. 11). Schmidt et al. (2001) and Brigatti et al. (2005) found that the decrease in VIAl in favour of Fe and Mg in the octahedral sheet (celadonitic substitution) is progressively accommodated by a continuous evolution of structural parameters. Nevertheless, Schmidt et al. (2001) found that the tendency of increase in the b parameter with the increase in Fe and Mg finishes and reverses for high values of this substitution (> 60 % of aluminoceladonite content). Therefore, the b parameter of extreme celadonites is not finally so high as expected following the tendency of those micas which have lower celadonite contents.
From the first description of celadonite structure (Zvyagin, 1957; Zhukhlistov et al. 1977, Tsipurskii and Drits, 1986; Zhukhlistov, 2005; Dorset, 1992), it is known that the usual difference in size between trans-octahedral (M1) and cis-octahedral (M2) positions, generally found in all dioctahedral phyllosilicates, is minimum for celadonite (Fig. 10c). Also Brigatti et al. (2005) described that M1 and M2 tend to become more similar with the increase in celadonitic content of micas. Schmidt et al. (2001) attribute the change in tendency of a and b parameters for more than 60 % celadonite content to this increasing similarity between the empty M1 and the occupied M2 positions. That is, celadonite, even if compositionally dioctahedral, presents a trioctahedral behaviour regarding the similitude between M1 and M2 positions (Fig. 10c). This sort of structural “disguise” solves the difficulties of matching between tetrahedral and octahedral sheets for high celadonite contents (Fig. 10e). The similitude between M1 and M2 positions imposes a minimum ditrigonal distortion angle of the tetrahedral sheets (α angle, Fig. 10b) because the tetrahedral sheet distortion is linked to the octahedral distortion, which is maximum in dioctahedral phyllosilicates (Fig. 10d) and minimum, or inexistent, in trioctahedral ones. In fact, all the structural determinations (see references above) of celadonites report very low α angles.
The α angle is related to b parameter and tetrahedral Al substitution through equations proposed in the literature and based on high correlation coefficients (Radoslovich and Norrish, 1962; Schmidt et al., 2001; Brigatti et al., 2005). Drits et al. (2010) report α angles for glauconites only slightly higher than, and partially coincident with, celadonites in spite of their tetrahedral Al substitution. According to the above-cited equations, this is due to the previously discussed high b parameter that glauconites present in comparison with celadonites (Fig. 11). In other words, in glauconites the relatively low α angle is maintained because their b values are larger to accommodate the greater size of tetrahedrons due to the IVAl increase (Fig. 10f). They represent different structural solutions (Fig. 10e and f) motivated by different distribution of the TOT layer charge: octahedral in celadonites and mixed in glauconites. Apparently, the composition found for glauconite in this study and previous literature represents a compromise between the minimum tetrahedral and the maximum octahedral charges for which the matching between the two sheets is still possible (Fig. 10f). Beyond these values, the tetrahedral sheet would be too small to allow a stable connection with a wider octahedral sheet.
To sum up, celadonites and glauconites present enough differences in their structural details to justify the existence of a compositional gap. The knowledge of those details would need additional adequate methods of study, which are outside the scope of this paper. Nevertheless, the different atomic substitutions in the structure, which generates a different distribution of charges between the octahedral and tetrahedral positions, are at the origin of such differences. They produce for glauconites a higher size of tetrahedrons and possibly necessary accommodations in the linked octahedrons that, finally, determine an increase in the lateral dimensions of the TOT layer.
Spectroscopic methods and crystal-chemical models have been employed to characterize the octahedral cationic distribution in celadonite and glauconite by Drits et al. (1997), Besson and Drits (1997), and Dainyak et al. (2013). These studies have described in glauconite a significant segregation of the octahedral cations, with Fe3+, Fe2+, Mg2+ and Al3+ concentrated in clusters. The Raman spectra obtained in this study have not found significant differences between the two micas further from those directly linked with their chemical differences. In general, the celadonite spectra show a better definition than the glauconite ones, as previously described by Ospitali et al. (2008). The poor crystalline character of glauconite, with very small crystalline domain size and abundance of defects (Fig. 7), may be at the origin of the poor definition of the Raman peaks of glauconites, which, in turn, precludes the identification of possible structural differences between the two micas.
The study of glauconite and celadonite coexisting at the nanometre scale has allowed us to acquire a deeper insight about their crystal-chemical relationships. The two micas grew in confined spaces between pillow lavas as a result of microbial activity. The chemistry of the local microenvironment was conditioned at micrometre scale by its proximity to the microbial source of Fe, producing two consecutive areas characterized by each of the micas: glauconite closer to the Fe source and celadonite further away from it. In the transitional zone, phyllosilicates with an intermediate composition between celadonite and glauconite are lacking, and the two micas describe a compositional gap characterized by net differences in Fe, Mg and K contents. Therefore, celadonite is not the extreme term of the glauconitic series. The chemical celadonite compositional field in the studied samples appears limited by Mg > 0.7, Fe < 0.8 and K > 0.8 (a.p.f.u.) and that of glauconites by Mg < 0.6, Fe > 0.95 and K < 0.7 (a.p.f.u.). The negative charge of the TOT layer linked to the tetrahedral sheet is roughly 10 % in celadonite, while it is 25 % in glauconite. The two micas represent the extremes of two different compositional series in the mica's chemical and structural space linked to their respective different distribution of charge between the tetrahedral and octahedral sheets.
All relevant data are displayed in the article and additional ones are available upon request from the corresponding author.
Fieldwork was developed by MR and IA. FN, IA, BB and MR together worked on the conceptualization of the study, on the investigation and the interpretation of results, and on manuscript preparation (original draft and review).
The authors declare that they have no conflict of interest.
Publisher's note: Copernicus Publications remains neutral with regard to jurisdictional claims in published maps and institutional affiliations.
We acknowledge the use of the LMA-INA (Universidad de Zaragoza) for access to dual beam equipment and expertise, the technical and human support provided by CICT of Universidad de Jaén (UJA, MINECO, Junta de Andalucía, FEDER), and the use of the PANalytical X'Pert Pro diffractometer of the Departamento de Mineralogía y Petrología, Universidad de Granada, Spain. María del Mar Abad is especially recognized for helping with the HRTEM work. The access to the HAADF FEI TITAN G2 microscope and the Philips CM20 (STEM) microscope was facilitated by the Centro de Instrumentación Científica of the Universidad de Granada. Thanks are extended to Javier Cuadros and an anonymous reviewer for their critical reviews and very helpful comments and suggestions.
This research was carried out with the financial support of projects PGC2018-094573-B-I00, PID2019-104624RB-I00 and RTI2018-093419-B-I00 from the MCIU-AEIFEDER and the research groups RNM-325, RNM-200 and RNM-179 of the Junta de Andalucía and E18_17R of the Government of Aragon and European Fund.
This paper was edited by Martine Buatier and reviewed by Javier Cuadros and one anonymous referee.
Alt, J. C.: Very low-grade hydrothermal metamorphism of basic igneous rocks, in: Low-grade Metamorphism, edited by: Frey, M. and Robinson, D., Blackwell, Oxford, 169–201, https://doi.org/10.1002/9781444313345.ch6, 1999.
Amorosi, A.: Glaucony and sequence stratigraphy: a conceptual framework of distribution in siliciclastic sequences, J. Sediment. Res., 65, 419–425, https://doi.org/10.1306/d4268275-2b26-11d7-8648000102c1865d, 1995.
Bach, W. and Edwards, K. J.: Iron and sulphide oxidation within the basaltic ocean crust: implications for chemolithoautotrophic microbial biomass production, Geochim. Cosmochim. Ac., 67, 3871–3887, https://doi.org/10.1016/s0016-7037(03)00304-1, 2003.
Bailey, S. W.: Summary of recommendation of AIPEA nomenclature committee, Clay Miner., 15, 85–93, https://doi.org/10.1180/claymin.1980.015.1.07, 1980.
Baker, L. L., Rembert, W. C., Sprenke, K. F., and Strawn, D. G.: Celadonite in continental flood basalts of the Columbia River Basalt Group, Am. Mineral., 97, 1284–1290, https://doi.org/10.2138/am.2012.4129, 2012.
Baldermann, A., Warr, L. N., Grathoff, G. H., and Dietzedl, M.: The rate and mechanism of deep-sea glauconite formation at the Ivory Coast Ghana marginal ridge, Clay. Clay Miner., 61, 258–276, https://doi.org/10.1346/ccmn.2013.0610307, 2013.
Besson, G. and Drits, V. A.: Refined relationships between chemical composition of dioctahedral fine-grained micaceous minerals and their infrared spectra within the OH stretching region 2, The main factors affecting OH vibrations and quantitative analysis, Clay. Clay Miner., 45, 170–183, https://doi.org/10.1346/ccmn.1997.0450204, 1997.
Bloss, F. D.: Crystallography and Crystal Chemistry, Mineralogical Society of America, Washington DC, 1994.
Brigatti, M. F., Malferrari, D., Poppi, M., and Poppi, L.: The 2M1 dioctahedral mica polytype: A crystal chemical study, Clay. Clay Miner., 53, 190–197, https://doi.org/10.1346/ccmn.2005.0530209, 2005.
Clauer, N., O'Neil, J. R., Honnorez, J., and Buatier, M.: 87Sr/86Sr and 18O/16O ratios of clays from a hydrothermal area near the Galapagos rift as records of origin, crystallization temperature and fluid composition, Mar. Geol., 288, 32–42, https://doi.org/10.1016/j.margeo.2011.07.003, 2011.
Clayton, T. and Pearce, R. B.: Alteration mineralogy of Cretaceous basalt from ODP Site 1001, Leg 165 (Caribbean Sea), Clay Miner., 35, 719–733, https://doi.org/10.1180/000985500547043, 2000.
Dainyak, L. G., Rusakov, V. S., Sukhorukov, I. A., and Drits, V. A.: Octahedral cation distribution in glauconites from Southern Urals by combination of crystal-chemical model and quasi-continuous model-independent quadrupole splitting distributions (QSD) fitted to their Mossbauer spectra. Eur. J. Mineral., 25, 405–414, https://doi.org/10.1127/0935-1221/2013/0025-2275, 2013.
D'Antonio, M. and Kristensen, M. B.: Hydrothermal alteration of oceanic crust in the West Philippine Sea Basin (Ocean Drilling Program Leg 195, Site 1201): inferences from a mineral chemistry investigation, Mineral. Petrol., 83, 87–112, https://doi.org/10.1007/s00710-004-0060-6, 2005.
Dorset, D. L.: Direct phasing in electron crystallography: determination of layer silicate structures, Ultramicroscopy, 45, 5–14, https://doi.org/10.1016/0304-3991(92)90033-g, 1992.
Drits, V. A., Dainyak, L. G., Muller, F., Besson, G., and Manceau, A.: Isomorphous cation distribution in celadonites, glauconites and Fe-illites determined by infrared, Mössbauer and EXAFS spectroscopies, Clay Miner., 32, 153–179, https://doi.org/10.1180/claymin.1997.032.2.01, 1997.
Drits, V. A., Zviagina, B. B., McCarty, D. K., and Salyn, A. L.: Factors responsible for crystal-chemical variations in the solid solutions from illite to aluminoceladonite and from glauconite to celadonite, Am. Mineral., 95, 348–361, https://doi.org/10.2138/am.2010.3300, 2010.
Edwards, K. J., Bach, W., and McCollom, T. M.: Geomicrobiology in oceanography: microbe-mineral interactions at and below the seafloor, Trends Microbiol., 13, 449–456, https://doi.org/10.1016/j.tim.2005.07.005, 2005.
Loh, E.: Optical vibrations in sheet silicates, J. Phys. C, 6, 1091–1094, https://doi.org/10.1088/0022-3719/6/6/022, 1973.
López-Quirós, A., Sánchez-Navas, A., Nieto, F., and Escutia, C.: New insights into the nature of glauconite, Am. Mineral, 105, 674–686, https://doi.org/10.2138/am-2020-7341, 2020.
Moore, D. M. and Reynolds, R. C. J.: X-ray diffraction and the identification and analysis of clay minerals, Oxford Univ. Press, New York, 378 pp., 1997.
Morata, D. A., Puga, E., Demant, A., and Aguirre, L.: Evolución petrogenética del magmatismo básico mesozoico en las Zonas Externas de las Cordilleras Béticas (S. España), Geogaceta, 20, 576–578, https://doi.org/10.3989/egeol.95513-4289, 1996.
Odin, G. S. and Fullagar, P. D.: Geological significance of the glaucony facies, in: Green Marine Clays, edited by: Odin, G. S., Elsevier, Develop. Sedim., 45, 295–332, https://doi.org/10.1016/s0070-4571(08)70069-4, 1988.
Odin, G. S. and Matter, A.: De glauconiarum origine, Sedimentology, 28, 611–641, https://doi.org/10.1111/j.1365-3091.1981.tb01925.x, 1981.
Odin, G. S., Desprairies, A., Fullagar, P. D., Bellon, H., Decarreau, A., Frohlich, F., and Zelvelder, M.: Nature and geological significance of celadonite, in: Green Marine Clays, edited by: Odin, G. S., Elsevier, Develop. Sedim., 45, 337–398, https://doi.org/10.1016/s0070-4571(08)70071-2, 1988.
Ospitali, F., Bersani, D., Di Lonardo D., and Lotici, P. P.: Green earths: vibrational and elemental characterization of glauconites, celadonites and historical pigments, J. Raman Spectrosc., 39, 1066–1073, https://doi.org/10.1002/jrs.1983, 2008.
Overwijk, M. H. F.: Novel Scheme for the preparation of transmission electron microscopy specimens with a focused ion beam, Journal of Vaccum Science and Tecnology B: Microelectronics and Nanometer structures, 11, 2021–2024, https://doi.org/10.1116/1.586537, 1993.
Parron, C. and Amouric, M.: Crystallochemical heterogeneity of glauconites and the related problem of glauconite – celadonite distinction, Chem. Geol., 84, 286–289, https://doi.org/10.1016/0009-2541(90)90240-8, 1990.
Portugal, M., Morata, D. A., Puga, E., Demant, A., and Aguirre, L.: Evolución geoquímica y temporal del magmatismo básico mesozoico en las Zonas Externas de las Cordilleras Béticas, Estud. Geol., 51, 109–118, https://doi.org/10.3989/egeol.95513-4289, 1995.
Pouchou, J. L. and Pichoir, F.: “PAP” (f) (r) (t) procedure for improved quantitative microanalysis, in: Microbeam Analysis, edited by: Armstrong, J. T., San Francisco Press, San Francisco, 104 pp., 1985.
Puga, E., Portugal, M., Díaz de Federico, A., Bargossi, G. M., and Morten, L.: The evolution of the magmatism in the External Zones of the Betic Cordillera during the Mesozoic, Geodin. Acta, 3, 253–266, https://doi.org/10.1080/09853111.1989.11105191, 1989.
Radoslovich, E. W. and Norrish, K.: The cell dimensions and symmetry of layer-lattice silicates. I. Some structural considerations, Am. Mineral., 47, 599–616, 1962.
Reolid, M. and Abad, I.: Glauconitic laminated crusts as a consequence of hydrothermal alteration of jurassic pillow-lavas from Median Subbetic (Betic Cordillera, S Spain): A microbial influence case, J. Iber. Geol., 40, 389–408, https://doi.org/10.5209/rev_jige.2014.v40.n3.43080, 2014.
Rieder, M., Cavazzini, G., D'Yakonov, Y. S., Frank-Lamenetskii, V. A., Gottardi, G., Guggenheim, S., Koval, P. V., Müller, G., Neiva, A. M. R., Radoslovich, E. W., Robert, J. L., Sassi, F. P., Takeda, H., Weiss, Z., and Wones, D. R.: Nomenclature of the micas, Can. Mineral., 36, 905–912, 1998.
Santelli, C. M.: Life in the deep sea, Nat. Geosci., 2, 825–826, https://doi.org/10.1038/ngeo711, 2009.
Santelli, C. M., Orcutt, B. N., Banning, E., Bach, W., Moyer, C. L., Sogin, M. L., Staudigel, H., and Edwards, K. J.: Abundance and diversity of microbial life in ocean crust, Nature, 453, 653–656, https://doi.org/10.2138/am-2001-0418, 2008.
Schmidt, M. W., Dugnani, M., and Artioli, G.: Synthesis and characterization of white micas in the join muscovite-aluminoceladonite, Am. Mineral., 86, 555–565, https://doi.org/10.2138/am-2001-0418, 2001.
Stakes, D. S. and O'Neil, J. R.: Mineralogy and stable isotope geochemistry of hydrothermally altered oceanic rocks, Earth Planet. Sc. Lett., 57, 285–304, https://doi.org/10.1016/0012-821x(82)90151-0, 1982.
Tlili, A., Smith, D. C., Beny, J. M., and Boyer, H.: A Raman microprobe study of natural micas, Mineral. Mag., 53, 165–179, https://doi.org/10.1180/minmag.1989.053.370.04, 1989.
Tsipurski\ĭ, S. I. and Drits, V. A.: Refining the crystallographic structure of celadonite, Mineral. Zhurnal, 8, 32–40, 1986.
Vera, J. A., Molina, J. M., Montero, P., and Bea, F.: Jurassic guyots on the Southern Iberian Continental Margin: a model of isolated carbonate platforms on volcanic submarine edifices, Terra Nova, 9, 163–166, https://doi.org/10.1046/j.1365-3121.1997.d01-22.x, 1997.
Zhukhlistov, A. P.: Crystal structure of celadonite from the electron diffraction data, Crystallogr. Rep., 50, 902–906, https://doi.org/10.1134/1.2132393, 2005.
Zhukhlistov, A. P., Zvyagin, B. B., Lazarenko, E. K., and Pavlishin, V. I.: Refinement of crystal-structure of ferrous celadonite, Kristallografiya, 22, 498–504, 1977.
Zvyagin, B. B.: Determination of the structure of celadonite by electron diffraction, Sov. Phys. Crystallogr., 2, 388–394, 1957.