the Creative Commons Attribution 4.0 License.
the Creative Commons Attribution 4.0 License.
 | 19 Apr 2021
Occurrence of silesiaite, a new calcium–iron–tin sorosilicate in the calcic skarn of El Valle-Boinás, Asturias, Spain
Antonia Cepedal
Mercedes Fuertes-Fuente
Agustín Martin-Izard
Silesiaite (Ca2Fe+3Sn(Si2O7)(Si2O6OH)), the Fe3+ analogue of kristiansenite (Ca2ScSn(Si2O7)(Si2O6OH)), has been found in the calcic Cu–Au skarn of El Valle-Boinás, in the north of Spain, which is the second occurrence of this mineral in the world. The study under optical microscopy shows crystals with a distinct pleochroism, from uncoloured to yellowish, high relief and imperfect cleavage under plain polarized light. Under polarized and analysed light, the mineral shows anomalous colours of interference and hourglass and sector optical zoning. Backscattered electron images reveal compositional zoning mimicking optical zoning with light grey (Sn-rich) and dark grey (Fe-rich) zones. The electron microprobe analyses showed that Fe-rich zones are also the richest in Al and Ti, whereas the Sn-rich zones are richest in Mn. The Fe+3 and Fe+2 proportions calculated by stoichiometry suggest a couple substitution such as . According to this, the formula of the silesiaite can be written as , where x is between 0 and 0.4.
- Article
(12812 KB) - Full-text XML
-
Supplement
(309 KB) - BibTeX
- EndNote


Silesiaite, with an ideal formula of Ca2Fe+3Sn(Si2O7)(Si2O6OH), was first found in a pegmatite of the Karkonosze granite in Lower Silesia, Poland (Pieczka et al., 2017). According to these authors, the mineral is the Fe3+ analogue of kristiansenite (Ca2ScSn(Si2O7)(Si2O6OH)), a triclinic (C1) Sc-bearing sorosilicate also found in a granite pegmatite in Norway (Raade et al., 2002). Pieczka et al. (2017), in their communication, gave the cell parameters, refined from powder data, and space-group symmetry of silesiaite (a=10.028(1), b=8.408(1), c=13.339(2) Å, α=90.01∘ (1), β=109.10∘ (1), γ=90.00∘ (1); C1), in addition to the main reflections (9.147(100), 8.408(12), 6.607(64), 5.195(6), 4.413(10), 3.312(7), 3.151(12), 3.095(9)).
The aim of this paper is to shed light on the occurrence of silesiaite in the El Valle-Boinás Cu–Au deposit, Asturias, in the northern part of Spain. The deposit, unlike the other occurrences, is a skarn-type deposit overprinted by a low-temperature hydrothermal alteration (Cepedal et al., 2000, 2003, 2008). The presence of silesiaite is related to an iron-rich calcic skarn, in association with other minerals including andradite (Adr96−100), clinopyroxene (Hd30−47), actinolite, babingtonite, apophyllite-(KOH) and hydroandradite, among others (Cepedal et al., 2003). In this paper, we present an optical and electronic microscopy study of the mineral, which appears as optical twinned and sector-zoned crystals. Electron microprobe analyses performed on the crystals revealed that there is also a compositional zoning, based on tin and iron contents. In addition to this, Raman analyses were performed on chemically different areas of some crystals. This work will contribute to increase the knowledge of this mineral, whose second occurrence in the world is described here.
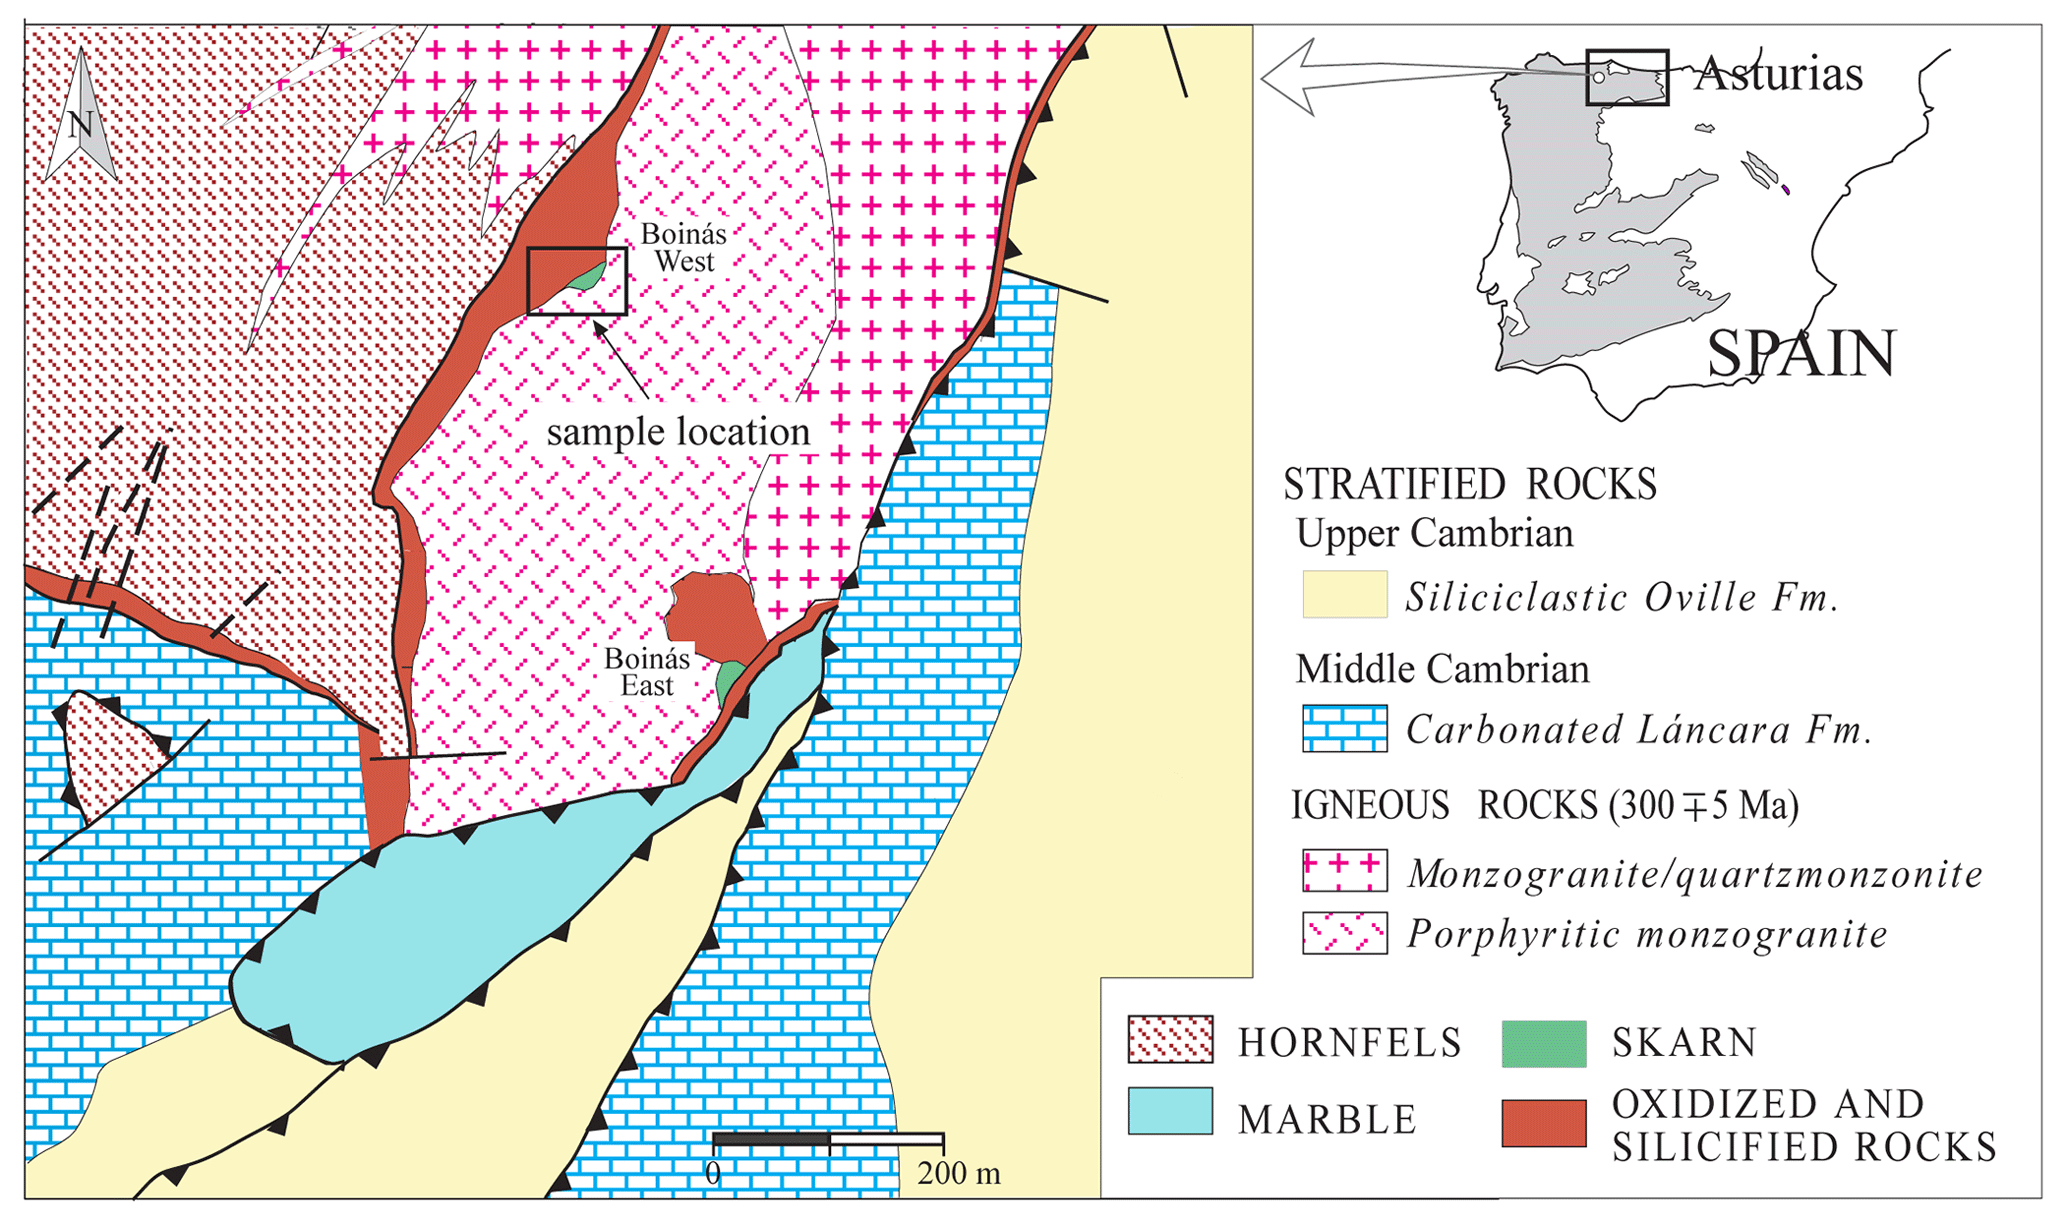
Figure 1Schematic geology of El Valle-Boinás Cu–Au deposits where silesiaite was found (modified from Cepedal et al., 2003).
The El Valle-Boinás Cu–Au skarn is related to the intrusion of two different stocks, from quartz-monzonite to monzogranite, at 300±5 Ma (Martin-Izard et al., 2000) in a pre-orogenic Palaeozoic sequence (Fig. 1). The intrusion of these granitoids led to the formation of two different Cu–Au skarn types, calcic and magnesian, in the limestones and dolostones of the Láncara Formation (Cambrian in age), in addition to endoskarn mineralization in the igneous rocks. Three main mineralized areas were defined around the intrusive body: Boinás West, Boinás East and El Valle (to the north; not shown in Fig. 1). Magnesian and calcic skarns occurred in El Valle and, particularly, in Boinás East. In Boinás West, only calcic skarn was developed. The silesiaite was found in the calcic skarn from Boinás West. This skarn consists mostly of garnet (Adr20−100), pyroxene (Hd3−97), wollastonite and lesser amounts of vesuvianite. Skarn zonation is expressed in terms of the mineralogy and changing chemical compositions of the main calc-silicate minerals. Proximal skarn consists of coarse-grained grossular garnet (Gr20−50) and intermediate pyroxene (Hd28−52); the pyroxene garnet ratio increases towards distal parts of the skarn. Wollastonite and an early Fe-poor pyroxene (Hd3−28) occur close to the contact with marble. Iron enrichment during skarn formation is indicated by the presence of andradite (Adr70−100) and hedenbergite (Hd70−97). This Fe-rich pyroxene continued to form during the first retrograde stage, which is characterized by epidote (Ps22−27), amphibole (Tr20−58), quartz, calcite, K-feldspar, apatite and titanite. Hedenbergite is locally altered to babingtonite, a hydrated calcic-ferrous-ferric-silicate (Cepedal et al., 2003), in association with quartz, calcite and Fe-rich epidote (up to Ps48). The second retrograde stage is characterized by the formation of chlorite and prehnite, in addition to quartz and calcite. Chalcopyrite, bornite and pyrite are the main sulfides with chalcocite, molybdenite, tetrahedrite-tennantite, arsenopyrite and lesser amounts of pyrrhotite. Gold occurs as native Au, electrum or tellurides (petzite and sylvanite), in association with hessite and bismuthinite, among others (Cepedal et al., 2006).
The polished thin section where silesiaite occurs was studied at the University of Oviedo under optical and scanning electron microscopy (SEM) using a JEOL-6610LV in association with chemical microanalysis by means of energy dispersive X-ray (EDAX). Backscattered electron (BSE) images of the silesiaite crystals were used to perform the electron microprobe analysis (EMPA), also at the University of Oviedo, using a Cameca SX100. The analytical conditions were an accelerating voltage of 15 kV and a beam current of 30 nA for an acquisition time of 20 s for X-ray peak and background, except for some elements (Sc, Zr, Nb, Cu, Zn), for which the conditions were 20 kV and 100 nA of beam current. Standards, diffracting crystals, analytical lines and mean detection limits (in wt. %) were as follows: albite-Na (TAP, Kα, 0.07), MgO-Mg (LTAP, Kα, 0.02), jade-Si (TAP, Kα, 0.03), andradite-Ca (LPET, Kα, 0.04), Al2O3-Al (TAP, Kα, 0.03), MnTi-Ti (LPET, Kα, 0.02), MnTi-Mn (LLIF, Kα, 0.03), magnetite-Fe (LLIF, Kα, 0.05), cassiterite-Sn (LPET, Lα, 0.09), orthoclase-K (LPET, Kα, 0.03), pure Sc-Sc (LLIF, Kα, 0.05), pure Nb-Nb (LPET, Lα, 0.04), zircon-Zr (TAP, Lα, 0.05), pure Cu–Cu (LLIF, Kα, 0.02) and sphalerite-Zn (LLIF, Kα, 0.02),
The Raman spectra were obtained at room temperature with a Horiba Jobin Yvon RPA-HE 532 Raman spectrograph with a multichannel air-cooled (−70 ∘C) charge-coupled device (CCD) detector, using an argon-ion laser (514.5 nm) equipped with a 1800 g mm−1 grating and a nominal power of 100 mW. The spectral resolution was 1 cm−1 and the spectral range between 200 and 3400 cm−1. The Raman system includes an Olympus 50X long working distance (LWD) visible objective (NA = 0.50 and WD = 10.6 mm). The silicon standard was used for the calibration of the frequencies of the Raman spectra. The acquisition time was set in such a way that the intensity reached at least of the maximum level of the CCD (i.e. 20 000 counts per second). Spectrum manipulation consists of a basic treatment, such as baseline adjustment and peak fitting (Lorentz function). The Raman analyses were performed at CREGU (Nancy, France).
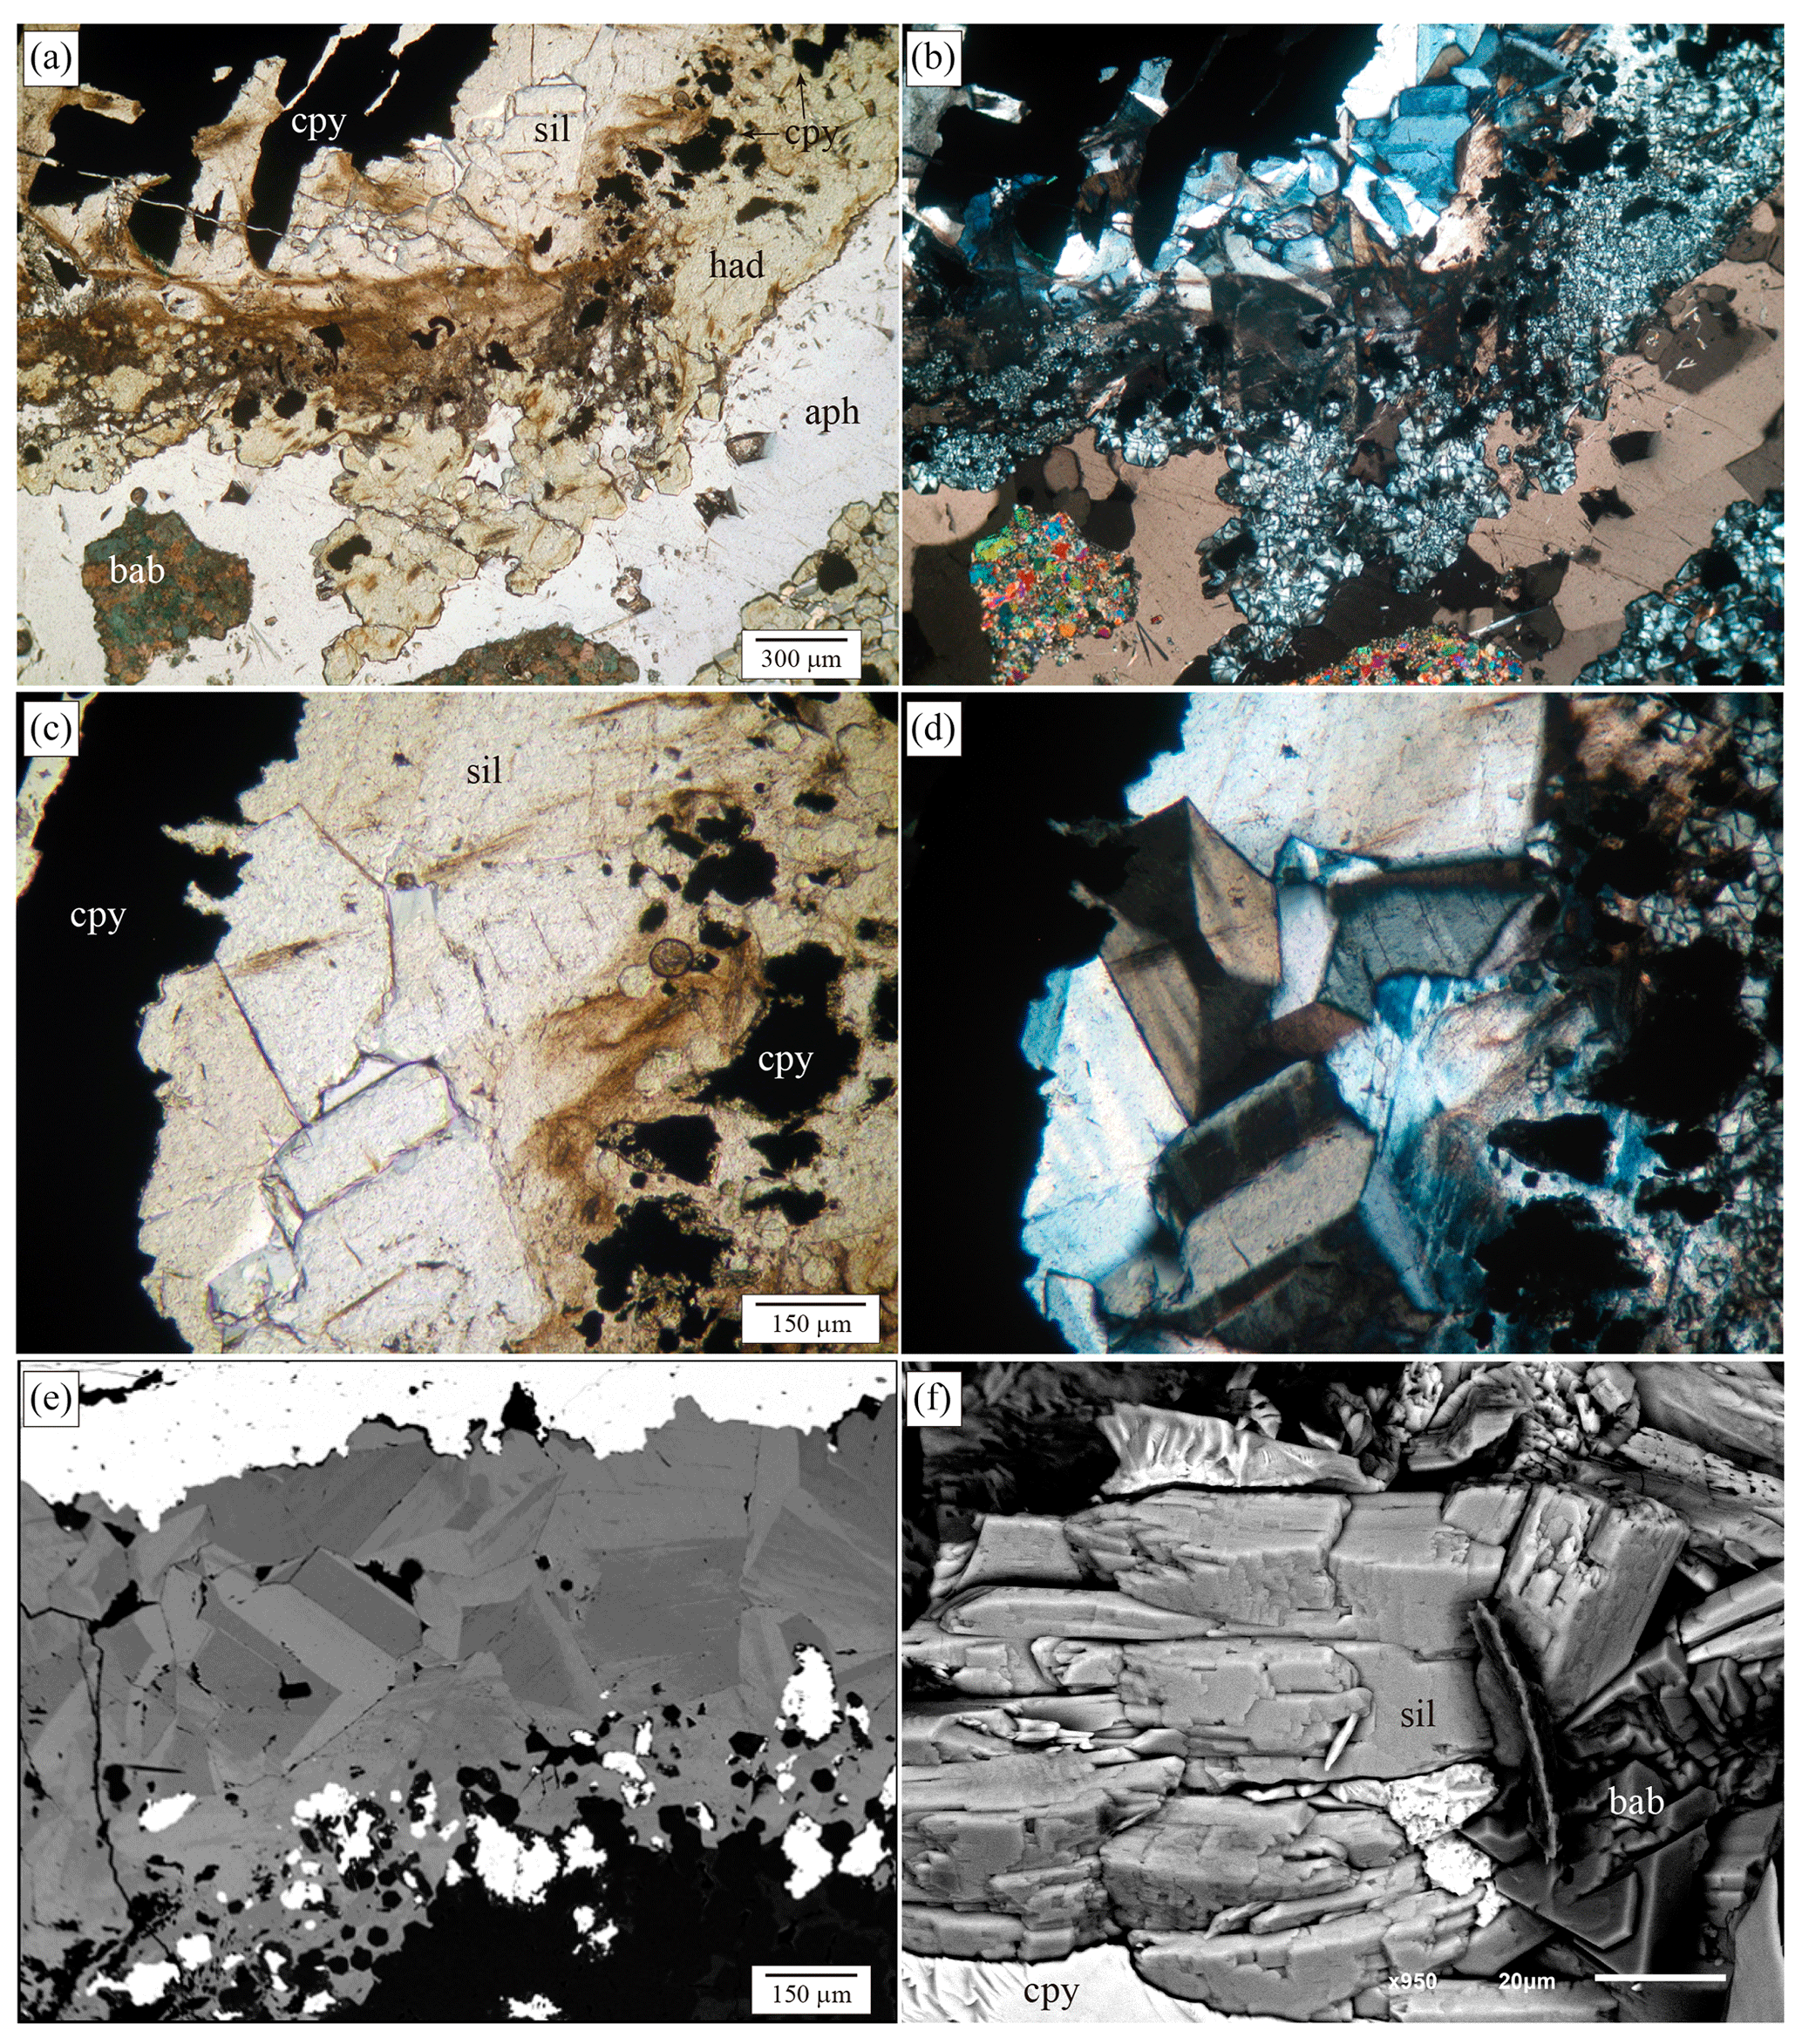
Figure 2(a) Microphotography showing the silesiaite (sil) and hydroandradite (had) crystal aggregates surrounding and replacing chalcopyrite (cpy). Apophyllite-(KOH) and babingtonite (bab) appear to be filling the cavity under plain polarized light. (b) The same image under polarized and analysed light. The mineral has anomalous ink blue and leather brown interference colours. (c) Detail of the silesiaite aggregates in which a weak pleochroism from uncoloured to yellowish is observed. (d) The same image under polarized and analysed light. One of the sections has an hourglass zoning and something resembling polysynthetic twins with thin plates. (e) Backscattered electron image that shows the compositional zoning mimicking the optical zoning. Light grey areas are rich in Sn, and dark grey areas are rich in Fe. (f) Secondary electron image of a tiny fragment of the sample. It shows an aggregate of some silesiaite crystals with a tabular habit and an imperfect cleavage of the crystals.
Silesiaite was found in the distal skarn close to the marble front, where centimetre-scale babingtonite crystals developed in a retroskarn cavity along with hydroandradite, apophyllite-(KOH), fibrous actinolite, quartz, calcite and sulfides, mainly chalcopyrite (Fig. 2). Silesiaite occurs as subhedral crystals of less than 0.5 mm, forming aggregates at the contact with chalcopyrite crystals. The mutual contact between both minerals is irregular, indicating that chalcopyrite was corroded by the silicate minerals that form a surrounded band of replacement. The EMPA analyses carried out on chalcopyrite show up to 0.25 wt. % of Sn as impurity (range of values between 0.01 wt. % and 0.25 wt. % of Sn, with a limit of detection of 0.003 wt. %) that was released during the chalcopyrite replacement, allowing the formation of silesiaite just at the contact with the sulfide. Further from the contact, hydroandradite developed as aggregates of fine-grained euhedral crystals which show a zonation with a core and a narrow rim (Fig. 2a). The EMPA analyses in garnet crystals show rims richer in Fe than the cores are and Sn contents up to 3.0 wt. % SnO2 (Cepedal et al., 2003). The central part of the cavity is filled by apophyllite-(KOH), quartz, calcite and babingtonite that can form crystals on the scale of centimetres.
In optical microscopy, under plane polarized light, the silesiaite crystals are uncoloured to yellowish, showing a distinctive pleochroism (Fig. 2c). They have high relief, and the Becke line test indicates that the mineral grains have a lower refractive index than the hydroandradite does (refractive index, n, of andradite is 1.887) and higher than that of the Canada balsam (n=1.55). Some crystals exhibit traces of spaced cleavage planes as parallel thin black lines (Fig. 2c). Under polarized and analysed light, the crystals show optical zoning and twinning. One of the sections shows an hourglass zoning, whilst other sections show less defined sector zoning. In addition to this, most of the crystals show a kind of polysynthetic twinning with thin plates. The birefringence is low, but instead of the grey to white colours in the first order of the interference colour spectrum, leather brown and ink blue to grey-blue colours are observed. This behaviour indicates a high dispersion of birefringence (Fig. 2d).
The backscattered electron images show the crystals are chemically inhomogeneous and the chemical zoning reproduces the optical one (Fig. 2e). The chemical composition of the section with hourglass zoning mimics this optical zoning with dark and light grey areas. The qualitative analyses by EDAX showed that light grey areas are richer in Sn and poorer in Fe, whilst dark grey areas are richer in Fe and poorer in Sn. From now on, we will refer to light and dark grey areas as Sn-rich and Fe-rich areas, respectively. In addition, a fine oscillatory zoning occurs in the areas of the crystals where polysynthetic twins occur. This zonation also consists of Sn-rich and Fe-rich zones richer or less rich in Sn. The BSE images were used to select the points of analyses in the electronic microprobe.
4.1 EMPA analyses
Several EMPA analyses were carried out in Sn-rich and Fe-rich areas. These analyses are reproduced in Table S1 and are available in the Supplement. An average of the results is shown in Table 1, where all the iron is considered as ferric. Other elements analysed were K (limit of detection, LOD = 325 ppm), Na (LOD = 660 ppm), Sc (LOD = 540 ppm), Zr (LOD = 514 ppm), Nb (LOD = 380 ppm) and Zn (LOD = 194 ppm), but all were always below their respective detection limits. All the analyses were below 100 wt. % due to the presence of (OH)− groups in the structure. The structural formula was obtained based on 13.5 anhydrous oxygen atoms and 8 cations, in accordance with the kristiansenite (the Sc-analogue) crystal structure data of Ferraris et al. (2001).
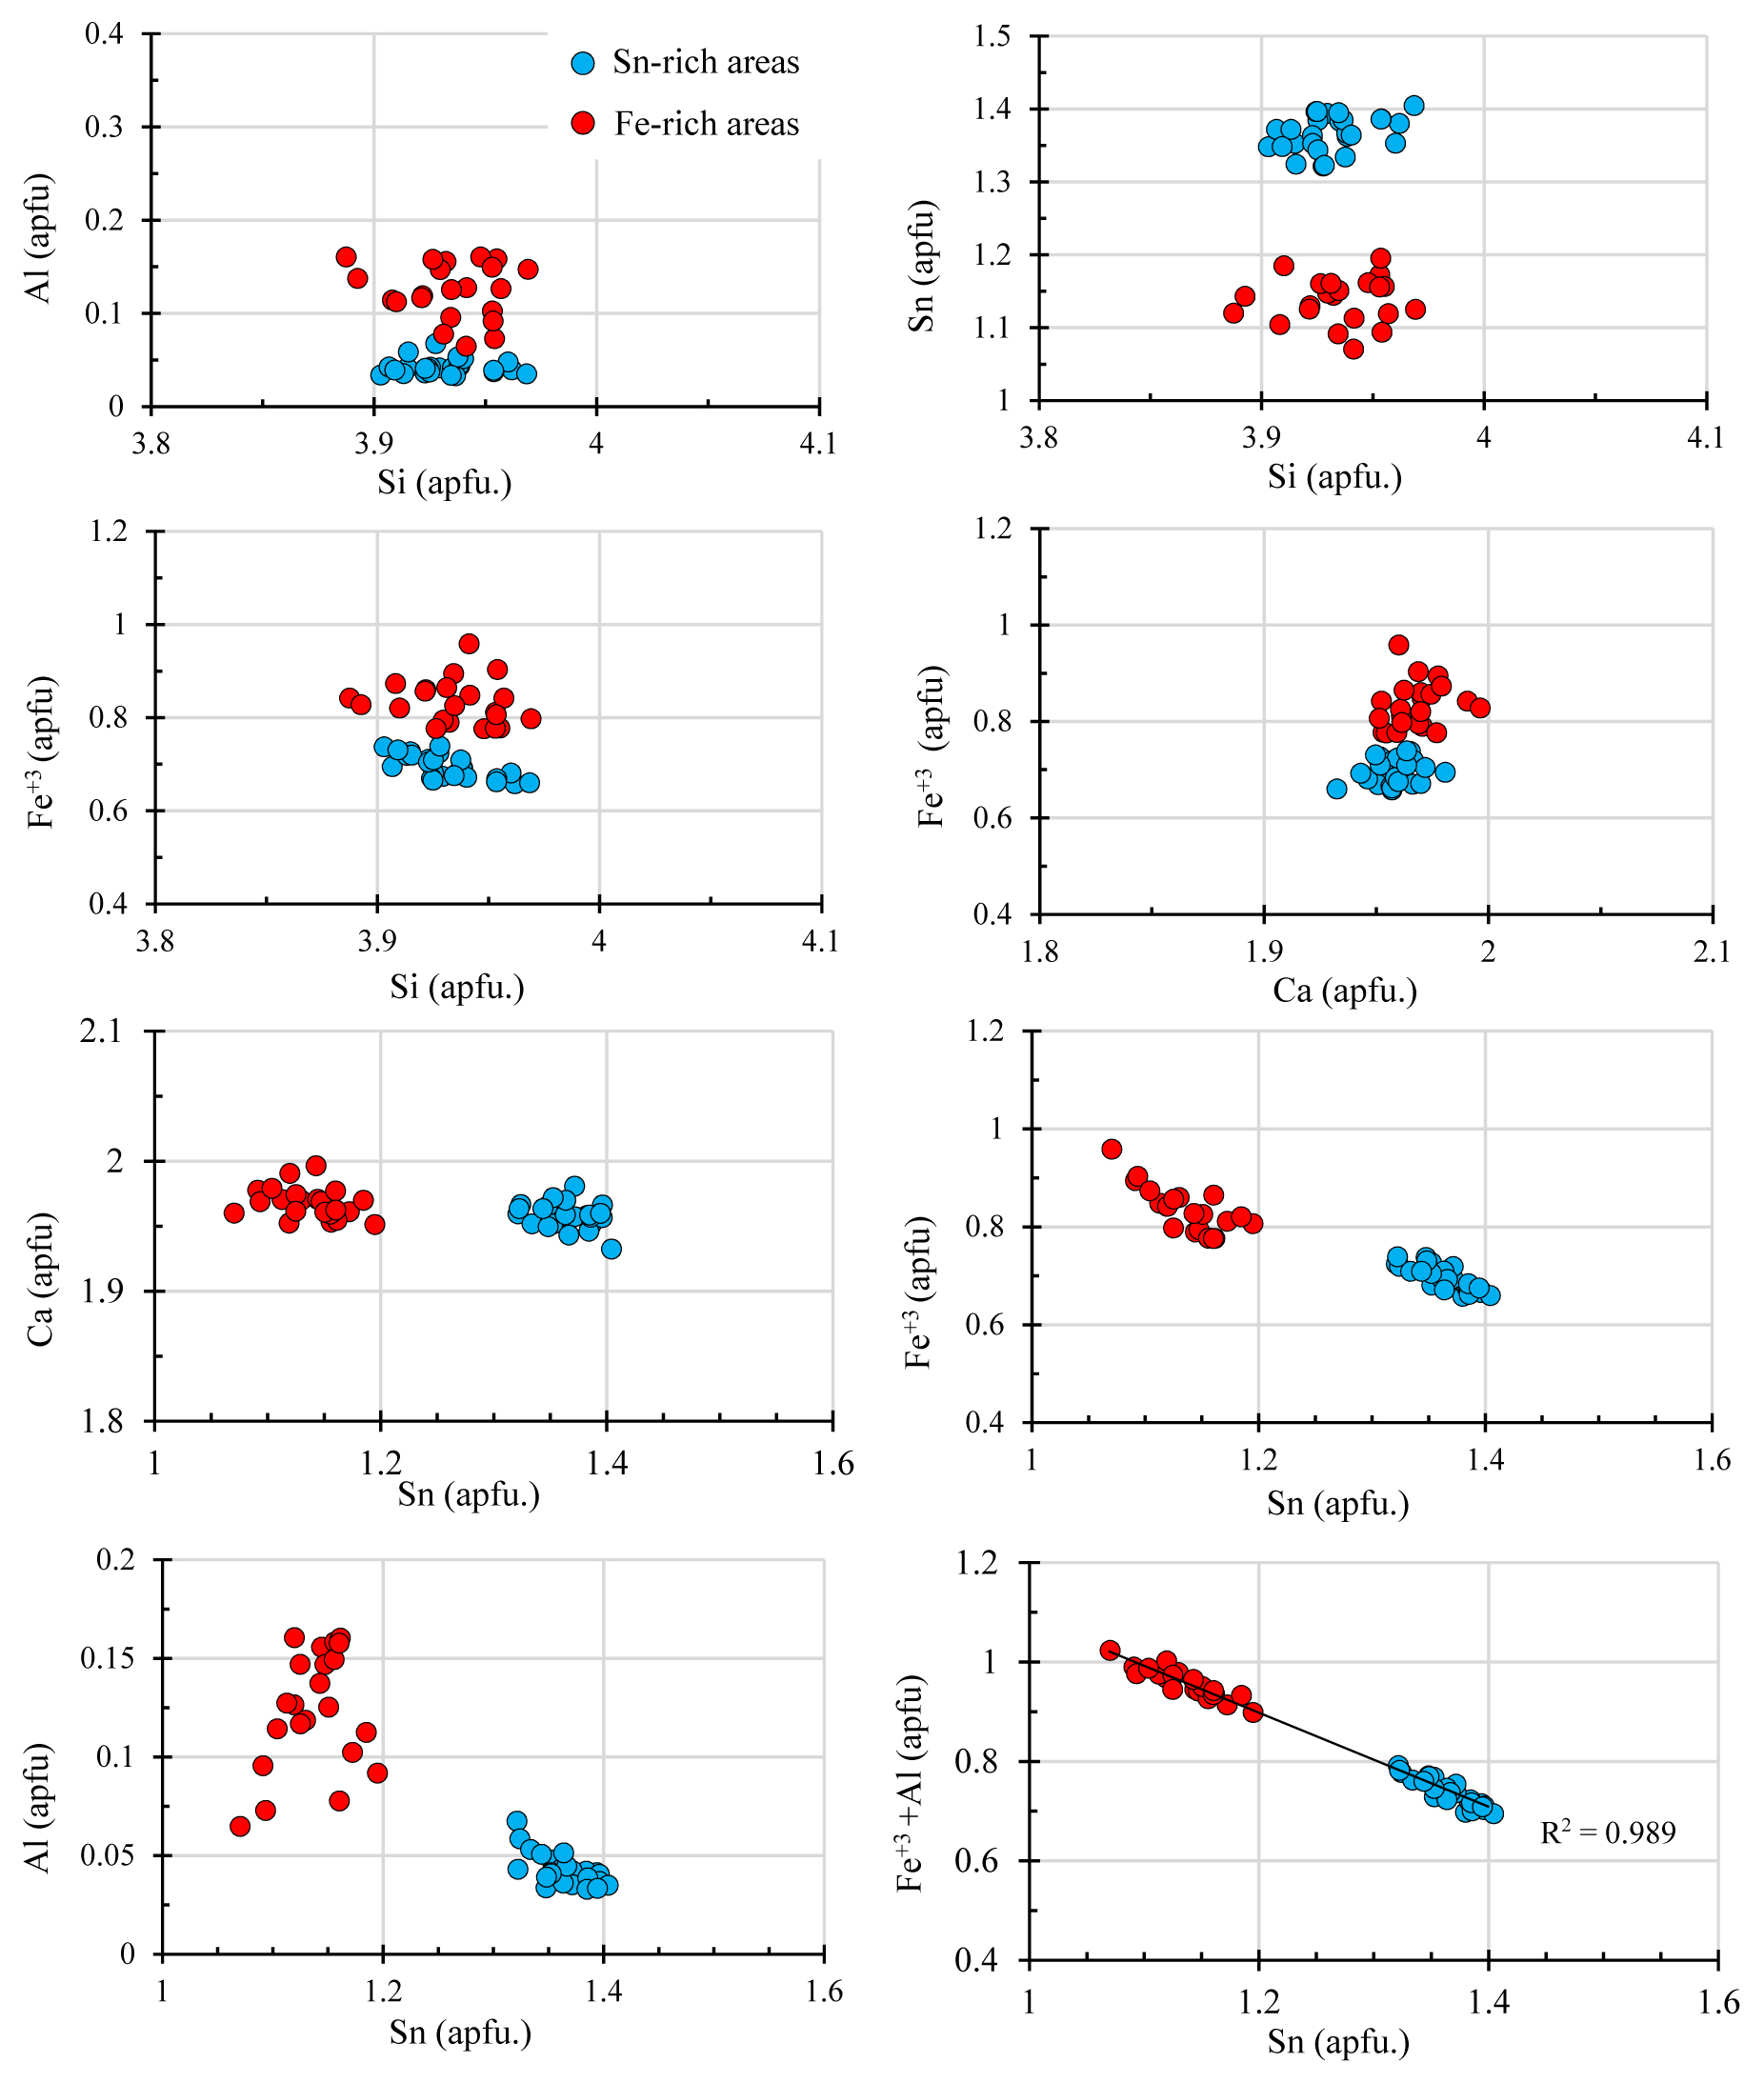
Figure 3Binary diagrams showing the correlation between elements (in atoms per formula unit, apfu) from silesiaite electron microprobe analyses.
Microprobe analyses confirm that the dark grey areas have a lower amount of Sn (average of 28.24 wt. % SnO2) than light grey areas (average of 33.10 wt. % SnO2) (Table 1). Iron is the main substitute for Sn (Fig. 3), almost reaching 1 apfu (atoms per formula unit) in some analyses. In the Fe-rich areas there are also higher amounts of Al and Ti and lower amounts of Mn (Table 1). In the case of Al, all the analyses were above the limit of detection (LOD = 250 ppm), and the range of values is from 1.35 to 0.55 wt. % Al2O3. Only in six analyses was Ti detected (LOD = 240 ppm) with a range from 690 to 1010 ppm TiO2. In the case of Mn, it was only detected in four analyses (from 345 to 390 ppm MnO). In the Sn-rich areas, the analyses showed higher amounts of Mn, which was detected in 17 analyses with a range from 364 to 694 ppm MnO. Titanium was always below its LOD. Aluminium was always detected with a range of values from 0.56 wt. % to 0.27 wt. % Al2O3, lower than in the Fe-rich areas.
In Fig. 3, the atomic contents from the calculated formula are plotted in binary diagrams, in which the chemical differences between Sn-rich and Fe-rich areas are graphically shown. The atomic contents of Si and Ca have almost the same range of values in both areas, and no correlation between Al and Si (apfu) has been observed. However, a slight negative correlation between Fe+3 and Si (apfu) is observed in the Sn-rich areas. This could indicate that a slight substitution of Si by Fe+3 exists in the tetrahedral positions. In the binary diagram of Al (apfu) vs. Sn (apfu), the higher amounts of Al in the Fe-rich areas becomes more evident, in which Al is positively correlated with Sn. However, no correlation has been observed in the Sn-rich areas. On the contrary, there is a strong inverse correlation between Fe+3 and Sn+4 (apfu) in both areas. This negative correlation is greater in the binary diagram of (apfu) vs. Sn (apfu) (Fig. 3), indicating that the substitution of Fe+3 and Al by Sn+4 is most likely. As no univalent cations such as Na+ or K+ are present, charge balance is assumed to have been achieved due to the presence of Fe+2 instead of Fe+3.
Table 1Electron microprobe analyses of silesiaite (number of analyses in brackets).

– Below the detection limit. a Total iron as ferric. b Calculated based on 13.5 O. c Calculated by charge balance.

Figure 4Binary diagrams showing the correlation between elements in atoms per formula unit (apfu) from silesiaite electron microprobe analyses considering Fe+3 and Fe+2.
We performed a tentative discrimination between divalent and trivalent iron with the aid of the stoichiometry of the mineral formula and charge-balance considerations, in accordance with Droop (1987). The results are presented in Table 1 and Fig. 4. Ferric iron remains the main cation in the Fe-rich areas, where the Fe+2 proportion reaches an average of only 0.1 apfu. In the Sn-rich areas, however, the proportions of Fe+2 and Fe+3 are quite similar (Table 1). In both areas, Sn correlated positively with Fe+2 and negatively with Fe+3 (Fig. 4). This could suggest a coupled substitution of the following type:
In the diagram of Fig. 4 we include Ti+4 and the other divalent cations present, Mg+2 and Mn+2. The correlation is slightly improved (R2∼1).
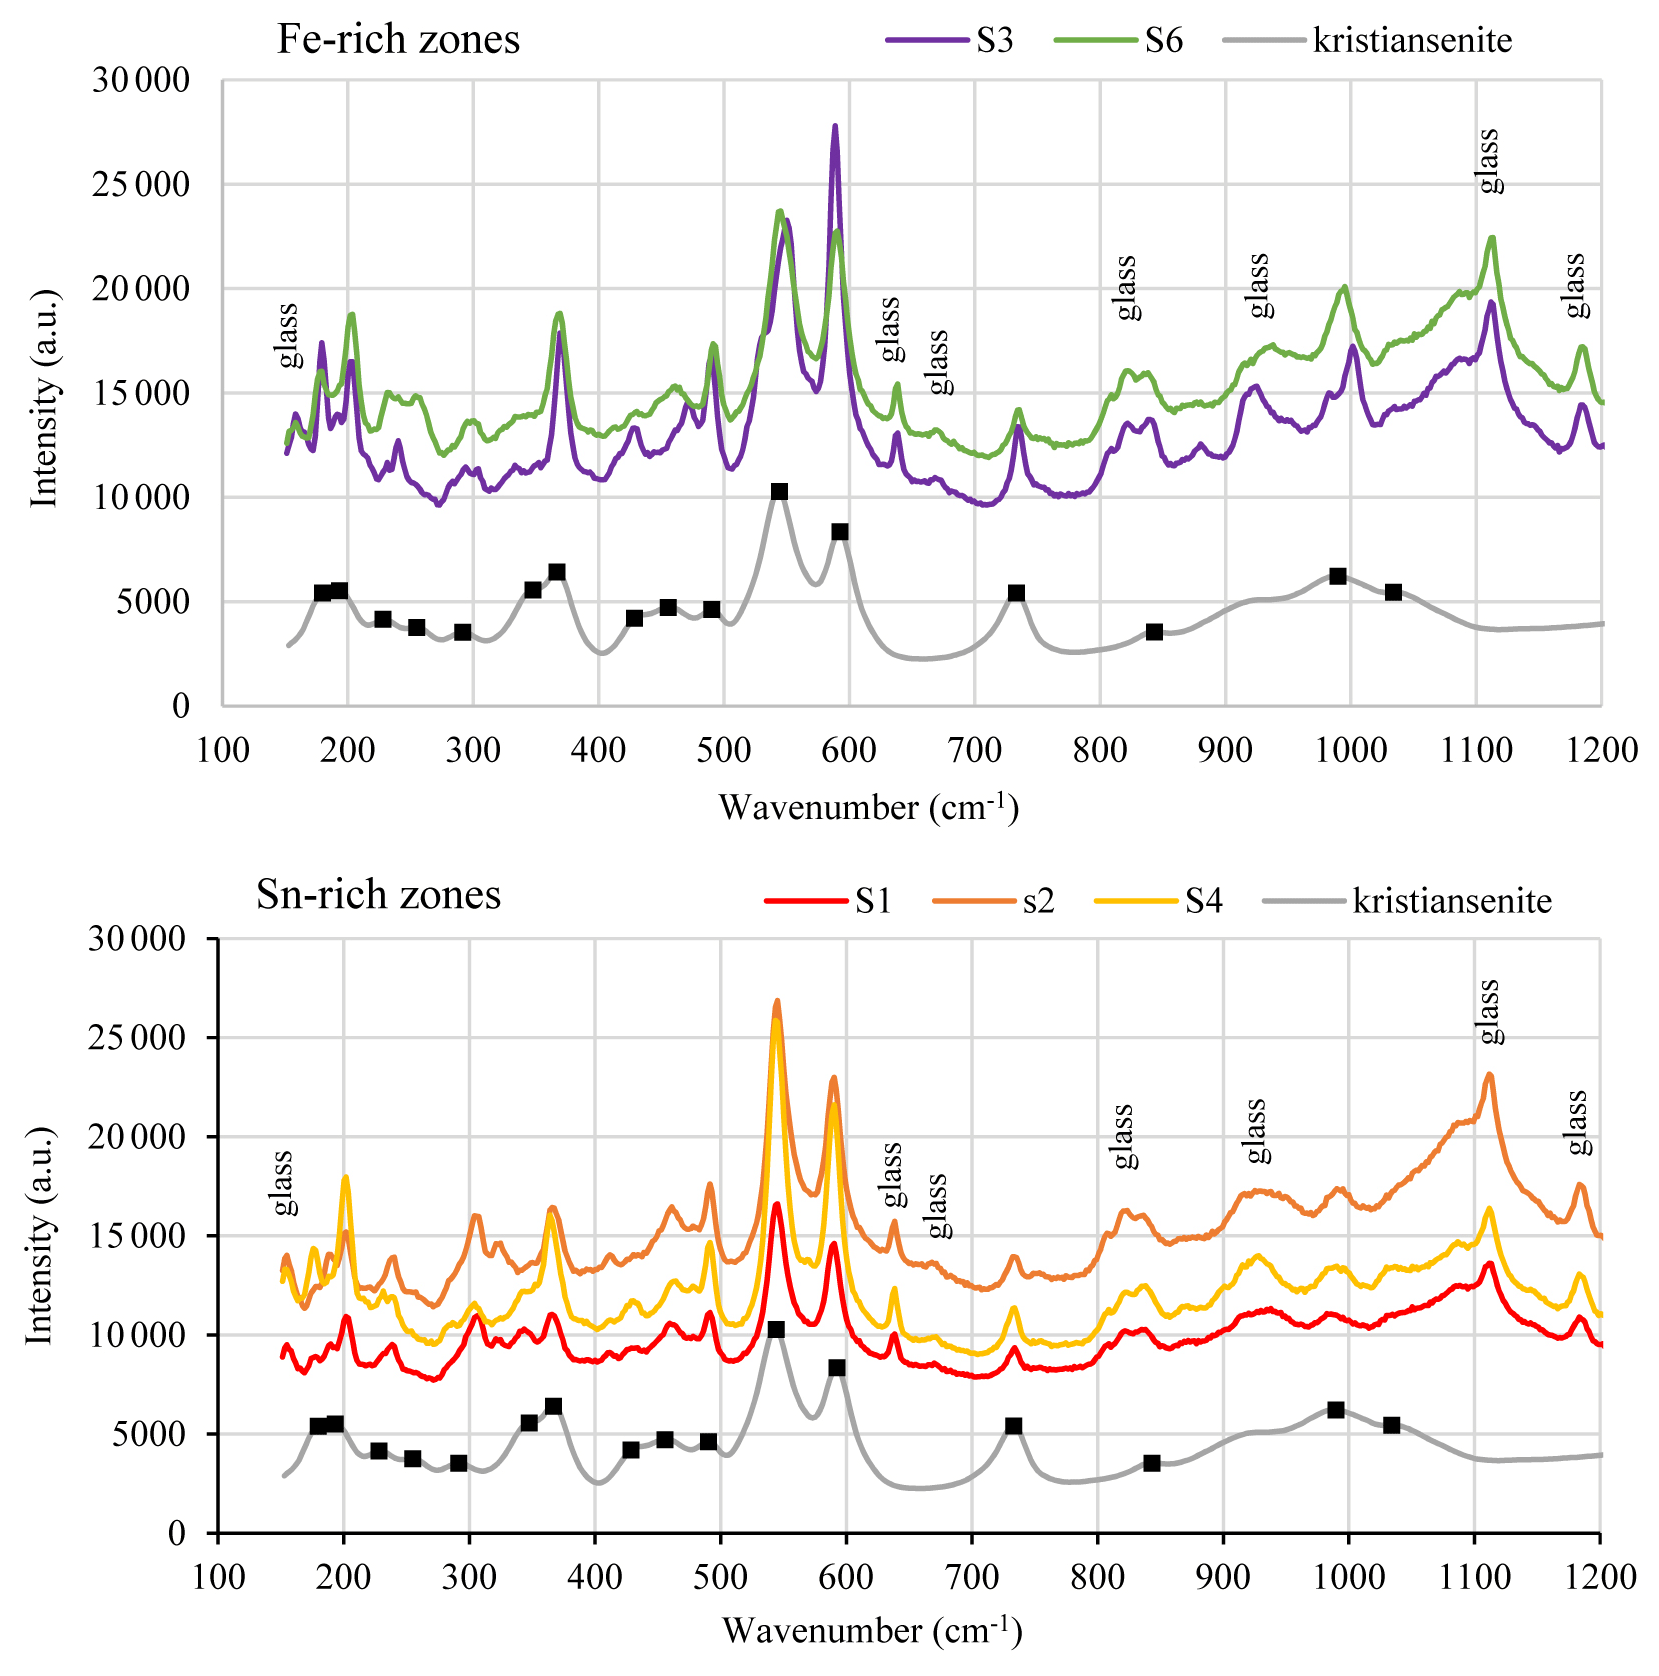
Figure 5Raman spectra from Fe-rich and Sn-rich areas of silesiaite crystals. Raman spectrum of kristiansenite is also shown (Ruff ID = R090022). Glass signifies intensities corresponding to glass slide.
4.2 Raman spectrum
Several Raman spectra were obtained from Sn-rich and Fe-rich areas of the silesiaite crystals. A selection of these spectra is shown in Fig. 5, in which the Raman spectra of kristiansenite (Ruff ID = R090022) is also shown in order to compare them. The raw data of Raman spectra are included as supplementary files (Table S2). Similarly to the Raman spectra of kristiansenite, all the spectra are characterized by two sharp bands at around 544 and 592 cm−1 and another sharp band at around 735 cm−1. The spectra also reproduce the broader, less intense Raman peaks at around 843, 989 and 1034 cm−1, the first one masked by the signal of the glass slide. In relation to the peak at around 989 cm−1, there are subtle differences between the spectra of silesiaite: whereas the Raman spectra from Sn-rich areas show rounded and less intense peaks, those from Fe-rich areas show sharper peaks (Fig. 5). The lowest wavenumber region (from 100 to 500 cm−1) is quite complex. The spectra from silesiaite are, in general, similar to those of kristiansenite, although some peaks are sharper (e.g. peaks at around 366 and 490 cm−1) and/or are slightly shifted to a higher wavenumber (e.g. peaks at around 291 and 193 cm−1).
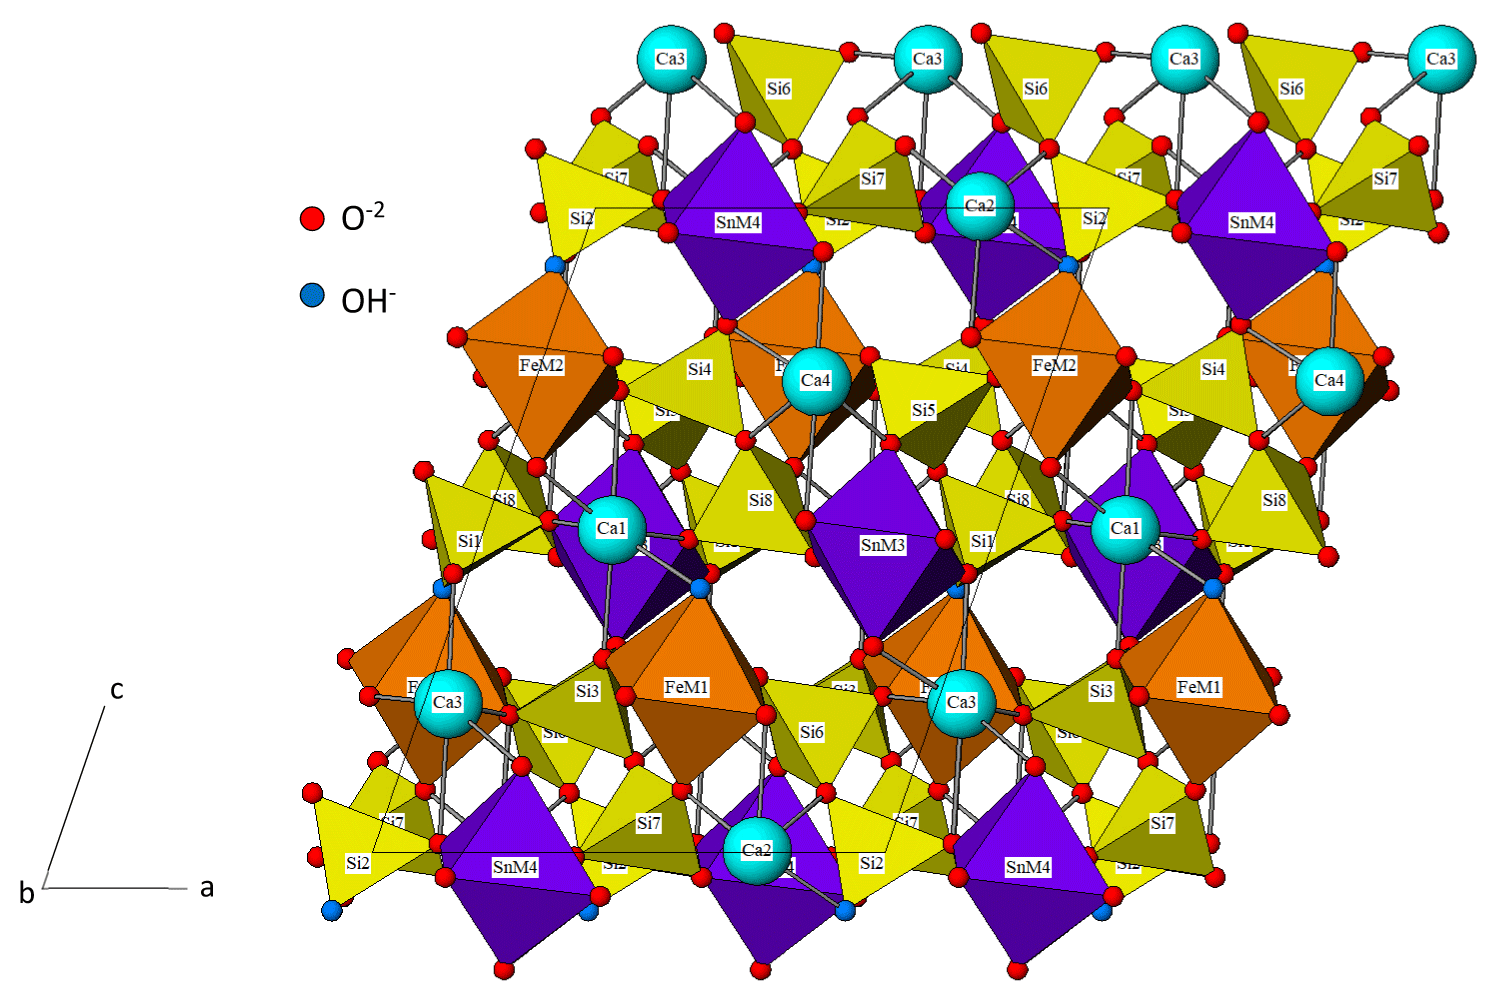
Figure 6Structure of silesiaite based on the structure of kristiansenite (Ferraris et al., 2001; Evans et al., 2018).
The specific structure of silesiaite has not been published yet, and the crystals occurring in El Valle-Boinás are too small to be isolated for X-ray diffraction. However, taking into account the fact that silesiaite is considered the Fe3+ analogue of kristiansenite (Pieczka et al., 2017), we can use the structure of the latter mineral as refined by Ferraris et al. (2001) and modified by Evans et al. (2018). According to these authors, the structure contains Si2O7 double tetrahedra (sorosilicate or disilicate groups), and half of the disilicate groups carry a hydrogen atom, representing a new type of silicate structure with protonated Si2O6OH and normal disilicate groups (Ferraris et al., 2001). The rest of the cations are in isolated polyhedra of 6-coordinated Sn, Sc and Fe and (7+2)-coordinated Ca cations. There are four octahedral positions, labelled M1, M2, M3 and M4, which are isolated from each other and alternate with the disilicate groups along the plane (Fig. 6). Calcium and silicon positions are completely occupied by these cations in the structure of kristiansenite (Evans et al., 2018), whereas the octahedral positions have very diversified occupants, the dominant ones being tetravalent (Sn, Ti, Zr)+4 and trivalent cations (Sc, Fe, Al)+3, and they also have trace amounts of divalent (Mn+2) and pentavalent (Nb, Ta+5) cations. According to Evans et al. (2018) in the studied kristiansenite from Szklarska Porȩba, the M1 and M2 sites are mainly occupied by Sc, and the M3 and M4 sites are chiefly occupied by Sn. The distribution of cations among the sites is highly disordered, with a notable dominant preference of Sn–Sc disorder at the M3 and M4 sites and Sc-X disorder at the M2 and M1 sites. In silesiaite, the latter octahedral sites will be primarily occupied by Fe, in substitution of Sc, so M2 and M1 are labelled as Fe in Fig. 6.
The possible existence of a cleavage in kristiansenite was already pointed out by Raade et al. (2002) as an explanation of an enhancement of the (004) reflection in the diffraction patterns. According to these authors, this could be due to some degree of preferred orientation resulting from a {001} cleavage, which is reasonable to assume because this cleavage plane exactly intersects the hydrogen bonds and cuts only a small number of the cation-oxygen coordination bonds (Raade et al., 2002) (Fig. 6).
The electron microprobe analyses of the silesiaite Ca2Fe+3Sn(Si2O7)(Si2O6OH) crystals from El Valle-Boinás calcic skarn show that the mineral is strongly zoned in terms of iron abundance with zones where iron reaches 1 apfu and zones where Sn is the dominant cation (Table 1). The mineral formula can be written as Ca2(FeSnx)Sn(Si2O7)(Si2O6OH), where x is between 0 and 0.4. The Sn content of silesiaite is higher than that of kristiansenite, its Sc analogue (Ca2ScSn(Si2O7)(Si2O6OH)) with mean values of between 0.97 Sn apfu (Evans et al., 2018) and 1.06 Sn apfu (Raade et al., 2002). These authors show Sc contents for kristiansenite of around 0.7 apfu, the other cations in the structure being Fe, Mn, Ti and Al, among others. In the silesiaite from El Valle-Boinás, Al was the main trace element detected with values of up to 1.4 wt. % Al2O3 (Table 1) and being more abundant in the Fe-rich zones. Other cations detected in lesser proportions were Mn and Ti, in addition to Cu in the proximity of chalcopyrite. The Sc content was always below the detection limit, which could indicate that there is no solid solution between silesiaite and kristiansenite or simply due to the different growth environment of silesiaite in this work (calcic skarn instead of pegmatite). Similarly, neither Zr nor Nb or Ta were detected, which is probably due to the same reason.
A substitution between Fe+3 and Sn has been observed in Sn-bearing silicates as in epidote, clinozoisite or andradite (Mulligan and Jambor, 1968; Van Marcke de Lumen, 1986; Ordosch et al., 2019). The first authors describe an unusually high Fe+2 content (1.5 wt % FeO) in their tin-bearing epidote. In the case of allanite, the substitution of Fe+3 and Al+3 by Fe+2 is used to correct the charge imbalance arising from the replacement of Ca+2 by trivalent rare-earth elements (Deer et al., 1962). As no univalent cations such as Na+ or K+ are present in the silesiaite, charge balance is assumed to have been achieved by the presence of Fe+2 instead of Fe+3, as was previously mentioned. The calculated Fe+2 and Fe+3 cationic proportion (by stoichiometry based on Droop, 1987) indicates higher Fe+2 content (up to 0.4 apfu) in Sn-rich areas than in Fe-rich areas where the ferric cation is dominant (up to ∼1 apfu, Table 1) and a coupled substitution of
so the mineral formula can be written as , where x is between 0 and 0.4. The substitution of the larger cations Sn+4 (r=0.77 Å) and Fe+2 (r=0.73 Å) for Fe+3 (r=0.64 Å) and Al+3 (r=0.61 Å) produces the variation in the lattice constants which could be the factor responsible for the optical zonation observed (Fig. 2).
Chemical zonation in kristiansenite has been mentioned by Raade et al. (2002) who reported backscattered electron images with irregular or oscillatory zoning, with light areas richest in Sn and dark areas richest in Sc, although sector zoning had not been mentioned until now. The sector and hourglass zoning observed in the silesiaite crystals from El Valle-Boinás may have a similar origin to that of titanaugite (Downty, 1976), e.g., due to a preferred enrichment in Sn+4, Fe+2, Fe+3 and Al+3 in faces belonging to different prismatic forms as a result of a metastable growth process during the replacement of chalcopyrite, favoured by the supply of Sn and reduced conditions. However, this point needs to be studied in more detail.
The presence of silesiaite in the calcic Cu–Au skarn of El Valle-Boinás, which is the second known occurrence of this mineral in the world, confirms the existence of this Fe+3 analogue of kristiansenite (Ca2ScSn(Si2O7)(Si2O6OH)). The mineral occurs as aggregates of small crystals (<500 µm) but of sufficient size to allow for their study under optical microscopy and to carry out electron microprobe analyses. However, its size and quantity have not allowed us to perform X-ray diffraction studies. This work presents the first optical and electronic images of silesiaite in the world, in addition to the first electron microprobe analyses. These chemical analyses indicate that silesiaite from El Valle-Boinás has a higher amount of Sn than kristiansenite and does not contain Sc. Moreover, the crystals show a strong zonation both optically and chemically with Sn-rich and Fe-rich zones. The calculated structural formula of the mineral, and the Fe+3 and Fe+2 proportion determined by stoichiometry, suggests a couple substitution of . We propose that the formula of the silesiaite can be written as , where x is between 0 and 0.4.
Raman and EMPA data are available in the Supplement.
The supplement related to this article is available online at: https://doi.org/10.5194/ejm-33-165-2021-supplement.
AC was responsible for conceptualization, methodology and data curation. AC and MFF made the validation of the research. AC prepared the manuscript with contributions from all co-authors. MFF managed and had the coordination responsibility for the research activity planning and execution. AC, MFF and AMI acquired the financial support for the project leading to this publication.
The authors declare that they have no conflict of interest.
We thank the reviewers and the associate editor for their suggestions, which have improved significantly the content and clarity of the paper.
This research has been supported by the Ministerio de Economía, Industria y Competitividad, Gobierno de España (grant no. CGL2016-76532R).
This paper was edited by Sergey Krivovichev and reviewed by two anonymous referees.
Cepedal, A., Martin-Izard, A., Reguilón, R., Rodríguez-Pevida, L., Spiering, E., and González-Nistal, S.: Origin and evolution of the calcic and magnesian skarns hosting the El Valle-Boinás copper–gold deposit, Asturias (Spain), J. Geochem. Explor., 71, 119–151, https://doi.org/10.1016/S0375-6742(00)00149-7, 2000.
Cepedal, A., Moreiras, D., Martin-Izard, A., González-Nistal, S., and Rodríguez-Pevida, L.: The occurrence and origin of babingtonite in the El Valle-Boinás Cu-Au deposit in Asturias, Spain, Eur. J. Mineral., 15, 1069–1077, https://doi.org/10.1127/0935-1221/2003/0015-1069, 2003.
Cepedal, A., Fuertes-Fuente, M., Martin-Izard, A., Gonzalez Nistal, S., and Rodríguez Pevida, L.: Tellurides, selenides and Bi-mineral assemblages from the Río Narcea Gold Belt, Asturias, Spain: genetic implication in Cu–Au and Au skarns, Mineral. Petrol., 87, 277–304, https://doi.org/10.1007/s00710-006-0127-7, 2006.
Cepedal, A., Fuertes-Fuente, M., Martin-Izard, A., González Nistal, S., and Barrero, M.: Gold-bearing As-rich pyrite and arsenopyrite from the El Valle gold deposit, Asturias, northwestern Spain, Can. Mineral., 46, 233–247, https://doi.org/10.3749/canmin.46.1.233, 2008.
Deer, W. A., Howie, R. A., and Zussman, J.: Rock-Forming Minerals. I. Ortho- and Ring silicates, Longman, London, 1962.
Downty, E.: Crystal structure and crystal growth: II. Sector zoning in minerals, Am. Mineral., 61, 460–469, 1976.
Droop, G. T. R.: A general equation for estimating Fe3+ in ferromagnesian silicates and oxides from microprobe analysis, using stoichiometric criteria, Mineral. Mag., 51, 431–437, https://doi.org/10.1180/minmag.1987.051.361.10, 1987.
Evans, R. J., Gołębiowska, B., Groat, L. A., and Pieczka, A.: Crystal Structure of Kristiansenite from Szklarska Poręba, Southwestern Poland, Minerals, 8, 584, https://doi.org/10.3390/min8120584, 2018.
Ferraris, G., Gula, A., Ivaldi, G., Nespolo, M., and Raade, G.: Crystal structure of kristiansenite: a case of class IIB twinning by metric merohedry, Z. Kristallogr., 216, 442–448, https://doi.org/10.1524/zkri.216.8.442.20353, 2001.
Martin-Izard, A., Fuertes-Fuente, M., Cepedal, A., Moreiras, D., García-Nieto, J., Maldonado, C., and Pevida, L. R.: The Río Narcea Gold Belt intrusions: geology, petrology, geochemistry and timing, J. Geochem. Explor., 71, 103–117, https://doi.org/10.1016/S0375-6742(00)00148-5, 2000.
Mulligan, R. and Jambor, J. L.: Tin-bearing silicates from skarn in the Cassiar District, northern British Columbia, Can. Mineral., 9, 358–703, 1968.
Ordosch, A., Raith, J. G., Schmidt, S., and Aupers, K.: Polyphase scheelite and stanniferous silicates in a W-(Sn) skarn close to Felbertal tungsten mine, Eastern Alps, Mineral. Petrol., 113, 703–725, https://doi.org/10.1007/s00710-019-00675-x, 2019.
Pieczka, A., Ma, C., Rossman, G. R., Evans, R. J., Groat, L. A., and Gołębiowska, B.: Silesiaite, IMA 2017-064. CNMNC Newsletter No. 40, December 2017, Mineral. Mag., 81, 1577–1581, 2017.
Raade, G., Ferraris, G., Gula, A., Ivaldi, G., and Bernhard, F.: Kristiansenite, a new calcium-scandium-tin sorosilicate from granite pegmatite in Tørdal, Telemark, Norway, Mineral. Petrol., 75, 89–99, https://doi.org/10.1007/s007100200017, 2002.
Van Marcke de Lumen, G.: Tin-Bearing Epidote from Skarn in the Land's End Aureole, Cornwall England, Can. Mineral., 24, 411–415, 1986.