the Creative Commons Attribution 4.0 License.
the Creative Commons Attribution 4.0 License.
 | 13 Nov 2020
Investigating crystal orientation patterns of foraminiferal tests by electron backscatter diffraction analysis
Stephanie Pabich
Christian Vollmer
Nikolaus Gussone
We studied the crystallographic orientation of calcite crystals in benthic foraminifers by electron backscatter diffraction (EBSD). Individuals of two species, Gyroidinoides soldanii and Cibicidoides grimsdalei, featuring different test structures, were investigated for a time span covering 43 Myr. The aims of this study are to visualize test structure differences in foraminifers and to reveal potential changes in crystal orientation and grain size over time caused by diagenetic reactions such as recrystallization. Such recrystallization effects over time may aid in the interpretation of time-resolved geochemical data obtained on foraminiferal samples for paleo-environmental reconstructions. The EBSD patterns clearly resolve the different test structures of the two species. Cibicidoides grimsdalei has the c axes perpendicular to the test surface. An apparent shift in the preferred crystal orientation can most likely be attributed to a mismatch between the equatorial plane and cutting plane of the foraminiferal test, highlighting the importance of reproducible preparation techniques. In Gyroidinoides soldanii, the c axes of the calcite crystals show a broader distribution of the crystals with no preferred orientation. The specimens show no change in crystal sizes over time, with a frequency maximum corresponding to the spot size of the electron beam. Overall, the differences between the two species demonstrate that EBSD is a powerful tool to visualize and differentiate between foraminiferal test structures.
- Article
(10986 KB) - Full-text XML
- BibTeX
- EndNote


Foraminifers belong to the most frequently applied paleo-environmental archives (e.g. Katz et al., 2010). Consequently, understanding their biomineralization and associated trace-element and isotope incorporation, as well as the recognition of possible post-depositional alteration of these proxy signals by diagenetic effects, is of vital interest (e.g. Gussone et al., 2009).
Foraminifers are single-celled marine organisms with a protective shell called test, which consists of one or more chambers that are subsequently added during growth (Hausmann et al., 2003; Pawlowski et al., 2003; Holbourn et al., 2013). The characteristics of the tests are the basis for the classification of foraminifera. The typical size of foraminiferal tests ranges from 50 to 500 µm, but exceptionally large specimens can grow up to ∼ 20 cm (Röttger and Lehmann, 2009). More than 50 000 species have been described in marine sediments, ∼ 40 000 fossil and ∼ 10 000 recent (Adl et al., 2007; Pawlowski et al., 2014). About 30 of the recent species have a planktic habitat, floating in the water column, while the majority of foraminifer species have a benthic habitat (Rönnfeld, 2008), which are further divided into endobenthic and epibenthic foraminifers, living in or on the marine sediment, respectively (Sen Gupta, 1999). Besides the classification according to the preferred habitat, the taxon foraminifera is divided into three main types based on the material and structure of the test (Armstrong and Brasier, 2005). First, there are foraminifers with a secreted test wall, composed of an organic chitinous material, second, tests formed from agglutinated and cemented sedimentary particles, and third, tests composed of secreted calcareous or siliceous minerals with the calcareous types (aragonite and calcite) predominating (Armstrong and Brasier, 2005; Rönnfeld, 2008). Aragonitic foraminifers play only a subordinate role for paleo-environmental reconstructions, because aragonite-forming species are less common, and aragonite is less resistant against dissolution and recrystallization compared to calcite (Pawlowski et al., 2014; Allaby and Allaby, 2003). The calcite group is further divided with respect to chemical composition in low magnesium calcite (LMC < 4 mol % MgCO3) and high magnesium calcite tests (HMC > 4 mol % MgCO3) (Stanley et al., 2002) and with respect to test structure in micro-granular, porcelaneous imperforate, and lamellar walls. The lamellar walls can be either mono-lamellar hyaline perforate or bilamellar hyaline perforate with radial or granular (Fig. 1) optical properties (Hansen, 1999; Rönnfeld, 2008).
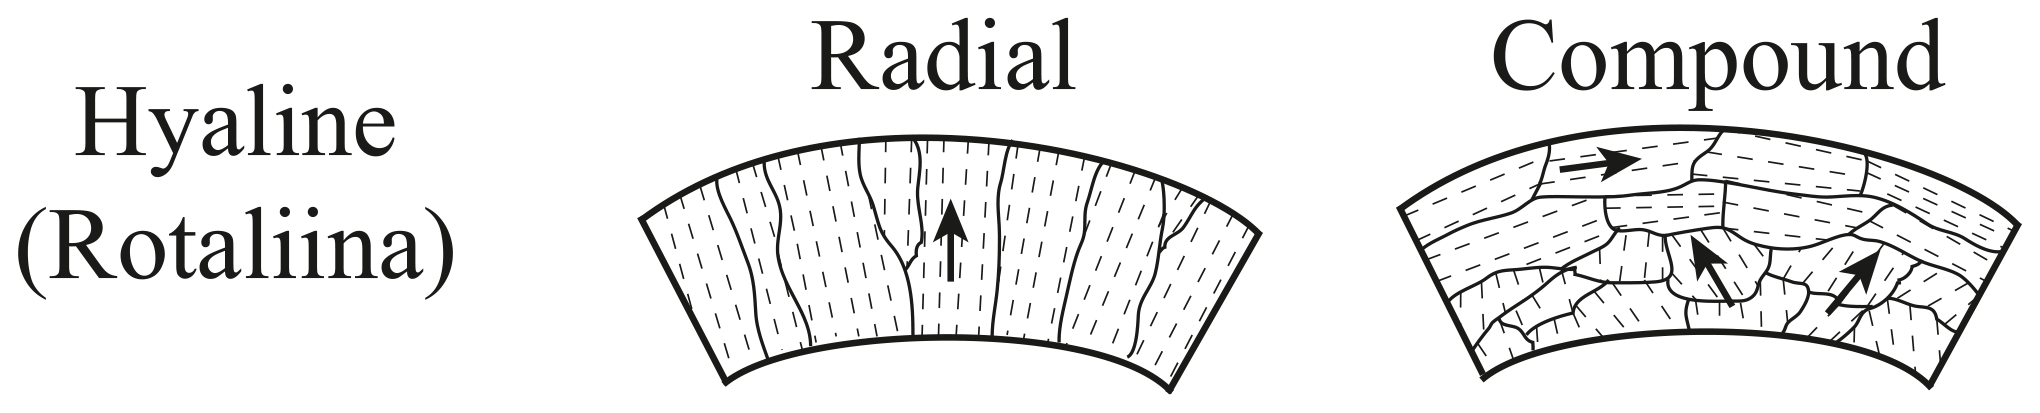
Figure 1Wall structures of polycrystalline hyaline perforate foraminifers (modified after Armstrong and Brasier, 2005).
Here, we are looking at bilamellar hyaline perforate tests with radial (Cibicidoides grimsdalei) and granular (Gyroidinoides soldanii) structures. Foraminifer tests are important biostratigraphic tools for age determination of marine sedimentary rocks and archives for paleo-environmental reconstructions. For instance, trace elements and isotope ratios incorporated in foraminifer tests serve as proxies in paleoclimatology and paleoceanography for surface and bottom water temperatures, salinity, pH values, and global oceanic element budgets (e.g. Haug and Tiedemann, 1998; Raitzsch and Hönisch, 2013; Heuser et al., 2005; Gussone et al., 2004; Coskun Tunaboylu et al., 2014). Furthermore, δ18O and Mg ∕ Ca paleothermometry of deep-sea benthic foraminifers provided evidence for a ∼ 2.5 ∘C ocean cooling associated with the ice growth during the Eocene–Oligocene transition (∼ 33–34 Ma; Lear et al., 2008). Besides empirical geochemical calibrations, understanding foraminiferal biomineralization is important to evaluate and predict the response of proxy signals to environmental changes. In particular, recent findings showed the involvement of vaterite as precursor for some planktic foraminifer species (Jacob et al., 2017). This finding is consistent with observations on the benthic foraminifer Hoeglundina elegans, suggesting vaterite as precursor for the aragonitic test (Gussone et al., 2016). Paleo-environmental archives, such as foraminifers, can be altered by diagenetic processes like partial dissolution and recrystallization, which may modify the test structure as well as the geochemical proxy signals (e.g. Elderfield et al., 2000). Consequently, besides gaining a solid understanding of biomineralization-related element and isotope partitioning in response to environmental changes, the assessment of the preservation state of used foraminifers is an important part of obtaining reliable paleoceanographic reconstructions.
Patterns of crystallographic orientations and changes of crystal sizes in foraminifer tests can provide information on preservation and possible diagenetic effects. Electron backscatter diffraction (EBSD) analysis has been proven to be a useful tool to study crystal orientation in biominerals. For instance, EBSD analyses on brachiopods showed that the calcite crystals of the fibrous shell layers have a preferred shape orientation and a preferred crystallographic lattice orientation (Schmahl et al., 2008). The crystallographic 〈001〉 axis was mainly approximately parallel to the radius of the curvature of the brachiopod shell, and the morphological fibre axis was therefore on average perpendicular to 〈001〉. For pulsed Sr-labelling experiments, Otter et al. (2019) used bivalve Katelysia rhytiphora to visualize shell growth at micro- to nanoscale. Their areas of interest were the innermost outer shell layer and the outermost outer shell layer. Using EBSD, the authors were able to reveal a strong preferred orientation of the aragonite c axis perpendicular to the growth layers while a and b axes were scattered within a plane normal to the local growth direction. They also identified > 46 % twin grain boundaries. EBSD was also used for detection of diagenetic effects in modern and fossil coralline skeletons to determine alteration to secondary cement phases (Cusack et al., 2008). The authors were able to detect calcite cement replacing aragonite in endolithic borings in the modern skeletons and whole dissepiments of the fossil skeleton, even though the calcite was not detectable in X-ray diffraction analyses. Furthermore, Jacob et al. (2019) studied the biomineral architecture of Anoteropora latirostris (Bryozoa) via EBSD and grain size analysis and showed that grain sizes, orientation, and locations differ significantly for aragonite and calcite present within the colony walls of this species. These observations demonstrate that EBSD is a powerful tool for the investigation of biomineralization as well as even very early stages of coral diagenesis with a spatial resolution at micro- to nanometre scales.
The aim of the present study was to analyse crystal orientation and crystallite sizes in foraminifer tests to investigate their preservation state and visualize possible alteration or diagenetic effects. We focused on benthic foraminifers because their relatively slow evolution and comparatively strong resistivity to dissolution and diagenesis make them particularly suited for long-term paleo-environmental reconstructions (e.g. Edgar et al., 2013; Drury et al., 2014; Voigt et al., 2016). The low-magnesium calcite-test-forming species G. soldanii and C. grimsdalei were chosen, because of their frequent occurrence in sediment cores, wide stratigraphic distribution and different test structures.
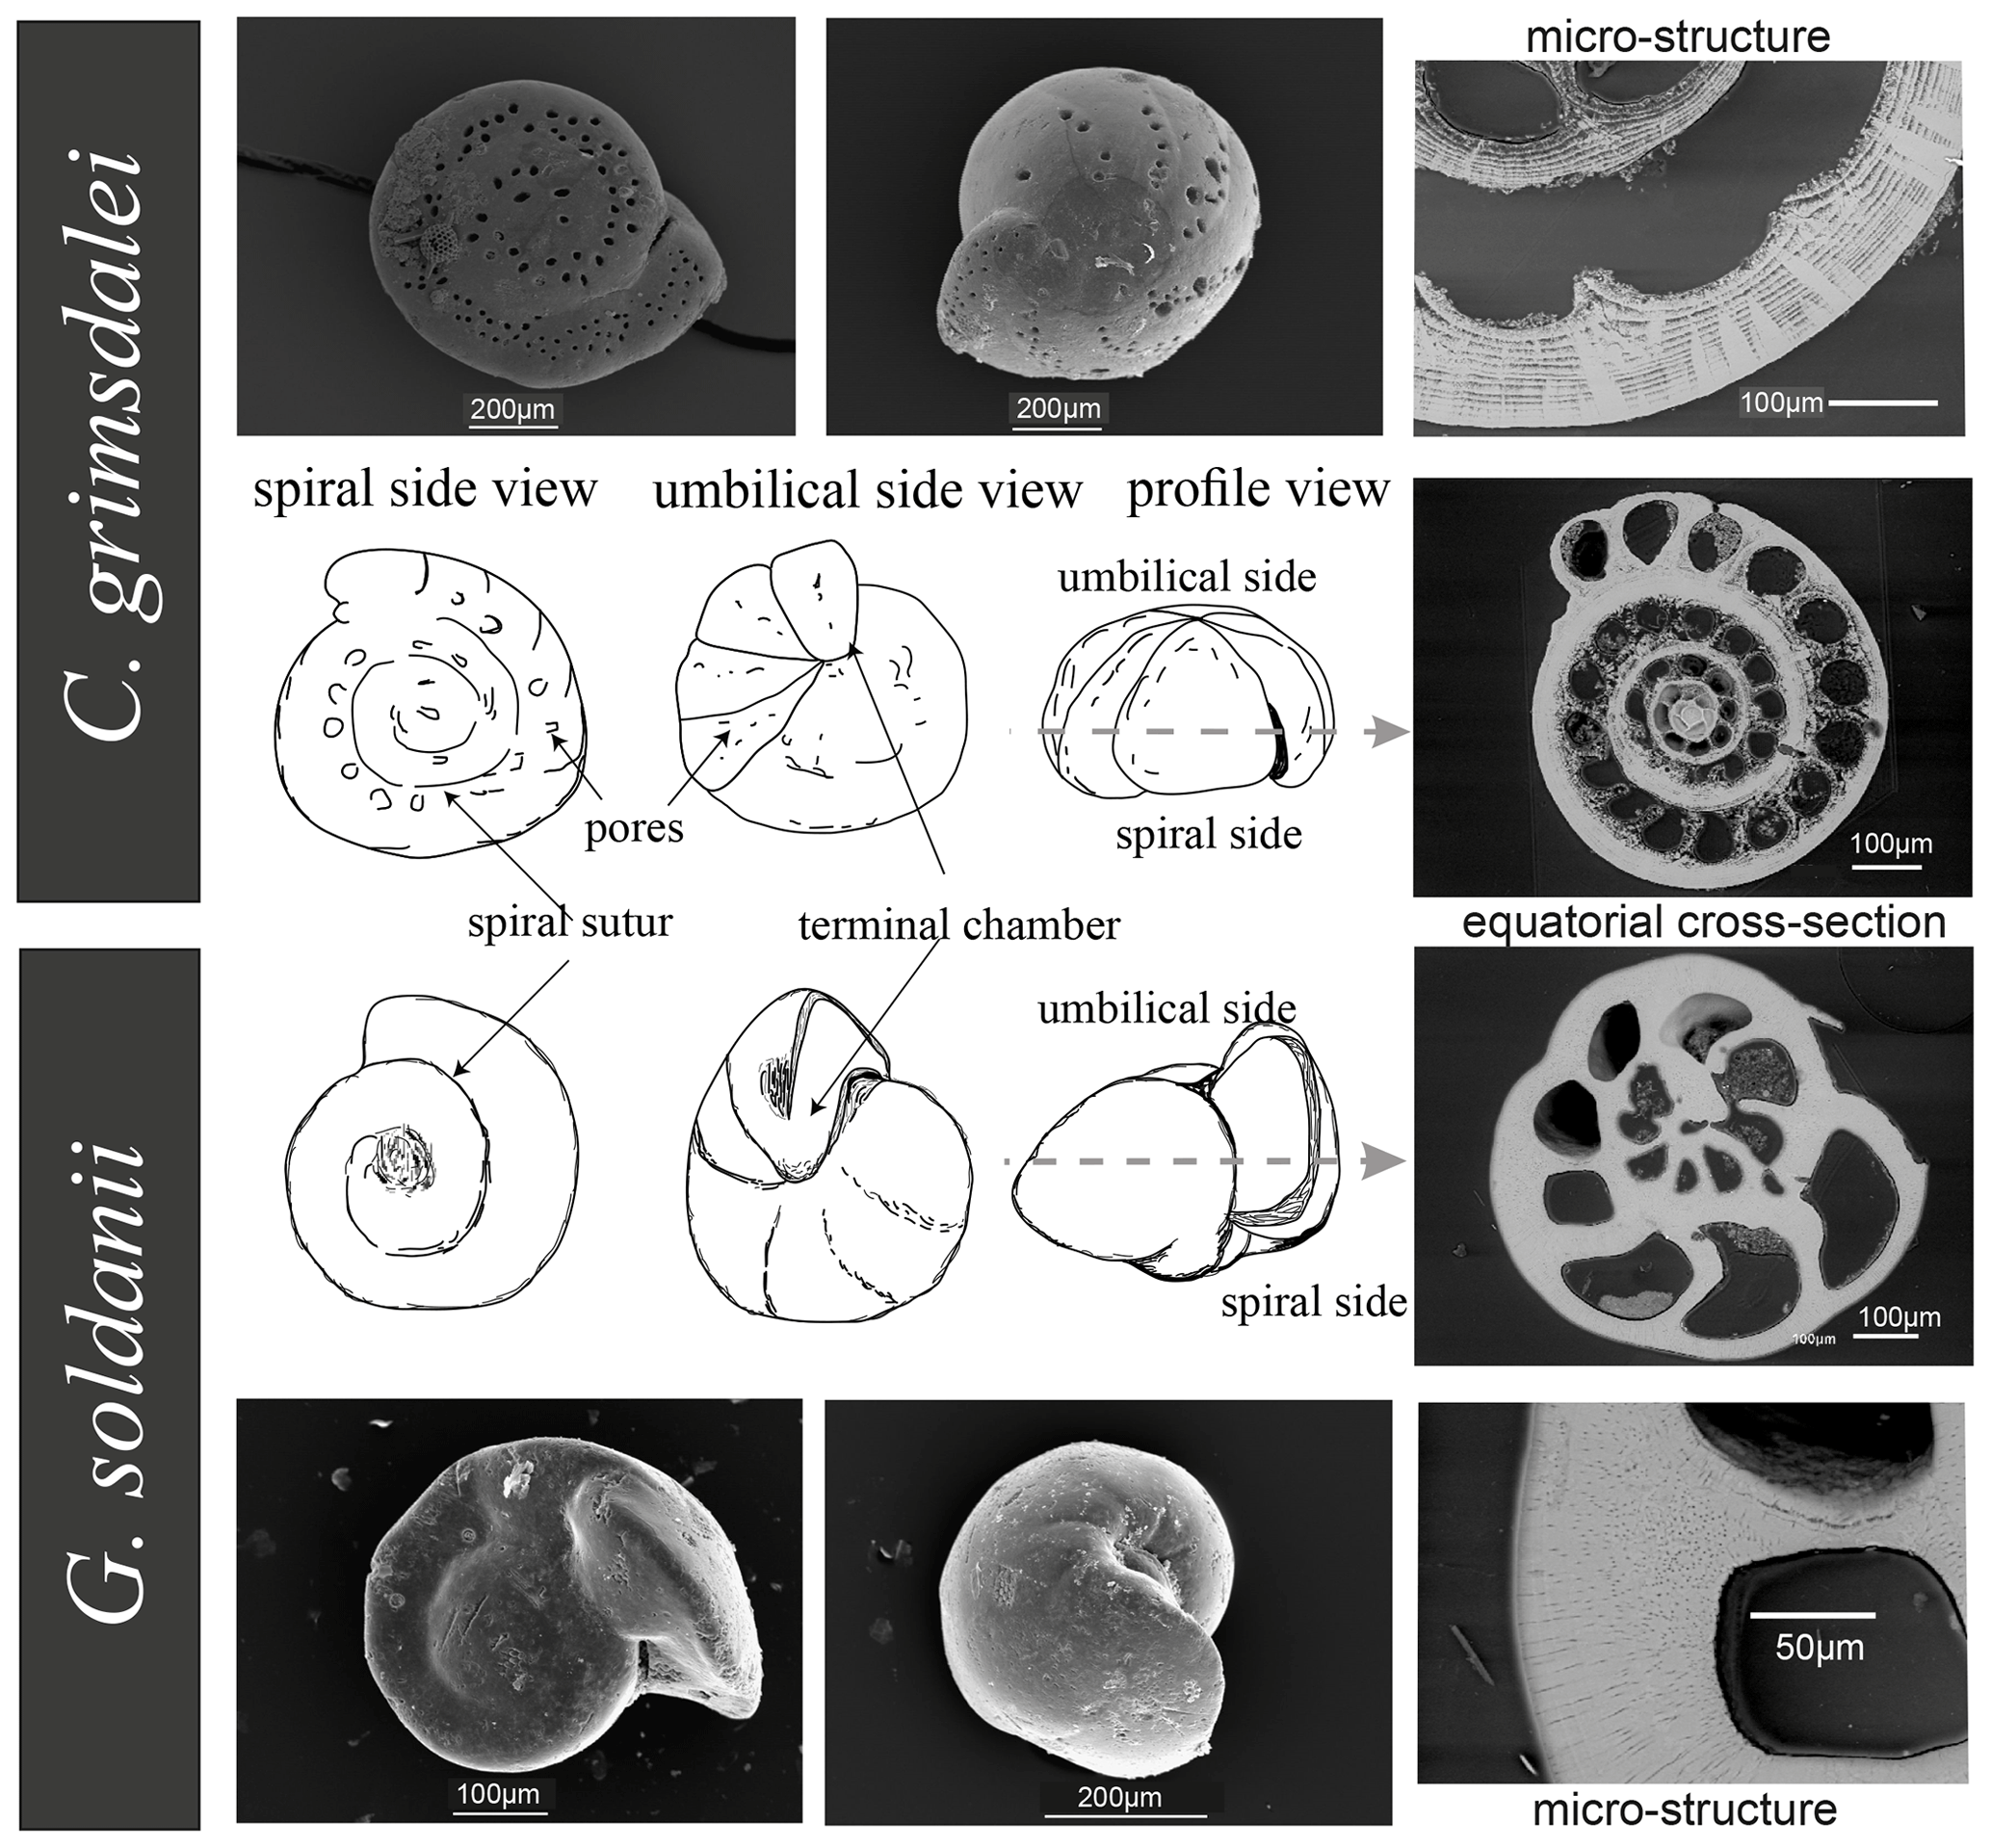
Figure 2Comparison of Cibicidoides grimsdalei and Gyroidinoides soldanii tests. Line drawings of different views in the centre. SEM images of spiral and umbilical site, equatorial sections and a close-up showing test structures. Dashed line = plane of largest diameter (equatorial plane).
2.1 Sample material
Benthic foraminifer tests were obtained by wet sieving of sediments from IODP drill sites U1338 (∼ 0–17 Ma), U1334 (∼ 25–38 Ma) and U1333 (∼ 37–45 Ma) of IODP Expeditions 320 and 321 to the Eastern Equatorial Pacific. Cibicidoides grimsdalei appears in sediments of all three drill sites, whereas Gyroidinoides soldanii only appears in drill sites U1334 and U1338 (Lyle et al., 2010). Both C. grimsdalei and G. soldanii display a flat, evolute (all chambers visible) spiral side and a strongly convex, involute (only final curl visible) umbilical side with gradually increasing chambers (Fig. 2). While the tests of C. grimsdalei form a small, compact trochospire (helical spirals that widen in each turn) and thick, calcareous and coarsely perforated chamber walls (Figs. 2, 4), G. soldanii forms a planoconvex trochospire with calcareous, smooth and finely perforated tests (Figs. 2, 3; Holbourn et al., 2013).
The analysed time interval ranges from 1.6 to 43 Ma with five specimens of G. soldanii and six specimens of C. grimsdalei. The samples were mounted in Epoxy resin (EpoThin 2™, Buehler, ITW Test & Measurement GmbH, Esslingen) with the spiral side pointing to the upper surface of the mount and polished down with silicon carbide (SiC) and a diamond suspension from the outer shell surface of the spiral side to the plane of largest diameter (dashed line, Fig. 2). Finally, to reduce the thickness of amorphous layers on the sample surface and to allow for high-quality crystallographic information, the mounts were finished in an ultrasonic polisher for several hours using 20 nm sized colloidal silica particles in suspension.
2.2 Electron backscatter diffraction analysis
Electron backscatter diffraction (EBSD) analysis is a technique to detect the crystallographic orientation of a crystalline sample in a scanning electron microscope (SEM) with respect to a reference system, for example, the sample surface (Engler and Randle, 2010; Zaefferer, 2007). By these investigations, the crystallographic orientation of the sample relative to the flat surface at each point can be determined (e.g. Maitland and Sitzman, 2007; Pérez-Huerta et al., 2008; Schmahl et al., 2008).
Electron backscatter diffraction analyses were performed on a JEOL 6610-LV SEM equipped with a LaB6 filament and an Oxford Nordlys EBSD detector running the Oxford HKL Channel5 software (version 5.10.50315). The measurements were operated in low vacuum mode without the use of a conductive carbon coat to enhance Kikuchi pattern quality at the expense of a slightly worse spatial resolution (50 Pa partial pressure at the sample surface). The accelerating voltage was set to 20 kV, the working distance was 20 mm and the beam current was around 1.5 nA, measured on a retractable Faraday cup within the SEM column. Electron backscatter diffraction patterns were recorded with the Oxford Flamenco acquisition software and evaluated with the Oxford Tango and Mambo software packages. The size of sampling grids and step sizes (measuring points, 1 to 4 µm) for EBSD maps varied, depending on the size of the specimen and test wall. This was done to map a representative area of each specimen in a reasonable time. The measurements were performed automatically and lasted between ∼ 2.5 and ∼ 22 h depending on step size and mapped areas. The maximum spatial resolution, i.e. the penetration depth from which electrons contributing to Kikuchi patterns were generated in our experimental setting, is about 2 µm, but likely smaller. Point dwell times were around 1–2 s per pixel. The mean angular deviation, a standard parameter to check for the indexing quality, was usually below 1.5∘, and most EBSD patterns were indexed utilizing six to eight Kikuchi bands. The EBSD band contrast reflects the pattern quality and can be obtained in the Hough transform, but pattern quality usually becomes lower at the grain boundaries due to overlapping patterns. This effect reduced the indexing rate especially for samples with small grain sizes. Therefore, in those areas with a low indexing rate, either the polishing quality of the sample was too poor, or the grain sizes of measured crystallites were below our spatial resolution of about 2 µm. Grain orientations are plotted on lower-hemisphere equal-area plots, applying a half-width of 10∘ and a cluster size of 5∘. Points that were not indexed are left blank in the maps. It cannot fully be excluded that some damage of calcite crystals occurred due to heating and amorphization by the electron beam. However, such damages would result in a pejoration of the indexing rate and certainly not to recrystallization. To check for a potential sampling bias of our analyses, we performed a second EBSD map on one test, and this new map confirmed the initial conclusions. We therefore assume that no severe damage occurred to foraminifer tests during our analyses.

Figure 3EBSD analysis of Gyroidinoides soldanii tests from the Pacific equatorial region. Left: SEM images of the analysed specimens. Middle: EBSD maps displaying crystal orientations in colour-coded Euler angles. Right: pole plot figures showing cluster density of the c axes in contouring pole figures, half-width: 10∘, Cluster size: 5∘. The c axes show a relatively strong dispersion within the pole figures and no apparent crystallographic preference. The distribution is indicating a broad clustering and patches with similarly oriented crystals. No apparent change in the size of the clusters with increasing age is observed.
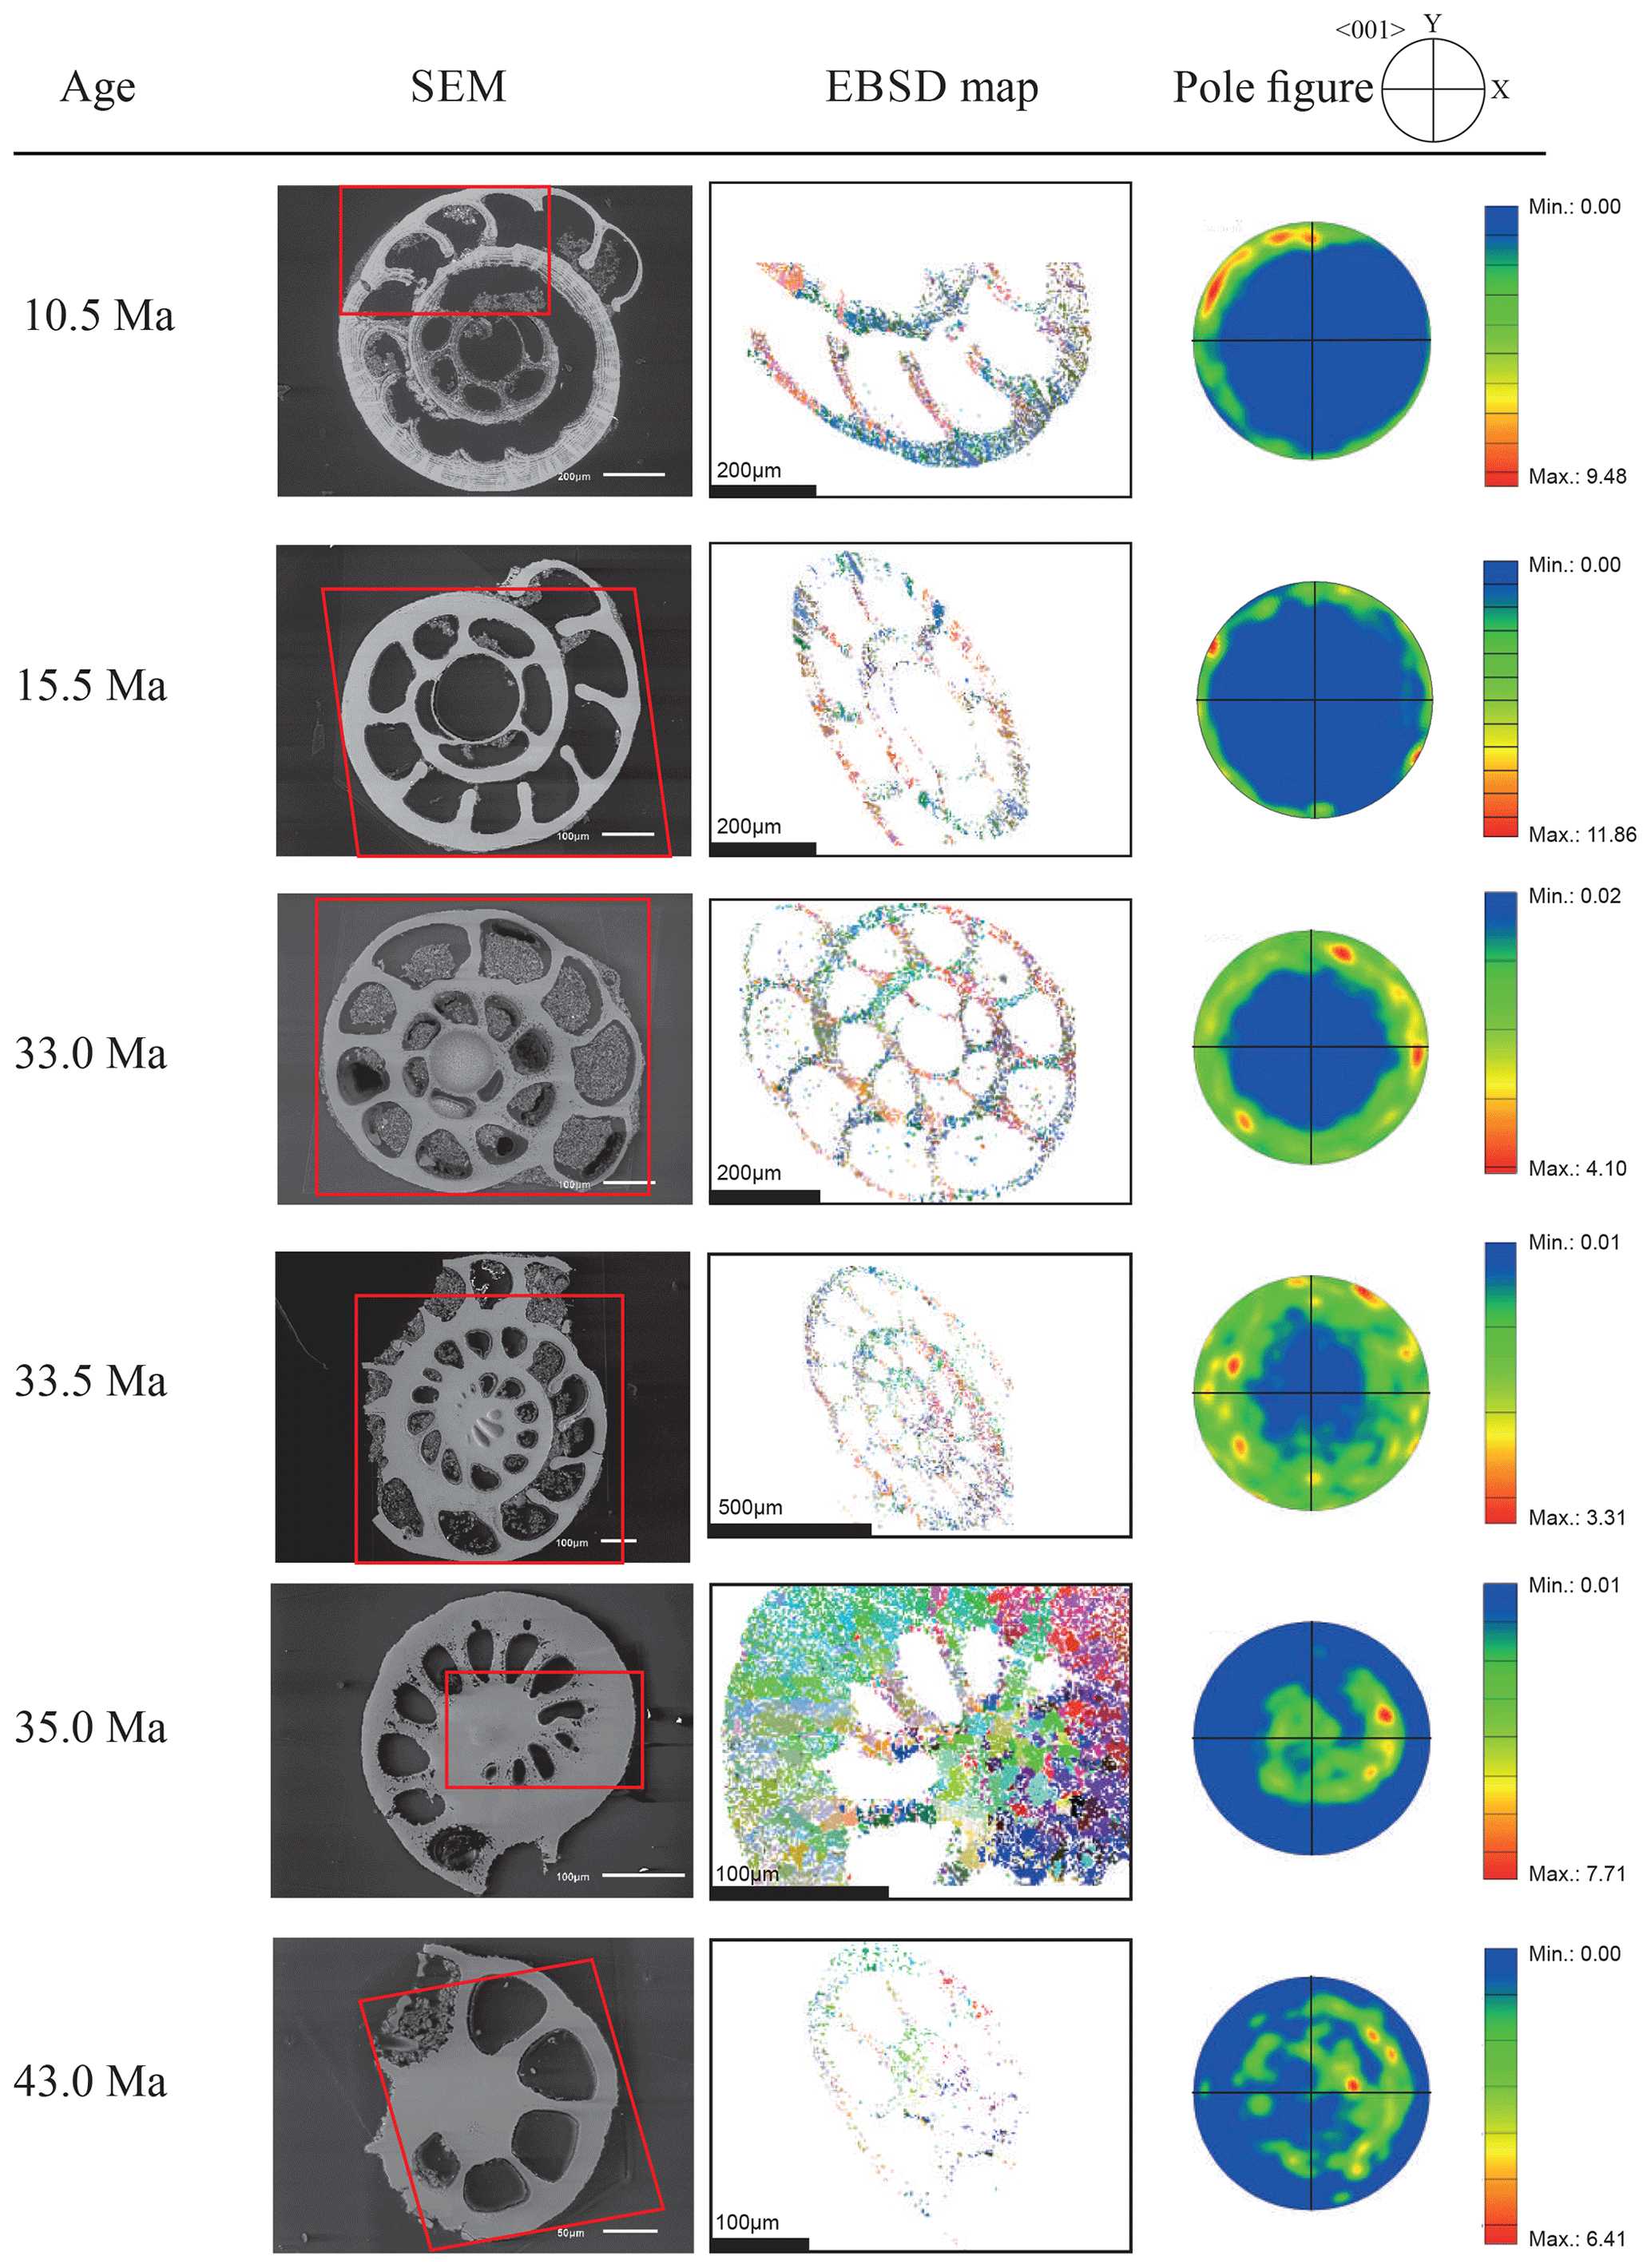
Figure 4EBSD analysis of Cibicidoides grimsdalei tests from the Pacific equatorial region. Left: SEM images of the analysed specimens. Middle: EBSD maps displaying crystal orientations in colour-coded Euler angles. Right: pole plot figures showing cluster density of the c axes in contouring pole figures, half-width: 10∘, Cluster size: 5∘. The figure displays a clear distribution of the c axis within the x–y plane at 10.5 and 15.5 Ma. At 33 and 33.5 Ma, the preferred orientation of the c axis broadens but is still centred on the x–y plane. At 35 and 43 Ma, orientation apparently shifts towards the z axis.
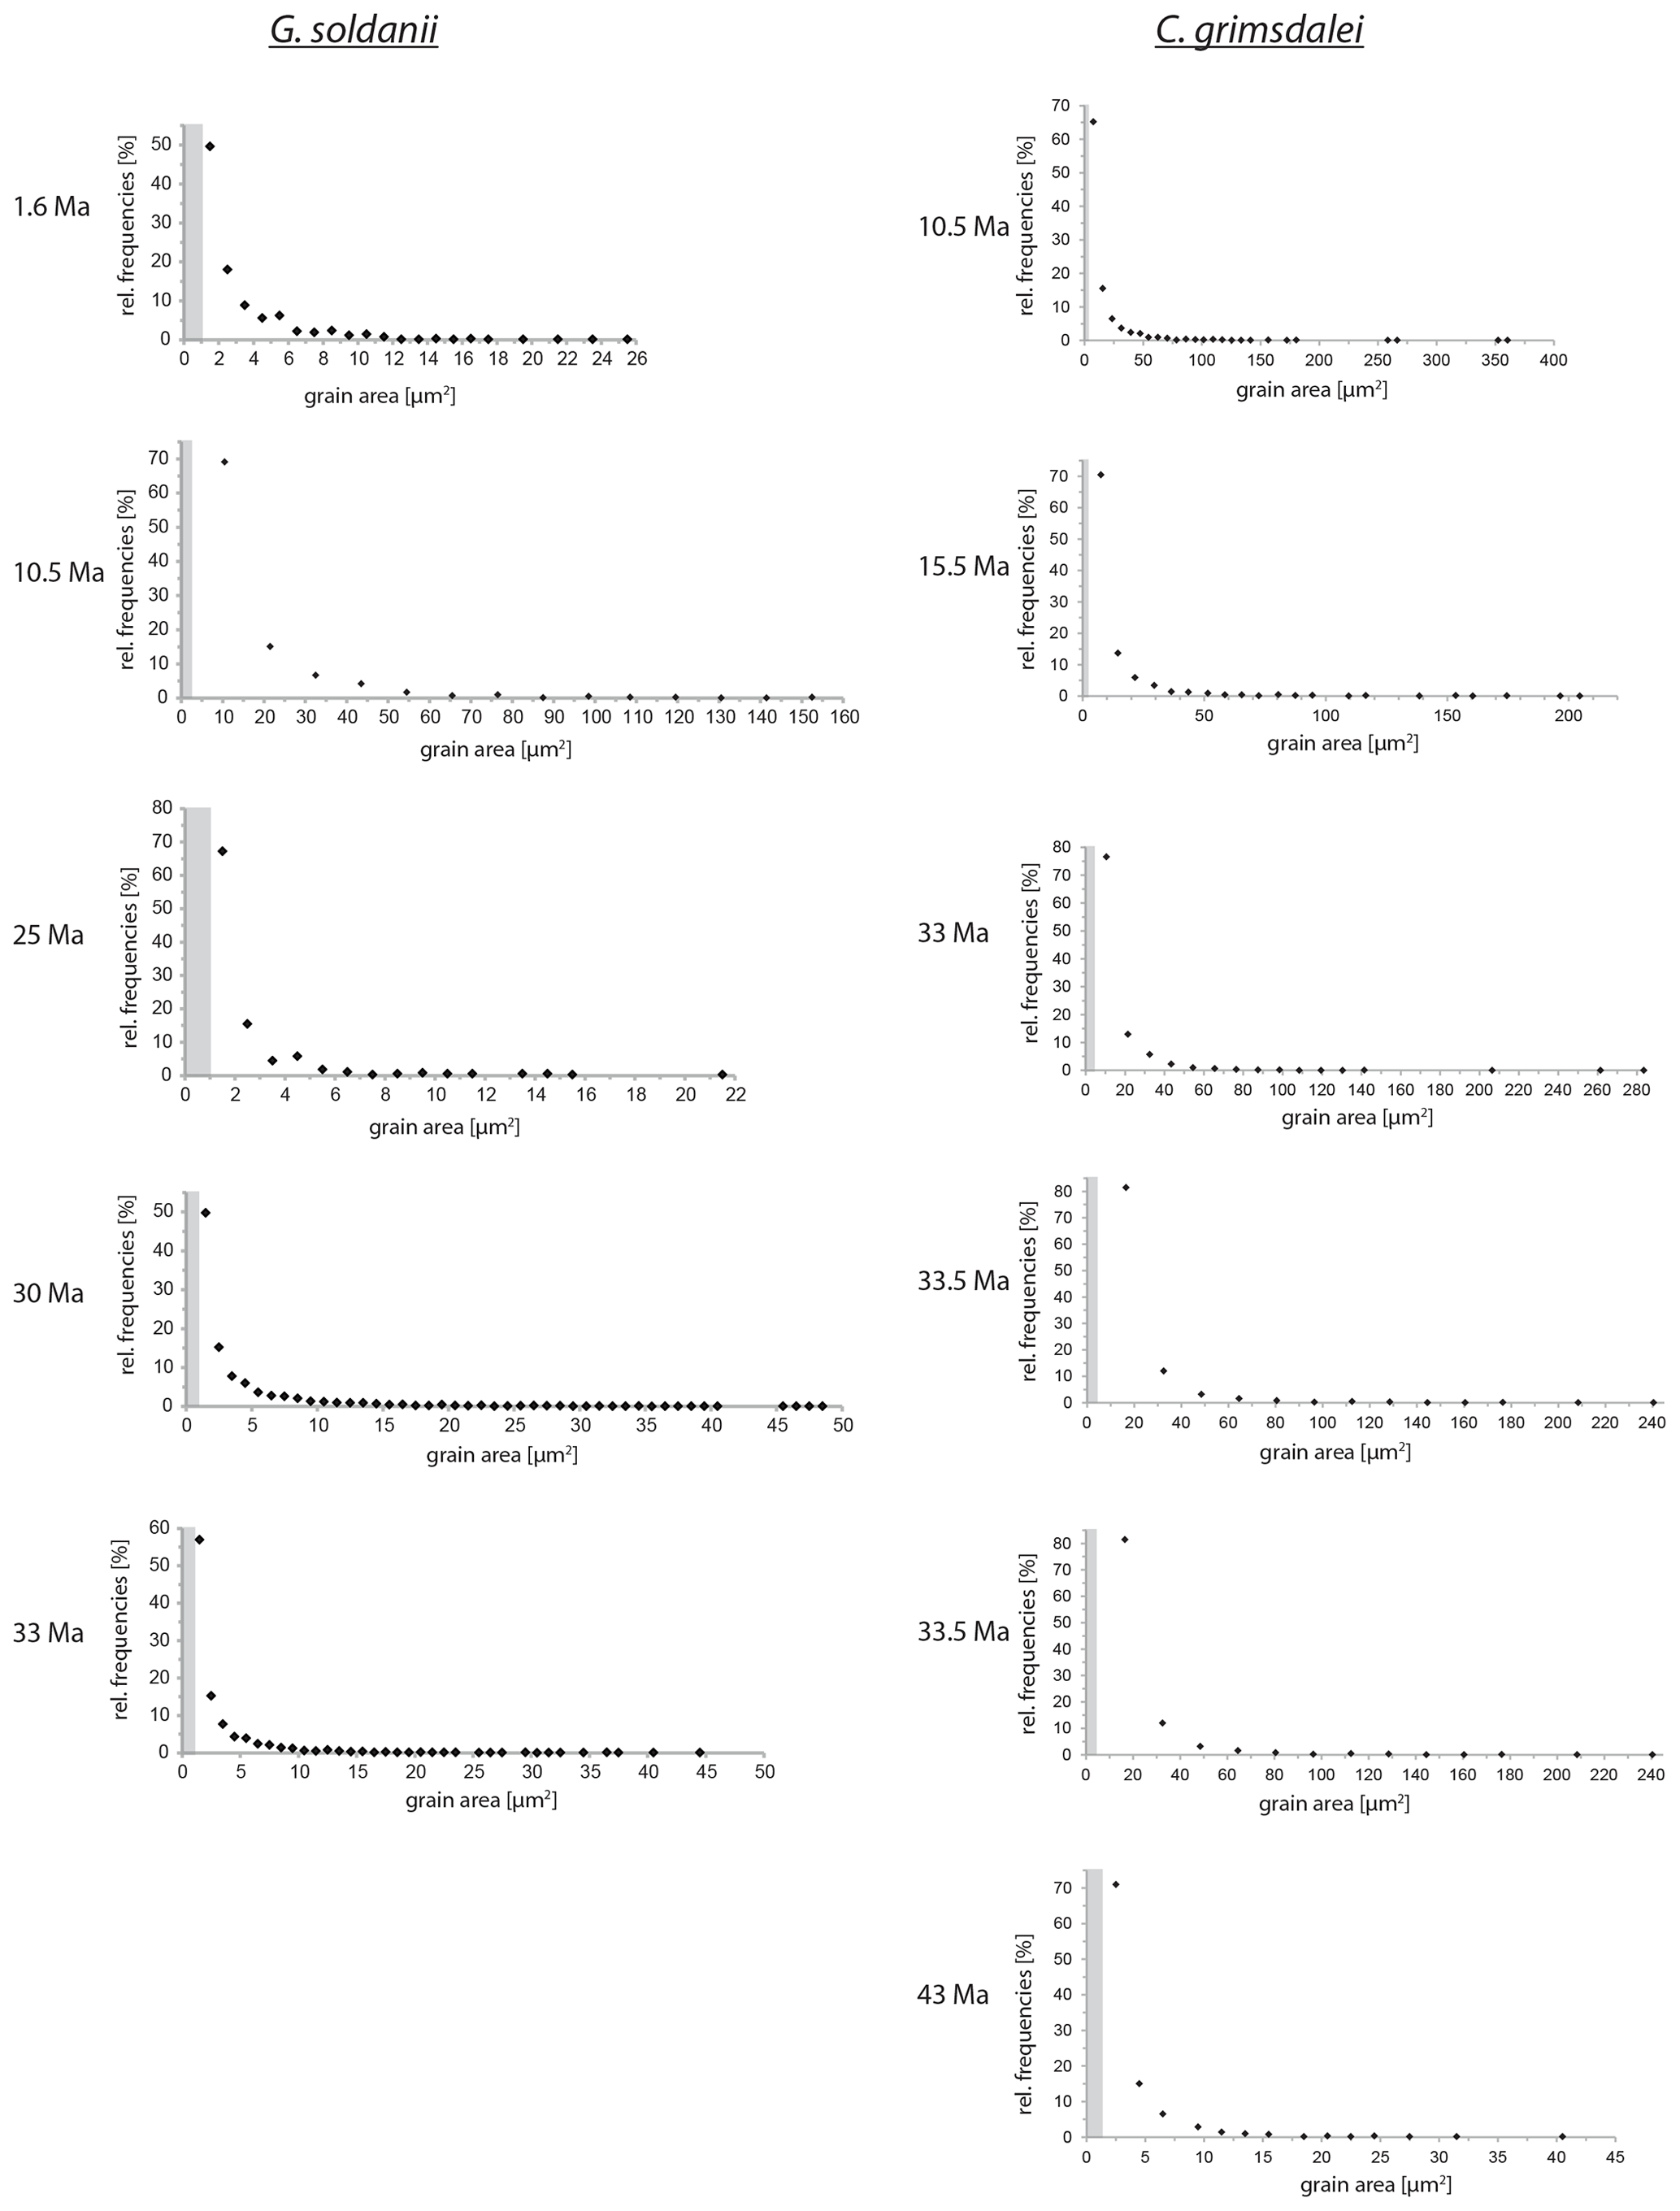
Figure 5Grain size distribution of Cibicidoides grimsdalei and Gyroidinoides soldanii. The maximum is at the lowest value for each specimen. Crystallite sizes are at 1 µm scale. The step sizes are marked as grey dashed boxes.
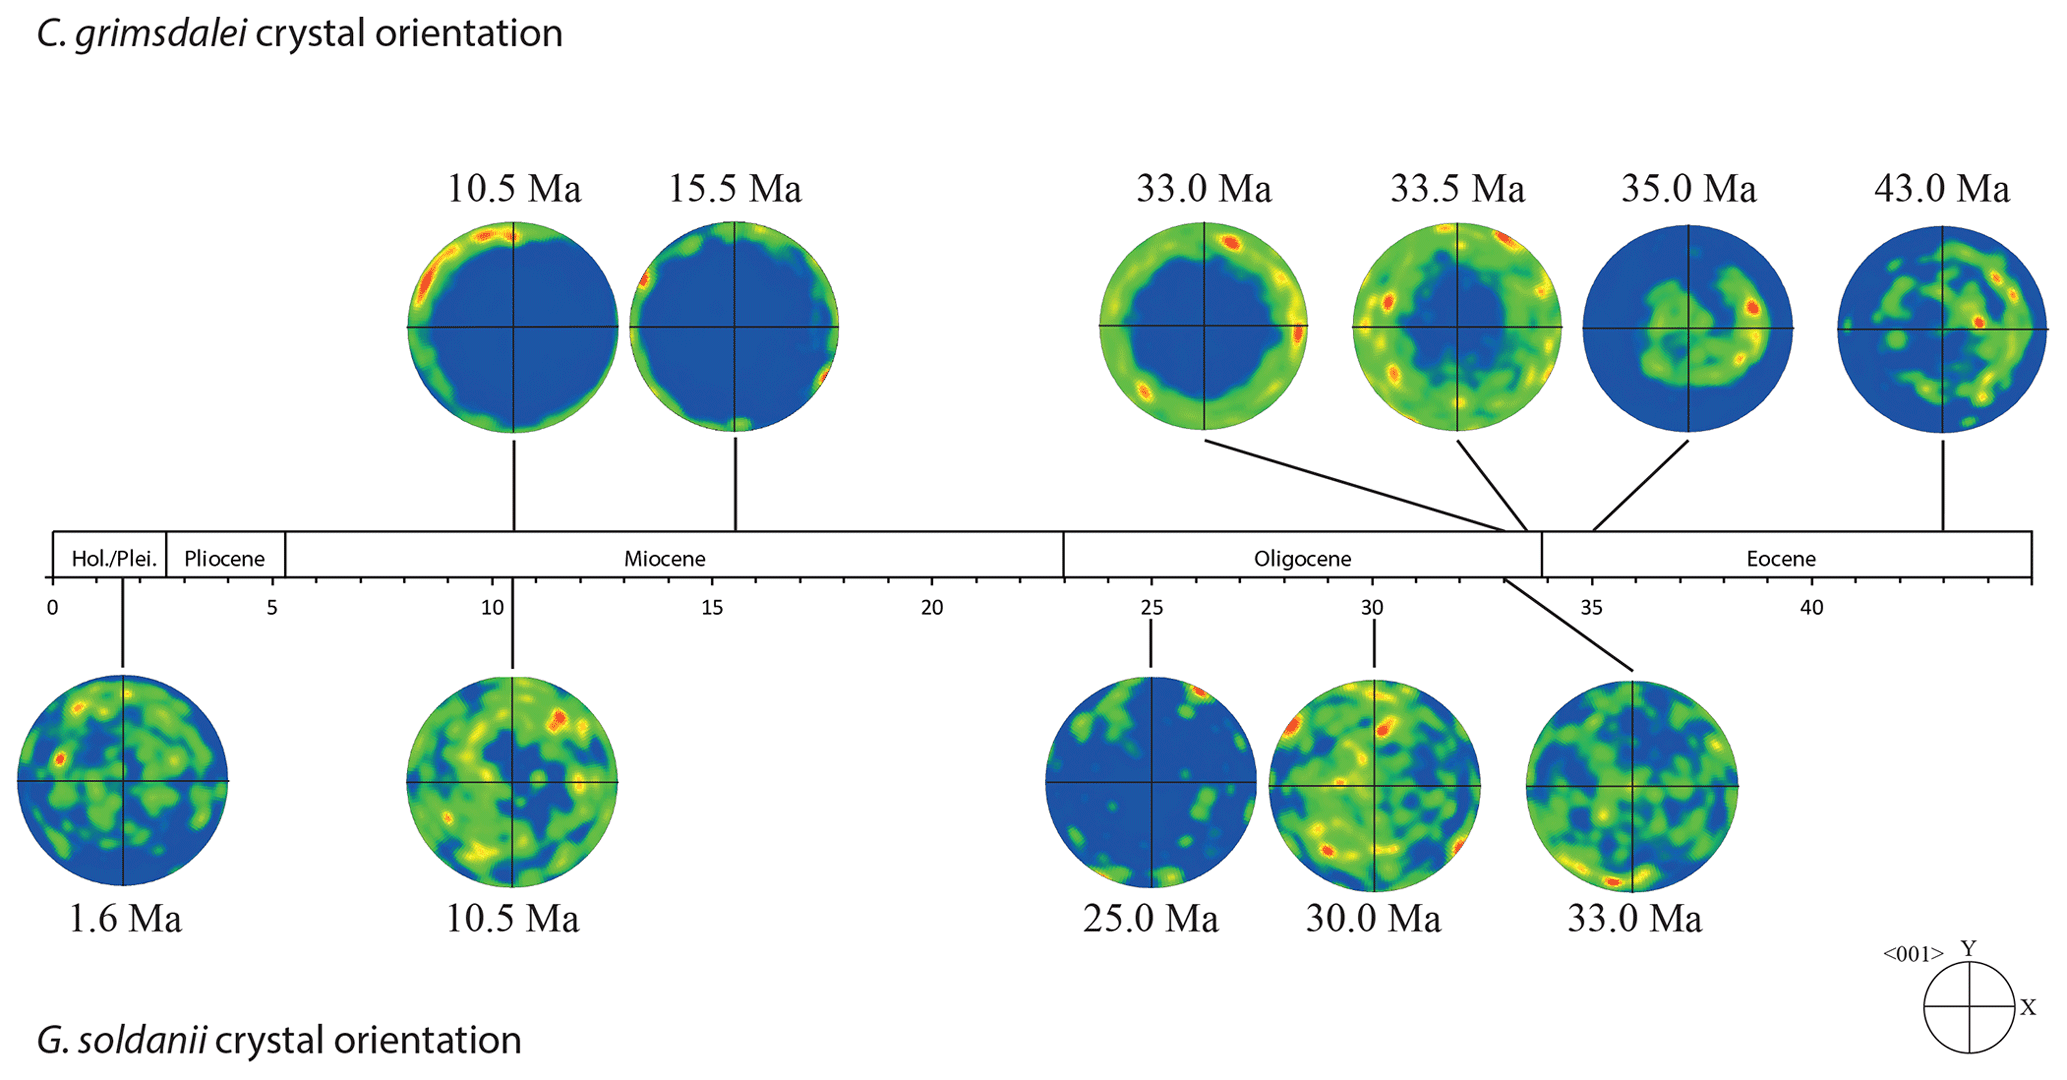
Figure 6Crystal orientation (c-axis pole plots 〈001〉) of Cibicidoides grimsdalei and Gyroidinoides soldanii tests as a function of age.
The distribution of crystal orientations determined by EBSD mapping of 11 benthic foraminifer specimens (5 specimens of G. soldanii, 6 specimens of C. grimsdalei) covering the time period from 1 to 43 Ma are presented in Figs. 3 and 4. The crystal size distribution within the foraminifer tests shows relatively small crystallites (at least 1 up to 16 µm2). A non-negligible portion of the analysed spots could not be indexed, as they are most likely located on grain boundaries, resulting in interfering Kikuchi patterns. Nevertheless, with the applied settings, a sufficiently large indexing rate was obtained to reveal a systematic and consistent pattern in the foraminiferal tests. The data sets are shown in colour-coded Euler maps (orientation maps) and corresponding contouring pole figures showing the density of the crystallographic 〈001〉 c axis of calcite (Figs. 3 and 4). Both maps and pole figures clearly show differences between the two species with respect to the orientation of the calcite crystals. The analysis of G. soldanii revealed that calcite c axes show a relatively strong dispersion within the pole figures with no apparent crystallographic preference and apparently random orientation. However, the distribution is not completely random but demonstrates a broad clustering and patches with similarly oriented crystals (Fig. 3). There is no apparent change in the size of the clusters with increasing age. Electron backscatter diffraction analysis of C. grimsdalei (Fig. 4) revealed a clear distribution of the c axis within the x–y plane in the younger specimens (10.5 and 15.5 Ma). This is related to the preferred orientation of the c axis perpendicular to the test chamber surface. In the 33 and 33.5 Ma specimens, the preferred orientation of the c axis broadens but is still centred on the x–y plane. After 35 Ma, orientation of the c axis apparently shifts towards the z axis of the sample surface. The EBSD map shows clear patches of similarly oriented crystals within the chamber walls whose c axes are perpendicular to the chamber surface. The size of these patches does not change with increasing age.
Overall, the grain size distribution of G. soldanii and C. grimsdalei does not change with increasing age (Fig. 5). Generally, G. soldanii specimens are relatively small (∼ 200 µm) in comparison to C. grimsdalei, which led to a more equal step size. The latter species varies in size from about 300 to 700 µm.
Electron backscatter diffraction maps of the two species clearly distinguish primary differences of crystal orientation patterns of the two benthic foraminifer species. Despite the challenging samples featuring small crystal sizes within the foraminifer tests, leading to a reduced indexing rate, the EBSD analyses provided systematic results. The method used is able to visualize different test structures of foraminifera in a resolvable and reproducible way, namely hyaline perforate test walls with radial (C. grimsdalei) and granular (G. soldanii) textural properties. A special feature of these shells is a lamellar construction of individual calcite layers, which are applied to an organic matrix. The c axes of radially oriented crystals are usually perpendicular to the test surface, while c axes of granular or compound-like calcite crystals are often in a variable angle, frequently 45∘, to the test surface (e.g. Rönnfeld, 2008; Armstrong and Brasier, 2005). The suitability of EBSD analyses to visualize structures related to biomineralization processes revealed by the foraminifer tests studied is in agreement with previous studies on shells and skeletons of several taxa. For instance, Perez-Huerta et al. (2008) could show that in recent brachiopod species Novocrania anomala and Novocrania huttoni the c axis of calcite crystals is parallel to the laminae that define the ultrastructure of the secondary layer, whereas the c axis of rhynchonelliform calcitic brachiopods (e.g. Mergelia truncate, Terebratulina retusa) is perpendicular to the length of morphological fibres and shell exterior (Schmahl et al., 2004). In a further study, Griesshaber et al. (2012) used low-kilovolt EBSD (15 and 5 kV) for the highest spatial resolution possible and observed a strongly interlocking microstructure of concave and convex grains on the skeleton of the modern brachiopod Gryphus vitreus, also showing nanoscale internal structures and micro-textures of carbonate biomaterials for the first time. Besides macrofossils, EBSD analyses have also been successfully applied on microfossils, determining crystallographic orientations of different coccolith compounds (V and R units) of the coccolithophore Pleurochrysis carterae (Saruwatari et al., 2006).
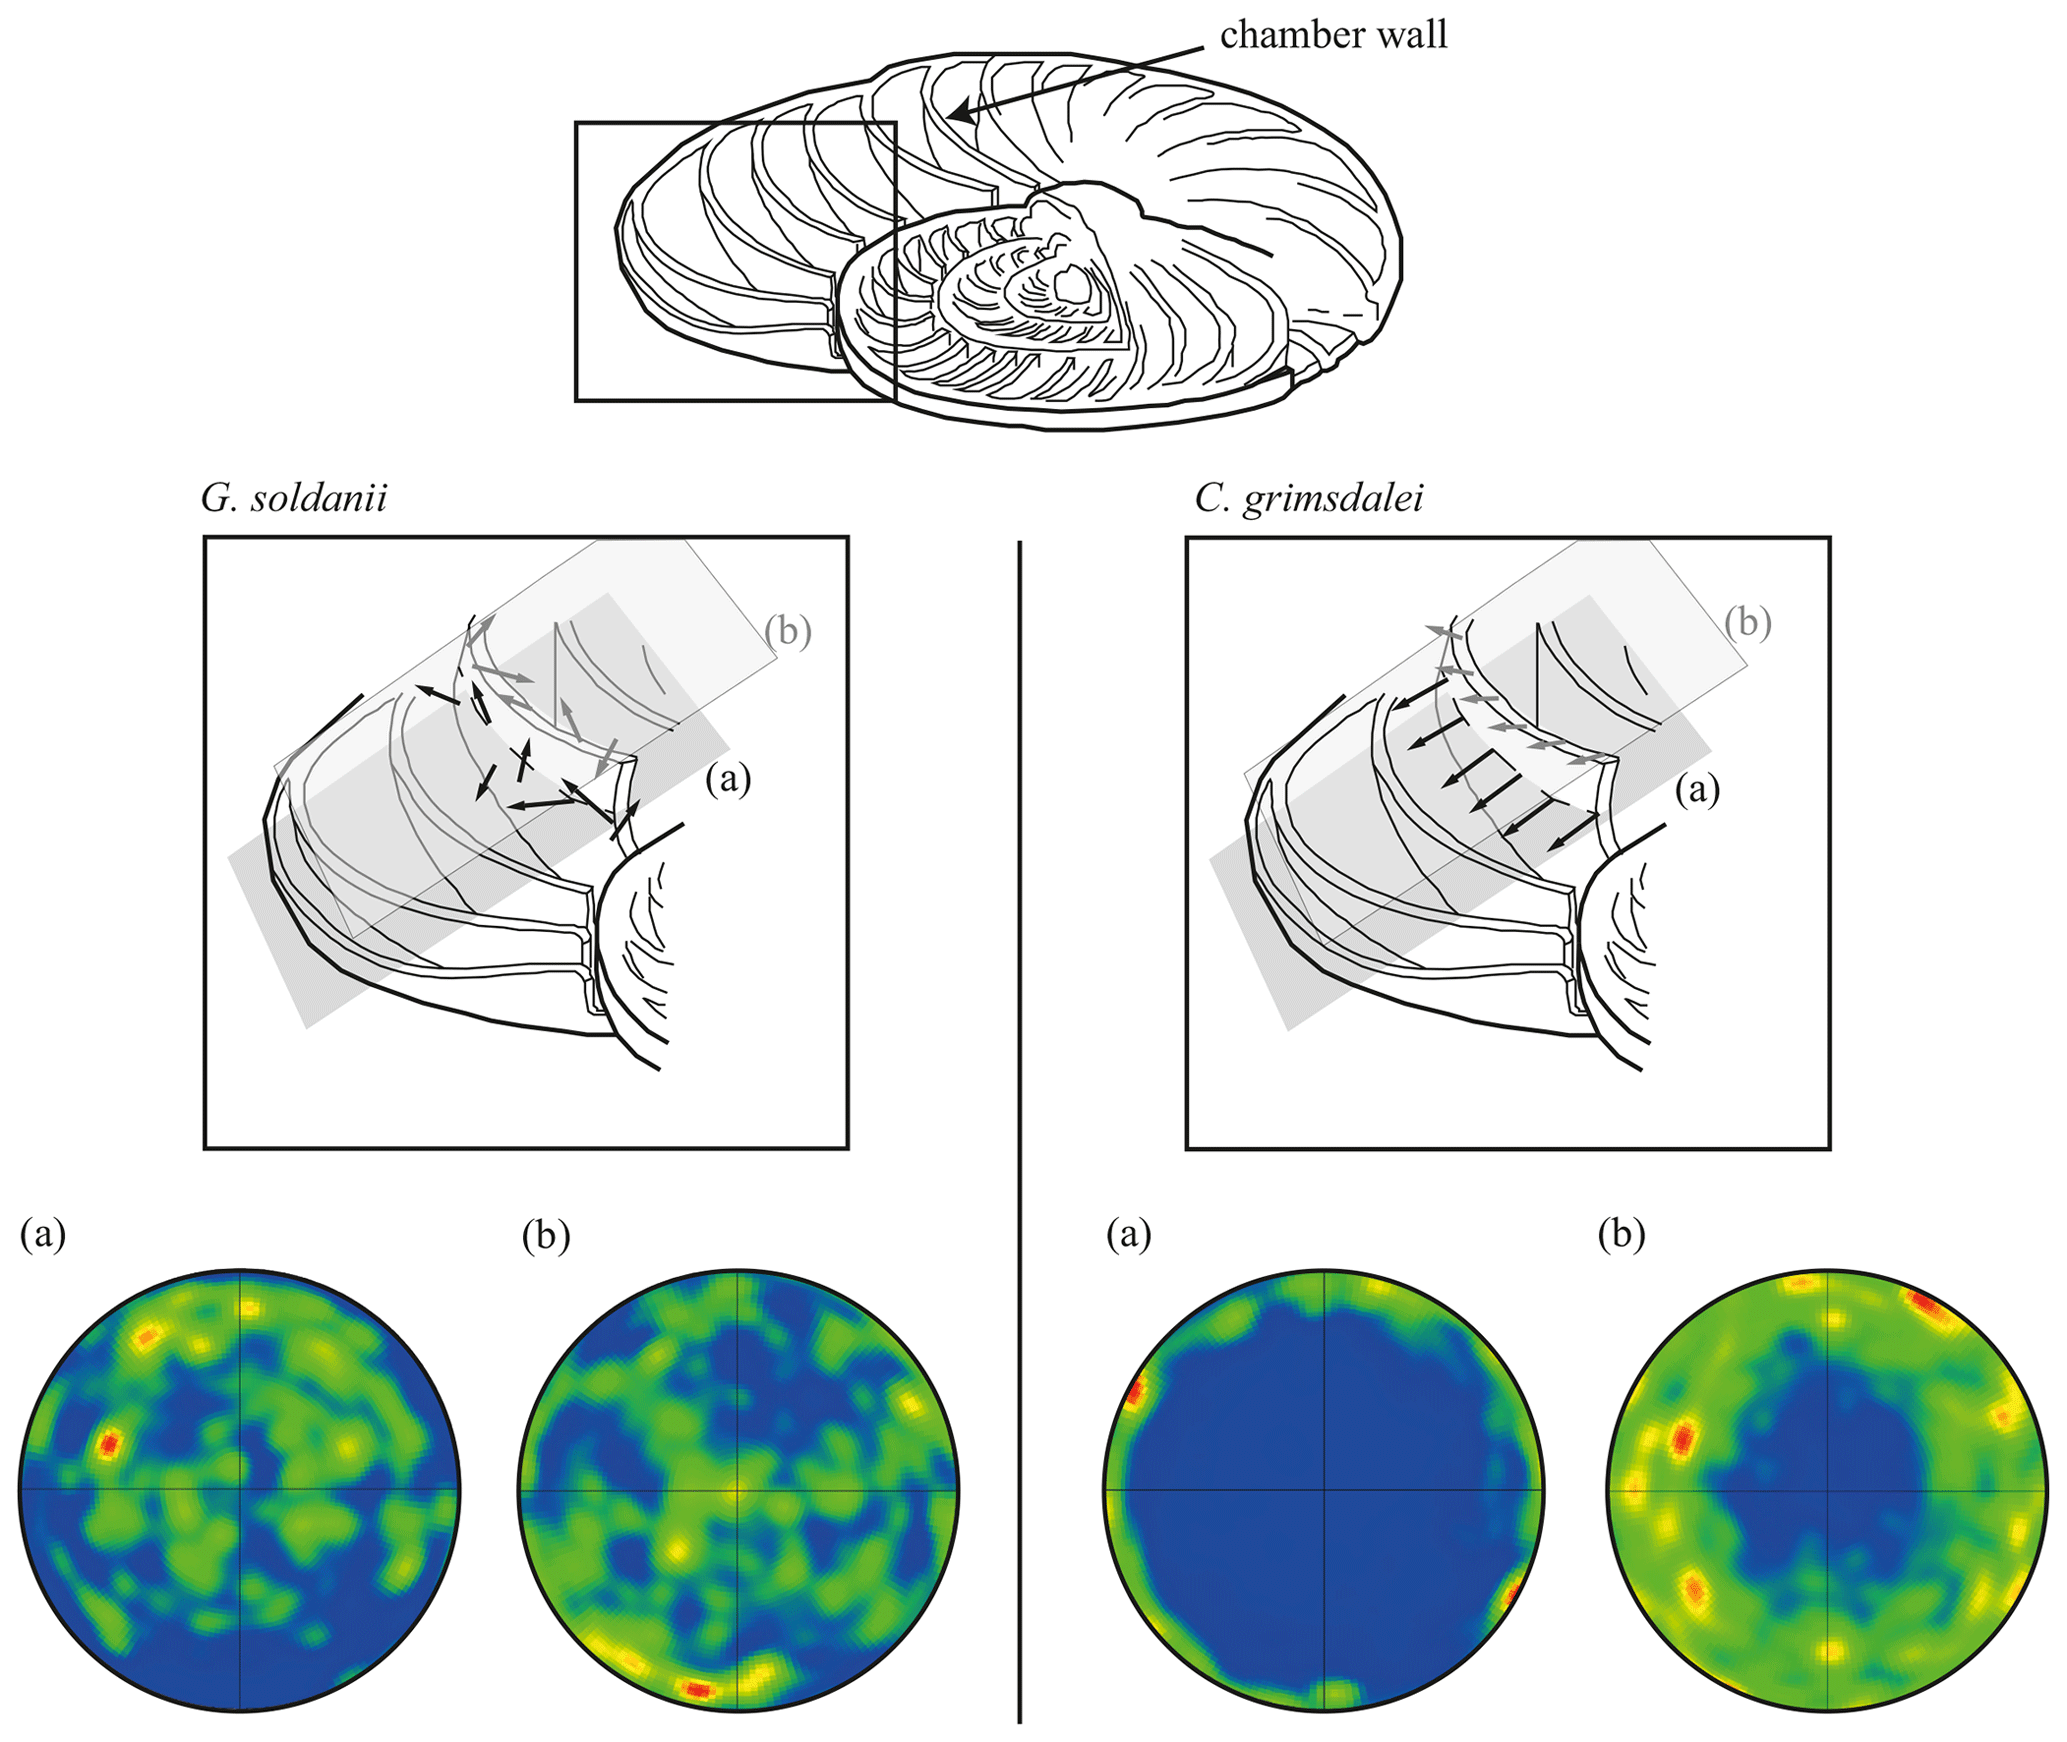
Figure 7Effect of cutting position on the distribution of c axes. (a) Cutting in plane of largest diameter (equatorial plane, dashed line). (b) Off-equator cutting position. Cutaway image of foraminifer test modified after Evans et al. (2013). Black arrows visualize direction of c axes in the equatorial plane (a), while grey arrows indicate c axes in the off-equatorial surface (b).
In concert with previous studies, the EBSD maps of foraminifers obtained in the present study show primary differences in crystal orientation between the two species (Fig. 6). The observation of c-axis clustering within the x–y plane of the sample surface of C. grimsdalei is in agreement with the c-axis orientation perpendicular to the surface of the test wall, if the cutting plane is near the equator of the shell sphere. The c axis in G. soldanii is more randomly oriented, forming clusters, which are not related to the morphological features of the test of this species. This systematics is in agreement with the compound-like distribution of crystals in the test. The apparent change of the c-axis orientation of C. grimsdalei at around 35 Ma may suggest at first sight an age effect. On the other hand, this change of orientation pattern could also be the result of the cutting position, with samples from 33, 33.5 and 35 Ma indicating off-equator sections. Especially at 35 Ma, the very thick test wall and small chambers, as well as the not-visible initial chamber, can be considered as indicators for a mismatch between the equatorial test plane and polished sample surface. Considering the overall appearance of the tests and good preservation, this is the most likely explanation for the shift of the calcite c axis towards the z axis of the sample surface. Consequently, the crystal orientation is still perpendicular to the test wall, but the test surface is not perpendicular to the mount surface. For the foraminifer sample at 35 Ma its test and mount surface are almost parallel, with the c axis being almost perpendicular to the surface of the sample mount. The effect of the cutting position on the apparent c-axis distribution pattern of the foraminifer species is illustrated in Fig. 7. Plane (a) represents a sample surface in the equatorial plane, while plane (b) is off the equatorial plane. The foraminifer test retrieved from the 43 Ma old sediment shows chamber walls that are not overly thick, but the cutting position seems to be off-equator as well because the initial chamber of the test is not truncated. Following this line of evidence, it can be assumed that the cutting position is the more likely mechanism responsible for the observed shift in c-axis orientation rather than recrystallization or other diagenetic effects. Because of granular test walls in G. soldanii, there is no preferred orientation of the calcite crystals visible. Additionally, the crystal size is about 1 µm showing no indication of recrystallization-related grain size coarsening over time. In this case, the cutting position has less impact on the visualization of the crystal orientation. Also, the invariantly small grain sizes in samples of all ages and the absence of cement argues against recrystallization effects. As mentioned earlier, depending on the diameter of specimens, different step sizes had to be applied to obtain a representatively large area for each specimen in an adequate time frame. Thus, comparability of grain sizes between the specimens is limited. Four specimens of G. soldanii with step sizes of 1 µm at 1.6, 15, 30 and 33 Ma are eligible for comparison (Fig. 8, Table 1). These foraminifer tests all show small grain sizes with a maximum at the step size and consequently do not provide evidence for a grain coarsening in the foraminifers studied from the last 33 Myr.
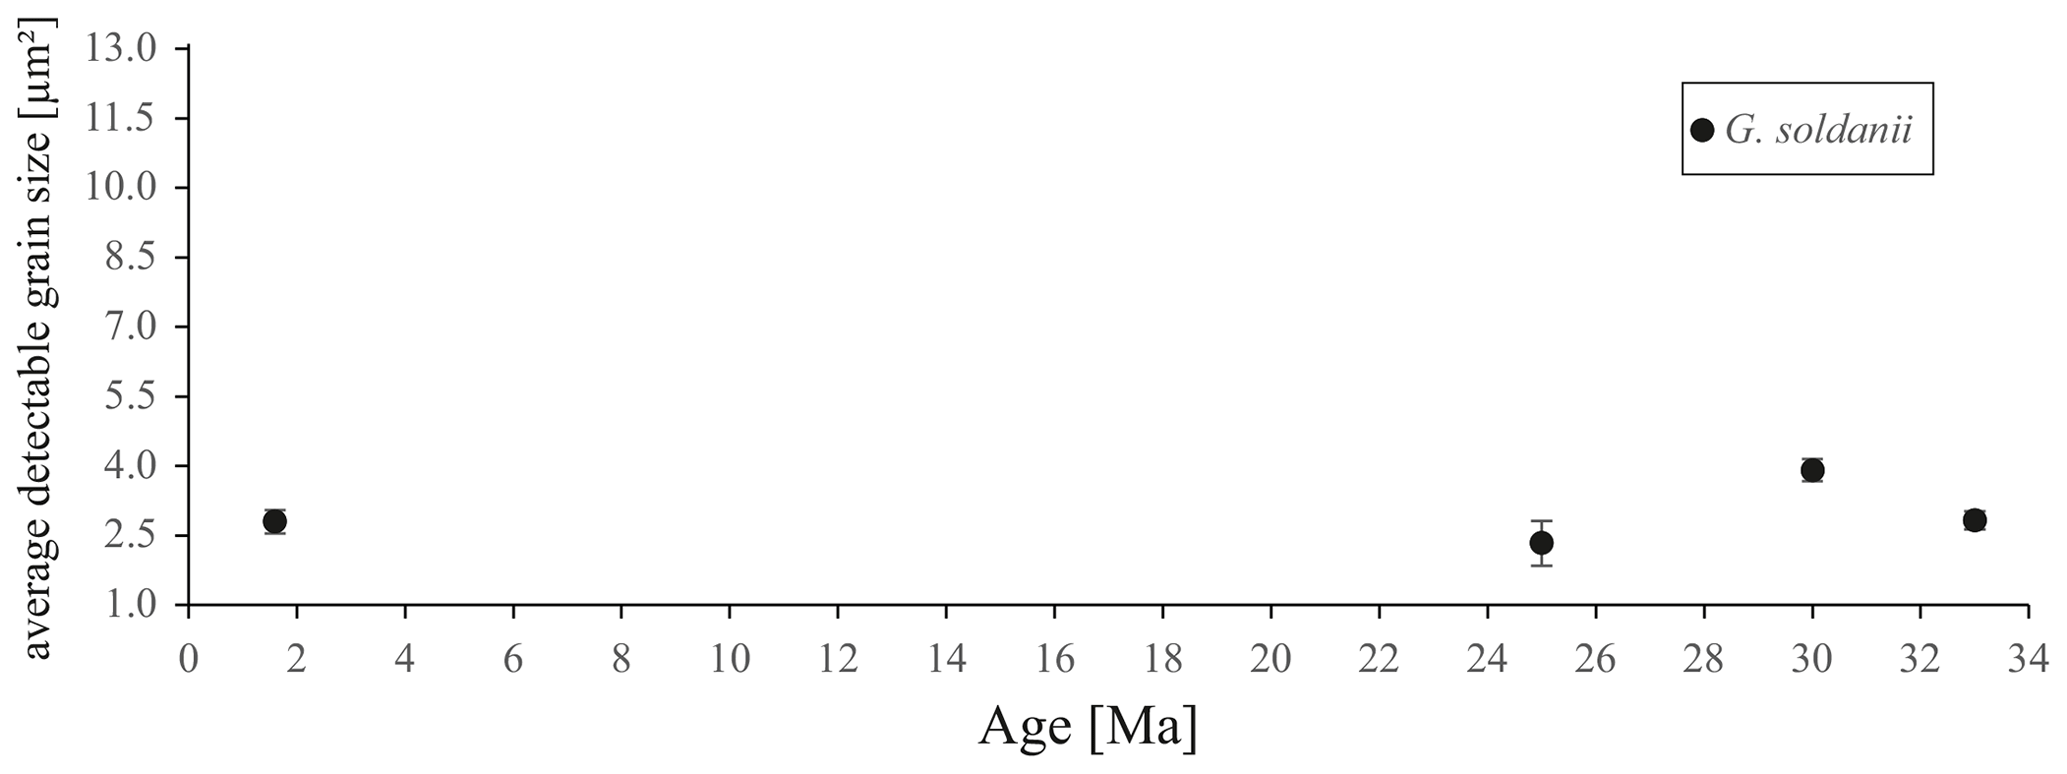
Figure 8Average detectable grain sizes of four Gyroidinoides soldanii specimens with 1 µm sampling resolution. Error bar indicates 2 SE (standard error).
Table 1Average detectable grain size of four Gyroidinoides soldanii specimens, 1 µm step size. SE stands for standard error.

Because of the small size of the crystals forming a foraminifer test, it can be suggested that for EBSD analyses of foraminifers, mapping smaller areas with smaller step sizes is recommended instead of lowering the resolution and mapping the entire test, if a grain size analysis is aimed for.
-
EBSD analysis visualizes structures of foraminifer tests and provides a powerful tool to differentiate between foraminifer test structures and to quantify changes in crystal sizes and grain orientations over time.
-
Cibicides grimsdalei has the c axes perpendicular to the test surface. An apparent shift in the preferred crystal orientation is most likely attributed to a mismatch between equatorial plane and cutting plane of the foraminifer test, highlighting the importance of reproducible preparation techniques. In Gyroidinoides soldanii, the c axes of the calcite crystals show a broader distribution of the crystals with no preferred orientation. The specimens show no detectable change in crystal sizes over time, with a frequency maximum corresponding to the spot size of the electron beam (1 µm). The differences in the test wall structure of G. soldanii and C. grimsdalei are traceable in the geological record and preserved over many millions of years.
-
The lack of evidence for recrystallization suggests that the benthic foraminifers retrieved during IODP Expeditions 320 and 321 are well suited for paleo-environmental reconstructions.
-
The EBSD analysis visualized that foraminifer tests are composed of small crystals. Consequently, for the investigation of grain size distribution in larger specimens, it is more feasible to map one or several small areas of a specimen with high spatial resolution instead of low-resolution mapping of the whole test, to resolve changes of the small grain sizes.
All relevant crystallographic data are included in the article. Additional requests for raw EBSD data should be addressed to Christian Vollmer.
SP, CV and NG designed the research. SP and CV performed the analyses. All authors analyzed the data and participated in the interpretation. SP and NG took the lead in writing the paper.
The authors declare that they have no conflict of interest.
We would like to thank Maik Trogisch for his help with sample preparation for EBSD analysis. We thank Laura Otter and an anonymous reviewer for their constructive comments and Alberto Pérez-Huerta for the editorial handling, helping to improve the paper. Samples for this work were provided by the Integrated Ocean Discovery Program (IODP) and we thank the captains and crews of IODP Expeditions 320 and 321.
This research has been supported by the DFG (grant nos. GU1035/3-1 and GU1035/3-3). The participation of Nikolaus Gussone in the IODP Expedition 320 was supported by a travel grant provided by DFG Priority Programme 527.
This paper was edited by Alberto Pérez-Huerta and reviewed by Laura Otter and one anonymous referee.
Adl, S. M., Leander, B. S., Simpson, A. G. B., Archibald, J. M., Anderson, O. R., Bass, D., Bowser, S. S., Brugerolle, G., Farmer, M. A., Kolisko, S. K. M., Lane, C. E., Lodge, D. J., Mann, D. G., Meisterfeld, R., Mendoza, L., Moestrup, Ø., Mozley-Standridge, S. E., Smirnov, A. V., and Spiegel, F.: Diversity, Nomenclature, and Taxonomy of Protists, Syst. Biol., 56, 684–689, https://doi.org/10.1080/10635150701494127, 2007.
Allaby, A. and Allaby, M. (Rds.): Oxford Dictionary of Earth Sciences, 2nd reissued edn., Oxford University Press, New York, 213 pp., 2003.
Armstrong, H. A. and Brasier, M. D.: Microfossils, 2nd edn., Blackwell Publishing Ltd., Oxford UK, 296 pp., 2005.
Coskun Tunaboylu, B., Altiner, D., İsintek, İ., and Demirci, D.: Foraminiferal biostratigraphy and sequence stratigraphy of peritidal carbonates at the Triassic–Jurassic boundary (Karaburun Peninsula, Western Turkey), J. Asian Earth Sci., 90, 61–76, 2014.
Cusack, M., England, J., Dalbeck, P., Tudhope, A. W., Fallick, A. E., and Allison, N.: Electron backscatter diffraction (EBSD) as a tool for detection of coral diagenesis, Coral Reefs, 27, 905–911, https://doi.org/10.1007/s00338-008-0414-3, 2008.
Drury, A. J., Lee, G. P., Pennock, G. M., and John, C. M.: Data report: late Miocene to early Pliocene coccolithophore and foraminiferal preservation at Site U1338 from scanning electronmicroscopy, in: Proc. IODP, 320/321: Tokyo, edited by: Pälike, H., Lyle, M., Nishi, H., Raffi, I., Gamage, K., Klaus, A., and the Expedition 320/321 Scientists, Integrated Ocean Drilling Program Management International, Inc., 14 pp., https://doi.org/10.2204/iodp.proc.320321.218.2014, 2014.
Edgar, K. M., Pälike, H., and Wilson, P. A.: Testing the impact of diagenesis on the δ18O and δ13C of benthic foraminiferal calcite from a sediment burial depth transect in the equatorial Pacific, Paleoceanography, 28, 468–480, https://doi.org/10.1002/palo.20045, 2013.
Elderfield, H., Cooper, M., and Ganssen, G.: Sr/Ca in multiple species of planktonic foraminifera: Implications for reconstructions of seawater Sr/Ca, Geochem. Geophys. Geosyst., 1, 1017, https://doi.org/10.1029/1999GC000031, 2000.
Engler, O. and Randle, V.: Introduction to Texture Analysis: Macrotexture, Microtexture and Orientation Mapping, 2nd edn., CRC Press, Taylor & Francis Group, 456 pp., 2010.
Evans, D., Müller, W., Oron, S., and Renema, W.: Eocene seasonality and seawater alkaline earth reconstruction using shallow-dwelling large benthic foraminifera, Earth Planet. Sc. Lett., 381, 104–115, https://doi.org/10.1016/j.epsl.2013.08.035, 2013.
Griesshaber, E., Ubhi, H. S., and Schmahl, W. W.: Nanometer Scale Microstructure and Microtexture of Biological Materials Revealed by High Spatial Resolution (15 to 5 kV) EBSD, Materials Science Forum, 702–703, 924–927, https://doi.org/10.4028/www.scientific.net/MSF.702-703.924, 2012.
Gussone, N., Eisenhauer, A., Tiedemann, R., Haug, G. H., Heuser, A., Bock, B., Nägler, Th. F., and Müller, A.: Reconstruction of Caribbean Sea surface temperature and salinity fluctuations in response to the Pliocene closure of the Central American Gateway and radiative forcing, using δ44∕40Ca, δ18O and Mg/Ca ratios, Earth Planet. Sc. Lett., 227, 201–214, 2004.
Gussone, N., Hönisch, B., Heuser, A., Eisenhauer, A., Spindler, M., and Hemleben, C.: A critical evaluation of calcium isotope ratios in tests of planktonic foraminifers, Geochim. Cosmochim. Act., 73, 7241–7255, 2009.
Gussone, N., Filipsson, H. L., and Kuhnert, H.: Mg/Ca, Sr/Ca and Ca isotope ratios in benthonic foraminifers related to test structure, mineralogy and environmental controls, Geochim. Cosmochim. Act., 173, 142–159, 2016.
Hansen, H. J.: Chapter 4: Shell construction in modern calcareous Foraminifera, in: Modern Foraminifera, edited by: Sen Gupta, B. K., Kluwer Academic Publishers, UK, 57–70, 1999.
Haug G. H. and Tiedemann R.: Effect of the formation of the Isthmus of Panama, Nature, 393, 673–676, 1998.
Hausmann, K., Hülsmann, N., and Radek, R.: Protistology, 3rd edn., Schweizerbart'sche Verlagsbuchhandlung, Germany, 379 pp., 2003.
Heuser, A., Eisenhauer, A., Böhm, F., Wallmann, K., Gussone, N., Pearson, P. N., Nägler T. F., and Dullo, W.-C.: Calcium Isotope (δ44∕40Ca) Variations of Neogene Planktonic Foraminifera, Paleoceanography, 20, PA2013, https://doi.org/10.1029/2004PA001048, 2005.
Holbourn, A., Henderson, A., and Macleod, N.: Atlas of Benthic Foraminifera, Wiley-Blackwell, West Sussex, 651 pp., https://doi.org/10.1002/9781118452493, 2013.
Jacob, D. E., Wirth, R., Agbaje, O. B. A., Branson, O., and Eggins, S. M.: Planktic foraminifera form their shells via metastable carbonate phases, Nat. Commun., 8, 1–9, 2017.
Jacob, D. E., Ruthensteiner, B., Trimby, P., Henry, H., Martha, S. O., Leitner, J., Otter, L. M., and Scholz, J.: Architecture of Anoteropora latirostris (Bryozoa, Cheilostomata) and implications for their biomineralization, Sci. Rep., 9, 1–13, 2019.
Katz, M., Cramer, B., Franzese, A., Hönisch, B., Miller, K., Rosenthal, Y., and Wright, J.: Traditional and Emerging Geochemical Proxies in Foraminifera, J. Foraminiferal Res., 40, 165–192, https://doi.org/10.2113/gsjfr.40.2.165, 2010.
Lear, C. H., Bailey, T. R., Pearson, P. N., Coxall, H. K., and Rosenthal, Y.: Cooling and ice growth across the Eocene-Oligocene transition, Geology, 36, 251–254, https://doi.org/10.1130/G24584A.1, 2008.
Lyle, M., Pälike, H., Nishi, H., Raffi, I., Gamage, K., Klaus, A., and the IODP Expeditions 320/321 Scientific Party: The Pacific Equatorial Age Transect, IODP Expeditions 320 and 321: Building a 50-Million-Year-Long Environmental Record of the Equatorial Pacific Ocean, Sci. Dril., 9, 4–15, https://doi.org/10.2204/iodp.sd.9.01.2010, 2010.
Maitland, T. and Sitzman, S.: Chapter 2: Electron Backscatter Diffraction (EBSD) Technique and Materials Characterization Examples, in: Scanning Microscopy for Nanotechnology Technics and Applications, edited by: Zhou, W. and Wang, Z. L., XIV, 522 pp., https://doi.org/10.1007/978-0-387-39620-0, 2007.
Otter, L. M., Agbaje, O. B. A., Kilburn, M. R., Lenz, C., Henry, H., Trimby, P., Hoppe, P., and Jacob, D. E.: Insights into architecture, growth dynamics, and biomineralization from pulsed Sr-labelled Katelysia rhytiphora shells (Mollusca, Bivalvia), Biogeosciences, 16, 3439–3455, https://doi.org/10.5194/bg-16-3439-2019, 2019.
Pawlowski, J., Holzmann, M., Berney, C., Fahrni, J., Gooday, A. J., Cedhagen, T., Habura, A., and Bowser, S. S.: The evolution of early Foraminifera, P. Natl. Acad. Sci. USA, 100, 11494–11498, https://doi.org/10.1073/pnas.2035132100, 2003.
Pawlowski, J., Lejzerowicz, F., and Esling, P.: Next-Generation Environmental Diversity Surveys of Foraminifera: Preparing the Future, Biol. Bull., 227, 93–106, 2014.
Pérez-Huerta, A., England, J., and Cusack, M.: Crystallography of craniid brachiopods by electron backscatter diffraction (EBSD), Earth Env. Sci. T. R. So., 98, 437–442, 2008.
Raitzsch, M. and Hönisch, B.: Cenozoic boron isotope variations in benthic foraminifers, Geology, 41, 591–594, https://doi.org/10.1130/G34031.1, 2013.
Rönnfeld, W.: Foraminiferen/Ein Katalog typischer Formen, 3rd edn., self-published, Tübingen, 146 pp., 2008.
Röttger, R. und Lehmann, G.: Benthic foraminifera, in: A course in Protozoology, edited by: Röttger, R., Knight, R., and Foissner, W., Protozoological Monographs, 4, 111–123, 2009.
Saruwatari, K., Ozaki, N., Nagasawa, H., and Kogure, T.: Crystallographic alignments in a coccolith (Pleurochrysis carterae) revealed by electron back-scattered diffraction (EBSD), Am. Mineral., 91, 1937–1940, 2006.
Sen Gupta, B. K. (Ed.): Introduction to modern Foraminifera, chap. 1, in: Modern Foraminifera, Kluwer Academic Publishers, UK, 3–6, 1999.
Schmahl, W. W., Griesshaber, E., Neuser, R., Lenze, A., Job, R., and Brand, U.: The microstructure of the fibrous layer of terebratulide shell calcite, Eur. J. Mineral., 16, 693–697, 2004.
Schmahl, W. W., Griesshaber, E., Neuser, R. D., Goetz, A., and Lüter, C.: Electron Backscatter Diffraction Study of Brachiopod Shell Calcite – Microscale Phase and Texture Analysis of a Polycrystalline Biomaterial, Part. Part. Syst. Charact., 25, 474–478, 2008.
Stanley, S. M., Ries, J. B., Hardie, L. A.: Low-magnesium calcite produced by coralline algae in seawater of late Cretaceous composition, P. Natl. Acad. Sci. USA, 99, 15323–15326, https://doi.org/10.1073/pnas.232569499, 2002.
Voigt, J., Hathorne, E. C., Frank, M., and Holbourn, A.: Minimal influence of recrystallization on middle Miocene benthic foraminiferal stable isotope stratigraphy in the eastern equatorial Pacific, Paleoceanography, 31, 98–114, https://doi.org/10.1002/2015PA002822, 2016.
Zaefferer S.: On the formation mechanisms, spatial resolution and intensity of backscatter Kikuchi patterns, Ultramicroscopy, 107, 254–266, https://doi.org/10.1016/j.ultramic.2006.08.007, 2007.