the Creative Commons Attribution 4.0 License.
the Creative Commons Attribution 4.0 License.
 | 23 Oct 2020
Structural study of decrespignyite-(Y), a complex yttrium rare earth copper carbonate chloride, by three-dimensional electron and synchrotron powder diffraction
Jordi Rius
Fernando Colombo
Oriol Vallcorba
Xavier Torrelles
Mauro Gemmi
Enrico Mugnaioli
The crystal structure of the mineral decrespignyite-(Y) from the Paratoo copper mine (South Australia) has been obtained by applying δ recycling direct methods to 3D electron diffraction (ED) data followed by Rietveld refinements of synchrotron data. The unit cell is a= 8.5462(2), c= 22.731(2) Å and V= 1437.8(2) Å3, and the chemical formula for Z=1 is (Y10.35REE1.43Ca0.52Cu5.31)Σ17.61(CO3)14Cl2.21(OH)16.79⋅18.35H2O (REE: rare earth elements). The ED data are compatible with the trigonal space group (no. 164) used for the structure solution (due to the disorder affecting part of the structure, the possibility of a monoclinic unit cell cannot completely be ruled out). The structure shows metal layers perpendicular to [001], with six independent positions for Y, REE and Cu (sites M1 to M4 are full, and sites M5 and M6 are partially vacant), and two other sites, Cu1 and Cu2, partially occupied by Cu. One characteristic of decrespignyite is the existence of hexanuclear (octahedral) oxo-hydroxo yttrium clusters [Y6(μ6-O)(μ3-OH)8O24] (site M1) with the 24 bridging O atoms belonging to two sets of symmetry-independent (CO3)2− ions, with the first set (2×) along a ternary axis giving rise to a layer of hexanuclear clusters and the second set (6×) tilted and connecting the hexanuclear clusters with hetero-tetranuclear ones hosting Cu, Y and REE (M2 and M3 sites). The rest of the crystal structure consists of two consecutive M3 + M4 layers containing the partially occupied M5, M6, and Cu2 sites and additional carbonate anions in between. The resulting structure model is compatible with the chemical analysis of the type material which is poorer in Cu and richer in (REE, Y) than the above-described material.
- Article
(3562 KB) - Full-text XML
-
Supplement
(113 KB) - BibTeX
- EndNote


In the last years, 3D electron diffraction (ED) has become a routine tool for solving the crystal structure of minerals ordered only in the nanometric range (Kolb et al., 2007, 2008; Gemmi et al., 2019; Mugnaioli and Gemmi, 2018). In a 3D ED experiment an almost complete intensity dataset is collected (except for the mechanical missing wedge of the TEM goniometer), if the sample is stable during the experiment. Recent technical advances have considerably reduced the damage either by using weaker electron beams or by reducing the exposure time taking advantage of fast read-out detectors enabling continuous scans (Gemmi et al., 2015; van Genderen et al., 2016). Even if part of the structure is significantly altered during data collection, the large amount of collected intensities should allow recognizing the true Laue group. Systematic extinctions (especially zonal ones) could also be determined unambiguously, further restricting the space group choice (Camalli et al., 2012; Andrusenko et al., 2015). Especially prone to vacuum-induced dehydration and electron beam damage are those minerals based on self-assembly of metal clusters via H bond networks (León-Reina et al., 2013; Capitani et al., 2014; Ventruti et al., 2015; Majzlan et al., 2016). In such cases application of direct methods like δ recycling (δDM) (Rius, 2012a, 2014) is more complicated since parts of the structure may not show up in the Fourier map. One such case is represented by decrespignyite-(Y), a mineral with unknown crystal structure. This mineral is found exclusively at the Paratoo copper mine (Yunta, Olary Province, South Australia). Its detailed characterization was carried out by Wallwork et al. (2002). According to these authors, decrespignyite-(Y) shows minor variations in the REE (rare earth element) abundances for different occurrences within the same deposit, with an approximately constant ratio between (Y + REE) and Cu. On the basis of the powder diffraction data, they suggested a monoclinic unit cell with a=8.899(6), b=22.77(2), c= 8.589(6) Å, β= 120.06(5)∘ and V= 1506.3(7) Å3. As no systematic absences were noted, the possible space groups are P2, Pm and P2∕m.
To determine the crystal structure of decrespignyite-(Y), here a different sample from the same mine is used (DCP1). The microprobe analyses of DCP1 show some differences with the chemical data presented by Wallwork et al. (2002) obtained from their sample (DCP2). More specifically, DCP1 contains more Cu and is (Y, REE) poorer. In this contribution these differences are rationalized based on the crystal structure of the mineral.
2.1 Electron microprobe analyses (EMPA)
Quantitative chemical analyses were obtained using a JEOL 8230-JXA electron microprobe operating in wavelength-dispersive mode (WDS), housed at LAMARX (UNC, Córdoba, Argentina). The DCP1 sample was mounted in epoxy, mirror polished and carbon coated. The accelerating voltage was 15 kV, the beam current was 10 nA and the beam diameter was 5 µm.
The small size of the crystals precluded the use of a larger beam spot. The following monochromator crystals, elements, lines and standards were used for analysis in a PETJ crystal: Ca (Kα, anorthite), Y (Lα, YPO4), La (Lα, LaB6) and Ce (Lα, CeAl2); in a LiF crystal: Nd (Lα, NdF3), Sm (Lα, SmF3), Tb (Lα, TbF3), Dy (Lα, DyF3), Er (Lα, ErF3), Tm (Lα, TmSi2) and Yb (Lα, YbF3); in a LiFH crystal: Cu (Kα, libethenite), Gd (Lα, GdF3), Pr (Lβ, PrF3), Ho (Lβ, HoF3) and Lu (Lβ, LuF3); and in a PETH crystal: Cl (Kα, sodalite). Intensities were measured for 15 s on the peak and 7 s at each side of the peak. Overlaps between REE were corrected using empirical factors. Raw intensities were processed using the PAP method as implemented by CITZAF software, supplied by JEOL. The very small amount of sample, and the fact that DCP1 is mixed at a very fine scale with other phases, precluded direct analysis of C, O and H. Fixed amounts of H2O (10.8 wt %) and CO2 (19.8 wt %), taken from Wallwork et al. (2002), were added for accurate matrix corrections. It should be noted that selecting one of the background positions for the measurement of the Ho Lβ line is extremely difficult due to the number of other emission lines in the vicinity. This may result in an overestimation of the background intensity and consequent reduction in the peak counts, which are per se rather weak.
The same microprobe was used for energy dispersive spectroscopy (EDS) to obtain semiquantitative analyses to confirm the identification of other phases.
2.2 Three-dimensional electron diffraction
Three-dimensional ED experiments were performed on a Zeiss Libra 120 transmission electron microscope operating at 120 kV, equipped with a LaB6 electron source and a Nanomegas Digistar P1000 device for precession electron diffraction. Two datasets with tilt range up to 115∘ were recorded in 1∘ steps with a precession angle of 1∘. A 5 µm condenser aperture was used in order to a have a parallel nanobeam in Köhler illumination with a size of 150 nm. All the patterns have been collected in nano-diffraction mode without selected-area aperture. The recording device was an ASI MEDIPIX detector (14-bit, 512×512 pixels). ED data were processed with the ADT3D package (Kolb et al., 2011) and in-house MATLAB routines (Fig. 1), yielding a metrically hexagonal unit cell with a= 8.7(2) Å and c= 21.9(4) Å, compatible with the published monoclinic cell within the experimental error of the method. Reflection intensities were singularly integrated, avoiding any merging related to symmetry. Diffraction spots are sharp in the a–b plane and show very strong diffuse scattering along c*, suggesting stacking disorder along this direction.
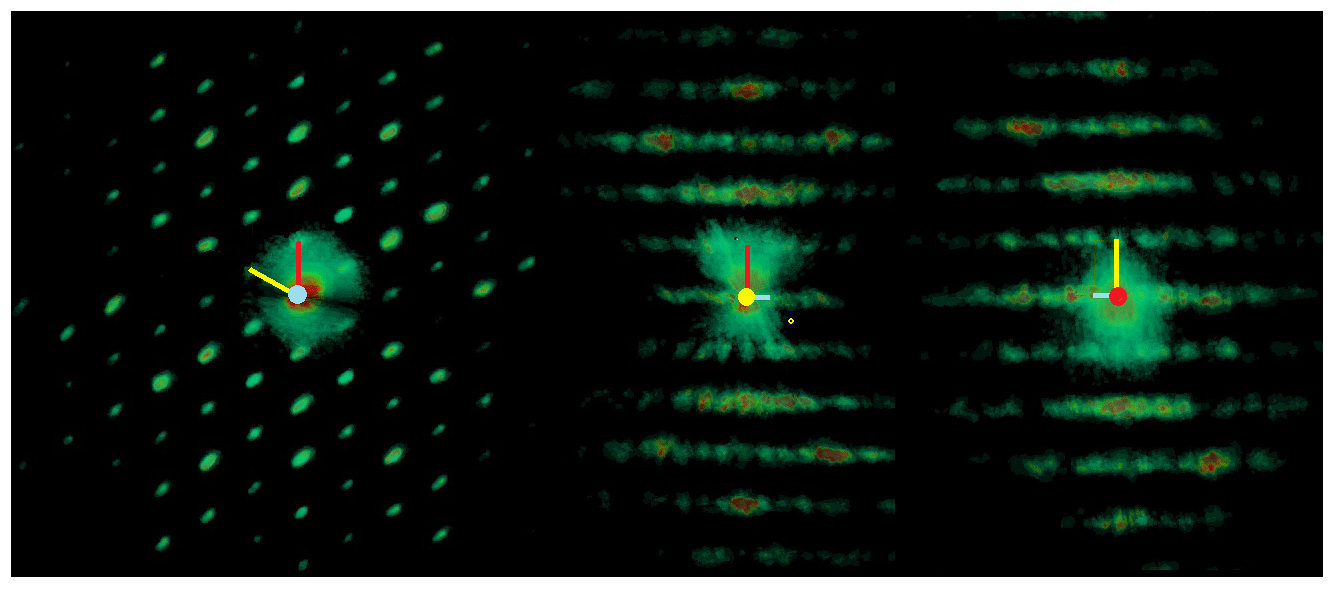
Figure 1Weighted reciprocal lattice of DCP1measured by 3D electron diffraction and projected along c* (left), b* (middle) and a* (right). Segments represent the projected a* (red), b* (yellow) and c* (blue). The presence of very strong diffuse scattering along c* (i.e., inside the layers in the middle and right projections) indicates stacking disorder in this direction.
2.3 Synchrotron X-ray powder diffraction
The synchrotron X-ray powder diffraction pattern was collected at beamline BL04 (Fauth et al., 2013) of ALBA Synchrotron (Barcelona, Spain). The sample was mounted in a 0.7 mm diameter glass capillary, and the data were collected with a Mythen detector (λ= 0.61913 Å). The hexagonal lattice parameters and the parameters of the profile function (Thompson et al., 1987) were refined with the whole-profile matching software Dajust (Vallcorba et al., 2012) by using 1∕yo as a weighting factor. These parameters were kept fixed during the posterior structural Rietveld refinements: a= 8.5462(2), c= 22.731(2) Å and V= 1437.8(2) Å3; zero shift ∘; ; and . Final pattern-matching figures of merit are Rwp=0.78 % and χ(I)=1.11 for the 1–35∘ 2θ range (Δθ=0.006∘) involving 5666 data points and 318 reflections (peak range is 20 FWHM). For completeness, the monoclinic unit cell was also refined yielding Rwp=0.73 % and χ(I)=1.04. Owing to the much larger number of Bragg positions in the monoclinic case (1364 vs. 318 for the hexagonal one) and to the identical visual aspect of both powder diffraction pattern fits, the simpler trigonal symmetry was selected. In the pattern of DCP1 there are a few peaks that cannot be indexed with the hexagonal or monoclinic unit cells. These peaks show good correspondence with those of caysichite-(Y) (Hogarth et al., 1974), whose presence was also confirmed by electron microprobe analyses.
Table 1Electron microprobe analysis of two samples of decrespignyite-(Y) from the Paratoo mine.

n.m.: not measured; b.d.l.: below detection limit. * calculated based on the crystal structure and symmetry constraints; (H2O): calculated by difference with 100 wt %. CO2 and H2O contents were measured by Wallwork et al. (2002).
2.4 Raman spectroscopy
Raman spectra were acquired at the Laboratorio de Nanoscopía y Nanofotónica (LANN; Facultad de Ciencias Químicas, Universidad Nacional de Córdoba, Córdoba, Argentina), with a LabRAM HR Horiba Jobin-Yvon confocal microscope Raman system with a 50× objective lens and using a 632.8 nm (He-Ne) laser. Low laser power was used in order to avoid laser-induced heating. Peak positions were found fitting Gaussian curves, using the Fityk 0.9.8 software.
2.5 Sample description
Sample DCP1 consists of spherules of decrespignyite-(Y), composed of light-blue interlocking platy crystals; individual crystals reach up to about 7 µm long and less than 2 µm thick. Spherules line thin fissures in the host rock, embedded in white kaolinite [Al2Si2O5(OH)4, identified by X-ray powder diffraction and confirmed with EDS]. The composition of DCP1 is given in Table 1, along with data taken from Wallwork et al. (2002) (their Table 1) for comparison. In DCP1 the amount of Cu is ≈ 50 % higher than in DCP2; in contrast, the REE content (other than Y) is lower [ΣREE is 9.24 vs. 16.7 wt % in DCP2]. The chondrite-normalized REE pattern shows a rather steep positive slope ( 0.071 for DCP1 and 0.079 for DCP2). The pattern for DCP1 is approximately linear between La and Er, whereas it is upwards convex for DCP2. Sample DCP1 shows a weak negative Ho anomaly, which can be attributed to analytical error due to an overestimation of the background intensity (see section on microprobe analysis). Sample DCP2 displays a strong positive Ho anomaly.
The calculation of the empirical formula (and of elements not measured by EMPA) is not straightforward, as the analysis is incomplete (due to the scarcity of material) and some H2O molecules are disordered and thus do not diffract coherently, making their quantification impossible using X-ray diffraction (XRD). To obtain the atomic proportions, metallic cations were normalized so that the number of refined electrons (as obtained by XRD) matched the number of electrons contributed by the cations, calculated using EMPA data. CO2 wt % was calculated assuming that 14 C atoms are present (as suggested by considerations of the crystal structure, symmetry constraints and the Raman spectrum, elaborated below), whereas the H2O wt % was calculated by difference. The Cl≡O correction was taken into account. Some slight burn marks were seen in the beam impact spot after the microprobe analyses. This may imply that the sample lost some volatiles, and thus the H2O content is probably a minimum estimate. Wallwork et al. (2002) obtained a slightly elevated analytical total (103.2 wt %) when combining EMPA data with CHN analysis, which was also attributed to partial dehydration of decrespignyite-(Y) during the analysis with electron microprobe.
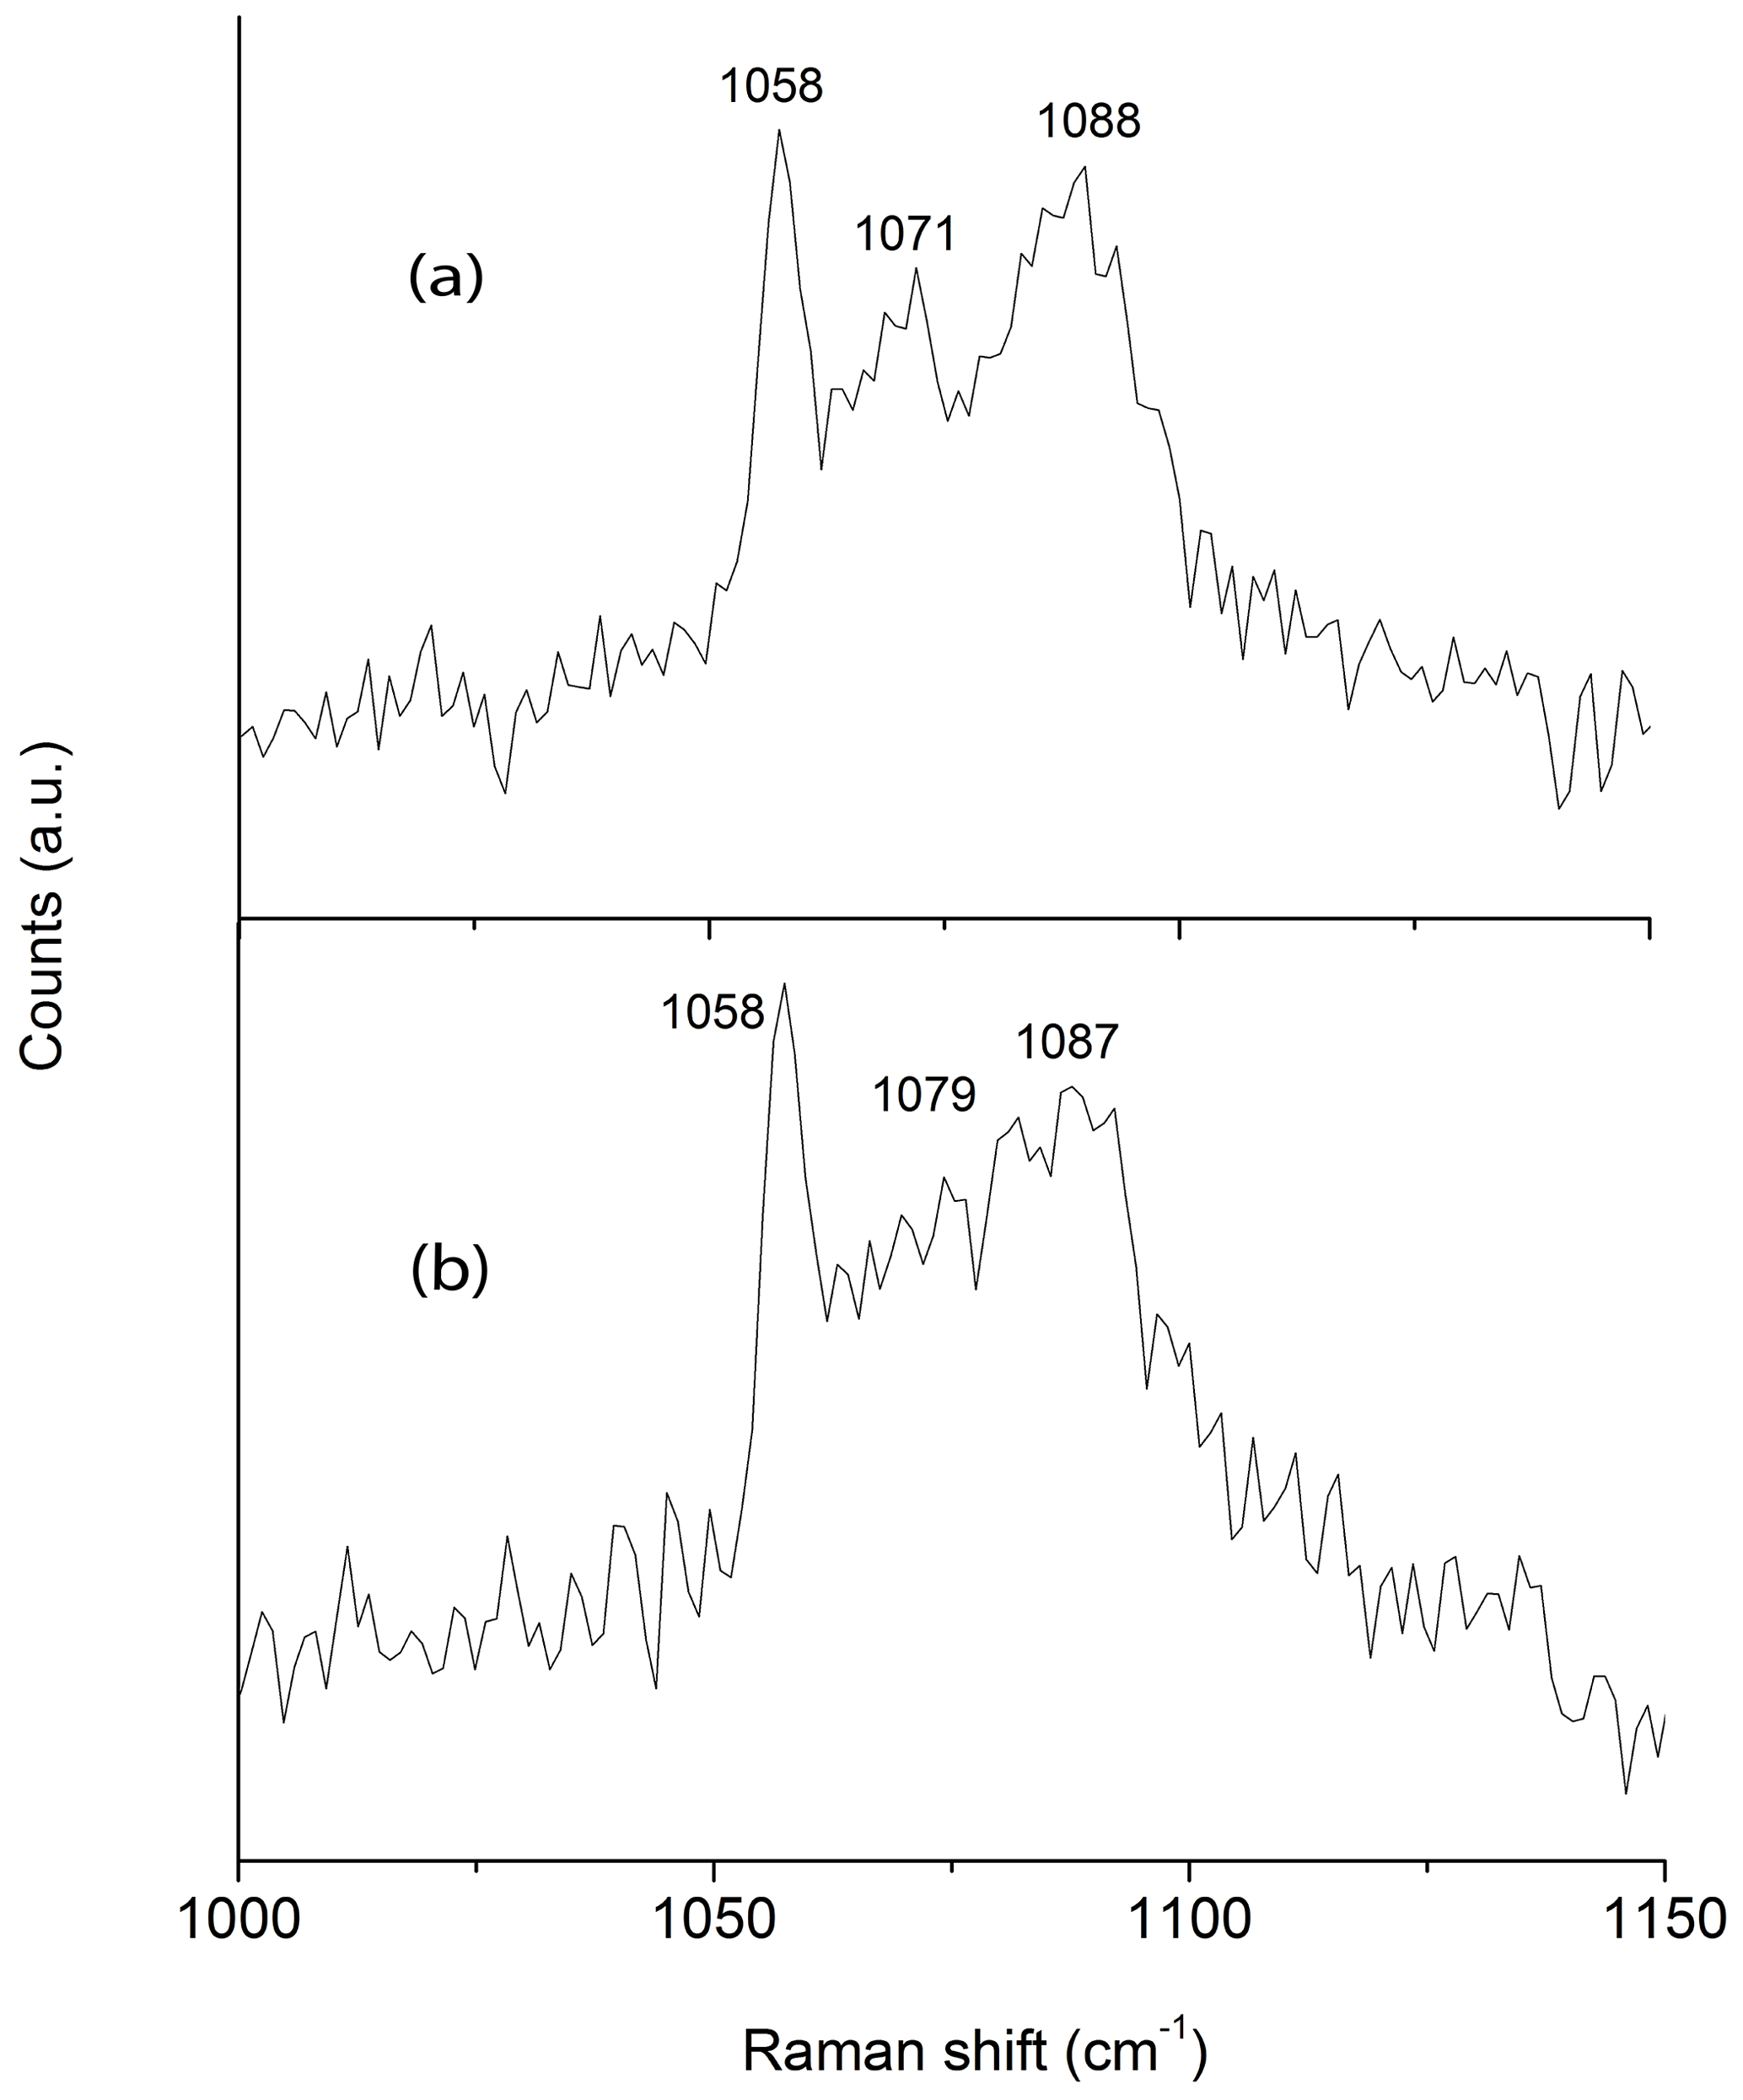
In coincidence with the findings of Wallwork et al. (2002) Raman spectra acquired in different spots showed the presence of three peaks between 1050 and 1100 cm−1 that can be ascribed to (CO3)2− groups in three independent crystallographic positions (Fig. 2). One of the peaks (at 1058 cm−1) is very sharp and probably corresponds to (CO3)2− groups that occur in the ordered part of the decrespignyite-(Y) structure. The peak at 1087–1088 cm−1 is not as sharp, whereas the peak located between them ranges from moderately well defined (Fig. 2a) to very broad (Fig. 2b). By contrast, in the Raman spectrum reported for decrespignyite-(Y) in the RRUFF database (sample R060302, https://rruff.info/decrespignyite/display=default/, last access: 8 October 2020) there is an intensity shift among peaks. Here (in the spectrum measured with a 532 nm laser), the most intense peak is detected at 1071 cm−1, whereas the peak at 1058 cm−1 is just a shoulder. The peak at 1089 cm−1 is quite sharp. It is likely that these differences reflect variations in the degree of order among different samples (and even among different volumes within a single sample), where a more ordered structure produces narrower peaks, possibly enhanced by orientation effects.
Caysichite-(Y) was identified by EMPA in the periphery of the
decrespignyite-(Y) spherules, as radiating aggregates of crystals, of about
10 µm in diameter. Its formula, based on Si + Al = 4.00 apfu (atoms per formula unit), is
Y2.00(Ca1.54Y0.19Er0.05Dy0.05Yb0.04Gd0.04La0.02Nd0.02
Tb0.01Ho0.01)Σ1.98(Si3.95Al0.05)Σ4.00O10(CO3)3(H2O0.55
OH0.45)Σ1.00⋅3H2O (with
C and H calculated from stoichiometry and charge balance). Finally, a few
rounded grains included in the decrespignyite-(Y) aggregates occur; these
grains show only Ce and O by EDS, and they are probably cerianite-(Ce),
ideally Ce4+O2. This is consistent with the highly oxidizing
environment indicated by the low content of Ce3+ in decrespignyite-(Y)
(Wallwork et al., 2002)
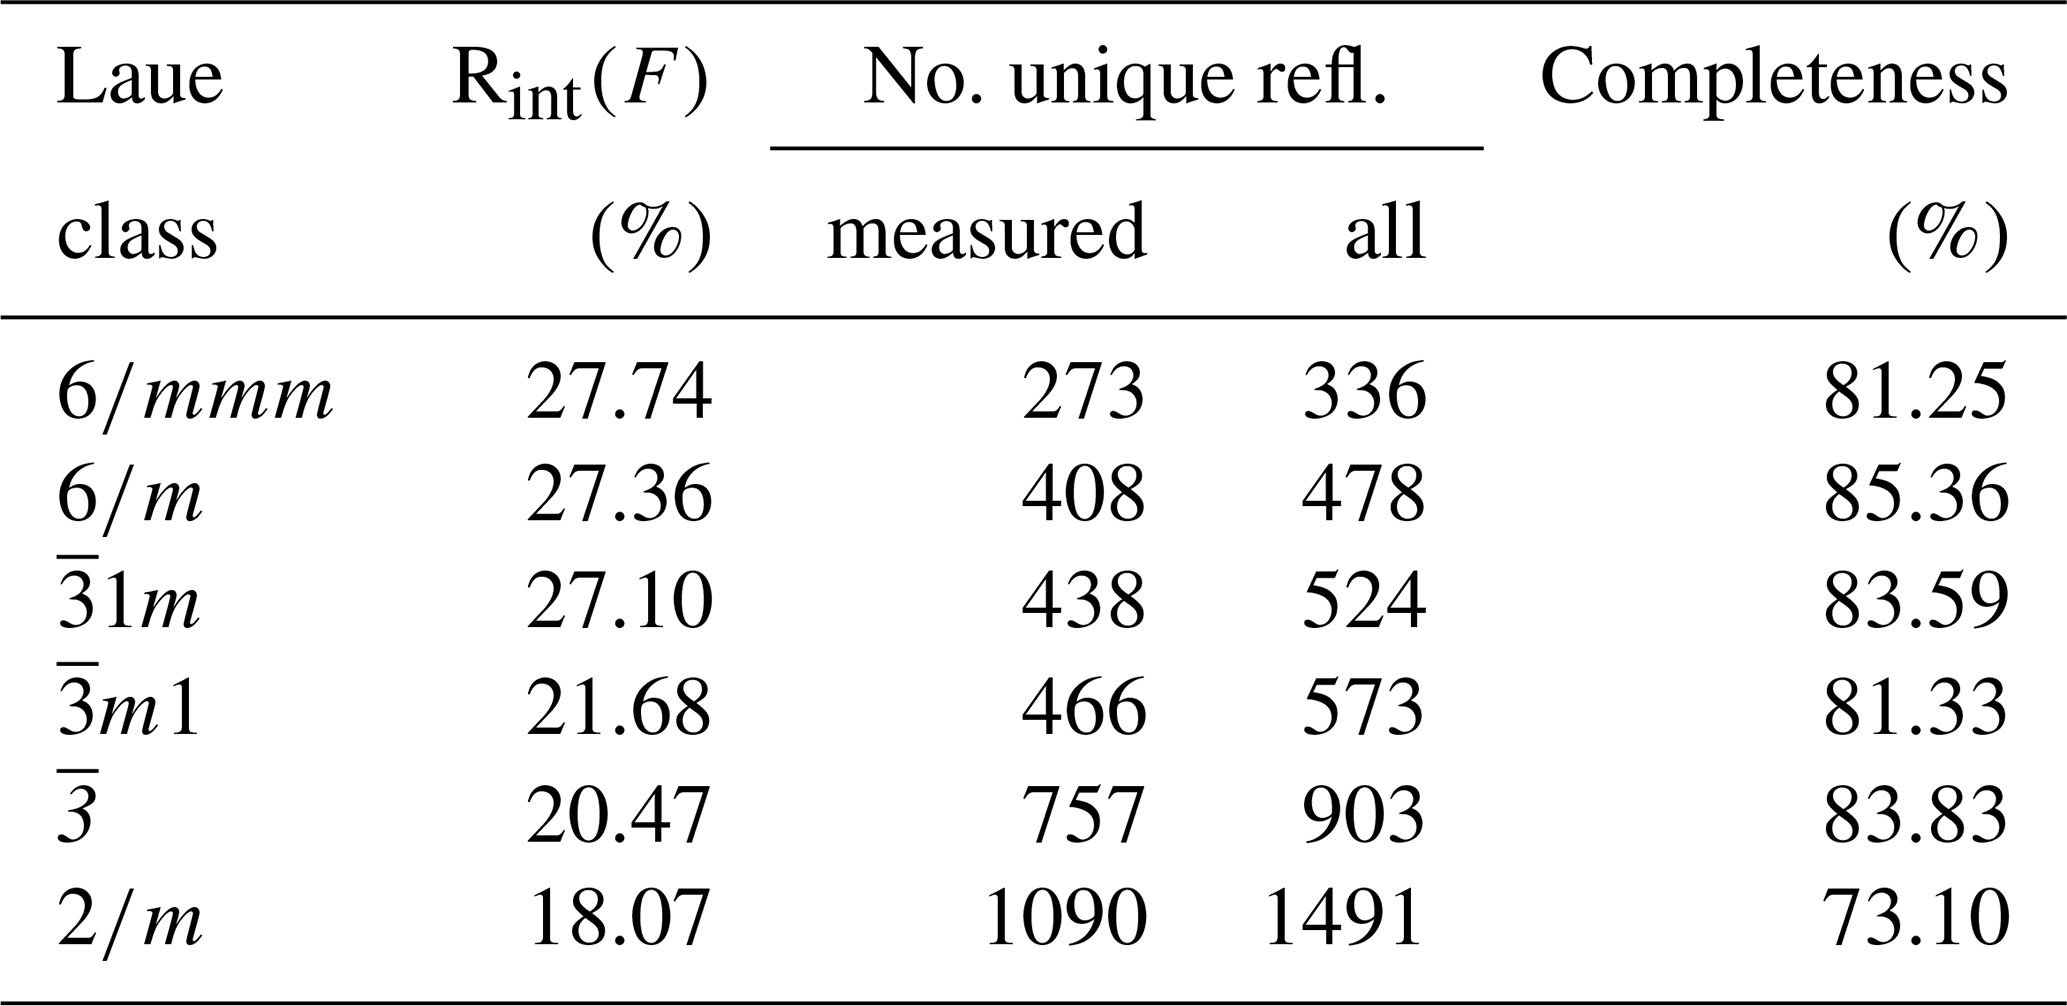
Table 2Laue class analysis of the 3D ED data of DCP1 (dmin=1.05 Å) [].
3.1 Application of δ recycling direct methods to 3D electron diffraction data
The reduction of the 3D ED data of DCP1 was performed with a hexagonal unit cell. Table 2 summarizes the residuals obtained for all Laue classes compatible with the hexagonal metric (and also for 2∕m, for completeness) ordered according to their RintF value (residual among symmetry-equivalent reflections). A clear gap between the first three classes and the last three ones is evident. The RintF variations among the , and 2∕m classes were considered not too significant, owing to the reduction in the number of averaged symmetry-related reflections as symmetry decreases. Consequently, 1, the Laue class with the highest symmetry, was chosen, and since no systematic absences were detected, the centrosymmetric trigonal space group (no. 164) was finally selected for structure solution. In general, phasing of 3D ED data by multisolution δDM is straightforward if data reach atomic resolution (Rius et al., 2013). However, in the case of DCP1, the material suffered a fast deterioration due to dehydration induced by the vacuum inside the transmission electron microscopy (TEM) column and by beam damage. Also, an important diffuse scattering along c* was always observed, which can be again the consequence of structure deterioration or can be related to the occurrence of pervasive stacking disorder in the pristine sample (Fig. 1). Consequently, δDM application supplied multiple solutions with similar figures of merit, being impossible to automatically identify the true one. However, inspection of the final Fourier maps clearly showed that only one subset of solutions containing hexa- and tetranuclear metal clusters joined by two symmetry-independent sets of carbonate anions was chemically sound. This model contains 16 metal sites, i.e., M1 (6×), M2 (6×), M3 (2×) and M4 (2×) plus an additional weaker peak (2×) assigned to a Cl atom (respective Fourier-peak heights were normalized to 1000 and are 1000, 506, 847, 948 and 662), as well as the O ligands O1, O2, O3, O4, O5, O6, O8 and O9 (Fig. 3). The validity of this partial model (the Fourier map region at shows no clear peaks) was checked through a preliminary Rietveld refinement in which the C atoms were added to allow restraining the geometry of the located carbonate anions. At the end of the refinement (Fig. 4a), the input model remained practically unchanged.

Figure 3View of the partial model of DCP1 derived from 3D ED data with atom labeling. The 24 bridging O atoms of each (octahedral) hexanuclear oxo-hydroxo yttrium cluster [Y6(μ6-O)(μ3-OH)8O24] (M1 sites) belong to two sets of symmetry-independent ions: (i) one set (C1) centered along a ternary axis giving rise to layers of hexanuclear clusters and (ii) a second set (C2) connecting (via O5) the octahedral clusters with the cubane-like hetero-tetranuclear clusters formed by 3 M2 (Cu, Y) and 1 M3 (Y, REE) sites. The cubane-like core has 3 μ3-OH (O8) and a chlorine atom (Cl1) replacing the fourth apical one. The probable O2-H⋯Cl1 hydrogen bond (O2⋯Cl1 distance is 3.08 Å) is represented as a single line. For clarity, O1–M1 bonds are not plotted.
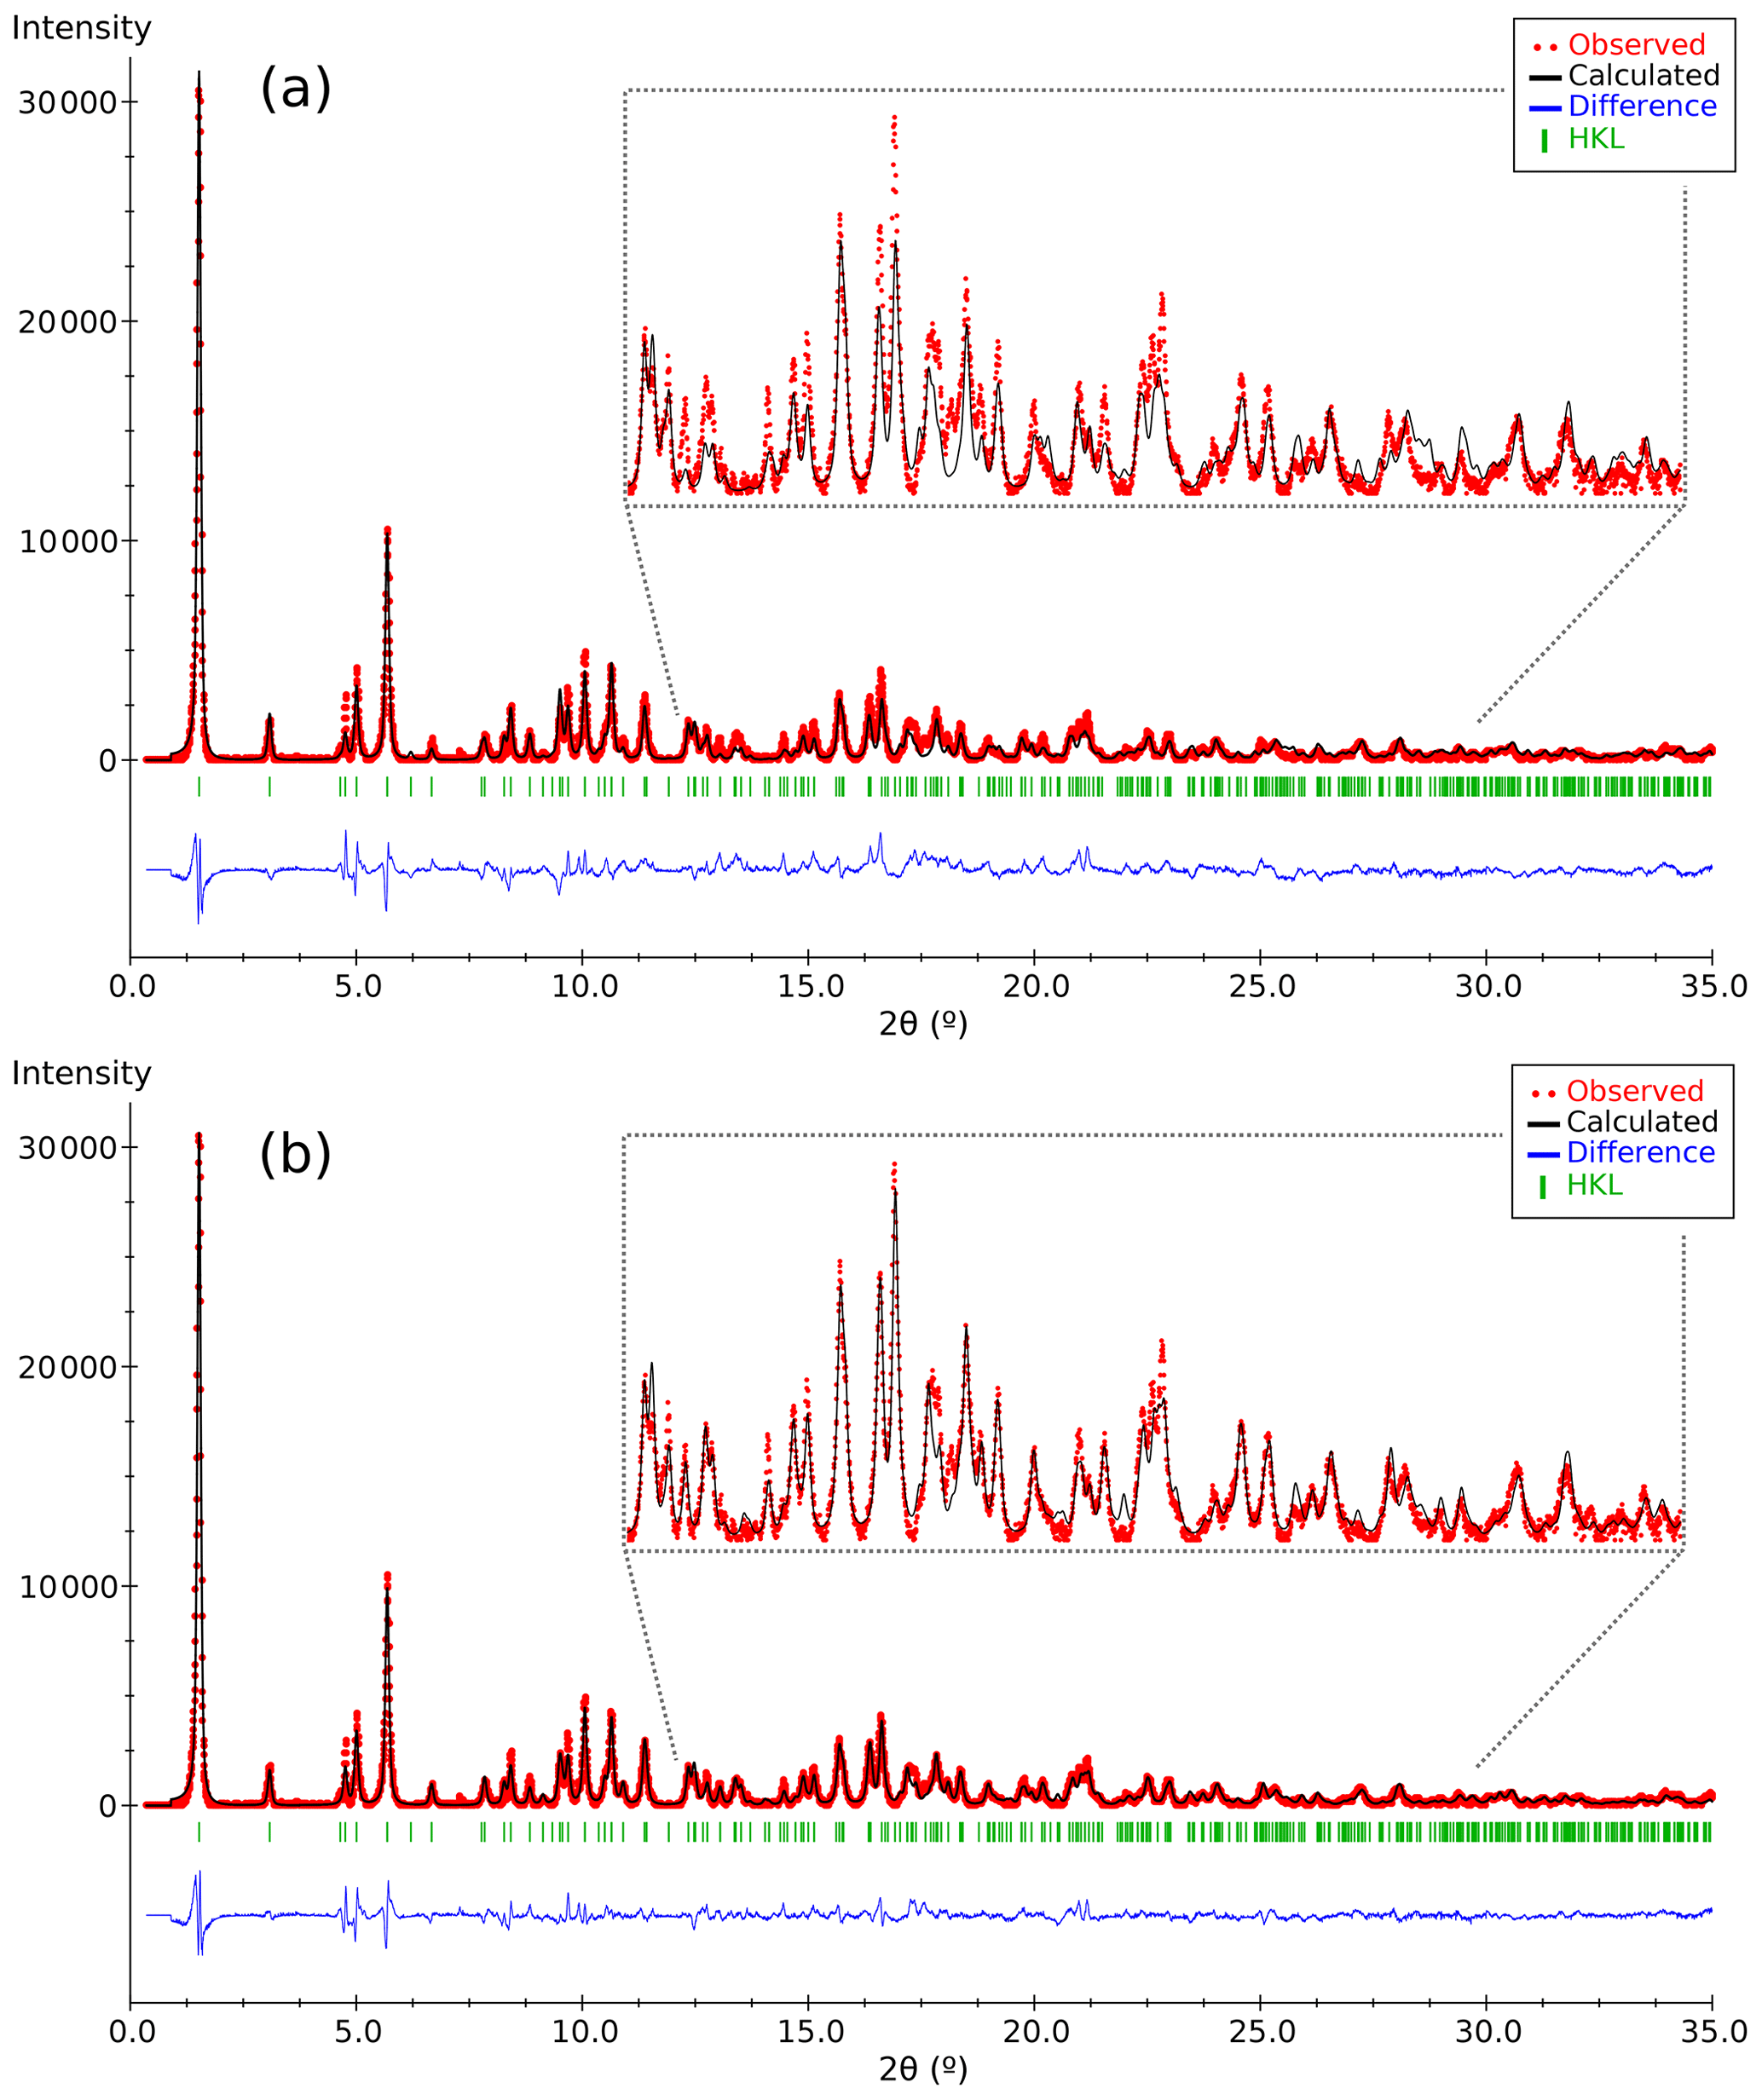
Figure 4Plots of the Rietveld refinement results corresponding to (a) the partial structure model of DCP1 found by 3D ED (Fig. 3) and (b) the final model derived from synchrotron powder diffraction data. Respective χ values ( are 1.62 and 1.20. Observed patterns (red dots), calculated ones (black line) and difference profile (blue bottom line). The vertical markers show the Bragg reflection positions.
This partial model was then combined with the available DCP2 data to get further information on the (CO3)2− ions. Following Wallwork et al. (2002), the expected number of carbonate anions in the unit cell of DCP2 is ≈ 14.3, and the corresponding Raman spectrum shows three strong and narrow bands in the range 1050–1100 cm−1, which were assigned to stretching vibrations of planar carbonate anions, thus indicating at least three sets of symmetry-independent anions; as already mentioned, these bands are also clearly seen in DPC1. Our decrespignyite-(Y) model already explains two sets (with 6× and 2× multiplicities), so that the presence in the empty region of our model of a third set with 6× multiplicity would explain both the 14.3 carbonate anions and the three Raman bands (). In space group 1, the six C atoms of this third set (hereafter C3) can only occupy either the 6i or the 6h positions (respective site symmetries are m and 2). Normalizing the published formula of DCP2 to 14 (CO3)2− ions, it becomes (Y11.65REE2.84Ca0.30Cu4.24)Σ19.03(CO3)14Cl2.64(OH)21.91⋅9.08H2O, with the total number of metal and O atoms adding up to 19 and 71.6, respectively. Consequently, if the 16 metal sites of the partial model are fully occupied, there must be three additional metal atoms in DCP2 (necessarily bonded to the third set of carbonate anions) which can either sit on the two 2d and 1b positions (with respective 3m and site symmetries) or occupy the 3f position (site symmetry is 2∕m).
3.2 Model refinement using synchrotron X-ray powder diffraction data
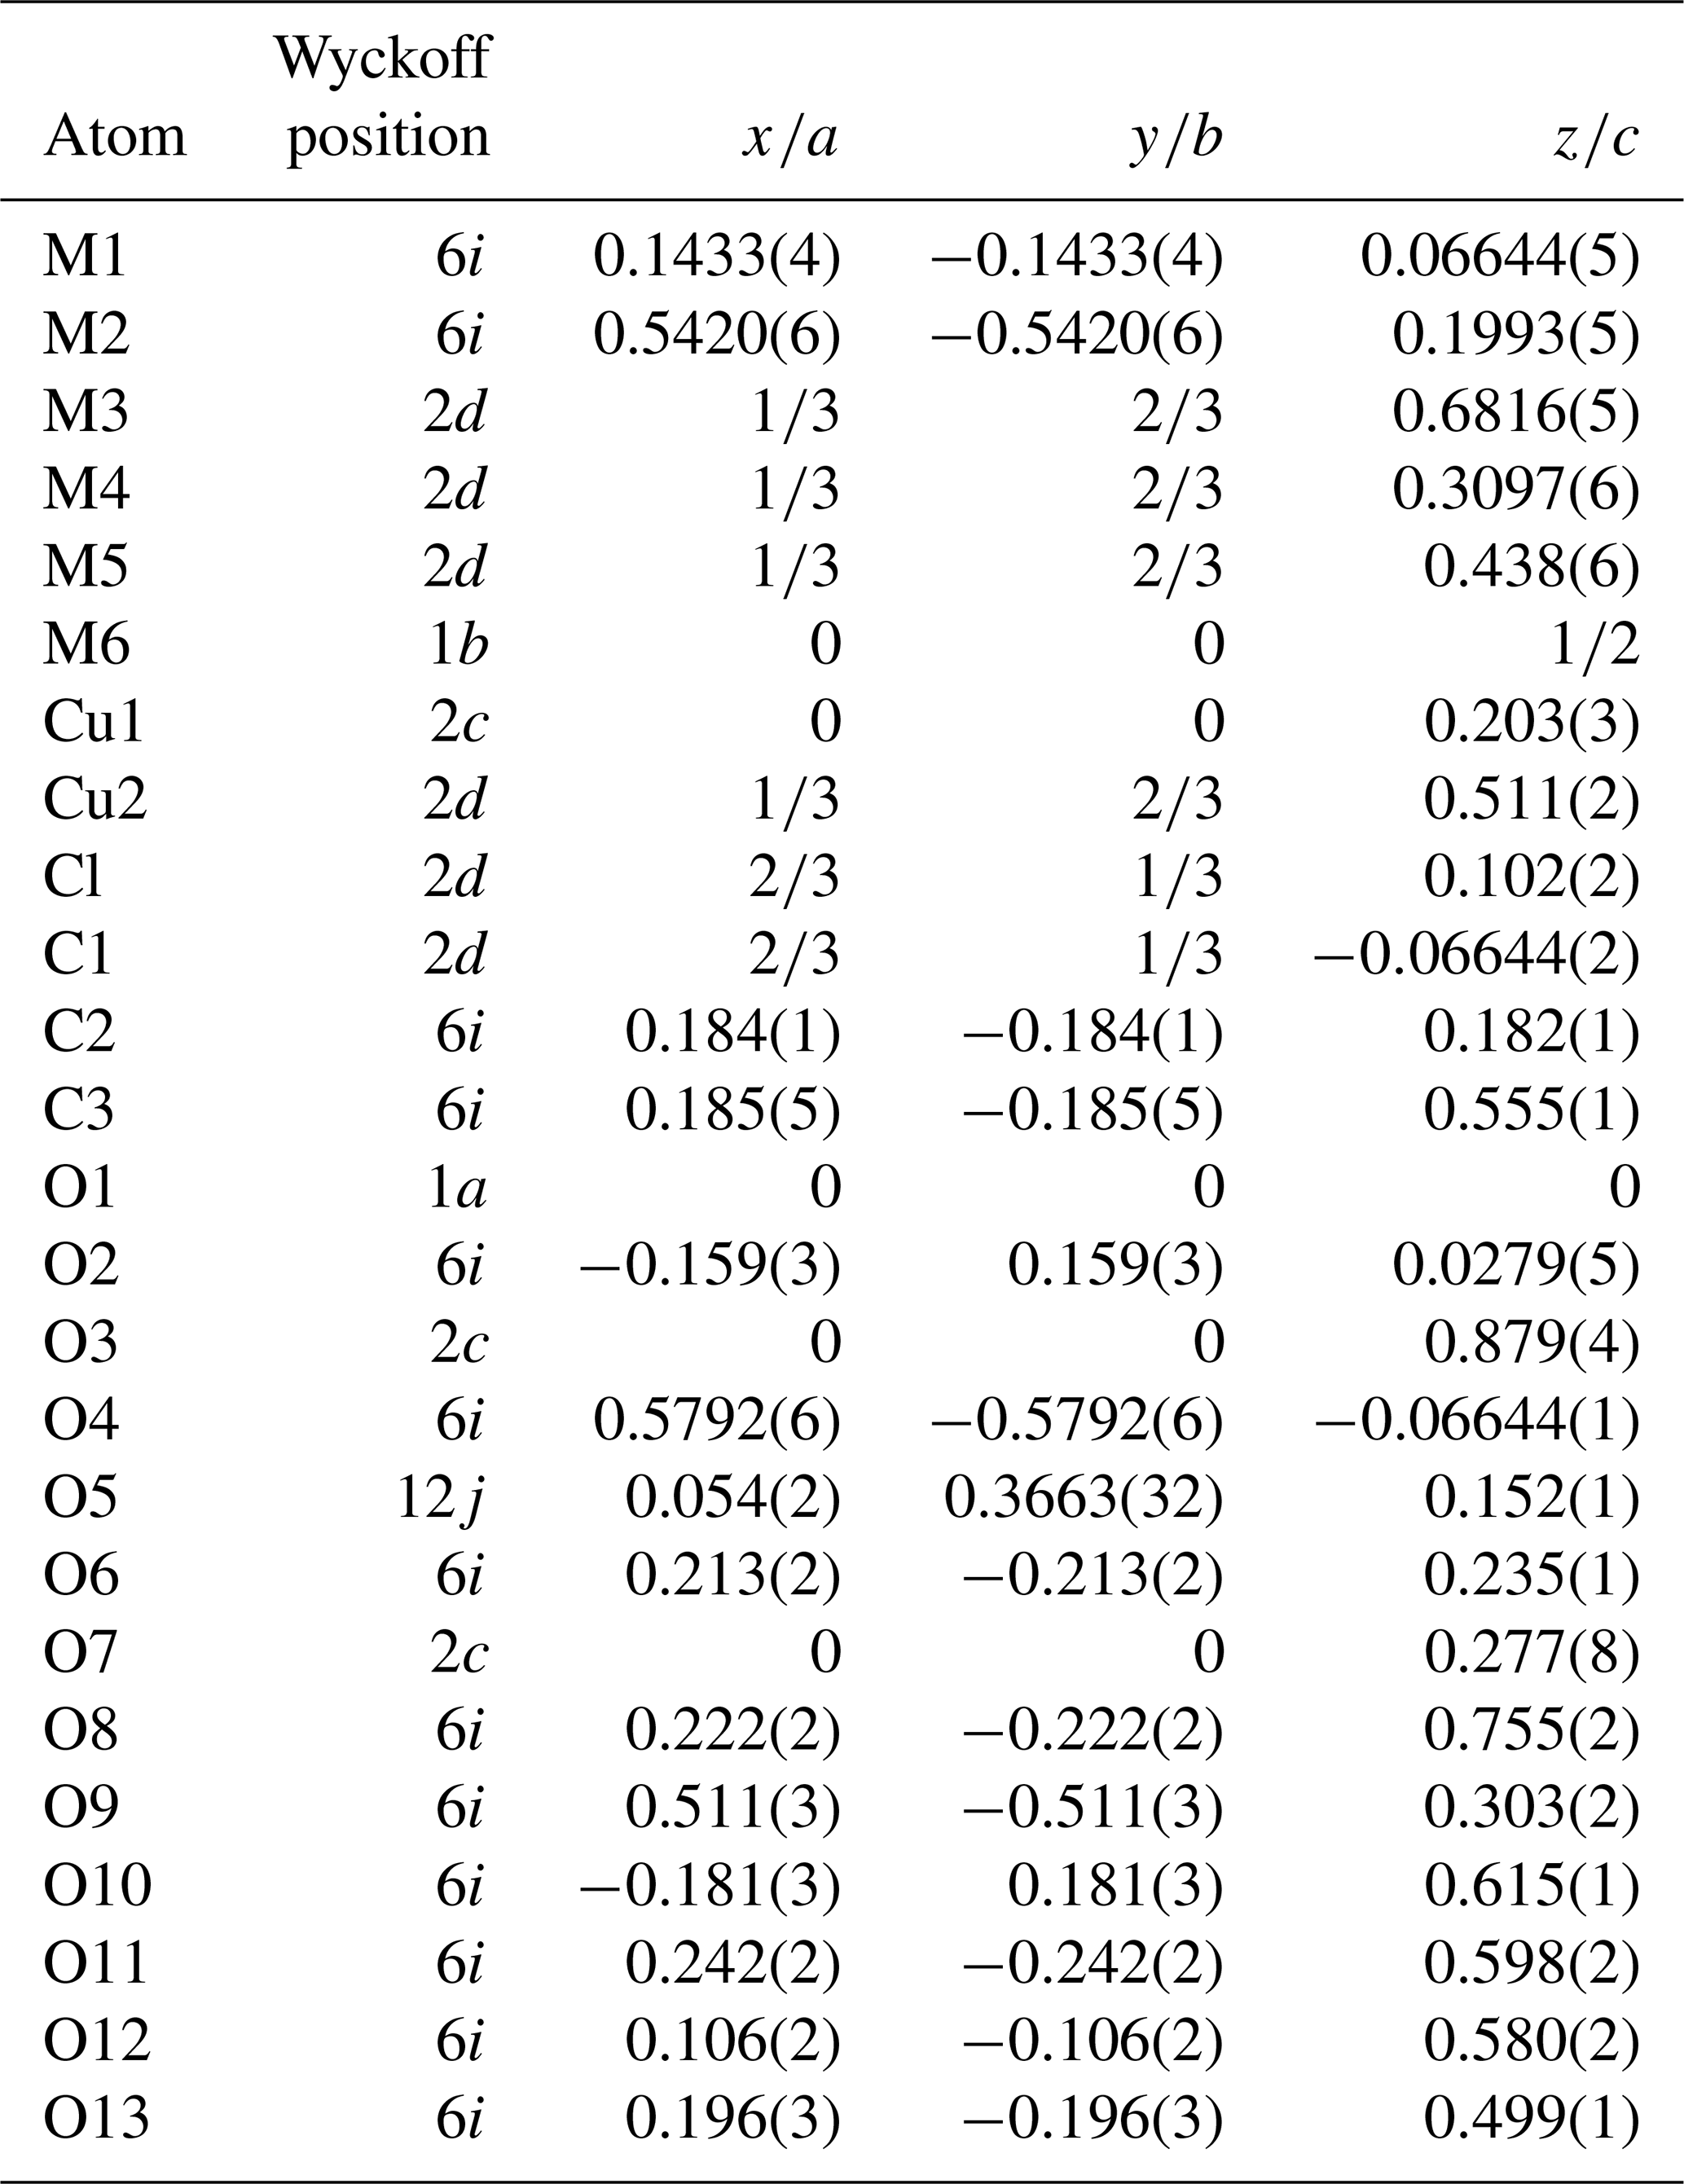
The refinement was performed with RIBOLS (Rius, 2012b) in (no. 164). Due to the severe limitations imposed by the sample quality (stacking disorder combined with small crystallite size) and large c parameter [22.7226(13) Å], it was difficult to determine accurate interatomic distances from powder data. This limitation, however, did not hamper finding the approximate structural model of DCP1. To minimize the bias that inaccurate restraints involving disordered positions would introduce in the Rietveld refinement, restraints were applied only to polyhedra showing less variable geometries. These are (i) the internal distances (C-O; O⋯O) of the two symmetry-independent carbonate anions, C1 and C2; (ii) the planarity of the C1 carbonate anion, which was forced to lie on the plane described by the three closest M(1) sites; and (iii) the shortest M1-O2 distance of the octahedral Y cluster which was restrained to 2.16(3) Å (this restraint was introduced once confirmed that the unrestrained refinements always gave a distance between 2.14 and 2.18 Å). During the refinement, besides the Fourier peaks of the initial model, several new peaks assigned to sites M5, M6, Cu1 and Cu2 (all of them with low occupations) and to atoms O11, O12 and O13 were identified (Fig. 5). These three O atoms form a triangle consistent with a carbonate anion having its C atom (C3) on a mirror plane (6i position), so that the position of C3 could be calculated. This allowed introducing as additional restraint the C-O distance of the C3 carbonate anion (the C3 site was assumed to be fully occupied). The respective refined scattering powers (s.p.'s) in electrons (e) in the metal sites M1, M2, M3, M4, M5, M6, Cu1 and Cu2 are 39 (fixed), 32.3(4), 49.6(6), 41.0(7), 3.8(7), 6.8(7), 9.2(6) and 10.2(8), which yields a total of 662.2 e in the metal sites and allows scaling the atomic proportions from EMPA to Y10.35REE1.43Ca.52Cu5.31Cl2.21 (average atomic number of REE in DCP1 is 65.7 e, calculated from EMPA data). That the REE content (other than Y) in M1 cannot be significant was confirmed by the similarity between the refined individual atomic displacement parameter of M1 (Y) and the overall one [1.1 vs. 1.2(1) Å2]. Additional features are (i) the refinement of the s.p. of O7 to 3.8(7) e and (ii) the marked R value improvement when changing the s.p. of O10 from 8 to 10 e (which is consistent with its role as an H2O molecule). Site occupancies were modeled using Y at M1, M3, M4, M5 and M6, while a mixed occupancy by Cu and Y was used to model the s.p. at site M2. The figures of merit in the final refinement for 48 structural parameters are Rwp=0.94 % (Langford and Louër, 1996), Rp=0.62 % and χ (, corresponding to the (Y10.35REE1.43Ca0.52Cu5.31)Σ17.61(CO3)14Cl2.21 (OH)16.79⋅18.35H2O structural formula. The final atomic coordinates are listed in Table 3, and the corresponding Rietveld plot is given in Fig. 4b.
Table 3Final atomic coordinates of DCP1 obtained from Rietveld refinement with standard uncertainties in parentheses. Overall B value: 1.2(1) Å2.
The crystal structure of decrespignyite-(Y) shows layers of polyhedra perpendicular to [001]. The layer sequence is M1 – (M2 + Cu1) – (M3 + M4) – (M5 + M6 + Cu2) – (M3 + M4) – (M2 + Cu1) – M1 (Fig. 5). When cation sites in M2 and M3 (but not M4) are considered together, they define a tetranuclear complex which will be treated as a single unit. The plane defined by (M5 + M6 + Cu2) is kinked. As described below, many of these sites show partial occupancies, in part due to the short distances that preclude simultaneous occupation of both sites. Carbonate anions are oriented either normally (C1) or tilted (C2 and C3) with respect to [001]. In the structural model presented here, the space between the planes defined by (M3 + M4) and (M5 + M6 + Cu2) is less densely populated, making it a suitable location for at least some of the disordered H2O molecules.
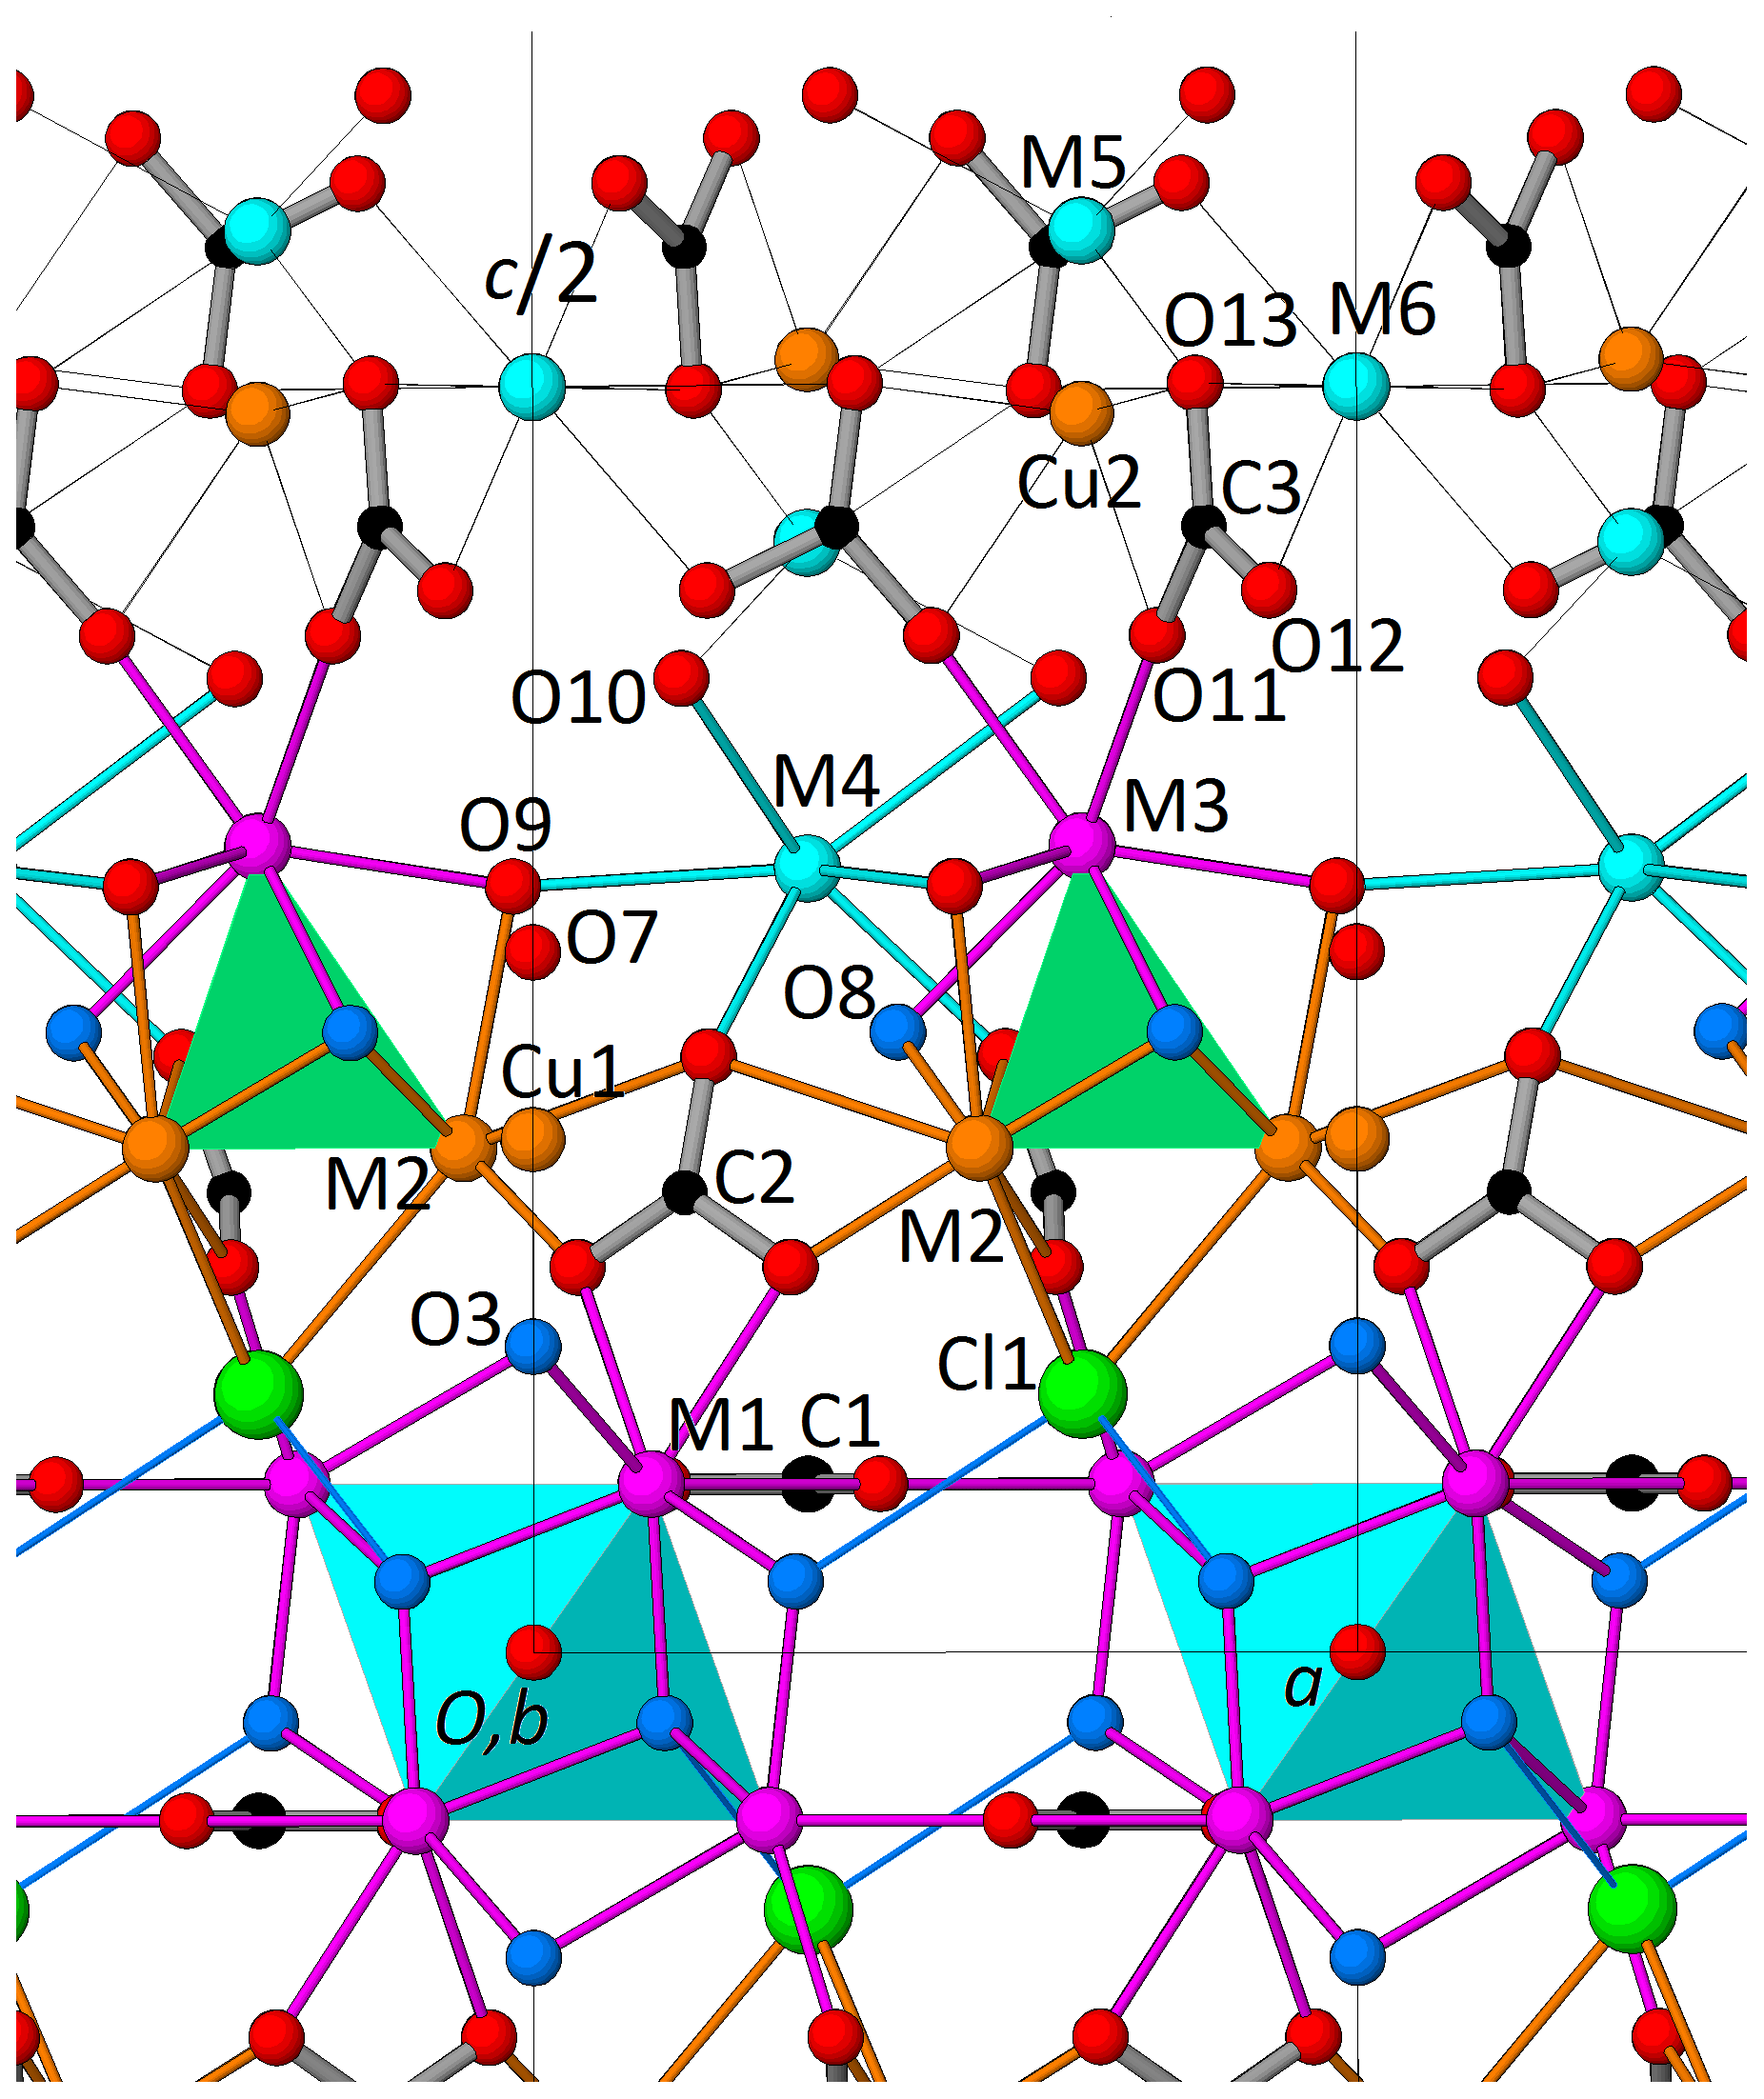
Figure 5Perspective view along b of approximately half the unit cell of DCP1 (as obtained from the Rietveld refinement) showing (i) the coordination of sites M3 and M4 (both capped trigonal prisms); (ii) the dual behavior of O3, either as part of a hydroxyl group (68 %) or as ligand of the linearly coordinated Cu atom (32 %), i.e., O3-Cu1-O7; and (iii) the C3 carbonate anions (at z∼0.44 and 0.56) and the partially occupied metal positions (Cu2, M5 and M6) between two consecutive M3 + M4 layers (at z∼0.30 and 0.70). Sites M5 and Cu2 are too close (∼ 1.64 Å) to be simultaneously filled and therefore can only host a maximum of 2 atoms. For its part, M6 (at ) can coexist either with M5 or with Cu2 (respective distances are ∼ 5.13 and ∼ 4.94 Å), so that the maximum total number of metal atoms in Cu2, M5 and M6 is 3; in DCP1, the resulting number is ∼ 1 atom (, Table 4), so that some additional protons should most probably be present.
Table 4Metal distribution in DCP1 derived from EMPA and from synchrotron powder diffraction data. The average atomic number of REE is 65.7 (scattering powers, s.p.'s, are given in electrons). Numbers in bold correspond to sites with low occupancy.
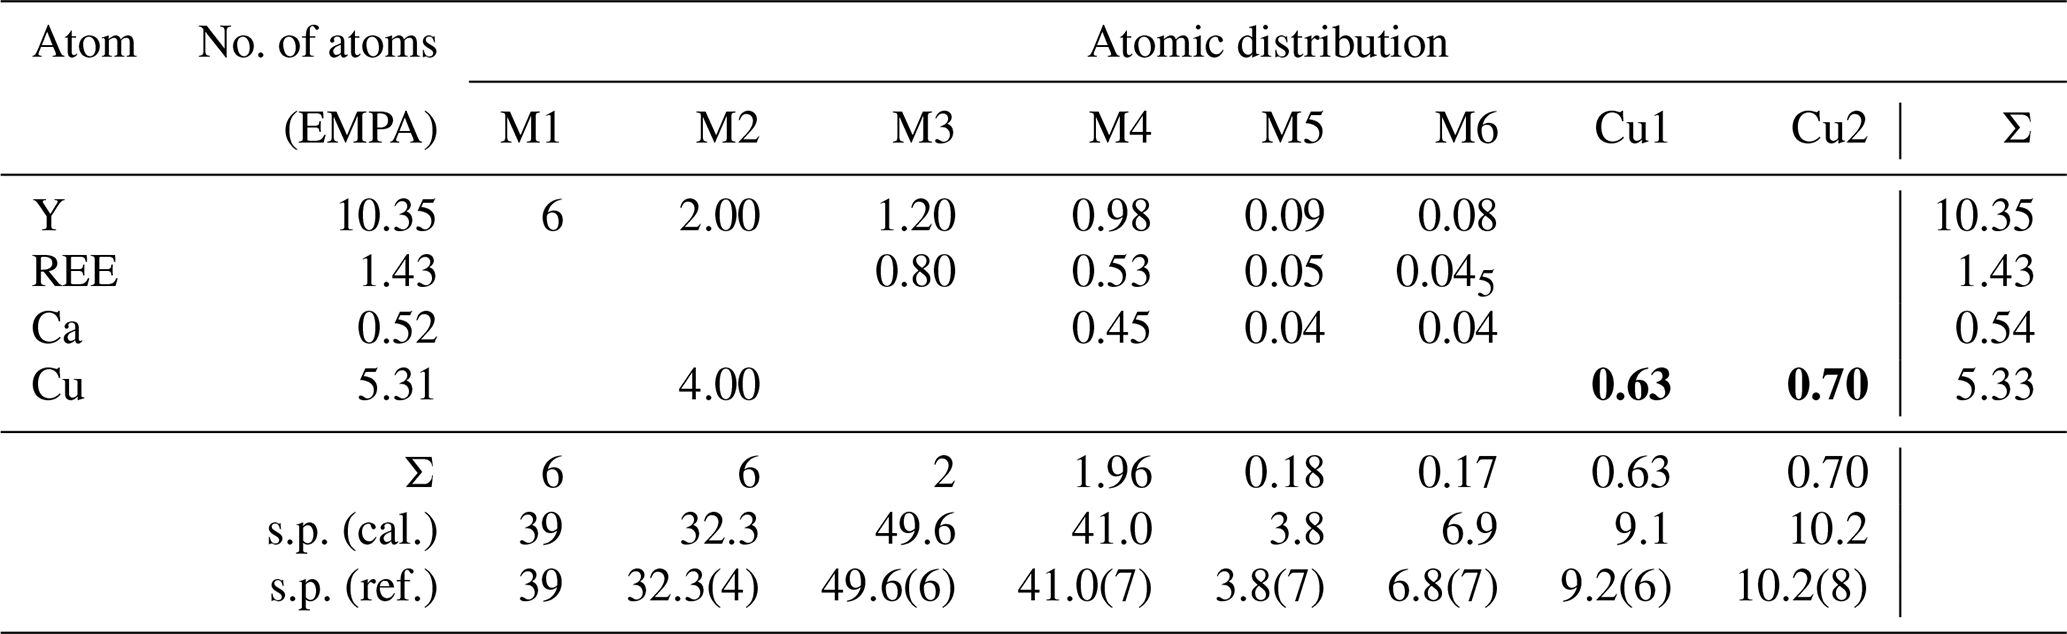
The metal distribution along the different sites derived from EMPA and from the Rietveld analysis is given in Table 4. As shown in Fig. 5, there is, centered at the origin, the octahedral Y cluster generated by the M1 site (at z≈0.07) and its related partially occupied Cu1 position at z≈0.30. The M2 site with shared occupation by Cu and Y atoms is found at z≈0.20. The M3 and M4 sites have same coordination types (a capped trigonal prism) and form a layer at z≈0.30. While M3 is occupied exclusively by REE and Y atoms, M4 also hosts some Ca. The distance between the M4 and M5 sites at z≈0.44 is 2.94 Å. This apparently too short distance is a consequence of the low occupation (≈9 %) of M5; i.e., the refined M4 position predominantly corresponds to the situation where M5 is empty. Finally, sites M6 and Cu2 (both at z≈0.5) and site M5 are the partially occupied metal sites in the more disordered part of the structure.
4.1 The hexanuclear Y complex: the M1 and Cu1 sites
The M1 site forms a hexanuclear oxo-hydroxo yttrium cluster similar to that found for Nd by Wang et al. (2000) with formula [Nd6(μ6-O)(μ3-OH)8(H2O)24]. In addition to the replacement of Nd by Y, the main difference between both clusters is the substitution of the four water molecules bound to one Y by the four bridging O atoms belonging to two carbonate anions, i.e., O4 (2×) and O5 (2×), at expected approximate bond lengths of 2.42 Å. The two symmetry-independent carbonate anions to which each octahedral Y cluster is connected have their molecular planes oriented either normally, C1, or tilted with respect the threefold axis, C2. The former are responsible for the propagation of the octahedral Y clusters along the z=0 plane (each carbonate anion belongs to three such clusters), thus producing a layer of octahedral Y clusters (Fig. 5). Since each bridging O atom transfers 0.33 valence units to the Y atom (corresponding to an Y-O bond length of 2.42 Å), and since the respective formal charges of the μ6-O atom (O1) and the 8 μ3-OH anions (O2 and O3) are 2- and 1-, the resulting charge balance of the cluster is neutral, i.e., negative charges, that compensate for the 18 positive ones of the 6 Y3+ ions. In DCP1, however, the distances from each M1 to the four closest μ3-OH are not equal. The refined values indicate a significant shortening of one distance, namely M1-O2 ≅ 2.16 Å. This shortening causes an excess positive charge at O2 which is transferred by H bonding to the neighboring Cl1 chlorine atom. (Refined distances of M1 to the nine O ligands: 2.60(1) to O1, 2.41(2) to O22a (2×), 2.16(2) to O22b, 2.45(8) to O3, 2.44(1) to O4 (2×) and 2.32(4) Å to O5 (2×); a: −y, x–y, z; b: −x, −y, −z).
From the refinement it follows that the O3 atom can play a dual role: as part of a hydroxyl group in approximately 68 % of the cases or as a ligand of the linearly coordinated Cu atom in the remaining cases, i.e., O3-Cu1-O7 with O7 having one negative charge (respective refined Cu1-O3 and Cu1-O7 bond lengths are 1.9(1) and 1.7(2) Å). According to its s.p. value, the occupation of O7 is 48(9) %, which is slightly higher than that of Cu1, 32(2) %. This discrepancy could be ascribed to some Cl− replacing O7.
4.2 The tetranuclear complex: the M2 and M3 (as well as Cu2) sites
Besides the octahedral Y clusters, DCP1 also contains tetranuclear complexes formed by the M2 (3×) and M3 sites (Fig. 5). It is known that both REE and Cu2+ can produce clusters with cubane-like core structures of type [REE4(μ3-OH)4]8+ (Plakatouras et al., 1994; Xiao-Ming et al., 1997) and [Cu4(μ3-OH)4]4+ (Dedert et al., 1982; Sletten et al., 1990). In DCP1 the cubane-like core has 3 μ3-OH (O8) and a chlorine atom (Cl1) replacing the fourth apical one. The refined M2⋯M2 and M2⋯M3 distances are ∼ 3.20 Å (3×) and ∼ 3.28 Å (3×), respectively. The refined s.p., 32.3(4) e in site M2 indicates a shared occupancy by Cu (∼ 67 %) and Y (∼ 33 %) atoms. The coordination of the Cu2+ ion is a distorted octahedron with four ligands in planar configuration, i.e., O5 (2×) at 2.02(4) Å and the O8 hydroxyl group (2×) at 2.04(5) Å, and two more distant apical ones, O9 at 2.39(5) and Cl1 at 2.88(4) Å. The coordination of the Y3+ ion is eightfold; i.e., in addition to the ligands of Cu2+, Y3+ is also bonded to two O6 ligands (at 2.81(3) Å) of C2 carbonate anions (Fig. 3). Due to the different ionic sizes and charges of Y and Cu, only when M2 hosts the larger Y3+ ion can the O8 hydroxyl group form an H bond with O7. This mechanism explains why the refined occupations of Cu1 (32 %) and of Y at M2 (33 %) are similar and, in addition, helps to understand why M2 can host both divalent and trivalent cations. Like the M2 site, M3 also has shared occupation. The composition which results from its refined s.p. value (∼ 49.6 e) is Y (∼ 60 %) + REE (∼ 40 %). The coordination polyhedron of M3 is a capped trigonal prism formed by ligands O8 at 2.35(5) (3×), O9 at 2.32(5) and O11 at 2.33(5) Å.
The Cu content of Cu in DCP1 amounts to 5.31 atoms in the unit cell distributed among sites M2 and Cu1 (4 and 0.63 atoms). Consequently, the number of unallocated Cu atoms is 0.68. From all partially occupied sites, only the Cu2 position has the required number of atoms, 0.70 (derived from its refined s.p.) (Table 4). The coordination polyhedron of Cu2 is formed by ligands O13 at 2.06(7) (3×) and O11 at 2.41(5) Å (3×).
4.3 Sites M4, M5 and M6
Once the total atomic content in sites M1, M2, M3, Cu1 and Cu2 is fixed, the remaining 1.15 Y, 0.63 REE and 0.52 Ca atoms have to be placed among the M4, M5 and M6 sites. By assuming that these three sites (all three not belonging to clusters) have no marked preferences for Y, REE or Ca, the occupations of the average atom (∼ 50 %Y + ∼ 27 % REE + ∼ 23 % Ca) can be calculated from the corresponding site s.p.'s, yielding ∼ 98 % for M4, ∼ 9 % for M5 and ∼ 16 % for M6; i.e., site M4 may be regarded as full (Table 4). The coordination polyhedron of M4 is formed by ligands O6 at 2.45(4) (3×), O9 at 2.65(5) (3×), and O10 at 2.83(4) Å (3×) and corresponds to a capped trigonal prism like M3 but ∼ 13 % larger (M4 hosts ∼ 23 % Ca2+). Regarding sites M5 and Cu2, these are too close (∼ 1.64 Å) to be simultaneously occupied (Fig. 5). Their distances to the O ligands are M5-O10 = 2.6(2) (3×), M5-O13 = 2.5(2) Å (3×) and M6-O12 = 2.41(6) (6×) and M6-O13 = 2.90(4) Å (6×).
4.4 Comparison of samples DCP1 and DCP2
According to the present study the unit cell formula of DCP1 is (Y10.35REE1.43Ca0.52Cu5.31)Σ17.61(CO3)14Cl2.21(OH)16.79⋅18.35H2O (Dc=3.51 g cm−3); i.e., it contains a total of 77.1 O atoms, from which have been considered in the refinement (this number also includes the six O10 atoms clearly identified as H2O molecules). The difference of ∼ 8 O atoms should correspond to disordered H2O molecules. For DCP2, the corresponding number of metal and Cl atoms (also based on 14 ions) is Y11.65REE2.84Ca0.30Cu4.24 and Cl2.64. Whereas in DCP1 the 5.31 Cu atoms are distributed among sites M2, Cu1 and Cu2 (∼ 4, ∼ 0.63 and ∼ 0.70, respectively), in DCP2, due to the lower Cu content (4.24 atoms), Cu1 (with O7) and Cu2 should be vacant. Consequently, sites M5 (2d) and M6 (1b) can be occupied by three (Y, REE, Ca) atoms. Also, the role played by O7 in DCP1, i.e., the H bonding between O8 and O7, could be assumed by some Cl−. Consequently, a higher Cl content should be expected in DCP2 compared to DCP1, which is indeed the case, i.e., 2.6 vs. 2.2 atoms.
Wallwork et al. (2002) proposed that decrespignyite-(Y) should have a layered structure and that groups should not be oriented in a parallel fashion (regardless of their orientation with respect to symmetry elements), by analogy with other REE minerals with low birefringence. They speculated that decrespignyite-(Y) might share more structural features with kamphaugite-(Y) than with bastnäsite-(Ce). Our findings confirm their clever deductions.
Although the present study has been performed assuming trigonal symmetry, we also consider it possible that the real symmetry is monoclinic, as discussed before. The available dataset does not allow a robust refinement in a lower symmetry, but some aspects of the crystal structure (such as the shared occupancy of site M2 by Cu and Y atoms) suggest that the atomic positions may actually be independent, each with its own particular coordination environment. In addition to that, several atomic positions (such as M5 and M6) are partially vacant, and that involves a local rearrangement (plus possibly protonation) in order to maintain the local charge balance. All this contributes to some diffuse electron density that cannot be adequately modeled.
Our study indicates that, in several sites, occupancy by a particular cation must be coupled with the entry of another element in a nearby site, thus inducing short-range order. There is a possibility that our sample and that studied by Wallwork et al. (2002) do not represent strictly the same species, as their chemical formulae are related to each other (possibly forming a continuum) but not the same. However, as the crystal structure of the sample studied by Wallwork et al. (2002) remains unknown, and because of the fact that some important information (like the precise amount of H2O and its speciation) is not known with high precision, it is more reasonable to wait until more information becomes available before drawing a limit. Since the structure of decrespignyite-(Y) represents a novel type, it has been described here in spite of the aforementioned shortcomings, hoping that better specimens are found in the future to allow the elucidation of finer details.
The experimental synchrotron powder diffraction pattern of decrespignyite (DCP1) and the output of the last Rietveld refinement are included in the Supplement.
The supplement related to this article is available online at: https://doi.org/10.5194/ejm-32-545-2020-supplement.
FC performed the electron microprobe analyses, the sample description and the interpretation of the Raman spectra. EM and MG carried out the 3D electron diffraction experiments and the subsequent data reduction. OV performed the synchrotron powder diffraction experiments and the subsequent data reduction. XT carried out the crystal structure refinement from X-ray diffraction data. JR solved the decrespignyite structure by applying direct methods to 3D electron and powder diffraction data and unified the contributions of the different co-authors into a publication.
The authors declare that they have no conflict of interest.
We acknowledge the kindly assistance of Graciela Lacconi (LANN) with the acquisition of the Raman spectrum. The review work of Taras L. Panikorovskii and Allan Pring is greatly appreciated.
This research received financial support from the Spanish MINECO (project RTI2018-098537-B-C21), from FEDER and from the European Union Fund for Regional Development POCTEFA (grant no. EFA 194/16 TNSI).
We acknowledge support for the publication fee from the CSIC Open Access Publication Support Initiative through its Unit of Information Resources for Research (URICI).
This paper was edited by Sergey Krivovichev and reviewed by Taras Panikorovskii and Alan Pring.
Andrusenko, I., Krysiak, Y., Mugnaioli, E., Gorelik, T. E., Nihtianova, D., and Kolb, U.: Structural insights into M2O–Al2O3–WO3 (M= Na, K) system by electron diffraction tomography, Acta Crystall. B-Stru., 71, 349–357, https://doi.org/10.1107/S2052520615007994, 2015.
Camalli, M., Carrozzini, B., Cascarano, G. L., and Giacovazzo, C.: Automated determination of the extinction symbol via electron diffraction data, J. Appl. Crystall., 45, 351–356, https://doi.org/10.1107/S0021889812003317, 2012.
Capitani, G. C., Mugnaioli, E., Rius, J., Gentile, P., Catelani, T., Lucotti, A., and Kolb, U.: The Bi sulfates from the Alfenza Mine, Crodo, Italy: An automatic electron diffraction tomography (ADT) study, Am. Mineral., 99, 500–510, https://doi.org/10.2138/am.2014.4446, 2014.
Dedert, P. L., Sorrell, T., Marks, T. J., and Ibers, J. A.: Oxygenation of [tris (2-pyridyl) amine](trifluoromethanesulfonato) copper (I) in nonaqueous solvents. Synthesis and structural characterization of the cubane-like cluster Cu4(OH)4(SO3CF3)2[N(C5H4N)3]4] [SO3CF3]2. C3H6O, Inorg. Chem., 21, 3506–3517, https://doi.org/10.1021/ic00139a047, 1982.
Fauth, F., Peral, I., Popescu, C., and Knapp, M.: The new Material Science Powder Diffraction beamline at ALBA Synchrotron, Powder Diffr., 28, S360–S370, https://doi.org/10.1017/S0885715613000900, 2013.
Gemmi, M., La Placa, M. G., Galanis, A. S., Rauch, E. F., and Nicolopoulos, S.: Fast electron diffraction tomography, J. Appl. Crystall., 48, 718–727, https://doi.org/10.1107/S1600576715004604, 2015.
Gemmi, M., Mugnaioli, E., Gorelik, T. E., Kolb, U., Palatinus, L., Boullay, P., and Hovmöller, S.: 3D Electron Diffraction: The Nanocrystallography Revolution, ACS Cent. Sci., 5, 1315–1329, https://doi.org/10.1021/acscentsci.9b00394, 2019.
Hogarth, D. D., Chao, G. Y., Plant, G. A., and Steacy, H. R.: Caysichite, a new silico-carbonate of yttrium and calcium, Can. Mineral., 12, 293–298, available at: https://rruff-2.geo.arizona.edu/uploads/CM12_293.pdf (last access: 8 October 2020), 1974.
Kolb, U., Gorelik, T., Kübel, C., Otten, M. T., and Hubert, D.: Towards automated diffraction tomography: Part I – Data acquisition, Ultramicroscopy, 107, 507–513, https://doi.org/10.1016/j.ultramic.2006.10.007, 2007.
Kolb, U., Gorelik, T., and Otten, M. T.: Towards automated diffraction tomography. Part II – Cell parameter determination, Ultramicroscopy, 108, 763–772, https://doi.org/10.1016/j.ultramic.2007.12.002, 2008.
Kolb, U., Mugnaioli, E., and Gorelik, T. E.: Automated electron diffraction tomography – a new tool for nano crystal structure analysis, Cryst. Res. Technol., 46, 542–554, https://doi.org/10.1002/crat.201100036, 2011.
Langford, J. I. and Louer, D.: Powder diffraction, Reports on Progress in Physics, 59, 131, https://doi.org/10.1088/0034-4885/59/2/002, 1996.
León-Reina, L., Cabeza, A., Rius, J., Maireles-Torres, P., Alba-Rubio, A. C., and Granados, M. L.: Structural and surface study of calcium glyceroxide, an active phase for biodiesel production under heterogeneous catalysis, J. Catalysis, 300, 30–36, https://doi.org/10.1016/j.jcat.2012.12.016, 2013.
Majzlan, J., Palatinus, L., and Plášil, J.: Crystal structure of Fe2(AsO4)(HAsO4)(OH)(H2O)3, a dehydration product of kaňkite, Eur. J. Mineral., 28, 63–70, https://doi.org/10.1127/ejm/2015/0027-2495, 2016.
Mugnaioli, E. and Gemmi, M.: Single-crystal analysis of nanodomains by electron diffraction tomography: Mineralogy at the order-disorder borderline, Z. Krist.-Cryst. Mater., 233, 163–178, https://doi.org/10.1515/zkri-2017-2130, 2018.
Plakatouras, J. C., Baxter, I., Hursthouse, M. B., Abdul Malik, K. M., McAleese, J., and Drake, S. R.: Synthesis and structural characterisation of two novel GdIII-diketonates [Gd4(3-OH)4(2-H2O)2(H2O)4(hfpd)8]2C6H6H2O 1 and [Gd(hfpd)3(Me2CO)(H2O)] 2 (hfpdH=1,1,1,5,5,5 hexafluoropentane-2,4-dione), J. Chem. Soc. Chem. Comm., 21, 2455–2456, https://doi.org/10.1039/C39940002455, 1994.
Rius, J., Mugnaioli, E., Vallcorba, O., and Kolb, U.: Application of δ recycling to electron automated diffraction tomography data from inorganic crystalline nanovolumes, Acta Crystallogr. A, 69, 396–407, https://doi.org/10.1107/S0108767313009549, 2013.
Rius, J.: Patterson function and δ recycling: derivation of the phasing equations, Acta Crystallogr. A, 68, 399–400, https://doi.org/10.1107/S0108767312008768, 2012a.
Rius, J.: RIBOLS18: a computer program for restrained Rietveld refinement, Institut de Ciencia de Materials de Barcelona (CSIC), Barcelona, Spain, 2012b.
Rius, J.: Application of Patterson-function direct methods to materials characterization, IUCrJ, 1, 291–304, https://doi.org/10.1107/S2052252514017606, 2014.
Sletten, J., Soerensen, A., Julve, M., and Journaux, Y.: A tetranuclear hydroxo-bridged copper (II) cluster of the cubane type: Preparation and structural and magnetic characterization of tetrakis [(2, 2'-bipyridyl) hydroxocopper (II)] hexafluoro-phosphate, Inorg. Chem., 29, 5054–5058, https://doi.org/10.1021/ic00350a010, 1990.
Thompson, P., Cox, D. E., and Hastings, J. B.: Rietveld refinement of Debye-Scherrer synchrotron X-ray data from Al2O3, J. Appl. Crystall., 20, 79–83, https://doi.org/10.1107/S0021889887087090, 1987.
Vallcorba O., Rius J., Frontera, C., Peral, I., and Miravitlles, C.: DAJUST: a suite of computer programs for pattern matching, space-group determination and intensity extraction from powder diffraction data, J. Appl. Crystall., 45, 844–848, https://doi.org/10.1107/S0021889812021152, 2012.
Van Genderen, E., Clabbers, M. T. B., Das, P. P., Stewart, A., Nederlof, I., Barentsen, K. C., and Abrahams, J. P.: Ab initio structure determination of nanocrystals of organic pharmaceutical compounds by electron diffraction at room temperature using a Timepix quantum area direct electron detector, Acta Crystallogr. A, 72, 236–242, https://doi.org/10.1107/S2053273315022500, 2016.
Ventruti, G., Mugnaioli, E., Capitani, G., Scordari, F., Pinto, D., and Lausi, A.: A structural study of cyanotrichite from Dachang by conventional and automated electron diffraction, Phys. Chem. Mineral., 42, 651–661, https://doi.org/10.1007/s00269-015-0751-z, 2015.
Wallwork, K., Kolitsch, U., Pring, A., and Nasdala, L.: Decrespignyite-(Y), a new copper yttrium rare earth carbonate chloride hydrate from Paratoo, South Australia, Mineral. Mag., 66, 181–188, https://doi.org/10.1180/0026461026610021, 2002.
Wang, R., Carducci, M. D., and Zheng, Z.: Direct hydrolytic route to molecular oxo−hydroxo lanthanide clusters, Inorgan. Chem., 39, 1836–1837, https://doi.org/10.1021/ic991391p, 2000.
Xiao-Ming, C., Yu-Luan, W., Ye-Xiang, T., Ziming, S., and Hendrickson, D. N.: Tetra μ3-hydroxo) hexa (μ2-carboxylato-O, O′)-bridged tetranuclear terbium (III) cubane complex, Polyhedron, 16, 4265–4272, https://doi.org/10.1016/S0277-5387(97)00229-5, 1997.