the Creative Commons Attribution 4.0 License.
the Creative Commons Attribution 4.0 License.
 | 18 Sep 2020
In situ micro-FTIR spectroscopic investigations of synthetic ammonium phengite under pressure and temperature
Nada Abdel-Hak
Bernd Wunder
Ilias Efthimiopoulos
Monika Koch-Müller
Phengite is known to be an important mineral in the transport of alkalis and water to upper mantle depths. Since ammonium () can substitute for K+ in K-bearing minerals, phengite is thus a potential host to transport nitrogen into the mantle. However, the temperature and pressure conditions at which devolatilisation of NH4-bearing phengite occurs are not well constrained. In this study, NH4-phengite (NH4)(Mg0.5Al1.5)(Al0.5Si3.5)O10(OH)2 was synthesised in piston-cylinder experiments at 700 ∘C and 4.0 GPa. Its devolatilisation behaviour was studied by means of in situ micro-FTIR (Fourier transform infrared) spectroscopy under low and high temperatures from −180 up to 600 ∘C at ambient pressure using a Linkam cooling–heating stage and pressures up to 42 GPa at ambient temperature in diamond anvil cell (DAC) experiments. In addition to these short-term in situ experiments, we performed quenched experiments where the samples were annealed for 24 h at certain temperatures and analysed at room conditions by micro-FTIR spectroscopy.
Our results can be summarised as follows: (1) an order–disorder process of the molecule takes place with temperature variation at ambient pressure; (2) is still retained in the phengite structure up to 600 ∘C, and the expansion of the molecule with heating is reversible for short-term experiments; (3) kinetic effects partly control the destabilisation of in phengite; (4) ammonium loss occurs at temperatures near dehydration; (5) in phengite is apparently distorted above 8.6 GPa at ambient temperature; and (6) the local symmetry of the molecule is lowered/descended/reduced by increasing pressure (P) or decreasing temperature (T), and the type and mechanism of this lowered symmetry is different in both cases. The current study confirms the wide stability range of phengite and its volatiles and thus has important implications for the recycling of nitrogen and hydrogen into the deep Earth. Moreover, it is considered as a first step in the crystallographic determination of the orientation of the molecule in the phengite structure.
- Article
(3594 KB) - Full-text XML
-
Supplement
(705 KB) - BibTeX
- EndNote


Phengite is a key mineral in the transport of alkalis and water into the lowermost parts of the Earth's upper mantle through subduction of metasedimentary and basaltic rocks (Poli and Schmidt, 1995, 2002). Due to its flexible structure, phengite accommodates alkalis of various ionic radii between 1.39 Å ([12]Na+) and 1.88 Å ([12]Cs+) (e.g. Keller et al., 2005; Melzer and Wunder, 2000). The ionic radius of Å (Shannon, 1976), the main alkali ion in phengite, is slightly smaller than that of the isovalent ammonium ion ( Å; Matthias Gottschalk, personal communication, 2020); thus, for many K-bearing phases, including phengite, complete substitution of for K+ is possible and has been shown experimentally (e.g. Harlov et al., 2001; Watenphul et al., 2009, 2010; Wunder et al., 2015).
In nature, during diagenetic processes, the organic matter thermally degrades and is formed. This can substitute for K+ in different K-bearing phases, and during metamorphism (Barrovian-type or contact), about 90 % of this – originally produced by organic processes – is continuously released (e.g. Mingram and Bräuer, 2001). However, significant incorporation up to concentrations of ∼ 2000 ppm has been documented for natural phengite from the high-pressure metasediments of the Dora Maira Massif, Western Alps (Busigny et al., 2003), indicating the recycling of substantial amounts of nitrogen (in form of ) in cold slabs from the Earth's surface into large depths during subduction and back to the surface. The cycling of nitrogen into and out of the Earth's mantle has been of considerable recent interest and debate (e.g. Marty, 2012; Mikhail and Sverjenski, 2014; Zedgenizov and Litasov, 2017). To further constrain the pressure (P) and temperature (T) conditions at which phengite transports nitrogen into the deep levels of the upper mantle, we synthesised NH4-endmember phengite and investigated its T-dependent devolatilisation (dehydration and ammonium loss) at ambient P using in situ spectroscopic methods. Furthermore, we studied its vibrational response to compression up to 42 GPa at ambient T in diamond anvil cell (DAC) experiments. These data are compared with recent studies on the devolatilisation of natural phengite containing trace amounts of (Liu et al., 2019; Yang et al., 2017) and with our own experimental results as well as with existing data (Goryainov et al., 2017; Zhang et al., 2010) on the dehydration of synthetic and natural ammonium-free phengite. NH4-endmember phengite is not reported from natural rocks so far. However, phengites reported in nature have experienced subduction, so the initial amount of included in them is not known. Therefore, the current study is unique in terms of studying NH4-endmember phengite. The advantages of this are twofold: the behaviour of the interlayer cation site is solely controlled by the molecule which is of crystallographic importance, and starting with this ideal case with full occupancy with , we can follow how much is getting lost when we mimic P and T conditions of subduction.
2.1 Synthesis of NH4-phengite
For the synthesis of NH4-phengite, we followed the method described in Watenphul et al. (2009) using 25 % NH4OH solution in excess. They succeeded in the synthesis of phengite of composition (NH4)(Mg0.5Al1.5)(Al0.5Si3.5)O10(OH)2 at 4.0 GPa, 700 ∘C. A homogenous mixture of SiO2, γ−Al2O3 and MgO oxides in the ratio 3.5 : 1 : 0.5 was used as solid starting material, which corresponds to an NH4-phengite of the composition given above. Two Au capsules of 10 mm length, 3 mm in diameter and 0.2 mm wall thickness were filled with NH4OH solution and about 7 mg of the solid starting material (of different fluid / solid ratios of about 0.4 (run NAD1) and 0.8 (run NAD2)) and immediately closed by cold welding. The two capsules were placed in pyrophyllite-NaCl-steel-furnace assemblies of 12.7 mm (1∕2 in.) diameter in a piston-cylinder press. Experiments were performed at 4.0 GPa and 700 ∘C for 24 h. P was calibrated according to the quartz–coesite transition (Mirwald and Massonne, 1980). The estimated P uncertainty is about 0.04 GPa. The T was monitored by a chromel–alumel thermocouple, with a precision of ±2 ∘C. The estimated uncertainty in experimental T is about 10 ∘C. At the end of the experiment, the sample was quenched isobarically to a T below 200 ∘C in less than 15 s, followed by slow release of P. The two capsules were cleaned, reweighed and then opened. The solid products were washed in pure water to avoid the presence of any adsorbed on the mineral surface and prepared for optical investigations, powder X-ray diffraction (XRD) and spectroscopic analyses.
2.2 Further sample material of ammonium-free phengite
T-dependent infrared (IR) investigations were also performed on synthetic and natural ammonium-free phengite samples. The synthetic phengite is sample 10 from the study by Melzer and Wunder (2000), containing 99 % phengite of composition (K0.85Cs0.05)(Al1.58Mg0.46)(Al0.54Si3.46)O10(OH)2 together with traces of quartz. Natural phengite from the Gran Paradiso area (sample AL 17; see Chopin and Maluski, 1980), of the composition (K0.9Na0.01)(Al1.45Fe0.12Mg0.43)(Al0.43Si3.56Ti0.01)O10(OH)2, was investigated.
3.1 Field-emission scanning electron microscopy (FE-SEM)
Solid run products were mounted on metal stubs with double-sided stick tape, coated with carbon and characterised optically via scanning electron microscopy using the Gemini ultra-high-resolution FE-SEM from Zeiss located at GFZ Potsdam. The SEM was operated at an accelerating voltage of 3.00 kV, a working distance (WD) of 2.3 mm and an aperture size of 30 µm.
3.2 Powder X-ray diffraction (powder XRD)
The run products were ground for several minutes in an agate mortar and mixed with Elmer's white glue, before being spread evenly on a zero-scattering Mylar polymer circular foil. Preferential orientation of the crystals was minimised by constantly stirring the sample during drying. The sample was covered with another clean foil and mounted onto a transmission sample holder. Powder XRD patterns were recorded in transmission with a fully automated STOE STADI P diffractometer using Cu K-α1 radiation at 40 kV and 40 mA, a take-off angle of 6∘, a primary monochromator, and a 7∘ wide position-sensitive detector (PSD). The intensities were recorded between 5 and 125∘ 2θ with a detector step size of 0.1∘ and a resolution of 0.02∘. Collected patterns were processed using the GSAS software package (Toby and Von Dreele, 2013) with the Rietveld method for phase identification, phase proportions and unit cell parameters. The refinement procedure for the NH4 phases followed that of Pöter et al. (2007). Initial crystal structures of the respective K+-endmember polytypes were taken from the Inorganic Crystal Structure Database (ICSD, FIZ Karlsruhe, http://icsdweb.FIZ-karlsruhe.de, last access: 20 February 2020), with structures modified by replacement of K+ with , using the lattice parameters of NH4-phengites given by Watenphul et al. (2009).
3.3 Fourier transform infrared (FTIR) spectroscopy
Prior to all measurements, samples were kept in the oven at 170 ∘C for a few days to eliminate adsorbed water. Micro-FTIR absorbance spectra were recorded using a Bruker VERTEX 80v FTIR spectrometer in combination with a Bruker HYPERION 2000 microscope equipped with 15× Cassegrain objectives. For the measurements down to 400 cm−1 (i.e. in the 4000–400 cm−1 wave number range), a globar light source, a KBr beam splitter and a mercury cadmium telluride (MCT) detector were used. For the measurements in the OH stretching region (i.e. in the 4000–2500 cm−1 wave number range), a tungsten light source, a CaF2 beam splitter and an InSb detector were used. Dried air was used to purge the IR microscope, and the main optical bench of the system was kept under vacuum during the IR measurements. The ambient and T-dependent spectra were collected with a spectral resolution of 2 cm−1 averaged over 256 scans, with an aperture size of 50 µm×50 µm. Such an aperture size was possible even for the fine-grained samples as the measurements were performed on prepared thin films and not on the fine-grained single crystals (see below). The P-dependent spectra were accumulated with 4 cm−1 spectral resolution, averaged over 512 scans, with the aperture size set to match the sample at about 20 µm×30 µm. T- and P-dependent spectra were collected on the same selected area both for sample and background measurement. The spectra were analysed with the program PeakFit v4.11.
3.3.1 T-dependent FTIR measurements
For in situ cooling and heating experiments (−180 to 600 ∘C) at ambient pressure, a thin film of the fine-grained crystals of sample NAD1, pressed between a KBr pellet and a glass slide, was placed in the Linkam cooling–heating stage THMS600 with glass windows (SiO2). The stage was purged with nitrogen. FTIR spectra were recorded in the 4000–2500 cm−1 spectral wave number range. Liquid nitrogen was used to cool the stage down from room T to −180 ∘C in increments of 40 ∘C. For every T, the dwell time was 10 min before a spectrum was taken. After the cooling experiment, the sample was heated in air up to 600 ∘C in increments of 50 ∘C. For every T, the dwell time was 15 min before collecting the in situ spectra. After the cooling and heating cycles, the sample was quenched back to room temperature and was remeasured.
To delineate the antisymmetric NH4−ν4 bending vibration observed at 1430 cm−1 and to confirm the splitting behaviour (discussed below) of the NH4−ν3 band observed in the 3600–2800 cm−1 spectral wave number range, in situ low-T measurements were additionally performed with the NAD1 sample in the 4000–500 cm−1 spectral wave number range.
Low-T spectra exhibited additional broad peaks that contributed to the FTIR spectra in the same wave number range as the NH4−ν3 band (3600–2800 cm−1). We attributed those peaks to the formation of “thin ice films” on the sample thin-film surface in the Linkam cooling–heating stage THMS600 for which the spectra have to be corrected. Some papers (e.g. Yesilbas and Boily, 2016, and references therein) suggest the formation/condensation of ice in the form of thin layers or films at interfaces or mineral particle surfaces where defects and functional groups at the mineral surface can serve as potential nucleation sites for ice formation; as a result, the structures and hydrogen bonding of these few monolayers of ice – namely thin ice films – can be considerably different than those of the known hexagonal ice crystals (e.g. Hornig et al., 1958). The correction procedure we applied is a broad background subtraction of two fitted broad bands (at 3182.5 and 3499.2 cm−1 at ambient T). With decreasing T (i.e. ice formation), the two ice peaks shift to lower wave numbers (red shifting, due to formation of stronger H bonds) along with an increase in their integral absorbance.
In addition to these short-term in situ experiments, we performed quenched experiments where the samples were annealed in air at Ts specified below. Each T was maintained for 24 h. These annealing experiments were performed on the samples: NAD2 sample (300, 400, 500, 600, 650 ∘C), sample 10 (50 ∘C intervals from 500 to 650 ∘C), and AL17 (50 ∘C intervals from 550 to 800 ∘C) in order to compare the rates of dehydration and loss. After annealing, the samples were quenched back to room temperature, and FTIR spectra in the 4000–400 cm−1 spectral wave number range were collected. The samples used in the quenched experiments were in the form of thin films of the fine-grained synthesised crystals of NAD2 and sample 10 and single crystals of AL17. The thickness of the AL17 single crystal was 3.3 µm, measured with a digital micrometre, and the thin film of NAD2 was 3 µm thick. The thin film of sample 10 was much thinner and estimated to be about 0.75 µm.
3.3.2 P-dependent FTIR measurements using a diamond anvil cell (DAC)
The fine-grained crystals of NAD2 sample were pressed to a thin film in a separate ungasketed diamond anvil cell (DAC). For in situ high-P FTIR measurements up to 42 GPa at ambient T, we used a Mao-type piston-cylinder DAC with type II diamonds and a rhenium gasket, pre-indented to 40 µm thickness. The DAC is equipped with diamonds of 400 µm culet. The hole in the gasket was about 160 µm in diameter, drilled into the pre-indented gasket using a spark discharge eroder. The film was then embedded in the gasket hole of the DAC together with small ruby crystals for P determination (Mao et al., 1986). The cell was loaded cryogenically with liquid Ar serving as a pressure-transmitting medium (PTM). To get hydrostatic P conditions, the cell was annealed to 120 ∘C for 1 h at 8 GPa and above 27 GPa (Koch-Müller et al., 2016).
FTIR spectra were recorded in the 4000–400 cm−1 spectral range. Two P-dependent series were performed. In the first series, P was increased to 42 GPa and spectra were collected at eight different P points. P was then released to 2 GPa and increased again up to 35 GPa, in order to perform the second high-P investigation.
The IR spectra of the transparent sample in the loaded DAC always exhibited interference fringes due to the internal reflections within the DAC. We applied sinusoidal background subtraction from the IR spectra (Efthimiopoulos et al., 2019) using Origin 2019 software. The sinusoidal background was determined from the particular fringes observed in each IR spectrum individually, in order to correct for the most intense fringes and facilitate the interpretation of the IR spectra, without losing any spectral information.
4.1 Synthesis products
Powder X-ray diffraction data revealed the synthesis of different NH4-phengite polytypes (2M2, 2M1, 3T, 2Or and 1M in decreasing order of their abundance) in various proportions. For the NAD1 sample, coesite and kyanite were formed as additional minor phases. In the experimental run with the higher fluid / solid ratios (NAD2), NH4-phengites are exclusively synthesised with no such additional minor phases.

Figure 1Rietveld refinement of the XRD patterns of the synthetic samples (a) NAD1 and (b) NAD2. Black: measured intensities; red: refined data; blue: residuals. Reflections of the 2M2 polytype as the main polytype in NAD2 are shown (green).
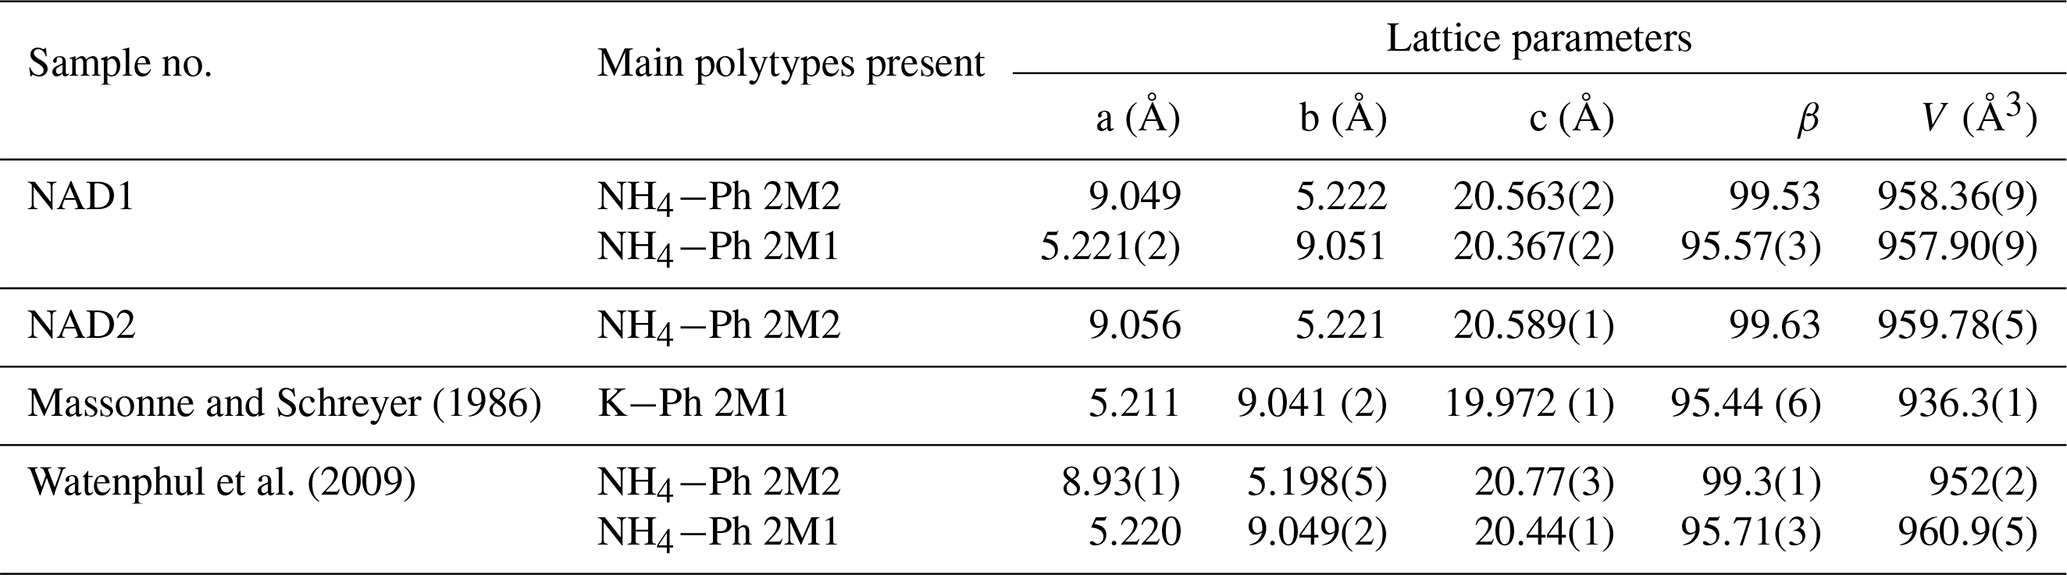
The observed and calculated patterns of the Rietveld refinement of X-ray data for both samples are shown graphically in Fig. 1. The lattice parameters of the two main NH4-phengite polytypes (2M2, 2M1) calculated from the refinement are shown in Table 1, as well as the lattice parameters of NH4-phengite polytypes produced by Watenphul et al. (2009) and the K analogues by Massonne and Schreyer (1986) for comparison.
Table 1Lattice parameters of the main NH4-phengite (Ph) polytypes produced in different runs (NAD1 and NAD2), calculated from Rietveld refinements. Limited quantities of other polytypes (3T, 2Or and 1M) are also present together with traces of kyanite and coesite. Lattice parameters of NH4-Ph polytypes produced by Watenphul et al. (2009) as well as a K analogue by Massonne and Schreyer (1986) are shown for comparison. Mineral abbreviation is used following Whitney and Evans (2010).
FE-SEM micrographs of run products of sample NAD1 are shown in Fig. 2. Thin flakes of well-crystallised NH4-phengite crystals are formed and show characteristic pseudohexagonal form in cross section. Chemical analysis by electron microprobe was not applied (a) due to the fact that NH4 phases tend to decompose under the electron beam during long-term exposure (Mingram and Bräuer, 2001; Watenphul et al., 2009) and (b) because the grain sizes of our NH4-phengite crystals are too small (≤ 1 µm). However, incorporation into phengite was confirmed by FTIR spectroscopy (see below).
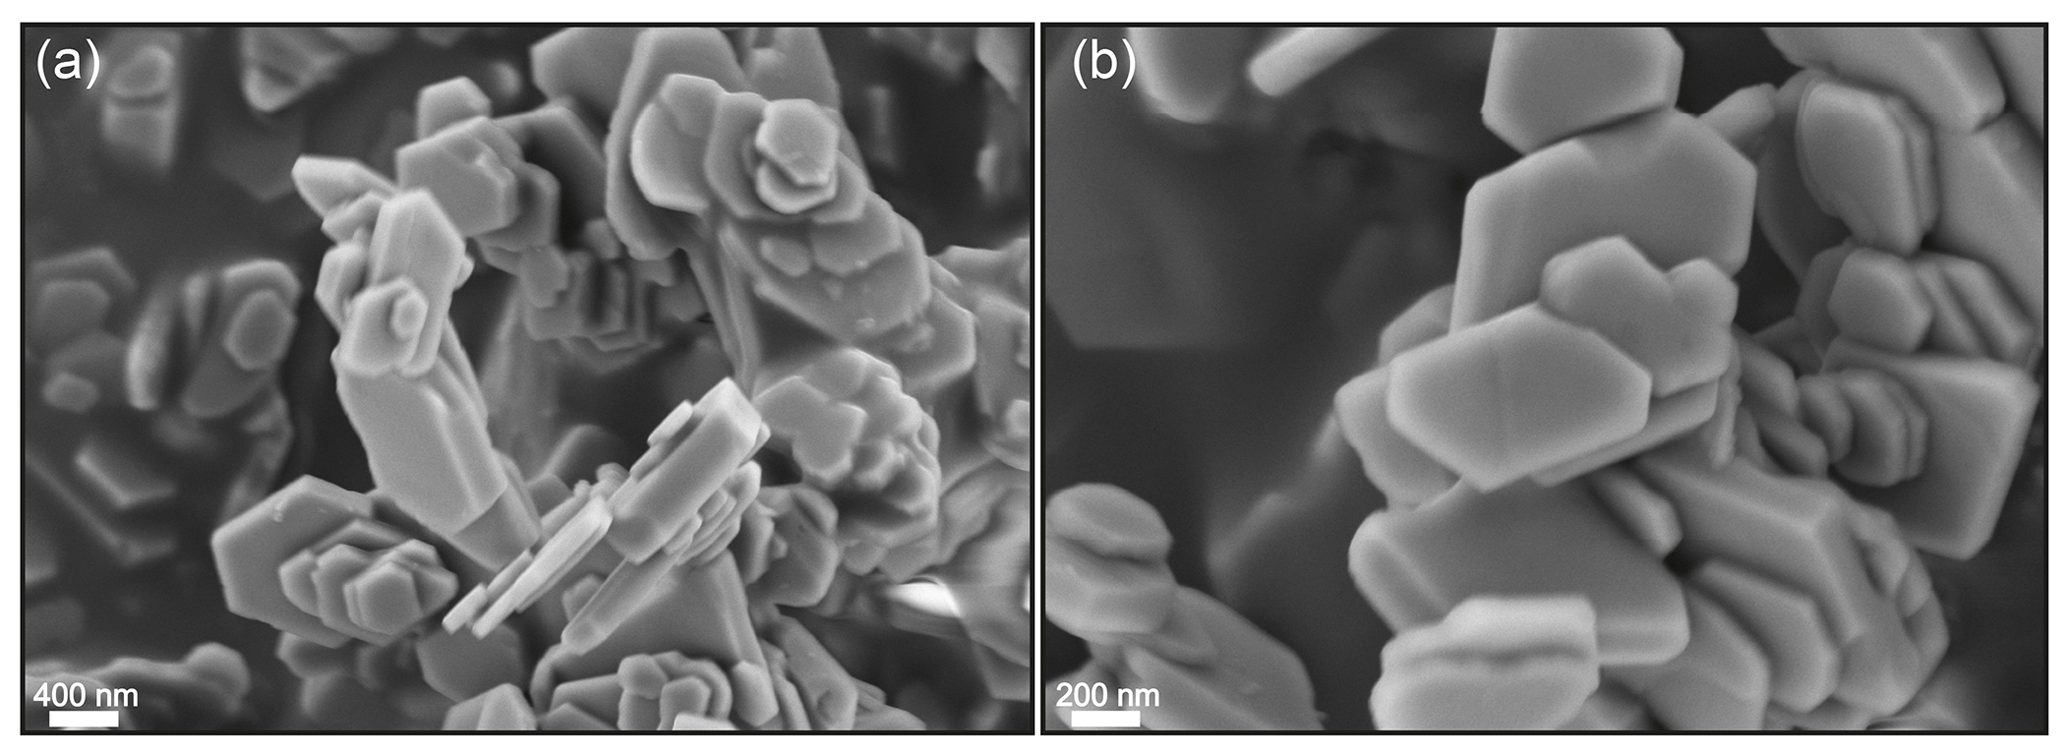
Figure 2FE-SEM micrographs (secondary electron image) of run products from our piston-cylinder experiment NAD1 showing (a) the thin flakes of well-crystallised NH4-phengite and (b) the pseudohexagonal cross section.
4.2 Ambient FTIR spectroscopy
The lattice modes of phengite have been assigned by means of IR and Raman spectroscopy (e.g. Goryainov et al., 2017; McKeown et al., 1999). In addition to the lattice modes, other vibrational modes in NH4-phengite come from the molecule located at the interlayer cation site, as well as from the OH situated in the octahedral layer (OH stretching vibration). The IR spectrum of the NAD2 sample at ambient conditions is shown in the Supplement (Fig. S1). An isolated molecule with ideal Td symmetry has four normal vibrational modes, namely symmetric (ν1) and antisymmetric (ν3) stretching vibrations, as well as symmetric (ν2) and antisymmetric (ν4) bending vibrations (Herzberg, 1966; Kearley and Oxton, 1983). Two of those vibrations are IR-active, i.e. the triply degenerate antisymmetric stretching (ν3) and bending (ν4) vibrations. Previous studies of NH4-bearing silicates (e.g. Busigny et al., 2003; Liu et al., 2019; Vennari et al., 2017; Watenphul et al., 2009; Wunder et al., 2015; Yang et al., 2017) show that the band at 3610 cm−1 is assigned to the OH stretching vibration in phengite, and the bands at 3291 and 1430 cm−1 correspond to the and ν4 vibrations, respectively. The assignment of the ν3 and ν4 modes is based on the assumption that the molecule behaves almost as a free tetrahedral molecule in the interlayer cation site in the phengite structure (Watenphul et al., 2009). The band at 3036 cm−1 is related to a combination of symmetric and antisymmetric bending vibrations (ν2+ν4 – the Raman-active ν2 mode occurs at 1669 cm−1, Price et al., 1991) and the band at 2818 cm−1 is ascribed to an overtone of the ν4 bending vibration (2ν4). All of the FTIR bands of the NH4-phengite including the lattice vibrations and the respective references are summarised in Table S1.
The quantification of the amount of in micas was done using IR spectroscopy applying the method described by Higashi (2000). In his method, the ratio of the linear absorbances of the NH4−ν4 band to the OH stretching vibration (i.e. A(NH)∕A(OH)) is used to quantify in muscovite-tobelite solid solutions and endmembers; this ratio was used because the intensity of the ν4 band is a function of the content, whereas the intensity of the OH band is constant. Accordingly, we used the linear absorbances of the OH stretching vibration and the band of the background-subtracted spectra of the thin-film samples of NAD2 and of a sample from Watenphul et al. (2009) diluted in KBr (450 mg KBr : 1 mg sample) for the ratio calculation. The calculated (NH4)2O in both samples is 8.2±0.2 wt %. Using another method, the equation given by Pöter et al. (2007) for quantification in muscovite-tobelite solid solution, (NH4)2O content is 9.6±0.2 wt % (equivalent to the calculated pfu). An alternative approach for quantification in muscovites proposed by Busigny et al. (2003) is only calibrated for traces of and thus cannot be applied for phengites with several wt % of (wt % in the present paper vs. ppm in their study). Bentabol and Cruz (2016) reported calibrations to estimate the amount of in muscovite-tobelite solid solutions using FTIR and X-ray diffraction methods. Their calibration methods also cannot be applied for our samples.

Figure 3T-dependent (−180 to 600 ∘C) FTIR spectra of sample NAD1 at ambient P. OH stretching vibration and N–H antisymmetric stretching vibration () are observed in this spectral range. Spectra are vertically offset for clarity. Red: spectra with heating; blue: spectra with cooling; black: at ambient conditions and quenched spectra.
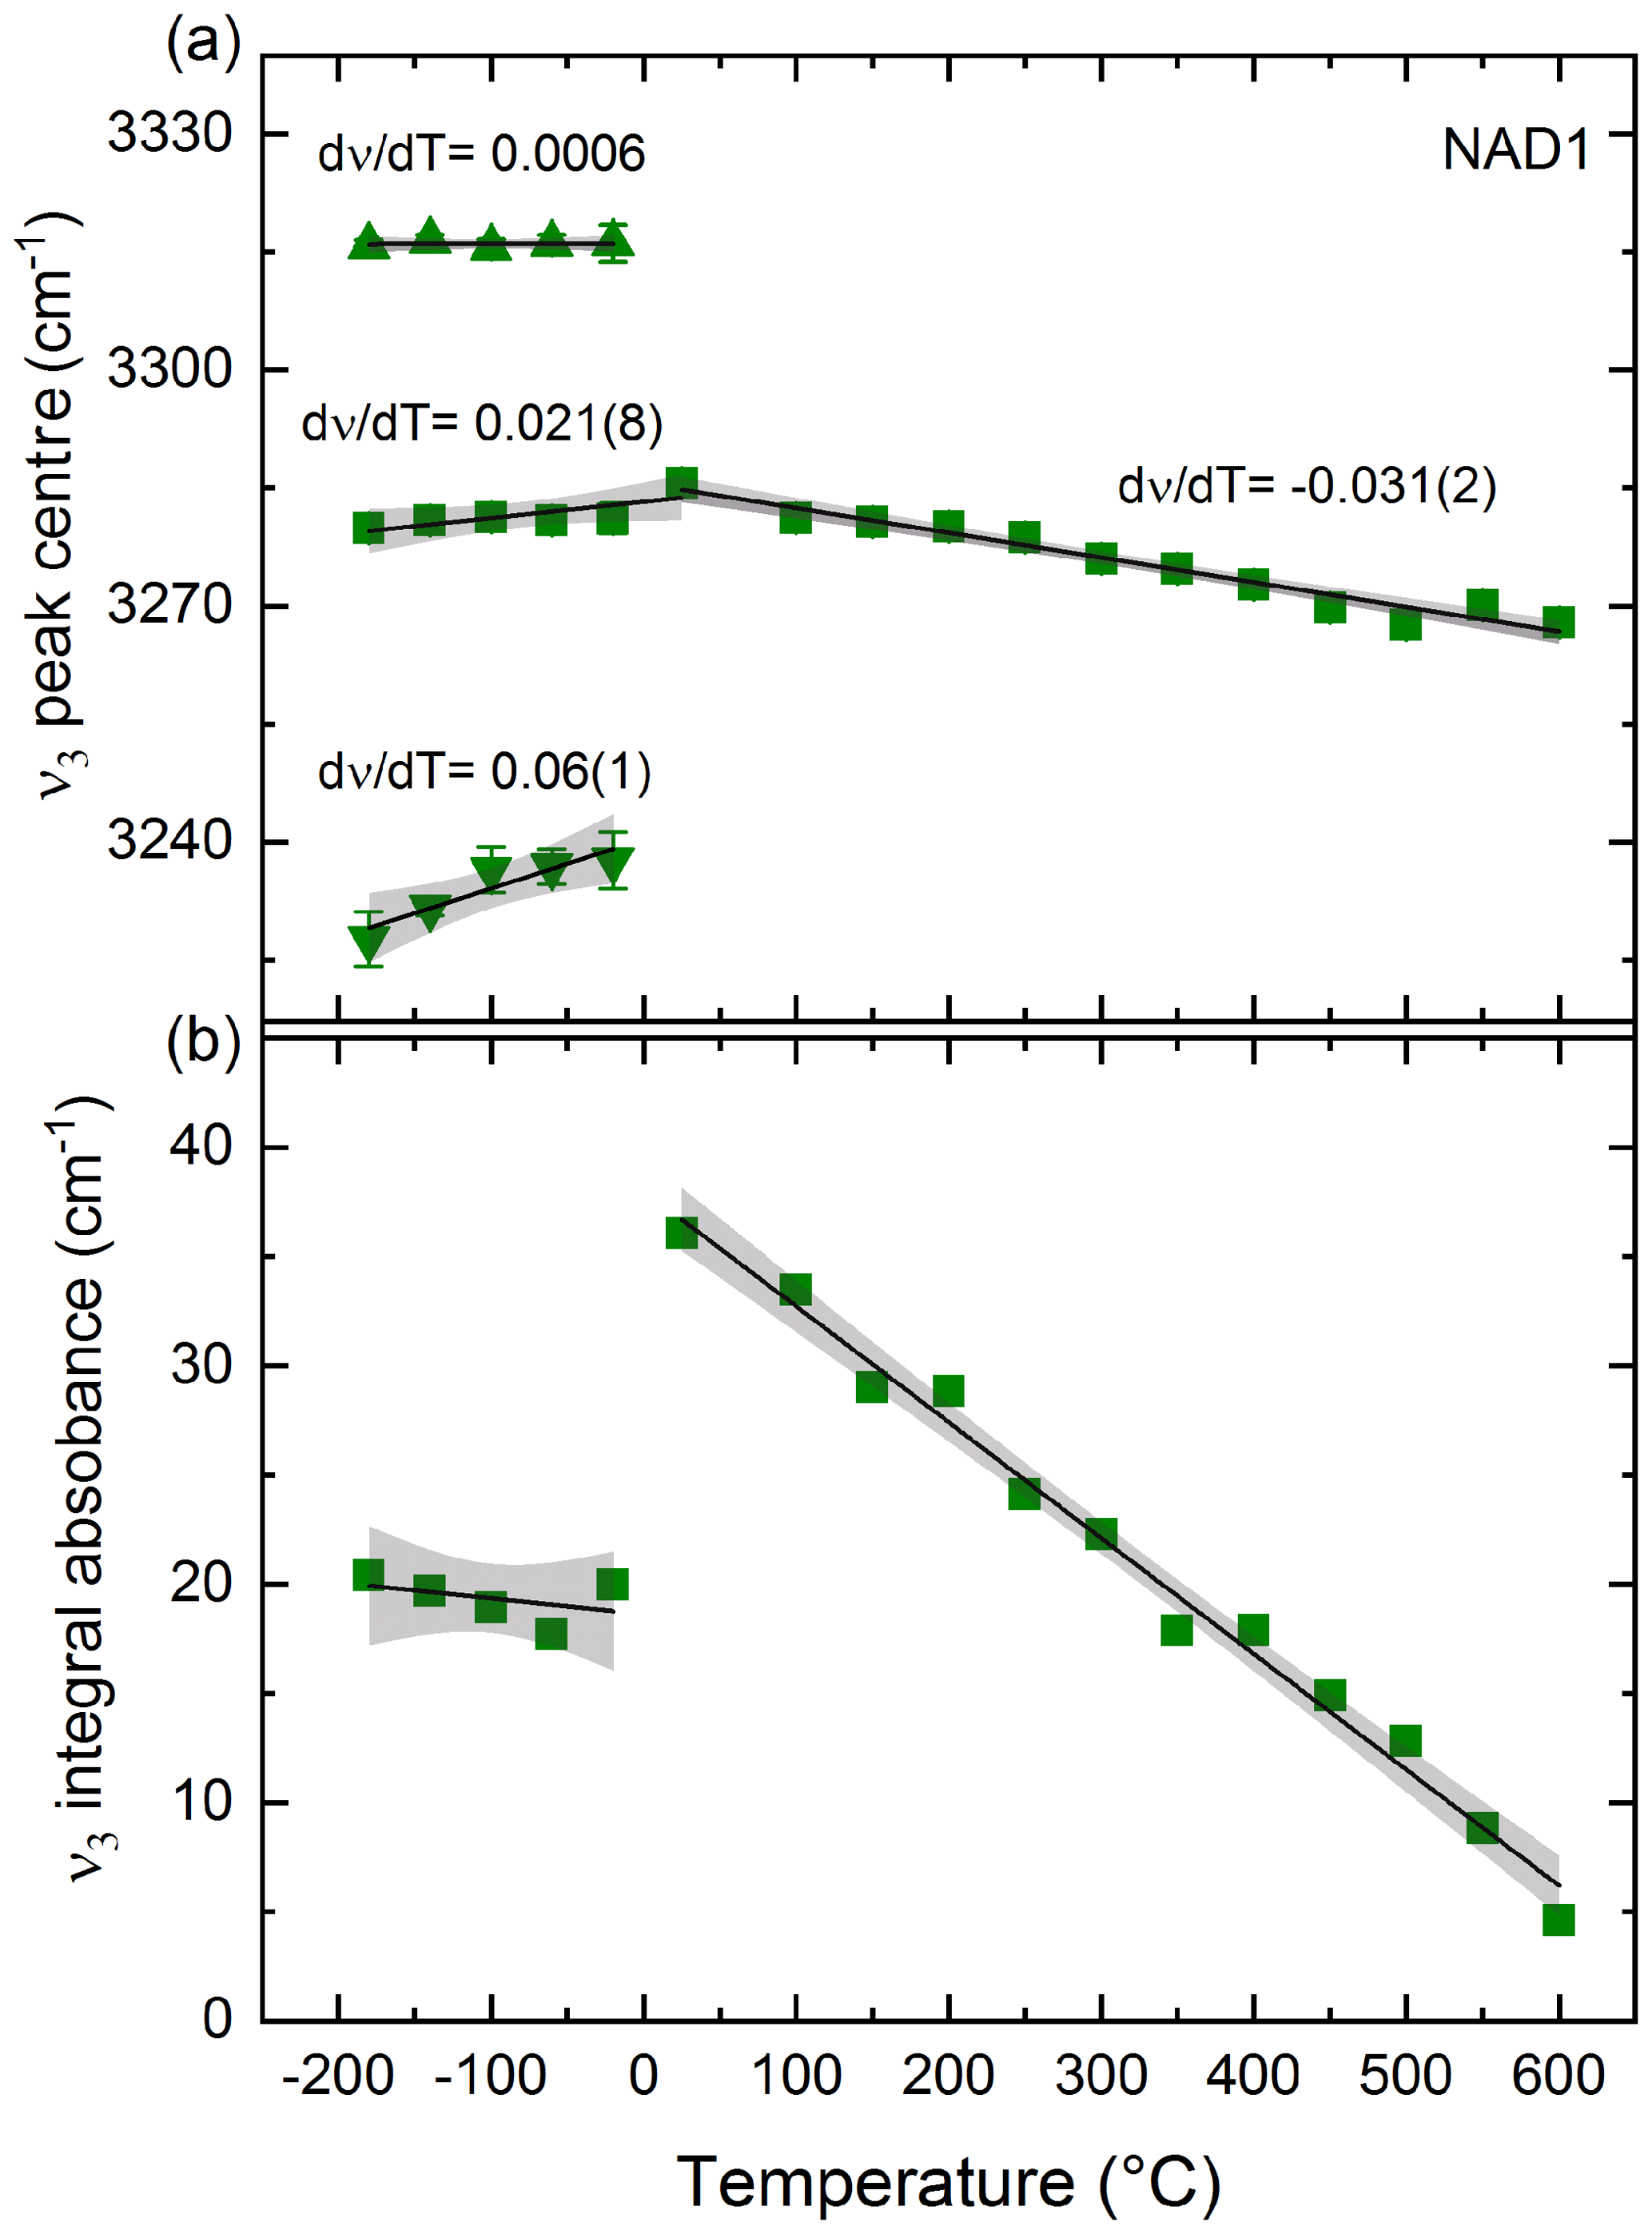
Figure 4(a) Peak position of NH4−ν3 stretching vibration of sample NAD1 with decreasing T (after correction for thin-ice-film contribution; see text) showing splitting into three different peaks and with increasing T showing a shift to lower wave numbers. Changes in peak positions with T, i.e. (dν∕dT) values, are shown with estimated standard deviations of the last digit in parentheses. (b) Decrease in integral absorbance of ν3 with heating; integral absorbance of NH4−ν3 peaks with cooling is the summation of the three split peaks. The error bars are shown; otherwise they are within the symbol size. Black solid lines are linear fits to the data. Grey shaded area represents the 95 % confidence interval of the data. Squares represent the main NH4−ν3 peak and the summation of the three split peaks with cooling; triangles represent the two additional peaks resulting from splitting of this main vibration with decreasing T.
4.3 T-dependent FTIR measurements
4.3.1 In situ low- and high-T FTIR spectroscopy
Low- and high-T-dependent FTIR spectra of sample NAD1 in the 4000–2500 cm−1 spectral wave number range are shown in Fig. 3. Figure 4 shows the evolution of the peak position and integral absorbance of the NH4−ν3 vibration in the T range from −200 to 600 ∘C after correcting the low-T spectra for the thin-ice-film contribution. Upon cooling to −180 ∘C at ambient P, the -specific bands become sharper and more intense, with the splitting of the triply degenerate NH4−ν3 stretching vibration into three distinct peaks. This splitting behaviour of the NH4−ν3 was reproduced in the repeated cooling experiment in the 4000–400 cm−1 spectral wave number range on sample NAD1 (not shown here). Upon heating up to 600 ∘C, all observed IR bands become broader and the NH4−ν3 band at 3291 cm−1 shifts slightly to lower wave numbers. The absorbance of NH4−ν3 decreases with increasing T; this behaviour is reversible after quenching to room temperature.
The behaviour of the triply degenerate antisymmetric bending vibration (NH4−ν4) with decreasing T is shown in the Supplement (Fig. S2). Splitting into two peaks is observed: one band shifts to higher wave numbers, whereas the other shifts to lower wave numbers (Fig. S3). The fitted linear regressions of the vibrational data of both NH4−ν3 and ν4 with T, plotted with their respective slopes (dν∕dT), are shown in Figs. 4a and S3, respectively.
4.3.2 Annealing experiments
Long-term (24 h) annealing experiments were performed and FTIR spectra were recorded after quenching. To better compare the spectra of the different samples, the calculated absorption coefficients1 for (a) synthetic NH4-phengite (NAD2), (b) synthetic K-phengite (sample 10) and (c) natural K-phengite (AL17) are shown in Fig. 5 in the range of the volatile vibrations from 3850 to 1250 cm−1. The full spectra down to 400 cm−1 are shown in Fig. S4.

Figure 5Calculated absorption coefficients in the 3850–1250 cm−1 range of the quenched samples NAD2 (a), sample 10 (b) and AL17 (c) after 24 h of annealing at each T. Spectra are vertically offset for clarity. (d) Area of the OH band of the three different samples and the , ν4 of NAD2 vs. quench T. Lines connect the points only as a guide to the eye. The error bars are smaller than the symbols.
Considering the -related vibrations in sample NAD2 (Fig. 5a, d), a slight decrease in the and ν4 bands from ambient temperature to 300 ∘C is observed. The absorbances of the bands remain more or less constant from 300 to 550 ∘C, whereas an abrupt decrease from 550 to 600 ∘C and a complete loss after annealing at 650 ∘C for 24 h are observed. This behaviour of decrease in the area of the and ν4 bands vs. the quench T is parallel to the decrease in the area of the OH band (Fig. 5d).
Considering the OH vibration, the two synthetic samples, i.e. both the -phengites (NAD2) and ammonium-free (sample 10) phengites (Fig. 5a, b), exhibit a continuous decrease in the respective OH stretching bands' IR absorbances from ambient temperature to 550 ∘C, an abrupt decrease from 550 to 600 ∘C, and a complete loss after annealing at 650 ∘C for 24 h. On the other hand, the OH band in the natural sample (AL17) displays a similar behaviour yet at higher Ts: the absorbances of the bands remain more or less constant from ambient to 700 ∘C, while an abrupt decrease from 700 to 750 ∘C and a complete loss of hydroxyl after annealing at 800 ∘C for 24 h is observed (Fig. 5c). This behaviour is displayed otherwise in Fig. 5d, where the integrated area of the OH bands for each of the three samples is plotted vs. the quench T.
In all samples, synchronous to the decrease in the intensities of OH (and in the case of the -phengite (NAD2)) bands, the intensities of the T-O-T and M-Oapical (where T refers to tetrahedral site, O is oxygen, and M refers to octahedral site) between 830 and 750 cm−1 decrease, as well as the M-OH libration at 910 cm−1 (Fig. S4).
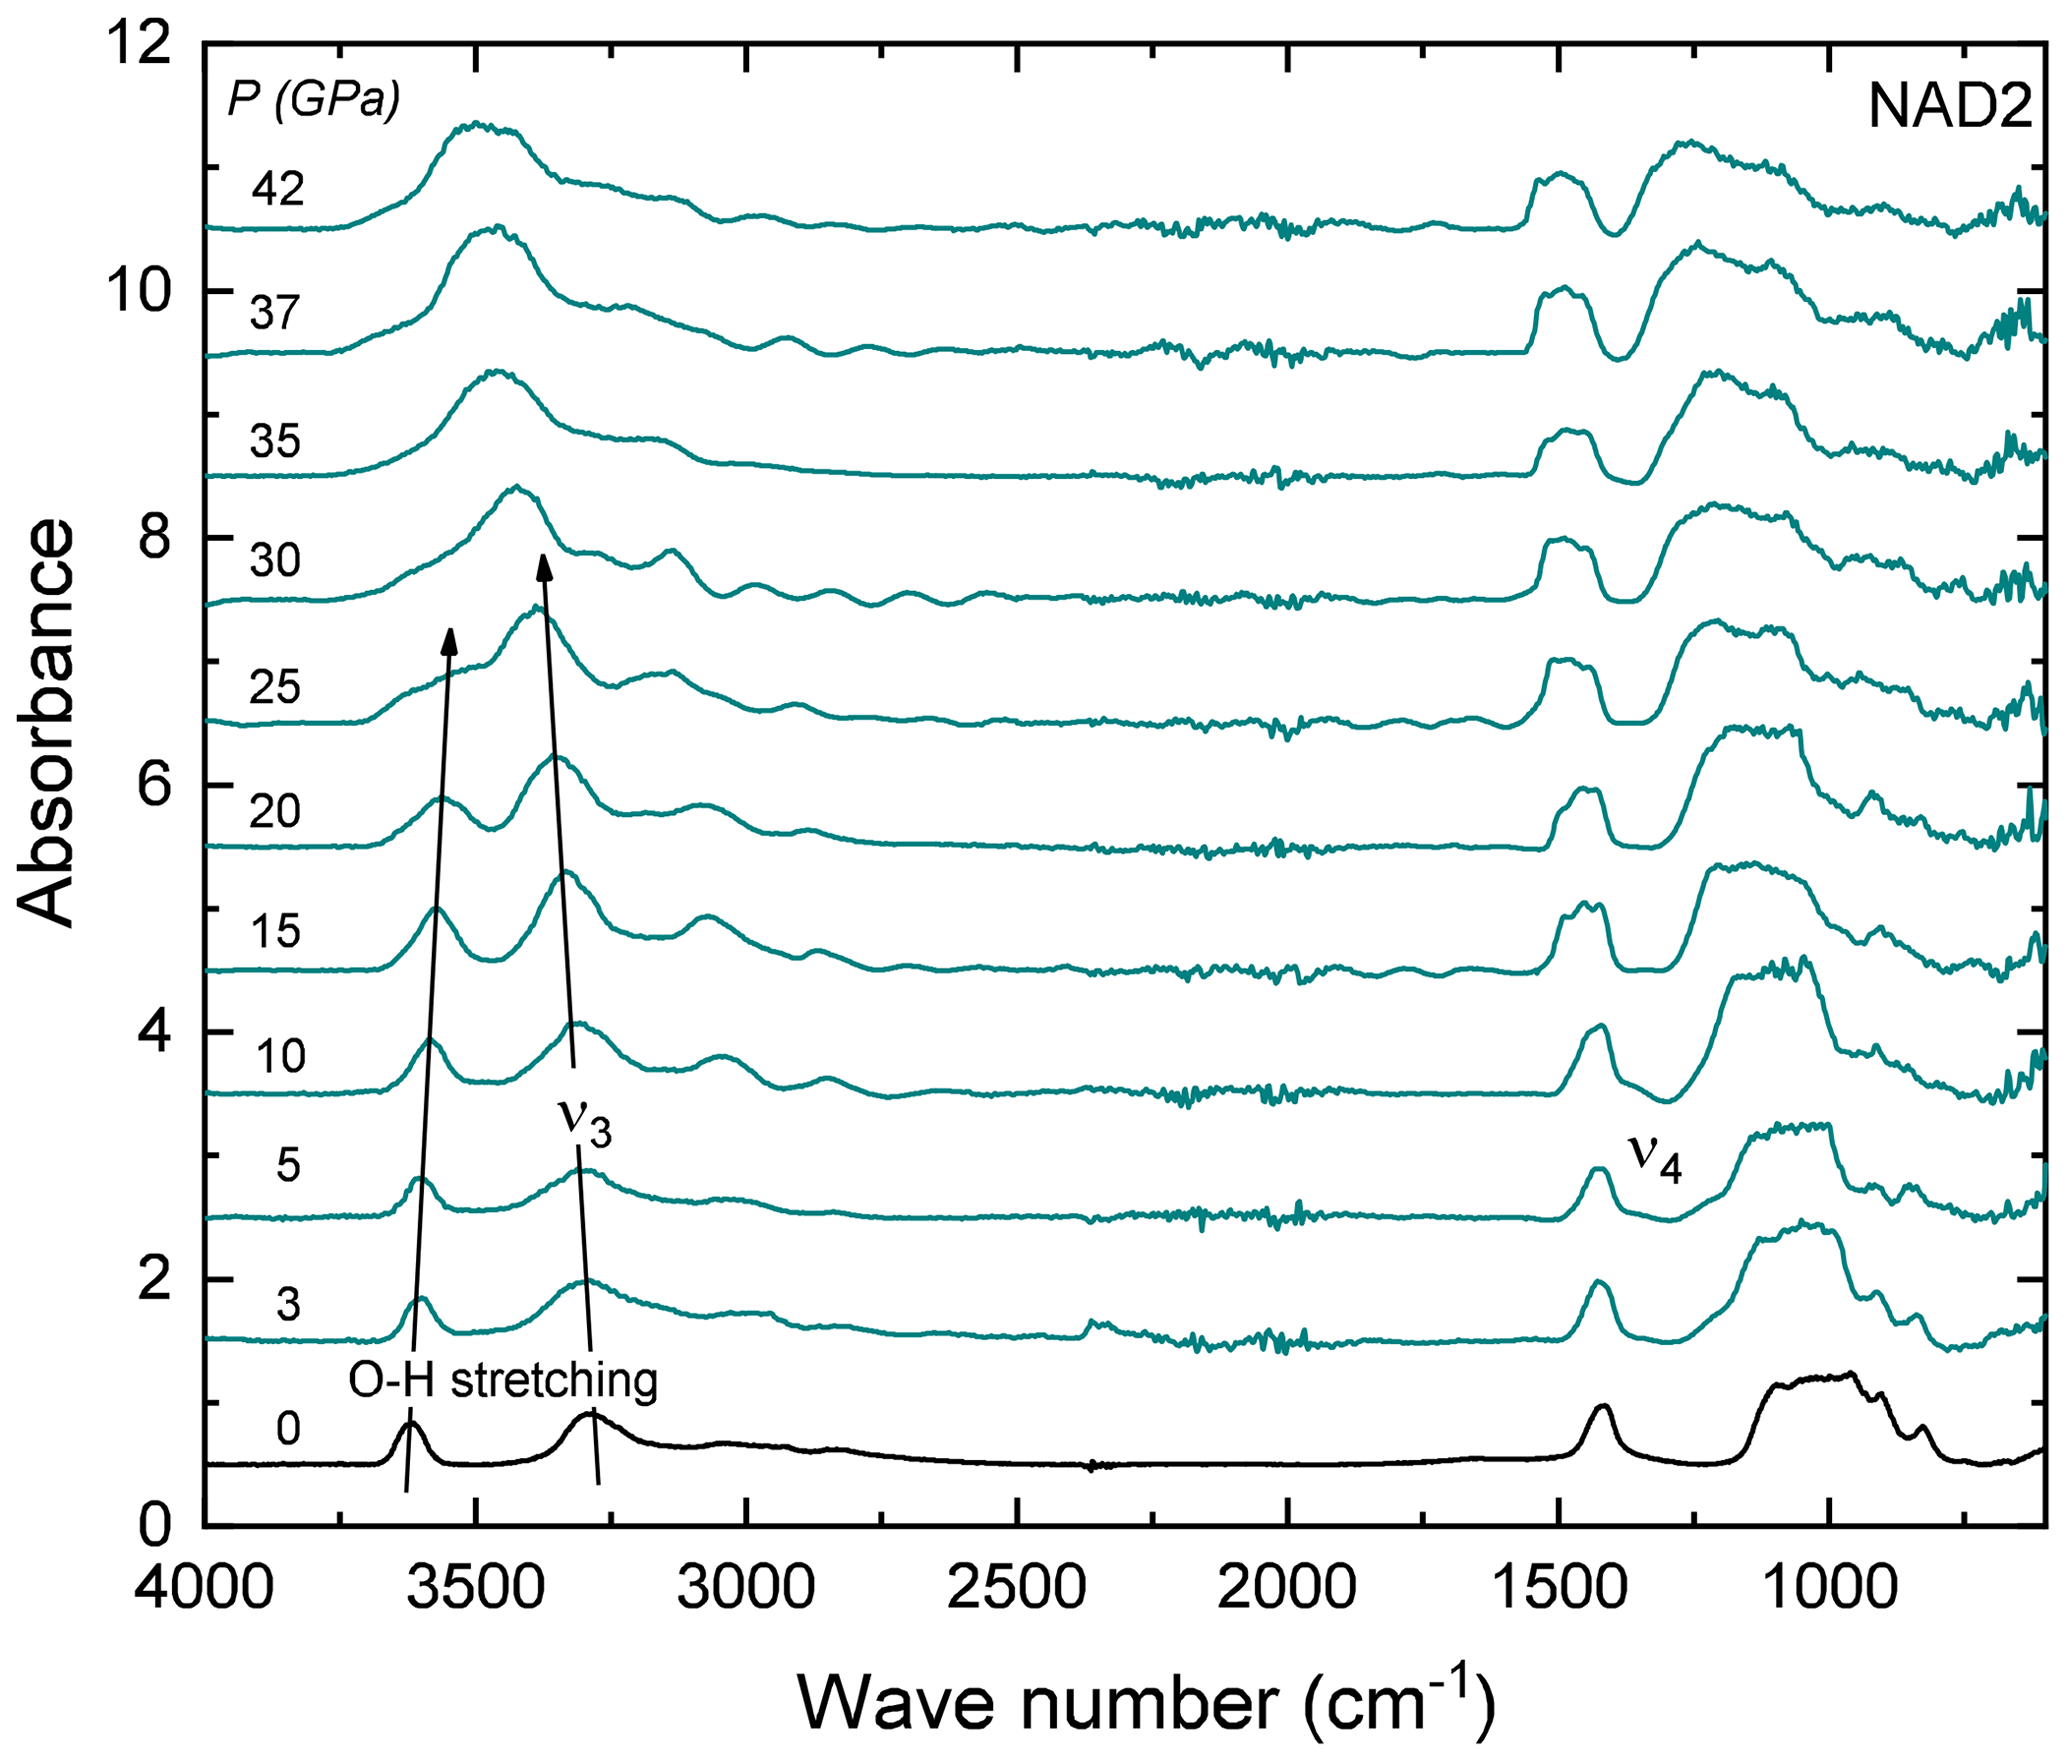
Figure 6Some representative FTIR spectra of NH4-phengite (sample NAD2) with increasing P at ambient T in a DAC, after the elimination of the interference fringes (see text). Arrows indicate the P-induced shift of the O–H stretching vibration to lower and the to higher wave numbers with increasing P. At high Ps (above ∼ 25 GPa), both peaks merge and form one broad peak and cannot be further distinguished. Spectra are vertically offset for clarity.
4.4 In situ high-P FTIR spectroscopy
FTIR spectra in the range of 4000–400 cm−1 of NH4-phengite (NAD2) measured with increasing P at ambient T are shown in Fig. 6. With increasing P, the antisymmetric stretching vibration is shifted to higher wave numbers, accompanied by an increase in its absorbance. In contrast, the OH stretching band shifts to lower wave numbers, becomes broader and appears to vanish. Beyond 25 GPa, the OH and ν3 bands merge and can no longer be distinguished. The P-induced wave number shifts of the OH stretching band and the bands are plotted in Fig. 7a; results are shown only up to 25 GPa because spectra measured at Ps above 25 GPa cannot be reliably fitted. The slope of the regression lines fitted through the shift in wave number – at least that of the band – as a function of P shows a small but discernible change at Ps above 8.6 GPa. The full widths at half maximum (FWHMs) of and the OH stretching vibrations as a function of P are shown in Fig. 7b, in addition to the regression lines fitted through. Changes in the slopes of these regression lines show an inflection point around 8.6 GPa. Despite the large scatter of data, for the OH vibration, there is a general positive trend of the slope on either side of this inflection point but with larger magnitude above 8.6 GPa, whereas for the band, the slope is positive below 8.6 GPa and negative above. The linear absorbances of and the OH stretching vibrations as a function of P shown in Fig. 7c indicate a noticeable discontinuity at Ps between 5 and 8.6 GPa. At Ps lower than 5 GPa, both vibrations show comparable decrease in absorbance with P. At Ps above 8.6 GPa, the absorbance of the vibration increases and the absorbance of the OH stretching decreases.

Figure 7Evolution of OH band and vibrations in sample NAD2 with P: change in terms of peak position of the OH band, (a) and and its splitting into three peaks (d); change in terms of full width at half maximum (FWHM) (b, e); and linear absorbance (c, f). The error bars are smaller than the symbols. For , the FWHM and linear absorbance plotted above 8.6 GPa are the summation of the three split peaks. Black solid lines represent linear regression fits to the data. Grey shaded areas represent the 95 % confidence intervals of the data. Changes in peak positions with P, i.e. (dν∕dP) values, with estimated standard deviations of the last digit in parentheses, are shown in (a) and (d). Green squares: the main NH4−ν3 peak; circles: the OH stretching vibration; black squares: the main NH4−ν4 peak and the summation of the three split peaks in (e, f); triangles: the two additional peaks resulting from splitting of this main bending vibration (ν4) with increasing P. The dashed line represents the line of discontinuity at 8.6 GPa in the behaviours of NH4−ν3, ν4 and OH stretching vibrations with P.
The evolution of the band with P up to 42 GPa is shown in Fig. 7d. The splitting of the antisymmetric bending vibration band into three peaks is observed with increasing P at ambient T. Similar splitting but only to two peaks was observed previously with cooling (see Fig. S3). This splitting and sharpening of the peaks starts at Ps of about 8.6 GPa, and the slopes (dν∕dP) are shown on the regression lines fitted through. In Fig. 7e and f, the FWHMs and linear absorbances of the the vibration are plotted vs. P. The discontinuity in the slopes of FWHMs and linear absorbances of the OH stretching and vibrations at 8.6 GPa (Fig. 7b and c) is also observed for the vibration even more explicitly (Fig. 7e and f).
5.1 Synthesis of NH4-phengite endmember and quantification
NH4-phengite endmember with composition (NH4)(Mg0.5Al1.5)(Al0.5Si3.5)O10(OH)2 was successfully synthesised at 700 ∘C, 4.0 GPa and 24 h. incorporation into phengite is confirmed by both XRD and IR methods. The lattice dimensions (Table 1) of the main polytypes synthesised here (2M2 and 2M1) are enlarged compared to its K analogues synthesised by Massonne and Schreyer (1986) and are comparable to the NH4-phengite polytypes produced by Watenphul et al. (2009) at identical synthesis conditions. This enlargement is mostly along the c direction owing to the slightly larger ionic radius of compared to K+ in the interlayer between the silicate sheets.
The IR spectrum at ambient conditions (Fig. S1) shows the IR-active modes of the molecule as well as the expected phengite lattice vibrations (Table S1). The OH stretching vibration has an identical wave number as in ammonium-free phengites (K-phengites), suggesting that the incorporation of has no visible effect on the OH vibration band at ambient conditions, which is reasonable from a structural point of view; both and K+ have the same charge and approximately the same ionic radii when 12-fold coordinated, so the neighbouring structure should be comparable in both cases.
Quantification of from IR spectra using different available calibration methods was quite challenging. To our knowledge, no method is calibrated for the quantification of in phengites, neither in tobelite–NH4-phengite nor NH4-phengite–phengite solid solutions. Therefore, we used the calibration methods available for muscovite-tobelite solid solutions.
According to charge balance, the maximum amount of that could be present in phengite is 1 pfu or 6.9 wt % (NH4)2O. The calculated (NH4)2O amount of 8.2±0.2 wt % using the Higashi (2000) IR calibration and the calculated (NH4)2O amount of 9.6±0.2 wt % using the Pöter et al. (2007) method exceed the maximum amount of that could be present in phengite. Therefore, we assume that the interlayer cation sites are fully occupied with , and, accordingly, we assume that the phengite produced in the current study has the composition (NH4)(Mg0.5Al1.5)(Al0.5Si3.5)O10(OH)2. This suggests that the IR calibration of Higashi (2000) and Pöter et al. (2007), which were established for the muscovite-tobelite solid solution series, overestimates the content in phengite. This holds as a confirmation to the importance of the establishment of a calibration method for quantification in phengite as previously suggested by Bentabol and Cruz (2016), who highlighted that mineral-specific calibrations for quantification are required for different types of mica minerals and different solid solutions.
5.2 T dependence of the OH stretching and vibrational modes
The splitting of the stretching and bending vibrations at 3291 and 1430 cm−1 respectively with decreasing T observed here in in situ experiments (Figs. 3, 4a, S2 and S3) has also been observed at low Ts in the IR spectra of other -bearing micas like synthetic tobelite (Mookherjee et al., 2002a), synthetic phlogopite (Mookherjee et al., 2002b) and in natural -bearing phengites (Yang et al., 2017). This splitting as well as the sharpening of the , ν4, the overtone (2ν4) and the combination bands (ν2+ν4) is attributed by the formerly mentioned studies to a low-T ordering process of the molecule based on the proposal by Pauling (1930), who first suggested such orientational ordering of tetrahedral molecules (like ) and the possibility of its transition from free rotation on cooling. Furthermore, with increasing T up to 600 ∘C, the decrease in absorbances of and the OH stretching vibrations cannot be attributed to OH or loss, since the spectra measured at ambient conditions before and after heating are comparable and thus indicate a reversible process (Fig. 3). The integral absorbance of the ν3 band at 3291 cm−1 (Fig. 4b), however, decreases by 86.9 % upon heating to 600 ∘C despite the concentration of being the same as at ambient conditions. This decrease in the integral absorbance of the band despite no loss of can be explained by (i) the molecule in the interlayer cation site getting disordered with increasing T and/or (ii) a T-induced decrease in the molar extinction coefficient of the molecule. Yang et al. (2017) has assigned this to a change in molar extinction coefficient2 with T. We, both looking at the whole T-dependent spectral series from −180 to 600 ∘C and observing the reversible expansion of the molecule (discussed below), rather assign this to a T-dependent order/disorder mechanism changing/reducing the local tetrahedral (Td) symmetry of the molecule and additionally changing the molar extinction coefficient. In other words, at ambient to high temperatures, the molecule is disordered and has an ideal cubic Td symmetry, and as a consequence, the and ν4 modes are triply degenerate. With cooling, the molecule is hindered in its dynamics and freezes, and it is distorted in terms of bond lengths and angles, the Td symmetry is reduced, and as a consequence the splits into three peaks and the splits into two peaks. A similar T-dependent order/disorder mechanism changing the local symmetry of the molecule was reported previously in studies on different ammonium perovskites (e.g. Knop et al., 1981; Niemann et al., 2016; Schuck et al., 2018). One to keep in mind is the T-dependent change in the molar extinction coefficient when performing in situ high-T IR studies as the real amount of incorporated in the structure still cannot be quantified.
The wave number shift of at 3291 cm−1 with increasing T (Fig. 4a) observed here reflects the lengthening of the N–H interatomic distance of the molecule with increasing T up to 600 ∘C. This expansion is reversible upon cooling back to room temperature. Similar shifting to lower wave numbers and lengthening of the N–H bond was also observed in the in situ T-dependent study performed by Yang et al. (2017) but only up to 500 ∘C on natural samples containing few parts per million of . At Ts higher than 500 ∘C, they observed no further N–H bond lengthening and they proposed that one hydrogen atom is detached from the molecule and linked to one of the basal oxygen atoms in the tetrahedral sheets, initiating the devolatilisation processes. Evidently, then, NH4-phengite endmember (studied here) and phengite containing only trace amounts (ppm) (such as that used in Liu et al., 2019, and Yang et al., 2017) of behave differently during heating in terms of expansion. Accordingly, from this in situ experiment, OH and seem to be stable and are still retained in the structure while heating up to 600 ∘C at least for a short period of time (about 60 min). On the other side, our quenched long-term (24 h) annealing experiments (Figs. 5, S4) showed that loss of and dehydration starts at Ts of 550 ∘C. This variation in Ts at which devolatilisation takes place with the experimental heating duration confirms that the kinetic effects partly control the destabilisation of in phengite in our experiments.
Comparing rates of devolatilisation in quenched long-term (24 h) annealing experiments, NH4-phengite endmember (NAD2) thin film (Figs. 5a, S4a) starts to lose and dehydrates at Ts of 550 ∘C. This T is much lower than the T of loss in single crystals of natural -bearing phengite with traces of , in which dehydration and loss were observed to start at 800 ∘C (Liu et al., 2019; Yang et al., 2017). This difference in the T might be due to the nature of the sample (i.e. thin film vs. single crystal, synthetic vs. natural). Our comparative study on thin films (NH4- and ammonium-free) vs. single crystals indicates that the devolatilisation at lower Ts is due to the sample preparation (thin film vs. single crystal). Moreover, loss occurs at the same Ts as the dehydration (Fig. 5d). The synchronous decrease in the intensities of the vibrations in which the OH is involved at 910 cm−1 with the decrease in the and OH bands confirms dehydration. The fact that also the vibrations at 750–830 cm−1 decrease let us suggest that H must be involved in these vibrations. However, it seems that even complete loss of OH and at 650 ∘C (thin films) does not lead to breakdown of the phengite structure as the main vibrational units can still be observed (Fig. S4).
5.3 P dependence of the OH stretching and vibrational modes
The shift of the OH band to lower wave numbers with increasing P as observed here (Fig. 7a) indicates the weakening of the O–H bond in the hydroxyl group through a lengthening of the O–H distance caused by shortening of the O⋯H and O⋯O hydrogen bond distances (Libowitzky, 1999). The OH stretching band becomes broader and seems to decrease in its absorbance (Figs. 6, 7c). The FWHM of the OH band displays a change in the slope from 1.7 cm−1 GPa−1 at Ps up to 8.6 GPa to 6 cm−1 GPa−1 for higher Ps (Fig. 7b). The wave numbers of the -ν3 band shift with increasing P to higher values. The shift to higher wave numbers indicates an increase in N–H bond strength (Harris and Bertolucci, 1989; Nakamoto, 1978, as cited in Beran et al., 2004) and hence shortening of the bond length generated by compression. This shortening of the bond length is much more pronounced at Ps above 8.6 GPa; the shift of peak positions (dν∕dP) increases from 1.5 cm−1 GPa−1 at Ps below 8.6 GPa to 5.0 cm−1 GPa−1 at higher Ps (Fig. 7a).
Recalling the concept of dipole moment, in the molecule, there are four similar N–H bonds (dipoles) that could be stretched antisymmetrically in relation to the Td symmetry elements giving rise to three identical stretching vibrations (), and there are H–N–H angles that could be bent in relation to the Td symmetry elements giving rise to three identical bending vibrations (); if any of these H–N–H angles change, then the resultant vector for the dipole of each N–H bond changes, the resultant partial dipole moment will change and the tetrahedral shape of the molecule (Td) will consequently change. This concept is of relevance with respect to the continuous increase in the absorbance of the vibration observed between 5 and 10 GPa (Figs. 6, 7c). This increase with increasing P can then be explained by a P-induced increase in the partial dipole moments of the molecule. Most probably the orientation of the dipoles (angles) changes with increasing P such that partial dipole moments increase. This change in the orientation of the partial dipoles is further emphasised by the splitting of the ν4 vibration into three peaks at Ps > 8.6 GPa (Fig. 7d). The P-induced discontinuity in the changes in the FWHM, the band positions, and the intensities of the OH and bands, as well as the observed splitting of the at Ps of about 8.6 GPa, all indicate local structural rearrangement affecting/reducing/lowering the Td symmetry of the molecule. The mechanism and type of symmetry reduction as a response to P are different from those involved with T.
5.4 Implications for nature
Our finding that remains stable in phengites at higher Ts and Ps than previously thought has important implications for the cycles of nitrogen and water between the Earth's crust and the mantle. Comparison between the composition of the bulk Earth and of carbonaceous chondrites shows that the Earth is depleted in nitrogen (Marty, 2012). Recent studies (e.g. Zedgenizov and Litasov, 2017) have suggested that this depletion can be due to “unaccounted” nitrogen that is stored in the Earth's deep interior. However, nitrogen has been reported in two forms: firstly in the form of within for example micas (Busigny et al., 2003, 2004; Higashi, 1982) and feldspar (e.g. Erd et al., 1964) in terrains that experienced high-grade metamorphism (Hall et al., 1996), and secondly in the form of N2-bearing micro- and nano-sized inclusions that may persist to great depths (Rudloff-Grund et al., 2016). In this regard, knowledge of the extent to which nitrogen that is subducted is released from metamorphic rocks during devolatilisation is extremely important in answering questions like the following. (1) Does nitrogen in the mantle have a primordial or recycled origin? (2) If it is recycled, how and what transports it to great depths? (3) What are the different P–T conditions controlling the efficiency of this recycling? The current study provides insights on the behaviour of and its connection to the hydroxyl (OH) in phengite, as one of the most important hosts and transporters for . As we show, complete breakdown of phengite does not occur until great depths, at high Ps and high Ts. As such we can demonstrate that crustal recycling and subduction could constitute a feasible mechanism for delivery of recycled N to the mantle, indicating that N stored in the mantle may not necessarily be primordial in its source. For the hydrogen cycle, according to previous studies (Ono, 1998; Schmidt, 1996; Schmidt and Poli, 1998), water transported into the mantle via phengite should not be lost until the complete breakdown of the mineral down to 300 km depths. However, the effect of on the stability and dehydration rates of phengite and other -bearing hydrous minerals has up to now remained uncertain. Liu et al. (2019) suggested that the presence of would trigger dehydration at shallower depths – in that the presence of increases the efficiency of phengite dehydration. Based on our data, it is tempting to suggest that does not have such an effect on recycling efficiency. However, the observed effect could also be attributed to the sample prepared as a thin film vs. single crystal rather than to the ammonium content. For better constraining of the P and T conditions at which NH4-phengite transports nitrogen into the deep levels of the upper mantle, spectroscopic investigations at simultaneous pressure and temperature conditions are needed.
All data derived from this research are presented in the enclosed tables and figures.
The supplement related to this article is available online at: https://doi.org/10.5194/ejm-32-469-2020-supplement.
MKM supervised all the spectroscopic measurements at ambient conditions as well as under Ps and Ts and reviewed and edited the various draft versions of the manuscript.
BW performed the piston-cylinder experiments and contributed to writing the manuscript.
IE reviewed and edited the various draft versions of the manuscript.
NAH performed the experiments (in the case of piston-cylinder experiments, she prepared the starting materials and the capsules), analysed and interpreted the data, and prepared their visual representation as well as wrote the first draft and all the revisions after discussion with the co-authors as a part of her PhD studies.
The authors declare that they have no conflict of interest.
The authors thank Eugen Libowitzky and two anonymous reviewers whose comments and suggestions greatly improved the manuscript. Bruno Lanson and Reto Gieré are thanked for editorial handling of the paper. Nada Abdel-Hak acknowledges Matthias Gottschalk for his help in learning and applying the Rietveld refinement method and Melanie Sieber for her help in learning and applying different fitting procedures with Origin. The authors thank Hans-Peter Nabein for generating the XRD patterns and Sathish Mayanna for helping with FE-SEM imaging. Thanks are due to Christian Chopin for providing the natural phengite. Michael Henehan is thanked for English editing and proofreading on a prior version of the manuscript. This work was made possible by a DAAD PhD scholarship granted to Nada Abdel-Hak.
The article processing charges for this open-access publication were covered by a Research Centre of the Helmholtz Association.
This paper was edited by Bruno Lanson and reviewed by Eugen Libowitzky and two anonymous referees.
Bentabol, M. and Cruz, M. D. R.: NH4 for K substitution in dioctahedral mica sythesized at 200 ∘C, Appl. Clay Sci., 126, 268–277, https://doi.org/10.1016/j.clay.2016.03.025, 2016.
Beran, A., Voll, D., and Schneider, H.: IR spectroscopy as a tool for the characterisation of ceramic precursor phases, in: Spectroscopic methods in mineralogy, edited by: Beran, A. and Libowitzky, E., Eötvös University Press, Budapest, 189–224, https://doi.org/10.1180/EMU-notes.6.5, 2004.
Burns, R.: Mineralogical Applications of Crystal Field Theory (Cambridge Topics in Mineral Physics and Chemistry), Cambridge University Press, https://doi.org/10.1017/CBO9780511524899,1993.
Busigny, V., Cartigny, P., Philippot, P., and Javoy, M.: Ammonium quantification in muscovite by infrared spectroscopy, Chem. Geol., 198, 21–31, https://doi.org/10.1016/S0009-2541(02)00420-5, 2003.
Busigny, V., Cartigny, P., Philippot, P., and Javoy, M.: Quantitative analysis of ammonium in biotite using infrared spectroscopy, Am. Mineral., 89, 1625–1630, https://doi.org/10.2138/am-2004-11-1206, 2004.
Chopin, C. and Maluski, H.: 40Ar-39Ar dating of high pressure metamorphic micas from the Gran Paradiso area (Western Alps): Evidence against the blocking temperature concept, Contrib. Mineral. Petr., 74, 109–122, https://doi.org/10.1007/BF01131997, 1980.
Efthimiopoulos, I., Müller, J., Winkler, B., Otzen, C., Harms, M., Schade, U., and Koch-Müller, M.: Vibrational response of strontianite at high pressures and high temperatures and construction of P–T phase diagram, Phys. Chem. Miner., 46, 27–35, https://doi.org/10.1007/s00269-018-0984-8, 2019.
Erd, R. C., White, D. E., Fahey, J. J., and Lee, D. E.: Buddingtonite, an ammonium feldspar with zeolitic water, Am. Mineral., 49, 831–850, 1964.
Goryainov, S. V., Krylov, A. S., Polyansky, O. P., and Vtyurin, A. N.: In-situ Raman study of phengite compressed in water medium under simultaneously high P–T parameters, J. Raman Spectrosc., 48, 1431–1437, https://doi.org/10.1002/jrs.5112, 2017.
Hall, A., Pereira, M. D., and Bea, F.: The abundance of ammonium in the granites of central Spain, and the behaviour of the ammonium ion during anatexis and fractional crystallization, Miner. Petrol., 56, 105–123, https://doi.org/10.1007/BF01162659, 1996.
Harlov, D. E., Andrut, M., and Melzer, S.: Characterization of NH4-phlogopite (NH4)(Mg3)[AlSi3O10](OH)2 and ND4-phlogopite (ND4)(Mg3)[AlSi3O10](OD)2 using IR spectroscopy and Rietveld refinement of XRD spectra, Phys. Chem. Miner., 28, 77–86, https://doi.org/10.1007/s002690000138, 2001.
Harris, D. C. and Bertolucci, M. D.: Symmetry and spectroscopy: An introduction to vibrational and electronic spectroscopy, Dover Publ., New York, 550 pp., 1989.
Herzberg, G.: Molecular Spectra and Molecular Structure, in: Infrared and Raman spectra of polyatomic molecules, Van Nostrand, Princeton, 1966.
Higashi, S.: Tobelite, a new ammonium dioctahedral mica, Mineral. J., 11, 138–146, https://doi.org/10.2465/minerj.11.138, 1982.
Higashi, S.: Ammonium-bearing mica and mica/smectite of several pottery stone and pyrophyllite deposits in Japan: their mineralogical properties and utilization, Appl. Clay Sci., 16, 171–184, https://doi.org/10.1016/S0169-1317(99)00052-6, 2000.
Hornig, D. F., White, H. F., and Reding, F. P.: The infrared spectra of crystalline H2O, D2O and HDO, Spectrochim. Acta, 12, 338–349, https://doi.org/10.1016/0371-1951(58)80060-0, 1958.
Kearley, G. J. and Oxton, L. A.: Recent advances in the vibrational spectroscopy of ammonium ion in crystal, in: Advances in Infrared and Raman Spectroscopy, edited by: Clark, R. J. H. and Hesters, R. E., Wiley, New York, 10 pp., 1983.
Keller, L. M., Abart, R., Schmid, S. M., and De Capitani, C.: Phase relations and chemical composition of phengite and paragonite in pelitic schists during decompression: a case study from Monte Rosa Nappe and Camughera-Moncucca Unit, Western Alps, J. Petrol., 46, 2145–2166, https://doi.org/10.1093/petrology/egi051, 2005.
Knop, O., Oxton, I. A., Westerhaus, W. J., and Falk, M.: Infrared Spectra of the Ammonium Ion in Crystals. Part 10—Low-temperature transitions in the perovskites NH4MF3 (M = Mn, Co, Zn), J. Chem. Soc. Farad. T., 77, 309–320, https://doi.org/10.1039/F29817700309, 1981.
Koch-Müller, M., Jahn, S., Birkholz, N., Ritter, E., and Schade, U.: Phase transitions in the system CaCO3 at high P and T determined by in situ vibrational spectroscopy in diamond anvil cells and first-principles simulations, Phys. Chem. Miner., 43, 545–561, https://doi.org/10.1007/s00269-016-0815-8, 2016.
Libowitzky, E.: Correlation of O-H stretching frequencies and O-H...O hydrogen bond lengths in minerals, Monatsh. Chem., 130, 1047–1059, https://doi.org/10.1007/BF03354882, 1999.
Liu, W. D., Yang, Y., Busigny, V., and Xia, Q. K.: Intimate link between ammonium loss of phengite and the deep Earth's water cycle, Earth Planet. Sc. Lett., 513, 95–102, https://doi.org/10.1016/j.epsl.2019.02.022, 2019.
Mao, H. K., Xu, J., and Bell, P. M.: Calibration of the ruby pressure gauge to 800 kbar under quasi-hydrostatic conditions, J. Geophys. Res., 91, 4673–4676, https://doi.org/10.1029/JB091iB05p04673, 1986.
Marty, B.: The origins and concentrations of water, carbon, nitrogen and noble gases on Earth, Earth Planet. Sc. Lett., 313–314, 56–66, https://doi.org/10.1016/j.epsl.2011.10.040, 2012.
Massonne, H.-J. and Schreyer, W.: High-pressure syntheses and X-ray properties of white micas in the system , Neues Jb. Miner. Abh., 153, 177–215, 1986.
McKeown, D. A., Bell, M. I., and Etz, E. S.: Vibrational analysis of the dioctahedral mica: 2M1 muscovite, Am. Mineral., 84, 1041–1048, https://doi.org/10.2138/am-1999-7-806, 1999.
Melzer, S. and Wunder, B.: Island-arc basalt alkali ratios: Constraints from phengite-fluid partitioning experiments, Geology, 28, 583–586, https://doi.org/10.1130/0091-7613(2000)28<583:IBARCF>2.0.CO;2, 2000.
Mikhail, S. and Sverjensky, D. A.: Nitrogen speciation in upper mantle fluids and the origin of Earth's nitrogen-rich atmosphere, Nat. Geosci., 7, 816–819, https://doi.org/10.1038/ngeo2271, 2014.
Mingram, B. and Bräuer, K.: Ammonium concentration and nitrogen isotope composition in metasedimentary rocks from different tectonometamorphic units of the Europen Variscan Belt, Geochim. Cosmochim. Ac., 65, 273–287, https://doi.org/10.1016/S0016-7037(00)00517-2, 2001.
Mirwald, P. W. and Massonne, H. -J.: Quartz-coesite transition and the comparative friction measurements in piston-cylinder apparatus using talc-alsimag glass (TAG) and NaCl high pressure cells: a discussion, Neues Jb. Miner. Monat., 469–477, 1980.
Mookherjee, M., Redfern, S. A. T., Zhang, M., and Harlov, D. E.: Orientational order-disorder of N(D,H)4+ in tobelite, Am. Mineral., 87, 1686–1691, https://doi.org/10.2138/am-2002-11-1218, 2002a.
Mookherjee, M., Redfern, S. A. T., Zhang, M., and Harlov, D. E.: Orientational order-disorder of / in synthetic ND4-phengite /NH4-phlogopite: a low-temperature infrared study, Eur. J. Mineral., 14, 1033–1039, https://doi.org/10.1127/0935-1221/2002/0014-1033, 2002b.
Nakamoto, K.: Infrared and Raman spectra of inorganic and coordination compounds, Wiley, New York, 448 pp., 1978.
Niemann, R. G., Kontos, A. G., Palles, D., Kamitsos, E. I., Kaltzoglou, A., Brivio, F., Falaras, P., and Cameron, P. J.: Halogen Effects on Ordering and Bonding of CH3NH in CH3NH3PbX3 (X = Cl, Br, I) Hybrid Perovskites: A Vibrational Spectroscopic Study, J. Phys. Chem. C, 120, 2509–2519, https://doi.org/10.1021/acs.jpcc.5b11256, 2016.
Ono, S.: Stability limits of hydrous minerals in sediment and mid-ocean ridge basalt compositions: implications for water transport in subduction zones, J. Geophys. Res., 103, 18253–18267, https://doi.org/10.1029/98JB01351, 1998.
Pauling, L.: Rotational motion of molecules in crystals, Phys. Rev., 36, 430–443, https://doi.org/10.1103/PhysRev.36.430, 1930.
Poli, S. and Schmidt, M. W.: H2O transport and release in subduction zones: Experimental constraints on basaltic and andesitic systems, J. Geophys. Res.-Sol. Ea., 100, 22299–22314, https://doi.org/10.1029/95JB01570, 1995.
Poli, S. and Schmidt, M. W.: Petrology of Subducted Slabs, Annu. Rev. Earth Pl. Sc., 30, 207–235, https://doi.org/10.1146/annurev.earth.30.091201.140550, 2002.
Pöter, B., Gottschalk, M., and Heinrich, W.: Crystal-chemistry of synthetic K-feldspar–buddingtonite and muscovite–tobelite solid solutions, Am. Mineral., 92, 151–165, https://doi.org/10.2138/am.2007.2137, 2007.
Price, J. M., Crofton, M. W., and Lee, Y. T.: Vibrational spectroscopy of the ammoniated ammonium ions NH(NH3)n (n=1-10), J. Phys. Chem., 95, 2182–2195, https://doi.org/10.1021/j100159a020, 1991.
Rudloff-Grund, J., Brenker, F. E., Marquardt, K., Howell, D., Schreiber, A., O`Reilly, S. Y., Griffin, W. L., and Kaminsky, F. V.: Nitrogen nanoinclusions in milky diamonds from Juina area, Mato Grosso State, Brazil, Lithos, 265, 57–67, https://doi.org/10.1016/j.lithos.2016.09.022, 2016.
Schmidt, M. W.: Experimental constraints on recycling of potassium from subducted oceanic crust, Science, 272, 1927–1930, 10.1126/science.272.5270.1927, 1996.
Schmidt, M. W. and Poli, S.: Experimentally based water budgets for dehydrating slabs and consequences for arc magma generation, Earth Planet. Sc. Lett., 163, 361–379, https://doi.org/10.1016/S0012-821X(98)00142-3, 1998.
Schuck, G., Többens, D. M., Koch-Müller, M., Efthimiopoulos, I. and Schorr, S.: Infrared Spectroscopic Study of Vibrational Modes across the Orthorhombic–Tetragonal Phase Transition in Methylammonium Lead Halide Single Crystals, J. Phys. Chem. C, 122, 5227–5237, https://doi.org/10.1021/acs.jpcc.7b11499, 2018.
Shannon, R.: Revised effective ionic radii and systematic studies of interatomic distances in halides and chalcogenides, Acta Crystallogr. A, 32, 751–767, https://doi.org/10.1107/S0567739476001551, 1976.
Toby, B. H. and Von Dreele, R. B.: GSAS-II: the genesis of a modern open-source all purpose crystallography software package, J. Appl. Crystallogr., 46, 544–549, https://doi.org/10.1107/S0021889813003531, 2013.
Vennari, C. E., O'Bannon, E. F., and Williams, Q.: The ammonium ion in a silicate under compression: infrared spectroscopy and powder X-ray diffraction of NH4AlSi3O8-buddingtonite to 30 GPa, Phys. Chem. Miner., 44, 149–161, https://doi.org/10.1007/s00269-016-0844-3, 2017.
Watenphul, A., Wunder, B., and Heinrich, W.: High-pressure ammonium-bearing silicates: Implications for nitrogen and hydrogen storage in the Earth's mantle, Am. Mineral., 94, 283–292, https://doi.org/10.2138/am.2009.2995, 2009.
Watenphul, A., Wunder, B., Wirth, R., and Heinrich, W.: Ammonium-bearing clinopyroxene: A potential nitrogen reservoir in the Earth's mantle, Chem. Geol., 270, 240–248, https://doi.org/10.1016/j.chemgeo.2009.12.003, 2010.
Whitney, D. L. and Evans, B. W.: Abbreviations for names of rock-forming minerals, Am. Mineral., 95, 185–187, https://doi.org/10.2138/am.2010.3371, 2010.
Wunder, B., Berryman, E., Plessen, B., Rhede, D., Koch-Müller, M., and Heinrich, W.: Synthetic and natural ammonium-bearing tourmaline, Am. Mineral., 100, 250–256, https://doi.org/10.2138/am-2015-5055, 2015.
Yang, Y., Busigny, V., Wang, Z. P., and Xia, Q. K.: The fate of ammonium in phengite at high temperature, Am. Mineral., 102, 2244–2253, https://doi.org/10.2138/am-2017-6094, 2017.
Yesilbas, M. and Boily, J.-F.: Thin ice films at mineral surfaces, J. Phys. Chem. Lett., 7, 2849–2855, https://doi.org/10.1021/acs.jpclett.6b01037, 2016.
Zhang, M., Redfern, S. A., Salje, E. K., Carpenter, M. A., and Hayward, C. L.: Thermal behavior of vibrational phonons and hydroxyls of muscovite in dehydroxylation: In situ high-temperature infrared spectroscopic investigations, Am. Mineral., 95, 1444–1457, https://doi.org/10.2138/am.2010.3472, 2010.
Zedgenizov, D. A. and Litasov, K. L.: Looking for “missing” nitrogen in the deep Earth, Am. Mineral., 102, 1769–1770, https://doi.org/10.2138/am-2017-6218, 2017.
The absorption coefficient α (cm−1) is calculated by dividing the absorbance (A) by the sample thickness (d) in centimetres, according to the Beer–Lambert law (Burns, 1993).
The reader is referred to the fact that Yang et al. 2017 used the term absorption coefficient to express the molar extinction coefficient (ε). This is different from our usage for the term absorption coefficient in the current study.