the Creative Commons Attribution 4.0 License.
the Creative Commons Attribution 4.0 License.
 | 30 Jul 2020
Na-feldspar: temperature, pressure and the state of order
Herbert Kroll
Hans Ulrich Bambauer
Horst Pentinghaus
In feldspars, mean tetrahedral T–O bond lengths (T = Al,Si) are the standard measure of the tetrahedral Al content. However, for a sophisticated assessment of the Al,Si distribution, factors have to be accounted for (1) that cause individual T–O bond lengths to deviate from their tetrahedral means and (2) that cause mean tetrahedral lengths to deviate from values specified by the Al content. We investigated low albite, Na[AlSi3O8], from six X-ray crystal structure refinements available in the literature. The Al,Si distribution of low albite is fully ordered so that Al,Si–O bond length variations result only from bond perturbing factors. For the intra-tetrahedral variation , only two factors turned out to be effective: (1) the sum of bond critical point electron densities in the Na–O and T–O bonds neighbouring the T–O bond under consideration and (2) the fractional s-bond character of the bridging oxygen atom. This model resulted in a root mean square (rms) value for ΔT–O of only 0.002 Å, comparable to the estimated standard deviations (esd's) routinely quoted in X-ray and neutron structure refinements. In the second step, the inter-tetrahedral differences were considered. Here, apart from the tetrahedral Al content, the only size-perturbing factor is the difference between the tetrahedral and the grand mean fractional s-characters. The resulting rms value was as small as 0.0003 Å.
From this analysis, Al site occupancies, t, can be derived from observed mean tetrahedral distances, 〈T–O〉obs, as
with the observed distance 〈T–O〉obs adjusted for the influence of the fractional s-character, . This equation served to determine the site occupancies of 16 intermediate to high albites and one analbite from their mean tetrahedral distances. It was found that the individual site occupancies t10, t1m and t20= t2m all vary linearly with the difference Δt1= t10− t1m. Δt1, in turn, varies linearly with the length difference, Δtr[110], between the unit cell repeat distances [1∕2a, 1∕2b, 0] and [1∕2a, , 0]. Then, from the Δtr[110] indicator, values of t were obtained as
with b0=0.7288(16), b1=0.1103(59) and b2=3.234(32) Å−1.
Finally, from an expression that converts the Δ2θ(131) measure of order into Δtr[110] and thus into site occupancies, it was possible to obtain from the unique suite of bracketed high-pressure experiments performed on albites by Goldsmith and Jenkins (1985) the evolution with equilibrium temperature of the thermodynamic order parameter Qod and of the individual Al site occupancies t at a pressure of 1 bar. For that purpose, since the Goldsmith and Jenkins experiments were performed at ≈18 kbar, a procedure was devised that accounts for the effect of pressure on the state of order. At 1 bar, low albite is stable up to 590 ∘C, where it begins to disorder, turning into high albite above 720 ∘C. The highly though not fully disordered monoclinic state (monalbite) is reached at 980 ∘C, 1 bar, and 1055 ∘C, 18 kbar, respectively. Eventually, when applying the determinative equations given above to low microcline, full order is predicted as in low albite.
Please read the corrigendum first before continuing.
-
Notice on corrigendum
The requested paper has a corresponding corrigendum published. Please read the corrigendum first before downloading the article.
-
Article
(2922 KB)
-
The requested paper has a corresponding corrigendum published. Please read the corrigendum first before downloading the article.
- Article
(2922 KB) - Full-text XML
- Corrigendum
- BibTeX
- EndNote


The phase relations of alkali feldspars, (Na,K)[AlSi3O8], have been debated for several decades, although as early as 1960 in his salient paper Al/Si Verteilungen, Phasen-Transformationen und Namen der Alkali-Feldspäte (later on translated into English by the late Joseph V. Smith), Fritz Laves had already clarified the “confusion” (Laves and Goldsmith, 1961) about the stability and metastability of the Na- and K-feldspar polymorphs and varieties. For Na-feldspar, Na[AlSi3O8], two stable modifications are accepted to exist: monoclinic monalbite, SG C2∕m (T>980 ∘C), and triclinic albite, SG (T<980 ∘C; Laves, 1960; Winter et al., 1979; Kroll et al., 1980). Analbite is the triclinic quench product of monalbite, metastable at any P, T conditions. Sanidine, SG C2∕m, and low microcline, SG , are the stable polymorphs of K-feldspar, K[AlSi3O8], the transition temperature lying somewhere between 450 and 480 ∘C (Bambauer et al., 2005). It took until 1994, when Carpenter and Salje asserted the first-order character of the sanidine to microcline transition, ending the dispute about the “stability” of so-called intermediate microcline.
In monalbite, similar to sanidine, there are two symmetrically non-equivalent tetrahedral sites, T1 and T2, onto which the Al and Si atoms are distributed in a highly disordered but not completely random manner. When judging from tetrahedral sizes, even at high temperatures the larger Al atom slightly prefers the T1 over the T2 site (Winter et al., 1979; Scambos et al., 1987), denoted by t1> t2, with t = Al content Al∕(Al+Si) of the respective T site (Kroll, 1971). On quenching, a displacive phase transition due to shearing of the framework reduces the symmetry of monalbite to triclinic analbite (AA), where each of the T1 and T2 sites splits into two non-equivalent sites, T10, T1m and T20, T2m, while the topochemically monoclinic Al,Si distribution is preserved, t10 = t1m > t20 = t2m. On slow cooling, Al becomes gradually enriched in one of the two T1 sites, termed T10 (diffusive transition), while the other three sites become depleted of Al at about the same rate (one-step ordering; Stewart and Ribbe, 1969; Meneghinello et al., 1999), t10 > t1m ≈ t20 ≈ t2m. High albite (HA), intermediate albite (IA) and low albite (LA) denote increasing states of order. The question of whether low albite is indeed fully ordered has been answered by Smith et al. (1986). They refined the structure of low albite at 13 K by neutron diffraction analysis and found 0.997(4) Al in T10, 1.001(3) Si in T1m, 1.002(3) Si in T20 and 1.006(3) Si in T2m. For simplicity, we assume in the following that LA is fully ordered, being well aware that thermodynamics requires that this state can principally apply only at 0 K.
Even though a multitude of albite crystal structure refinements have been performed at ambient and elevated temperatures, few refinements are available on samples that have been demonstrably equilibrated with respect to their Al,Si distribution. Only Ribbe (1994) presented a diagram of Al site occupancies vs. temperature based on four structure refinements: one published and three unpublished. The crystals had been equilibrated in reversed experiments as part of a high-pressure study by Goldsmith and Jenkins (1985) aimed at clarifying the nature of the high- to low-albite transition, which turned out to be smooth and continuous, being restricted to the temperature range between ca. 590 and 720 ∘C when the influence of pressure on the equilibrium temperature is accounted for (see below). Without a symmetry change, the transition links partly ordered triclinic HA to fully ordered triclinic LA and thus may be understandably smooth, contrasting to the sanidine–microcline transition that leads from monoclinic to triclinic states.
For his presentation of the temperature variation in the Al,Si distribution in Na-feldspar, Ribbe (1994) derived site occupancies t from mean tetrahedral distances 〈T–O〉obs using the expression (Kroll and Ribbe, 1983)
where nAn is the mole fraction of the anorthite (CaA12Si2O8) component, K is the size difference between pure Al and pure Si tetrahedra (K=0.127(3) Å; see below), and 〈〈T–O〉〉 is the grand mean of the 4×4 individual T–O distances corresponding to the formula unit. Ribbe derived t values from 〈T–O〉 distances because direct refinement of site occupancies is hampered in X-ray structure work due to the similarity of Al and Si scattering powers.
When 〈T–O〉 data are lacking, numerous models have been proposed to obtain site occupancies from unit cell dimensions and optic axial angles (Stewart and Ribbe, 1969; Kroll, 1971, 1973; Kroll and Ribbe, 1983, 1987; Hovis, 1986; Su et al., 1986).
It is our goal to utilise the equilibrated experiments of Goldsmith and Jenkins (1985) and Waterwiese et al. (1995) to derive from reported diffraction peak positions and lattice parameters the Al site occupancies of Na-feldspar as a function of both temperature and pressure. From the unit cell dimensions given by Waterwiese et al. (1995), values for t can be easily obtained. Goldsmith and Jenkins (1985), however, provided only the differences between two peak positions, (CuKα1 radiation), that react sensitively to changes in the Al,Si distribution. We calibrate this difference in terms of the parameter (Kroll, 1971, 1973)
where tr[110] and denote the translational distances in the [110] and directions of the C-centred lattice. Δtr[110] is directly related to Δt1≡ t10 − t1m as is apparent from the following consideration (Fig. 1). The sequence of tetrahedral sites along [110] is T10→T20→T2m; along [10] it is T1m→T20→T2m. Consequently, since the ionic radius of Al is larger than that of Si, the [110] repeat will gain length at the expense of the [10] repeat as Al migrates from T1m, T20 and T2m into T10 during ordering in the triclinic state.
However, finding (t10 − t1m) for the Goldsmith and Jenkins data does not help much to construct t vs. T because to do so we need to know all four individual t values. Fortunately, there are structure refinements available not only for LA but also for IA (Phillips et al., 1989; Meneghinello et al., 1999; Tribaudino et al., 2018), HA (Prewitt et al., 1976; Winter et al., 1979) and AA (Curetti et al., 2011). From these, we investigate relations between (t10 − t1m) on the one hand and the four individual t values on the other hand. Deriving site occupancies from tetrahedral distances, however, inevitably leads to a discussion of the correlations that exist between T–O bond lengths and their specific atomic environments. Therefore, we first pursue this discussion.

Figure 1Idealised projection of the feldspar framework along the c* direction onto the (001) plane. Only tetrahedral nodes and no oxygen atoms are shown (after Laves, 1960). A deformation ellipse is drawn in the centre of the figure, indicating those directions along which the albite structure most strongly responds to the Al,Si ordering process. As the larger Al ions concentrate in T10 during ordering, the [110] direction will expand, while the direction will contract. The length difference is thus a useful measure of the site occupancy difference (t10 − t1m). Note that the T20 and T2m occupancies do not contribute to changes in the length difference since those tetrahedra lose (gain) Al at equal rates during ordering (disordering).
2.1 Correlations
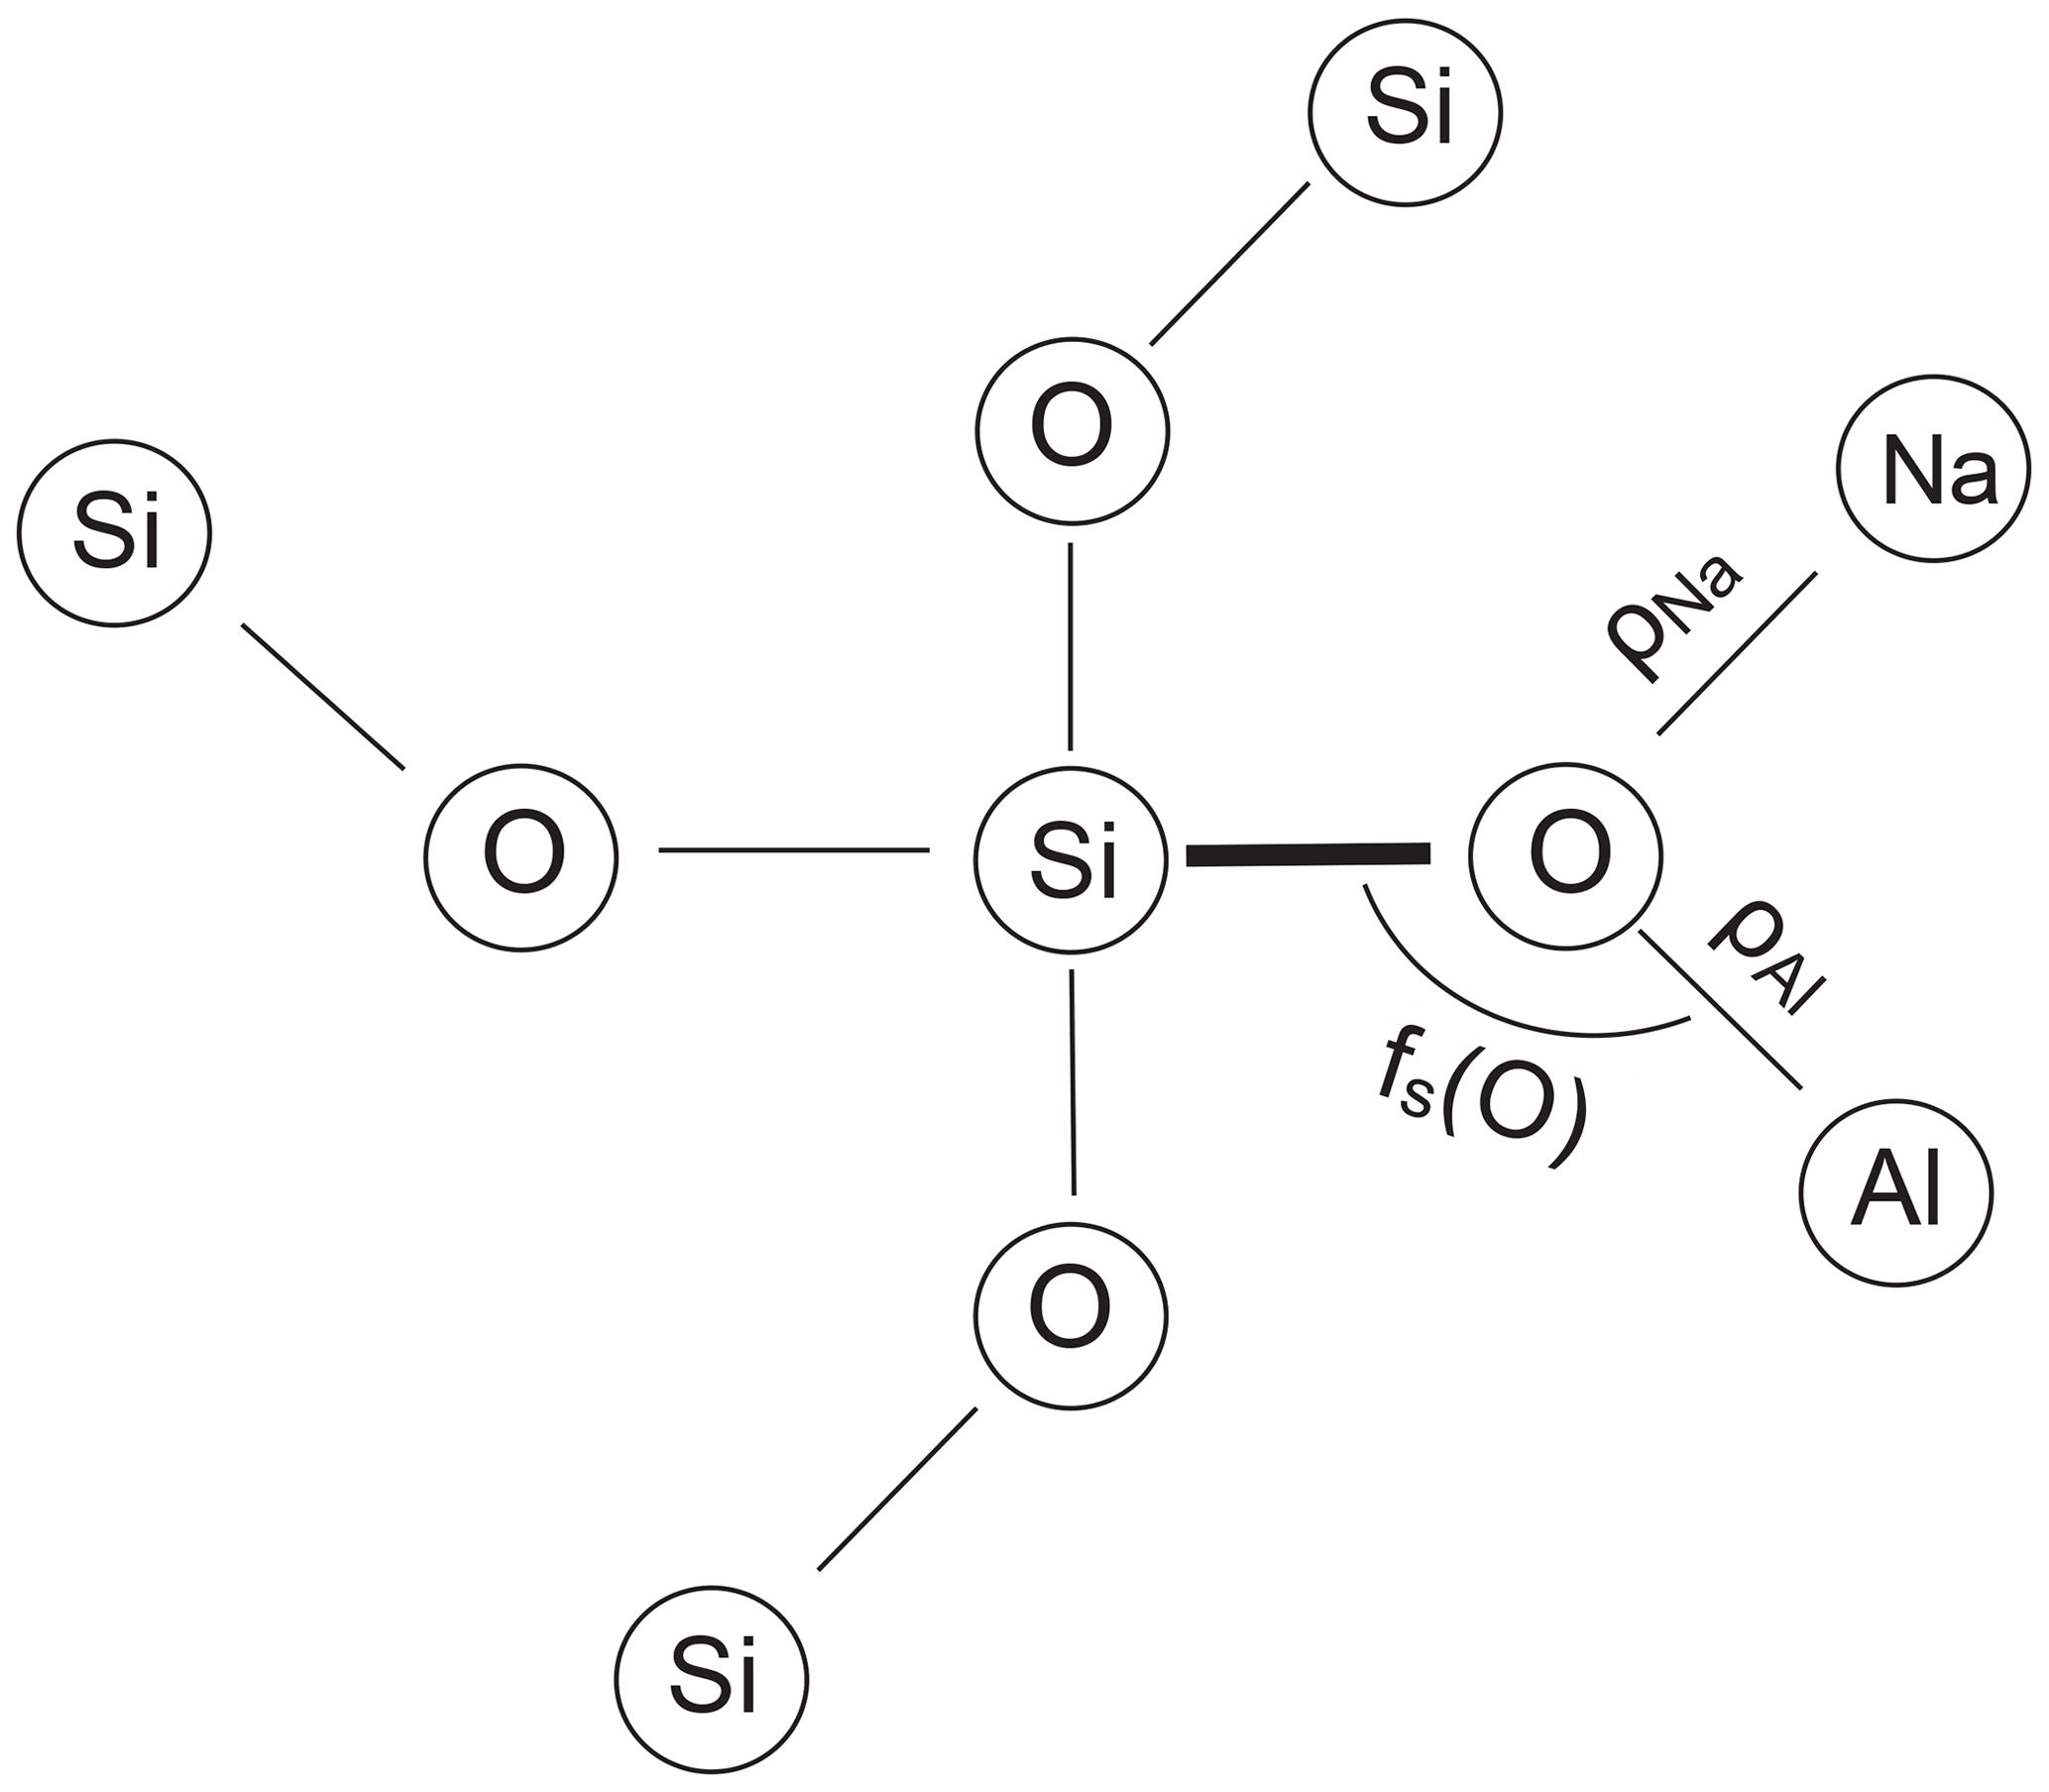
The length of an individual T–O bond in a feldspar structure primarily reflects the Al content of the respective tetrahedral site. To some extent, however, the bond length is modified by secondary factors related to the atomic environment of the bond (Fig. 2). The following correlations have been discussed in the literature:
-
The linkage factor. Phillips and Ribbe (1973) noted that Si–O → Si bonds are 0.03 Å longer than Si–O → Al bonds.
-
Bonding to the non-tetrahedral cation (A cation). T–O distances tend to increase with the number of A cations coordinated to the bridging oxygen atom, this effect being pronounced when the A–O distances are small (Fleet et al., 1966; Brown et al., 1969; Geisinger et al., 1985).
-
The T–O–T angle. Shorter T–O bonds tend to be involved in larger T–O–T angles (Phillips et al., 1973; Gibbs et al., 1981; Wenk and Kroll, 1984).
-
The O–T–O angle. Geisinger et al. (1985) found that the average of the three O–T–O angles common to a T–O bond is inversely related to its length.
-
The isotropic displacement factor, BO. Liebau (1985) reported that large atomic displacement factors are associated with small T–O distances and large T–O–T angles.
2.2 Modelling correlations
- (1, 2)
Downs et al. (1996) performed procrystal electron density calculations on low albite by placing spherically averaged wave functions at the known atomic positions (independent atom model). The electron density obtained this way closely approximates the experimental electron density. From a topological analysis, bonded pairs of atoms can be identified. According to Bader (1990), a bond between two atoms is established if a saddle point exists in the path between the pair of atoms where the gradient of the electron density is zero and the curvature is positive along the path but negative normal to it. The saddle point defines the bond critical point, rc. The concentration of the electron density at rc, ρ(rc), is related to the strength of the bond, typically the larger ρ(rc) the shorter the bond (Gibbs et al., 2014). Downs et al. (1996), when considering the environment of the OA2 atom in LA, which is bonded to two Si atoms plus one Na atom at a very short distance, noted that the two Si–O bond lengths are the largest in the structure. They ascribed this finding to the relatively large electron density in the short Na–OA2 bond, “which leaves fewer electrons available for the two Si–O bonds, making them weaker and thus longer”. It therefore appears sensible to relate the length of a T–O bond to the sum of the critical point electron densities ρ(rc) that are located in the neighbouring T–O and Na–O bonds (Fig. 2).
Gibbs et al. (2014) investigated experimental and calculated electron density distributions in oxides, silicates and siloxane molecules and established a power law between critical point density ρ(rc) and bond length M–O,
where r is the row number of M in the periodic table, and the angle brackets 〈…〉 denote polyhedral averages. The authors demonstrated that ρ(rc) numerically agrees with the familiar Pauling bond strength concept, where bond strength s= formal valence or coordination number.
- (3)
The third factor that perturbs T–O bond lengths is the T–O–T angle (Fig. 2). Its influence has been the subject of some debate but has been shown to be effective in studies by Gibbs et al. (1981), Wenk and Kroll (1984), Geisinger et al. (1985) and Angel et al. (1990). The T–O–T angle influence is linearised by considering the fractional s-character, fs(O), of the hybrid oxygen orbitals directed toward the two T atoms, where λ is the mixing coefficient, and is the fractional s-character, with (Coulson, 1961; Newton and Gibbs, 1980):
- (4)
In a similar way, the fractional s-character of the central T atom, fs(T), has been cast by Boisen and Gibbs (1987) into the expression
where 〈θ〉3 is the average of the three O–T–O angles common to a T–O bond (see the scheme in Fig. 2).
- (5)
The correlation observed by Liebau (1985) between T–O distances and BO competes against the one between T–O distances and T–O–T angles.
2.3 Regression model
2.3.1 Intra-tetrahedral bond length variations
In our regression analysis, we did not consider the individual T–O distances as the dependent variables but instead used the deviations between individual and mean values, thereby separating intra- and inter-tetrahedral variations:
This measure helps to avoid effects that do not originate in the local atomic environments of T–O bonds. For example, in fully ordered LA, experimental 〈Al–O〉 distances vary from 1.739 to 1.742 Å. 〈〈T–O〉〉 distances are not constant either, varying from 1.644 to 1.646 Å. Furthermore, when Na-feldspar becomes disordered, the 〈〈T–O〉〉 distances are observed to shrink by 0.002–0.003 Å (Ribbe, 1984).
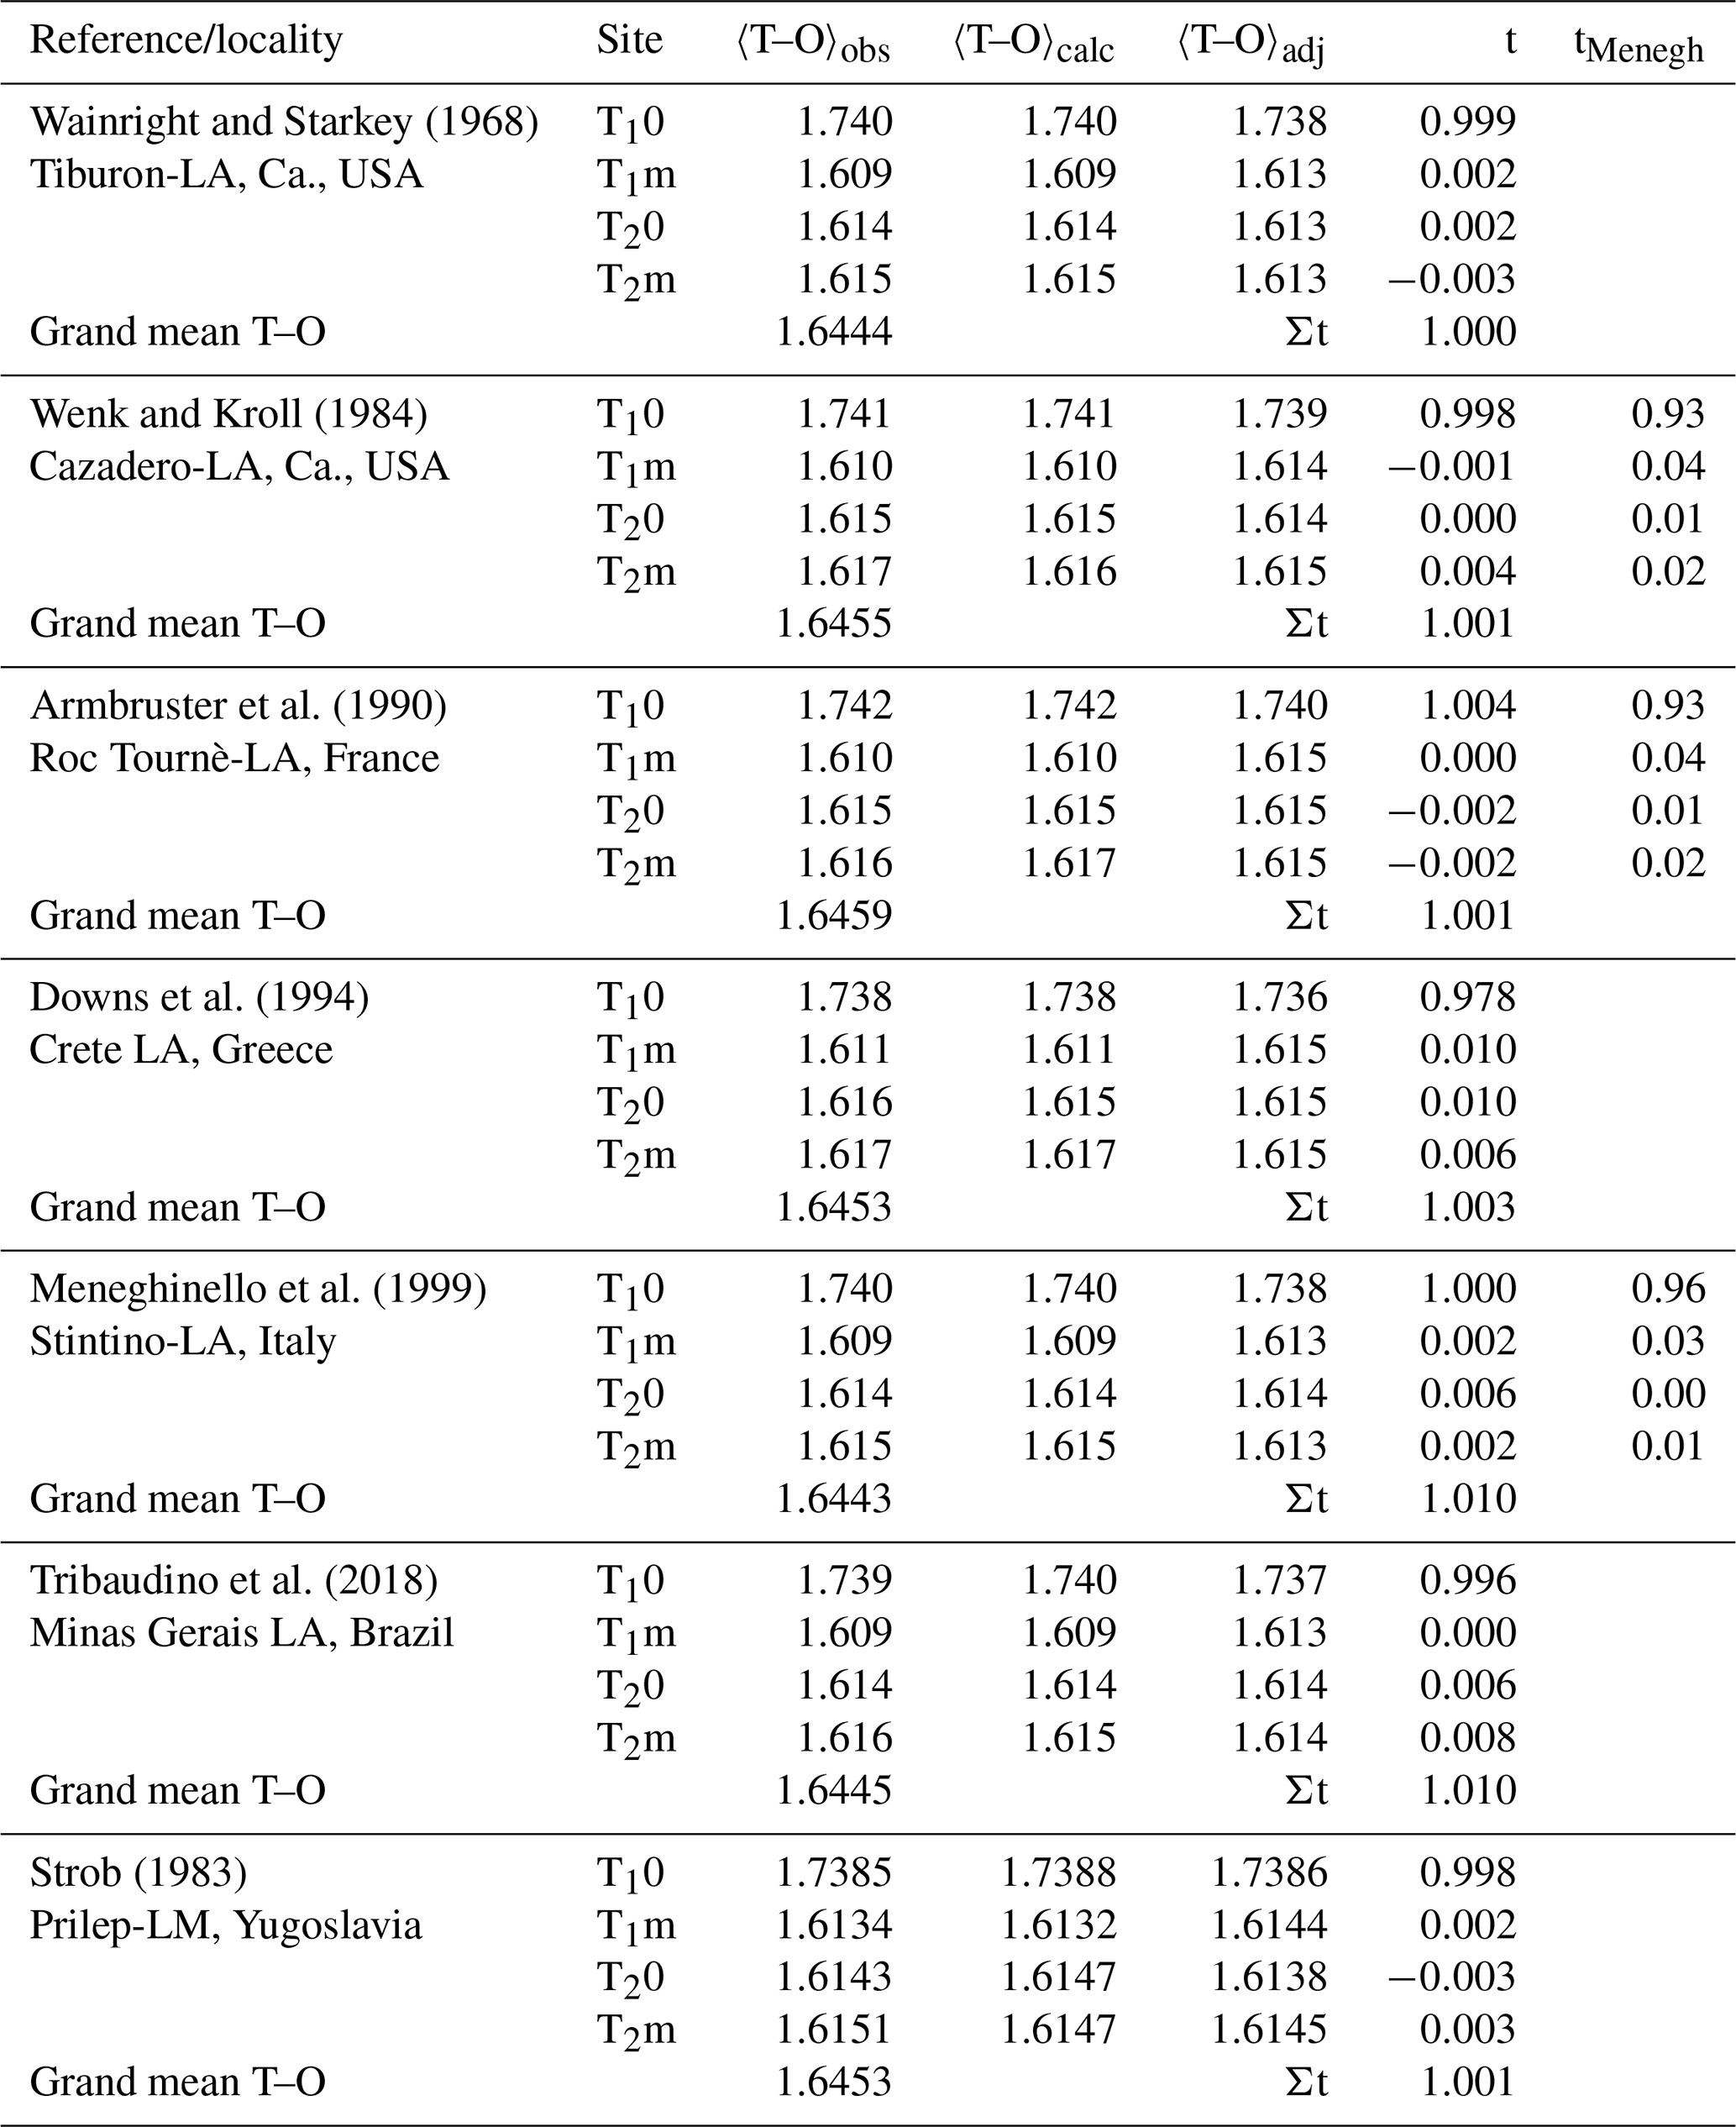
Our analysis relies on a methodically homogeneous group of six X-ray structure refinements of low-albite crystals available from the literature (Table 1), deliberately omitting neutron structure refinements by Harlow and Brown (1980) and Smith et al. (1986).
Table 1Mean tetrahedral distances, 〈T–O〉 [Å], and Al site occupancies, t, of six low albites and one low microcline. (Eq. 8). 〈T–O〉adj and t come from Eq. (9) (). Site occupancies tMenegh from Meneghinello et al. (1999) are listed for comparison.
We use the notation , and similarly , and so on, where the simple angle brackets mean tetrahedral averages, and the double brackets are grand mean values. ρNa is the sum of the critical point densities in the 0, 1 or 2 Na–O bonds adjacent to the T–O bond under consideration, and similarly ρT is the critical point density in the T–O bond neighbour.
In the first regression run, we have chosen the first term on the right-hand side of Eq. (6), , as the dependent variable and all five variables discussed above as the independent variables, viz. . It was immediately clear that the Δfs(T) term was insignificant (Student t value =1.3) as was also found by Angel et al. (1990) in their analysis of An-rich plagioclases. ΔBO also turned out to be insignificant in the presence of Δfs(O) (Student t value =1.8). The correlation coefficient, r, between these two variables is 0.90. Despite the large r value, substituting ΔBO for Δfs(O) deteriorated the fit. ΔBO was thus not considered any further. Note, however, that Boisen et al. (1990), in their analysis of bond length variations in coesite, the silica polymorphs and the clathrasils, found that both ΔBO and Δfs(O) contributed significantly to the regression sum of squares. The three variables left over at this point could be reduced further by combining ΔρNa and ΔρT into one variable, , as their regression coefficients agreed just within their mutual standard deviations.
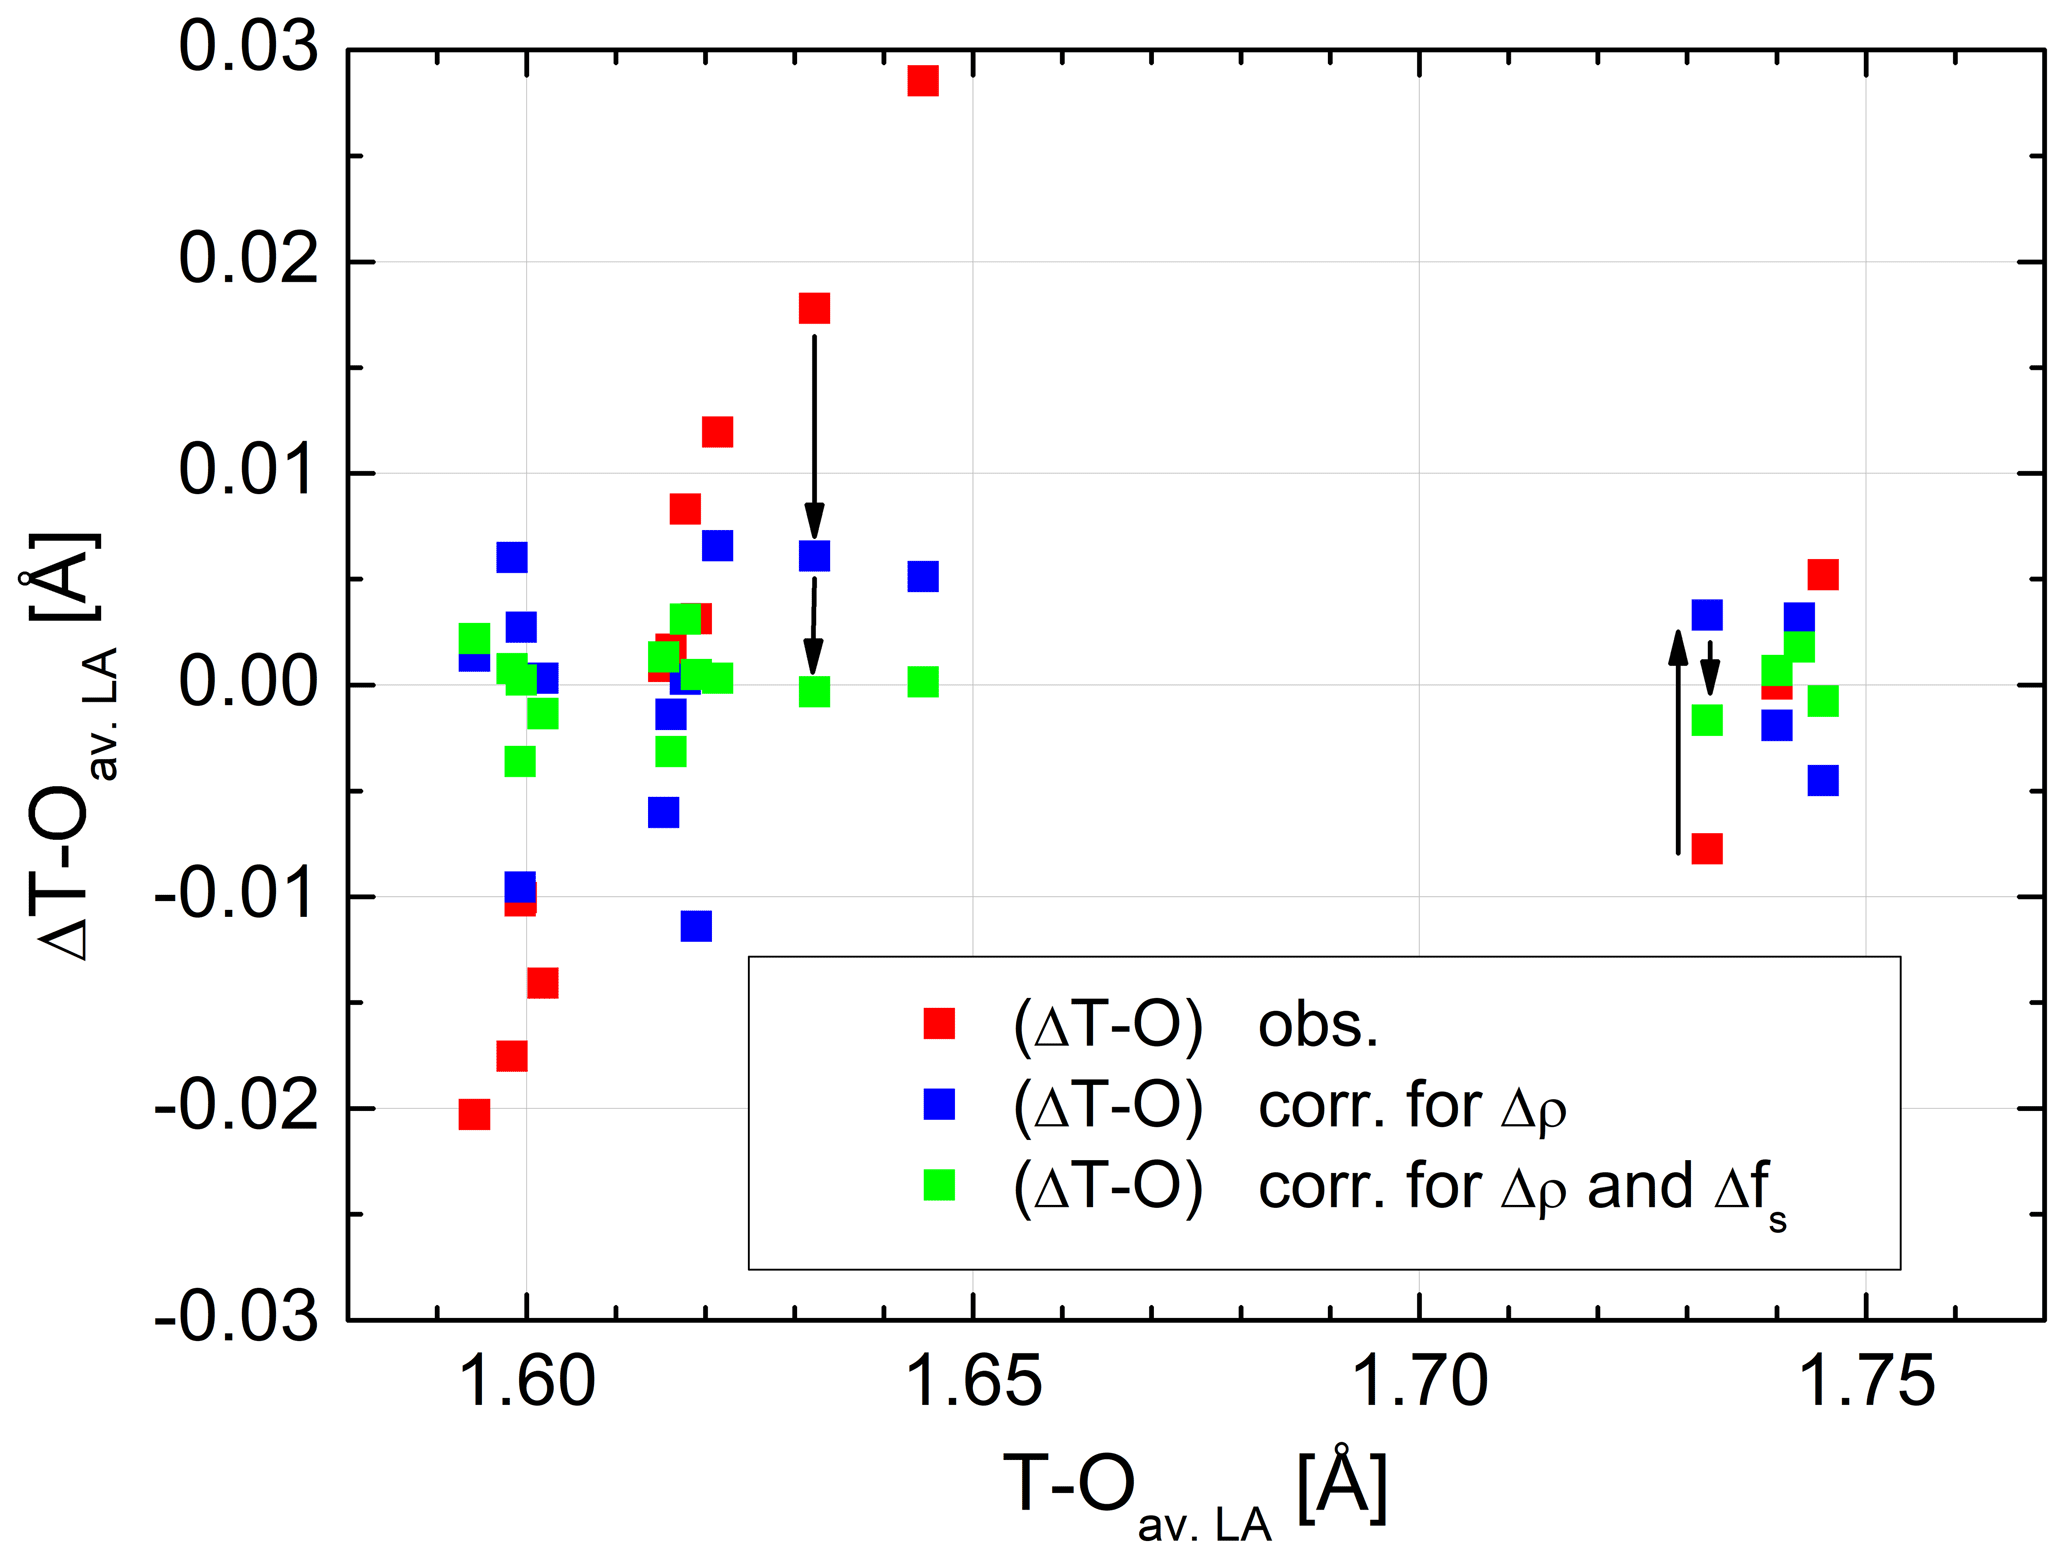
Figure 3Distance differences plotted versus individual T–O distances in average low albite, before and after adjustment. Red squares: observed ΔT–O differences, blue squares: ΔT–O after adjustment for the Δρ effect (bond critical point electron densities), green squares: ΔT–O after adjustment for both the Δρ and the Δfs(O) effects (fractional s-character of the bridging O atom). For two bonds, T10–OC0 and T20–OA2, the effects are visualised by arrows. The sizes of the data points comply with the typical error.
At this point it is appropriate to briefly discuss our choice of the Na coordination by oxygen atoms on which the determination of ΔρNa,T is based. In their topological analysis of procrystal electron densities in LA, Downs et al. (1996) could identify bond critical points only between Na and its five nearest O neighbours. We started with this assumption but found a large scatter of the residuals in the ΔT–O fit, with the root mean square (rms) deviation Å. More seriously, several clusters of residuals, each consisting of six individual ΔT–O values from the six LAs, displayed systematic shifts either below or above the zero mean. The problem only vanished when we assumed Na to be eight-coordinated rather than five-coordinated. This finding may point to a deficiency of the procrystal model in accurately identifying weak interactions.
The regression results for the equation
are listed in Table 2. The effect that the two factors have on ΔT–O is illustrated in Fig. 3. In order to avoid overcrowding the diagram by plotting the total number of 6×16 data points, we have taken mean values of all variables of the six low albites to obtain an average low albite. is seen to vary over a range of 0.05 Å. When the correlation with ΔρNa,T is accounted for, , the variation drops considerably to only ±0.01 Å conforming to the large correlation between ΔT–O and ΔρNa,T, r=0.91. In contrast, the correlation between ΔT–O and Δfs(O) is small, . However, when considering the correlation between ΔT–Oadj and Δfs(O), r increases to −0.92. Therefore, the scatter left after adjusting ΔT–O for theΔρNa,T factor is further reduced so that the final root mean square deviation is as small as 0.002 Å, a value that corresponds to the esd's routinely quoted in the literature for T–O distances observed in X-ray and neutron structure refinements. Weighting has been applied in the final run according to the rms values of the six individual LA regressions, which, however, vary little, from 0.0020 Å (Crete LA) to 0.0029 Å (Minas Gerais LA).
Table 2Results of the regression analyses according to Eqs. (7) and (8). Errors given in parentheses refer to the last decimal places.

2.3.2 Inter-tetrahedral variation
The second term on the right-hand side of Eq. (6), , depends primarily on the difference between the tetrahedral Al content and its grand mean value, . In principle, the difference between tetrahedral and grand mean ΔρNa,T values could comprise a second correlation. However, Δt and Δ〈ρNa,T〉 heavily correlate, r=0.97, so that one of the two variables is redundant, and that is Δ〈ρNa,T〉 rather than Δt, of course. The large correlation is mainly a consequence of the linkage factor inasmuch as the T1O tetrahedron, which is occupied by Al, has short neighbouring Si–O distances hosting large critical point electron densities. In addition, the oxygen atoms of the T1O tetrahedron have small Na–O distances so that in summary 〈ρ〉−〈〈ρ〉〉 is large and positive for T1O and small and negative for the Si tetrahedra, as is t−〈t〉. Discarding Δ〈ρ〉 leaves Δ〈fs(O)〉 as the next candidate:
Since we are dealing with fully ordered LA, it was assumed in the regression analysis that t = t10 = 1 for the T10 tetrahedron, and t = t1m = t20 = t2m for the three Si-containing tetrahedra.
The regression results given in Table 2 demonstrate small standard deviations for the c3 and c4 coefficients and accordingly large Student t values which are much larger than those for the c1 and c2 coefficients, indicating that mean tetrahedral T–O distances can be more precisely fitted than individual distances in low albites. Indeed, the rms value only amounts to Å. The large Student t value of the c3 coefficient when compared to the c4 coefficient demonstrates that – not surprisingly – Δ〈T–O〉 mainly depends on Δt and to a lesser extent on Δ〈fs(O)〉.
Figure 4 demonstrates the quality of the fit. 〈T–O〉 distances calculated from Eq. (8) and observed distances follow straight lines with a slope of 1. No systematic deviation that would point to a deficiency of the model is observed. This could only be achieved after choosing CN(Na) =8 rather than 5. From the six LA structures that we are considering, six data points result for each of the four non-equivalent tetrahedra. Ideally, these data points should coincide. They do not because each of the six low albites has its own grand mean T–O distance, an effect that smears the data points over the diagonal. In addition, deviations from complete order have the same effect as can be seen for the Crete LA, which has the smallest 〈T10–O〉 distance, indicating slight disorder (also suggested by its lattice parameters).
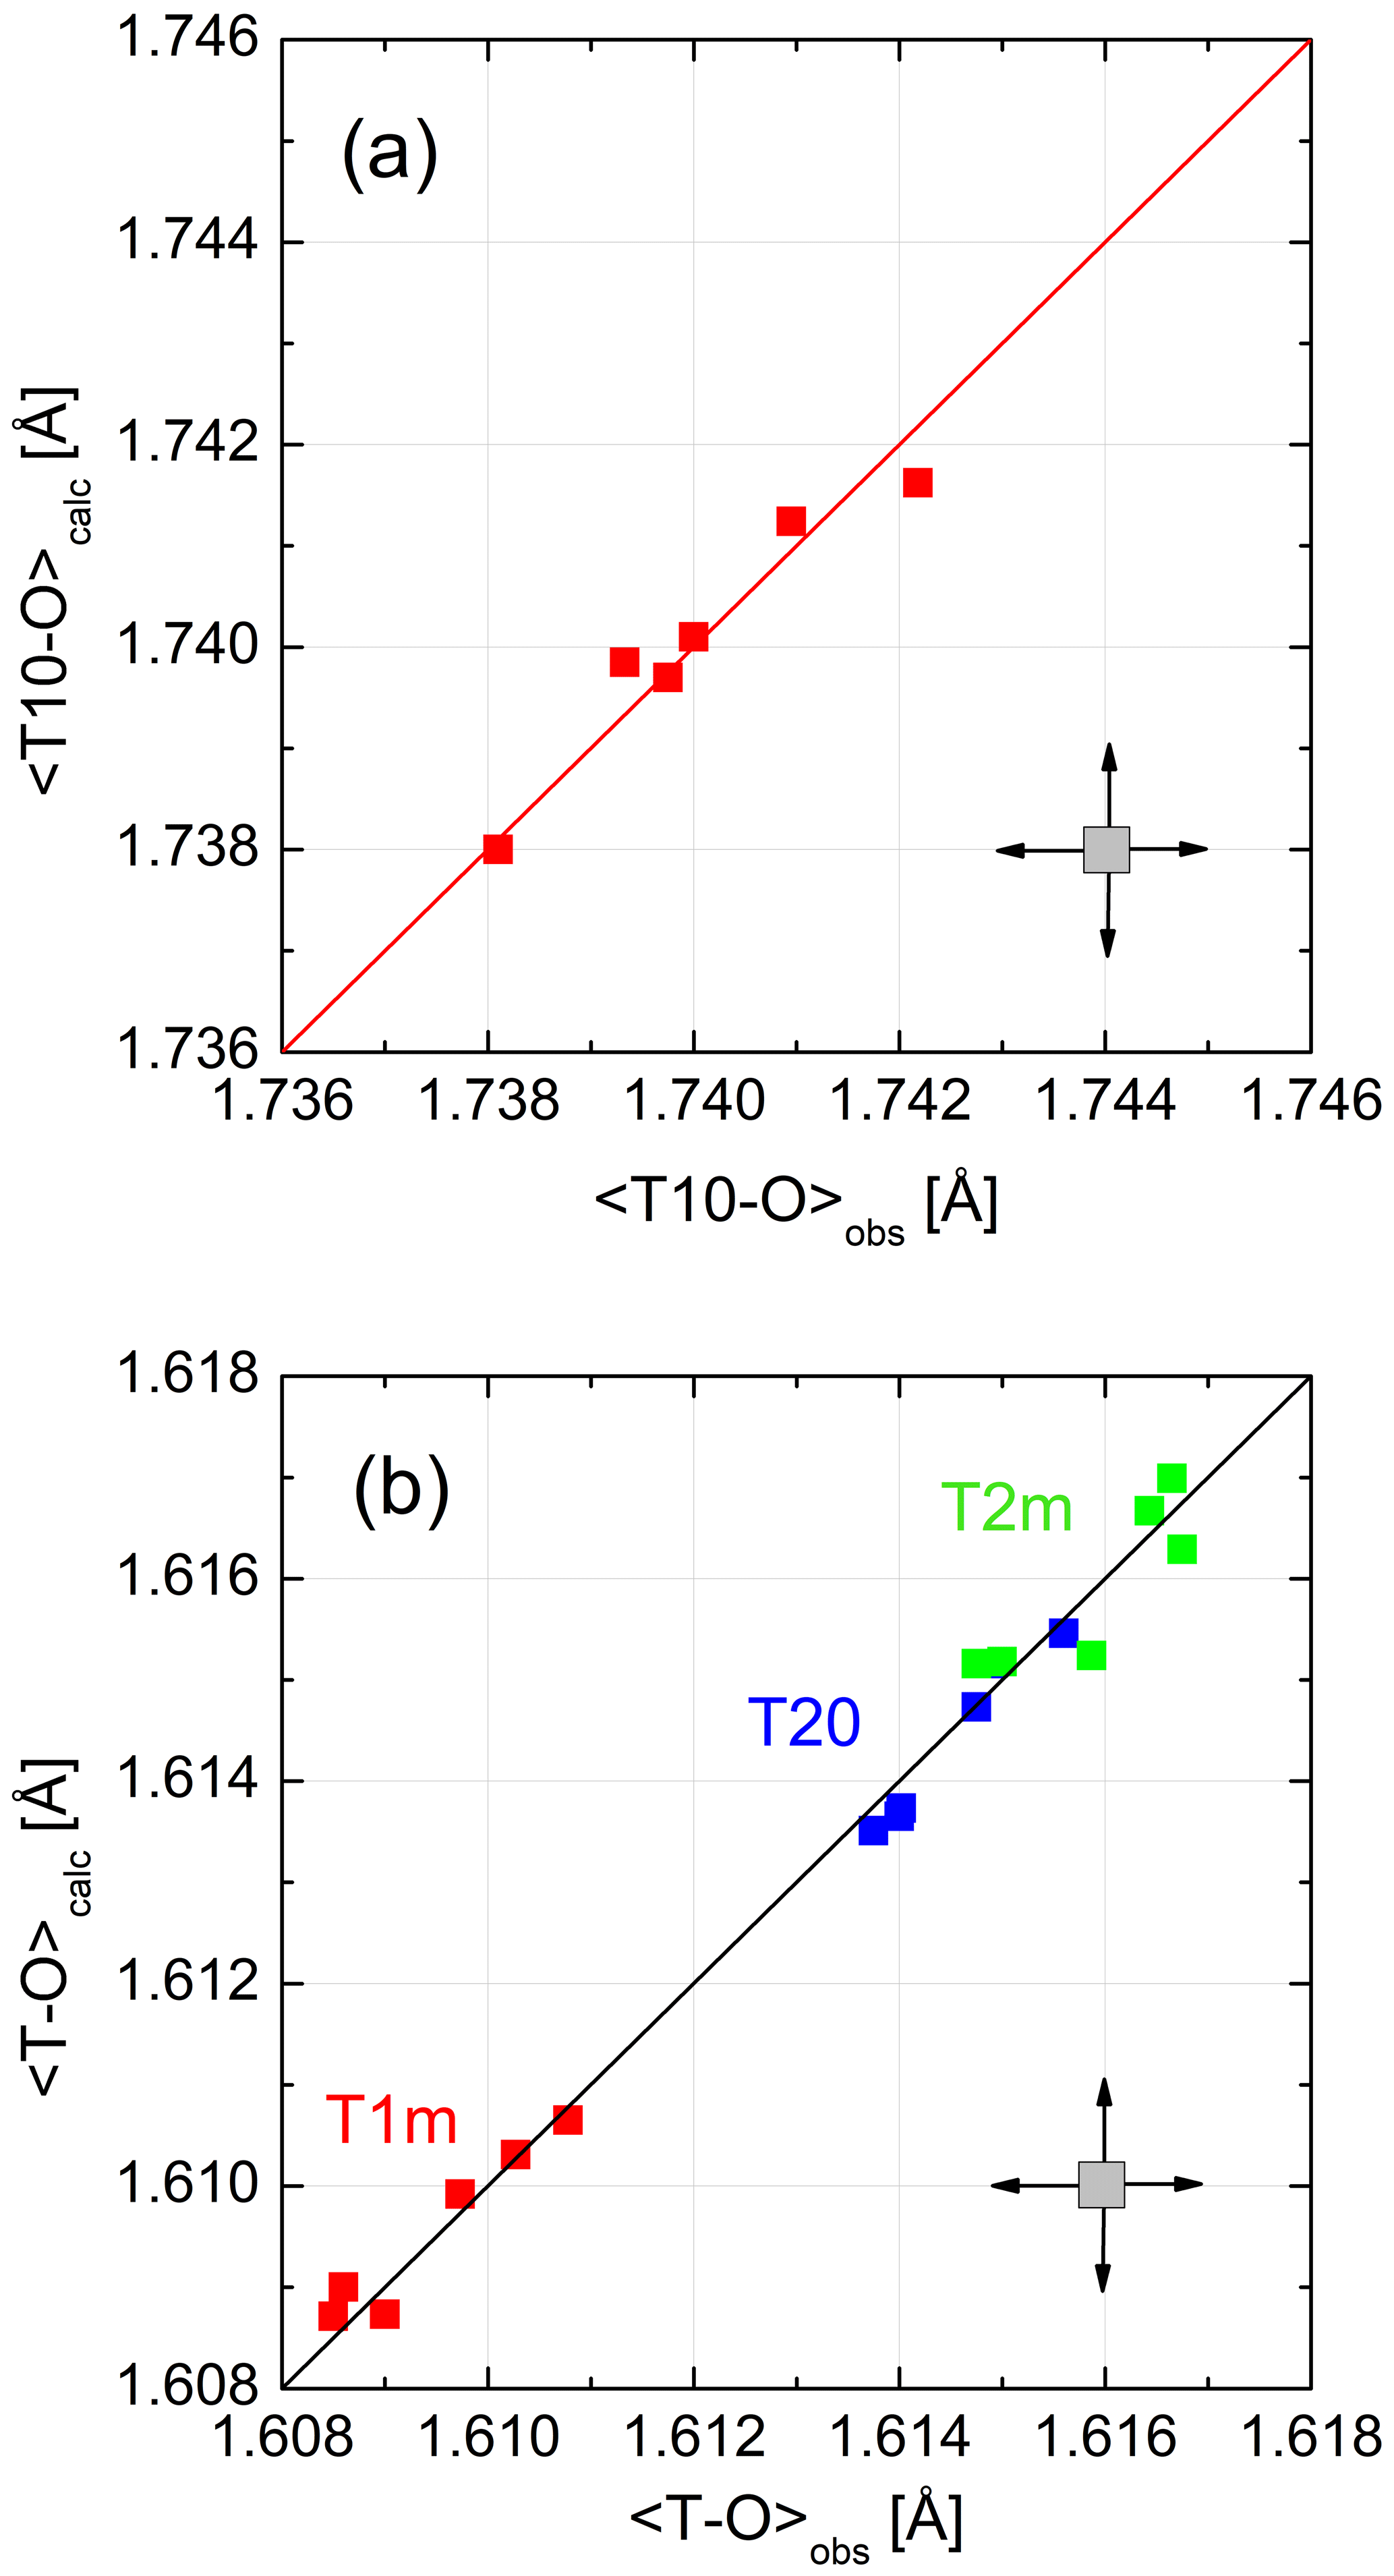
Figure 4(a, b) Mean tetrahedral distances, (Eq. 8), for six low-albite structures plotted versus the observed distances. The variations follow straight lines with a slope of 1. No systematic deviations that would point to a model deficiency are apparent. The error cross indicates the approximate uncertainty.
Equation (8) may be recast into the form of Eq. (1), with the observed bond lengths, 〈T–O〉obs, now substituted by the adjusted ones, 〈T–O〉adj:
Table 1 lists the observed and calculated bond lengths (Eq. 8). They deviate from each other by less than 0.001 Å. The adjusted lengths are listed as well. Among these, the respective three 〈Si–O〉 distances of each crystal are particularly interesting because they should have the same size after adjustment. The T1m tetrahedron, being involved in the largest 〈T–O–T〉 angle, is always observed to be the smallest of the three Si tetrahedra, while the T2m tetrahedron, being involved in the smallest 〈T–O–T〉 angle, is the largest. After adjustment, the three 〈Si–O〉 distances agree within 0.001 Å. The t column of Table 1 demonstrates the close agreement between calculated and expected LA site occupancies. Results obtained by Meneghinello et al. (1999), tMenegh, are listed for comparison.
A considerable number of structure refinements of Na-feldspars that were heat-treated to produce variable states of disorder are available from the literature. Meneghinello et al. (1999) performed refinements on albites heated at T=1050–1090 ∘C for various durations of time. The authors calculated Al site occupancies following the method of Alberti and Gottardi (1988). They could, however, not reproduce full order for LA but obtained t10<1. In addition, the expectation that t1m = t20 = t2m was not met (Table 1). More seriously, the authors found that the Al content of the T1m site in HA is larger than that of the T10 site, which appears implausible. Recently, Tribaudino et al. (2018) investigated peak positions and line widths of Raman spectra taken at several heated low-albite crystals and related the spectral changes to the state of order determined by X-ray structure refinement. The authors applied a macroscopic order parameter originally designed for An-rich plagioclases by Angel et al. (1990). Further refinements of HA come from Prewitt et al. (1976) and Winter et al. (1979). Analbite was prepared by Curetti et al. (2011), who heat-treated low albite at T>980 ∘C for 2 months and eventually arrived at the equilibrium state of monalbite (metastable analbite after quench). Only one of the available intermediate albites possesses an equilibrated Al,Si distribution. It originates from the suite of reversed experiments at P≈18 kbar by Goldsmith and Jenkins (1985). The crystal structure has been refined by Phillips et al. (1989). In Table 3, tetrahedral sizes and Al occupancies of all considered albites are listed. We found that, in any case, in particular in the HA region, it is t10> t1m, contrasting with Meneghinello et al. (1999). Further, in agreement with Meneghinello et al. (1999), it is always seen that t20≈t2m; the average of both is denoted below as t2. It is noticeable that in the IA region (t10≥ 0.45), t1m tends to be smaller than t2 rather than the opposite. The reason may be that Al in the first non-equilibrium stages of heating and disordering avoids to some extent the small T1m tetrahedron in favour of the larger T2 tetrahedra. By contrast, in the equilibrated IA of Phillips et al. (1989) t1m > t20 = t2m as expected.
To characterise the Al,Si distribution in their heated albites, Tribaudino et al. (2018) choose an order parameter that may be rewritten in terms of Eq. (1):
where K denotes the size difference 〈Al–O〉−〈Si–O〉. The authors adapted K=0.135 Å from Angel et al. (1990), who stated, however, that severe deviations in their calibration of K occurred for four low albites. In fact, K appears large compared to the size difference of 0.127(3) Å found from the 〈T–O〉obs values in Table 1. As a consequence of the large K, the difference t10−〈t1m〉 (termed Qod by Tribaudino et al., 2018) tends to be small, especially for more ordered albites. In their unheated albite crystal, for example, for K=0.135 Å but 0.99 for K=0.127 Å. As to be expected from Eq. (10), this difference continuously decreases with increasing disorder.
When site occupancies of Na-rich feldspars are to be derived from uncorrected 〈T–O〉 distances, we suggest that K=0.127(3) Å be preferred in Eqs. (1) and (10).
The individual site occupancies listed in Table 3 are plotted versus the difference Δt1= (t10−t1m) in Fig. 5. The relations are linear; that is, it suffices to know Δt1 to derive individual t values. Regression lines originating from t10 =1 and t1m = t20 = t2m = 0, respectively, have been drawn through the data points, emphasising the refinement results in the HA region for reasons noted above. The resulting equations are simple:
with b0=0.7288(16). Accordingly, the t10 and t1m lines intersect at t10 = t1m =0.271(2), where t20 = t2m =0.229(2); that is, high-albite transforms to monalbite before it becomes fully disordered as is sometimes misstated in the literature (standard deviations are given in parentheses and refer to the last decimal place(s)).
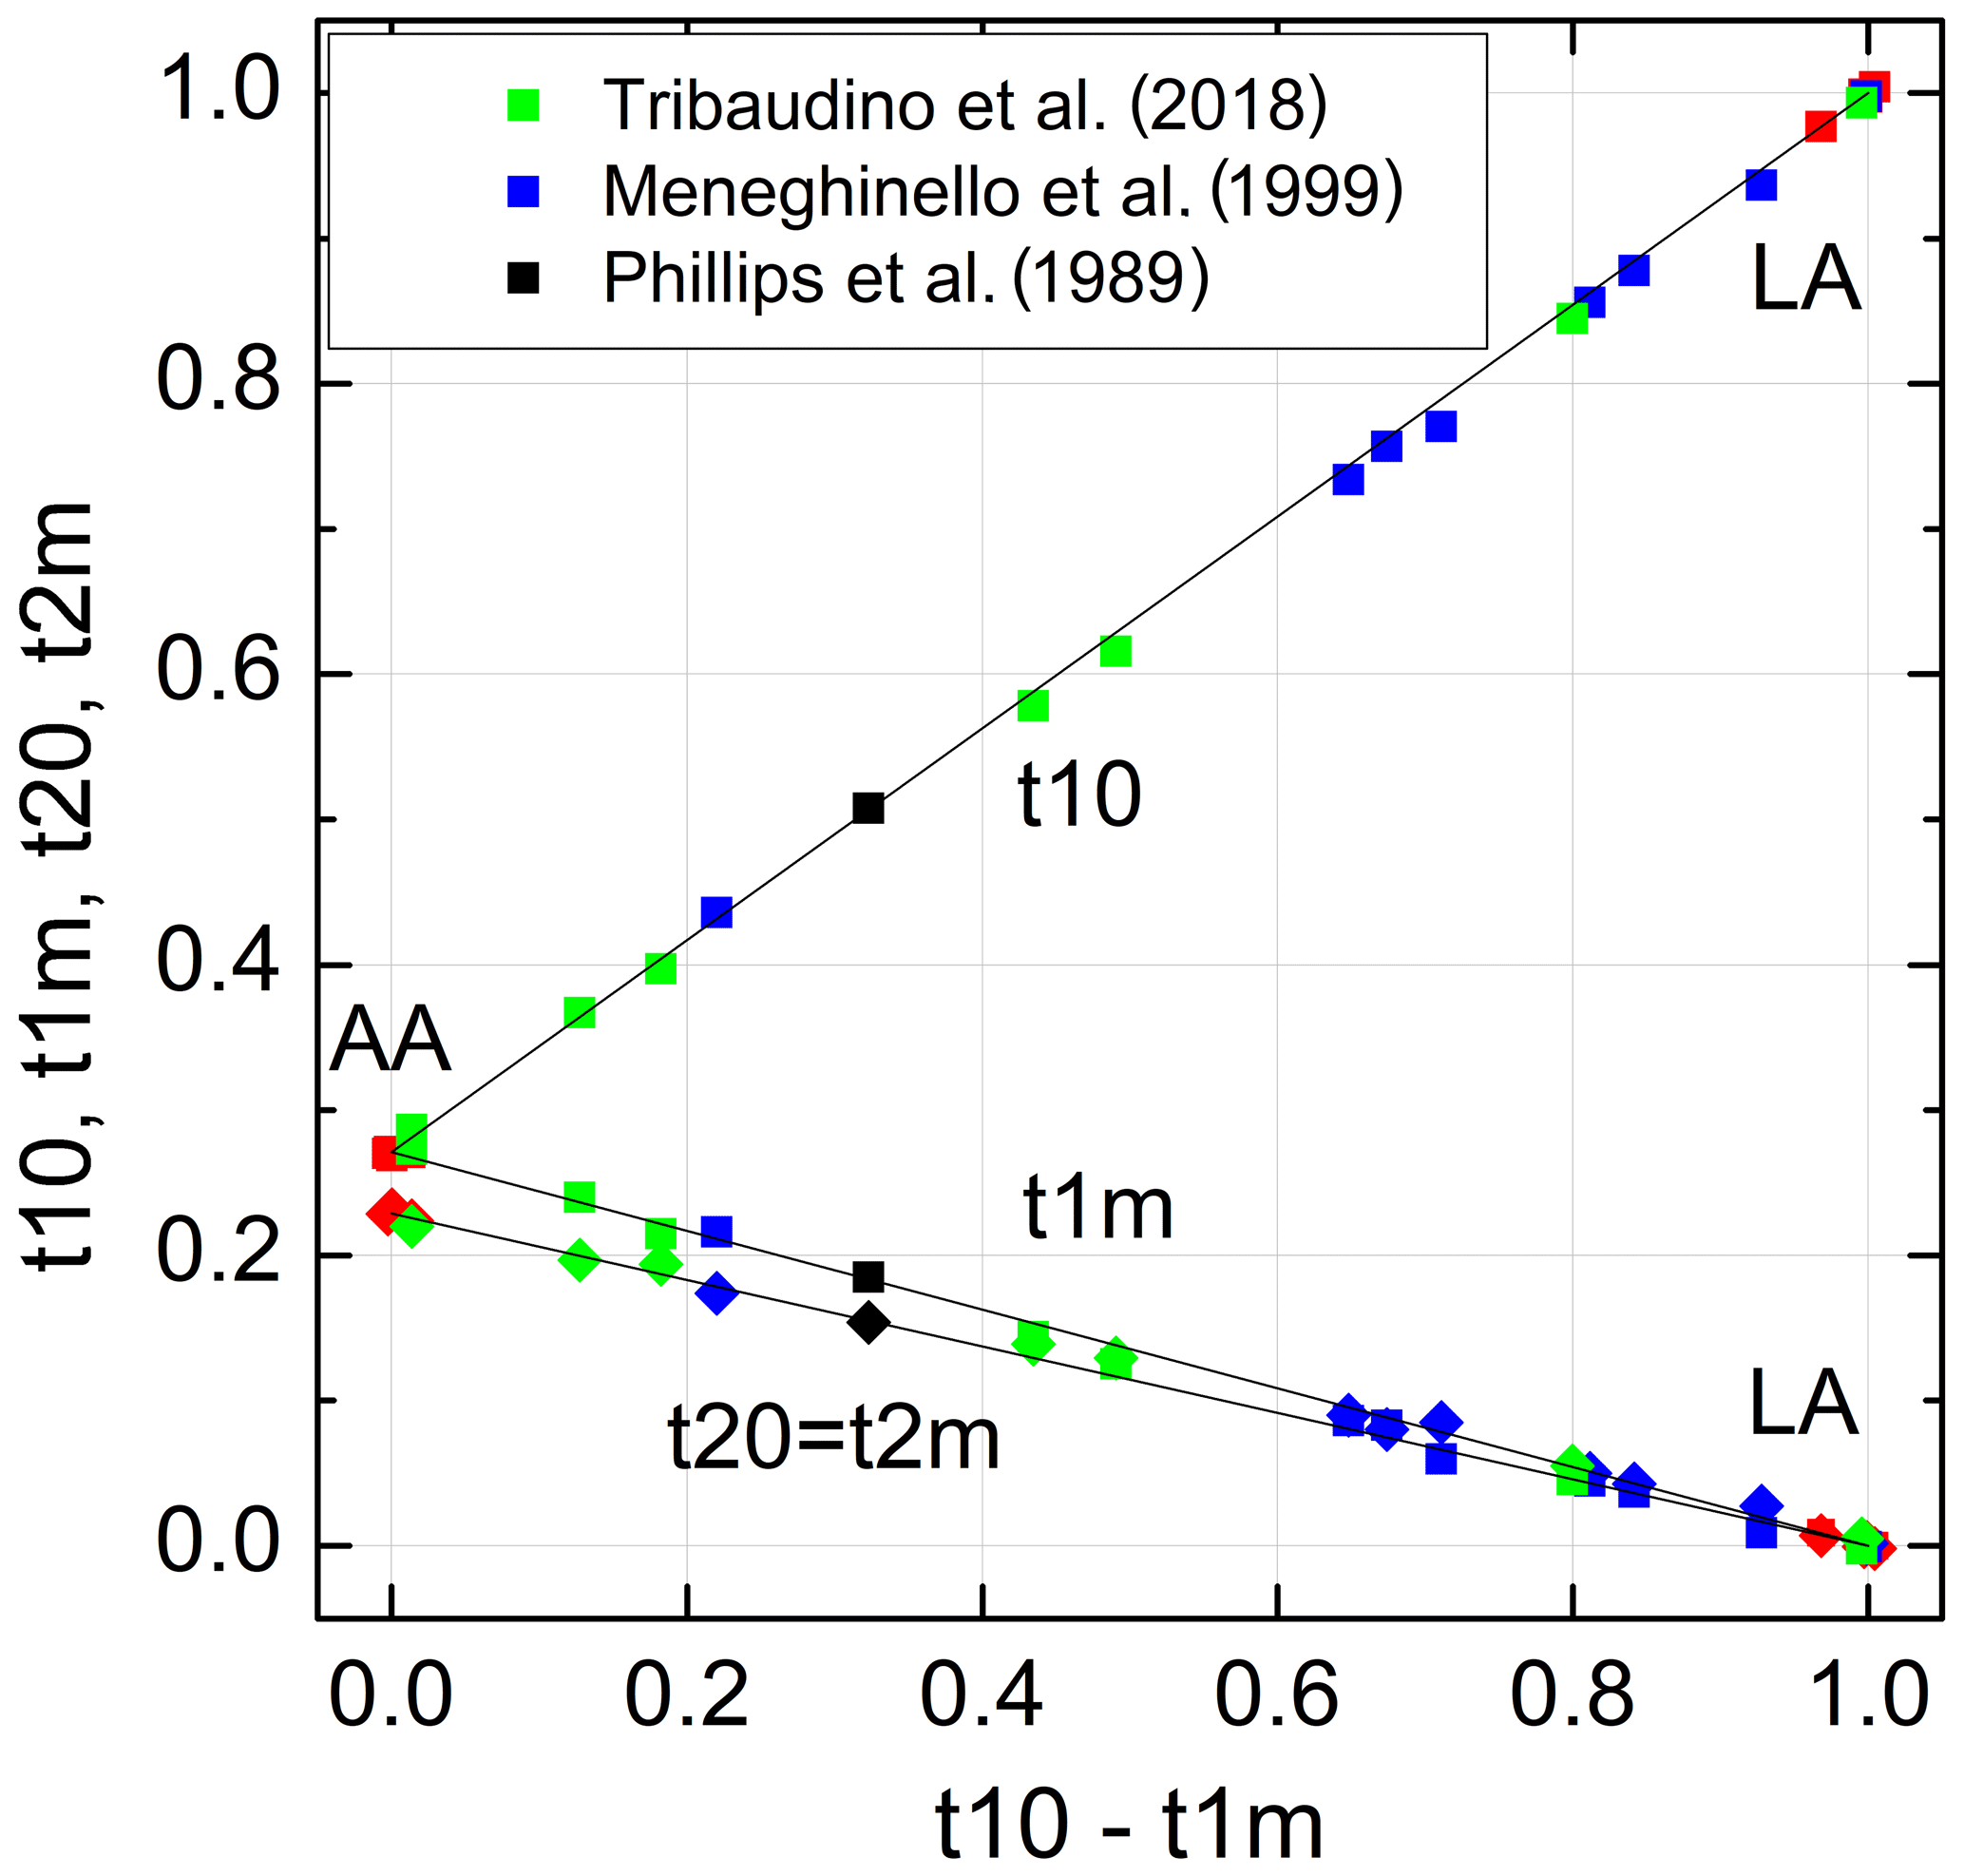
Figure 5Al site occupancies t10, t1m, t20 = t2m (Eq. 9) vary linearly with the difference (t10 − t1m). The data are compiled in Tables 1 and 3 (red: Wainwright and Starkey, 1968; Wenk and Kroll, 1984; Armbruster et al., 1990; Downs et al., 1994; Winter et al., 1970; Prewitt et al., 1976; Curetti et al., 2011; black: Phillips et al., 1989; green: Meneghinello et al., 1999; blue: Tribaudino et al., 2018). The sizes of the data points comply with the estimated errors.
Table 3Mean tetrahedral distances, 〈T–O〉 [Å], and Al site occupancies, t, of 16 intermediate to high albites and 1 analbite. 〈T–O〉adj and t were obtained from Eq. (9). Values of tΔtr[110] were derived from the length difference Δtr[110] (Eq. 13). t values have been normalised to Σt=1. Site occupancies tMenegh from Meneghinello et al. (1999) are listed for comparison.

Kroll and Ribbe (1983, 1987) related the length difference to the site occupancy difference (t10 − t1m) (Fig. 1). At the time, structural data of intermediate albites were lacking so that the authors based their calibration on chosen reference values for AA and LA. Introducing the IA and HA refinements of Meneghinello et al. (1999) and Tribaudino et al. (2018) confirms the linear dependence of Δtr[110] on (t10 − t1m) (Fig. 6):
with a Å, a1=0.3092(31) Å and esd =0.006 Å. It is advisable to calibrate the length difference rather than the two individual repeat distances because this largely eliminates the effect of measurement errors in the a and b cell dimensions. Combining Eqs. (11) and (12) allows individual site occupancies to be obtained from the length difference Δtr[110]:
with b0=0.7288(16), b1=0.1103(59), b2=3.234(32) Å−1 and esd(t)=0.01.
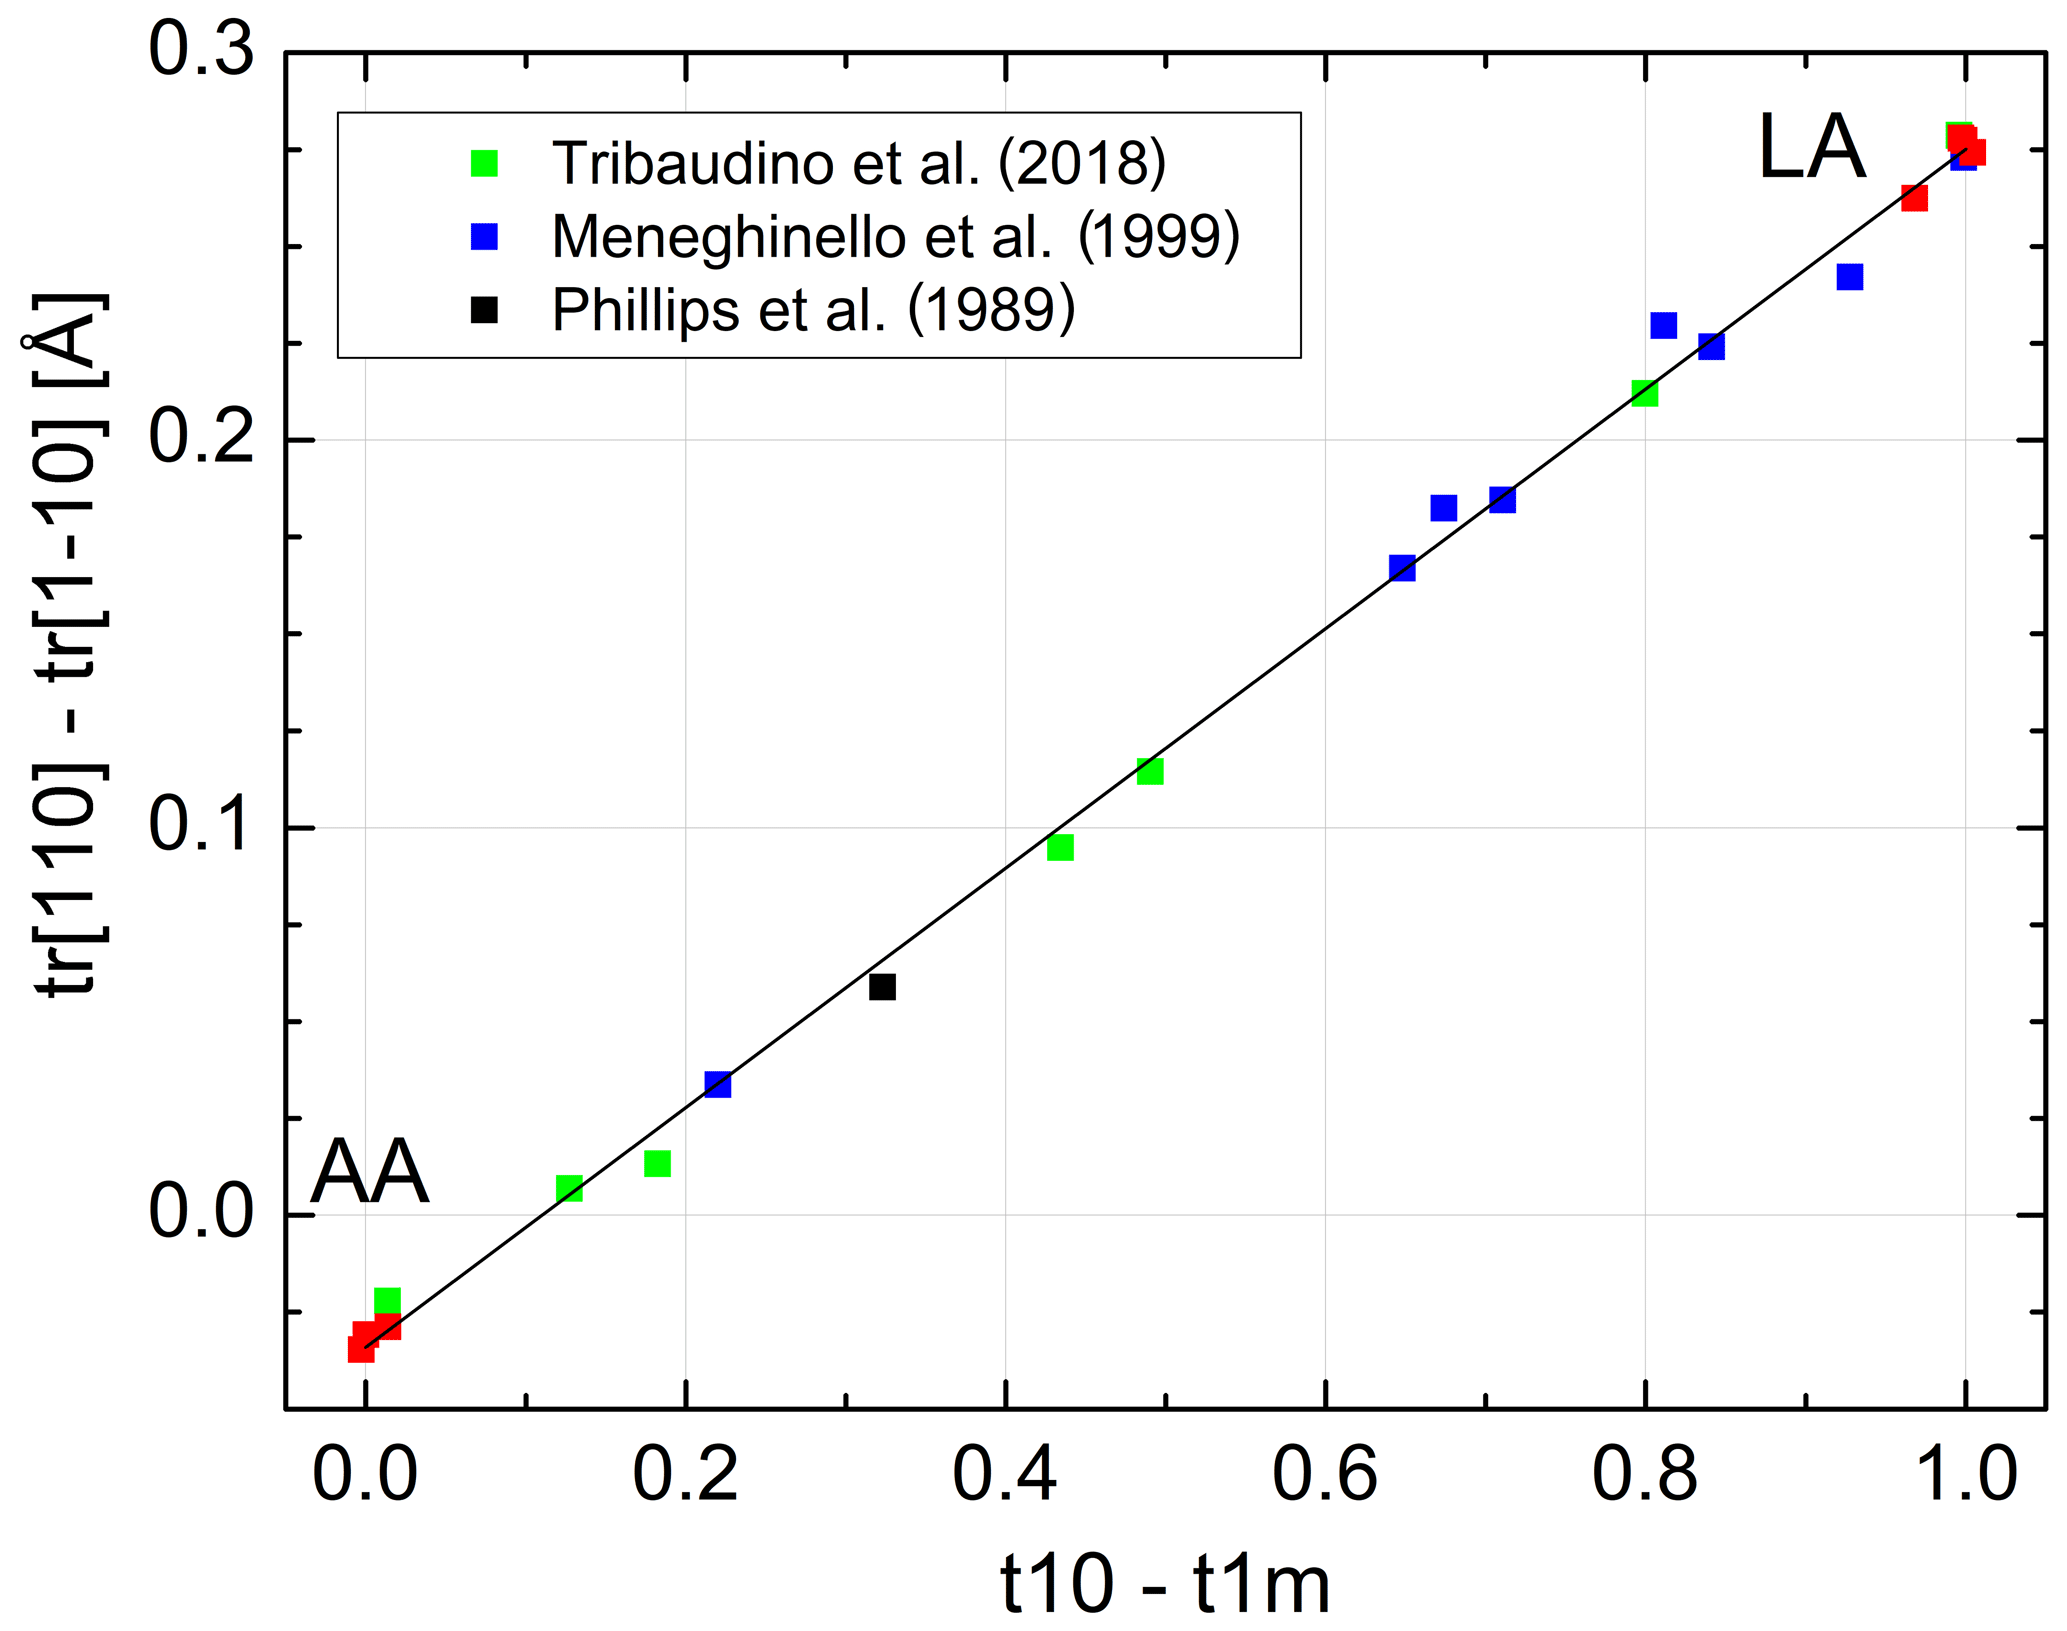
Figure 6Linear variation in as a function of (t10 − t1m) (symbols as in Fig. 5). The sizes of the data points comply with the estimated errors.
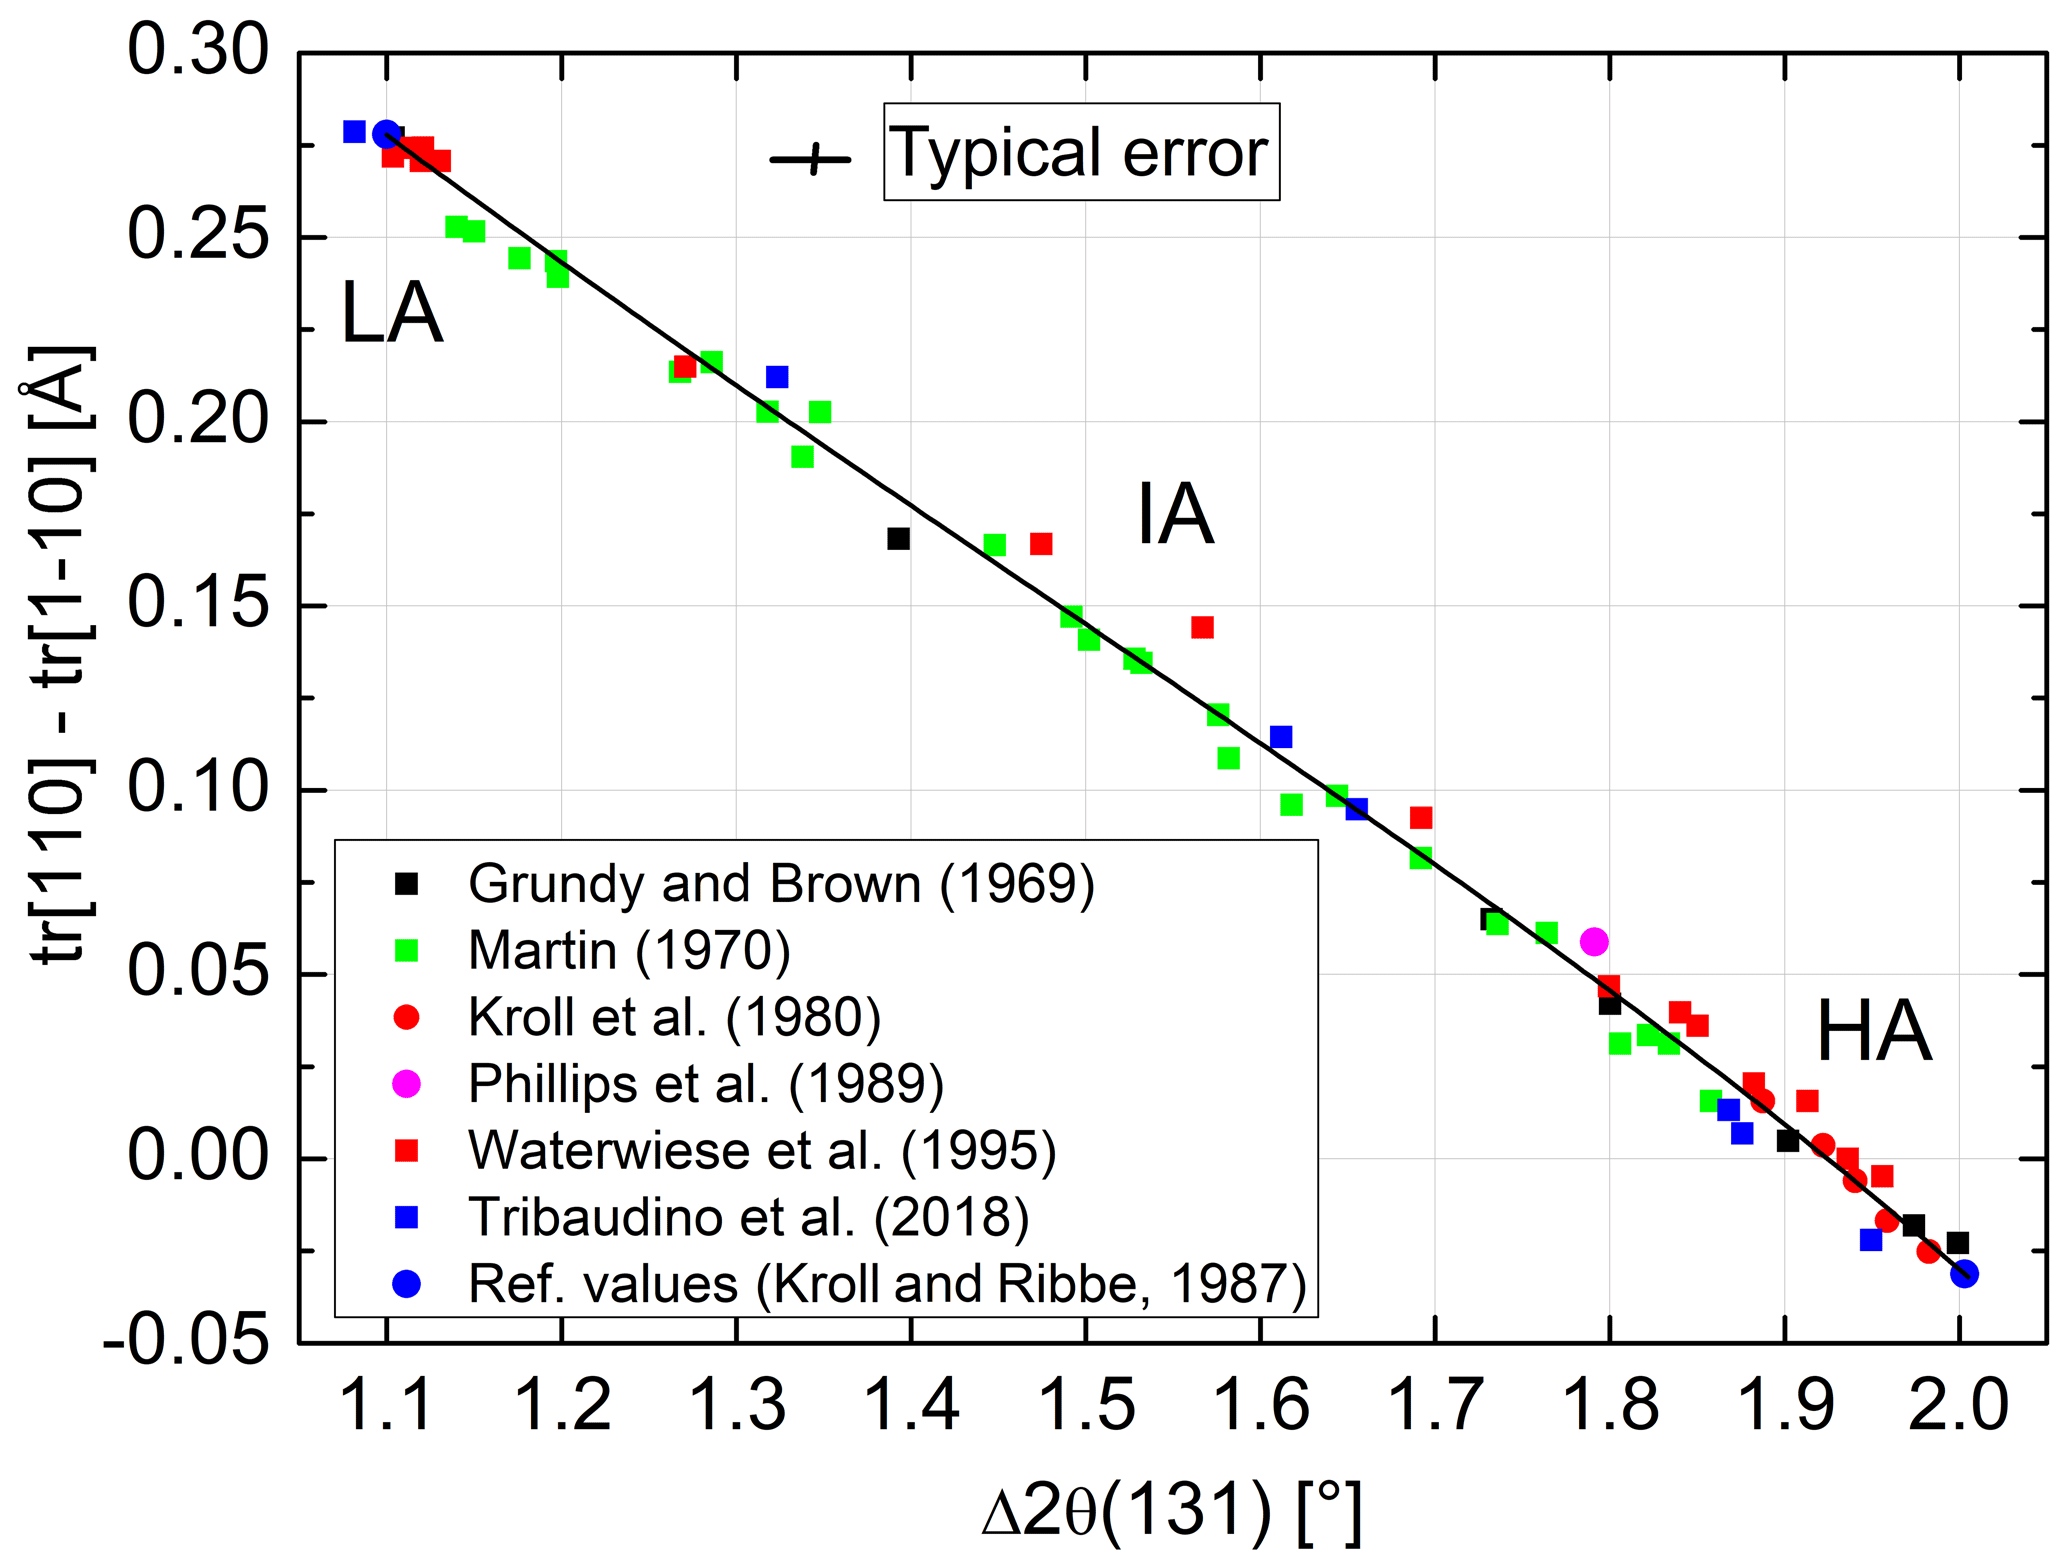
In order to transfer the values of of Goldsmith and Jenkins (1985) into individual site occupancies via Eq. (13), we need to calibrate Δ2θ(131) in terms of Δtr[110]. The largest number of suitable data covering nearly the full range between AA and LA can be found with Martin (1970). We added data by Grundy and Brown (1969), Kroll et al. (1980), Phillips et al. (1989), Waterwiese et al. (1995), and Tribaudino et al. (2018) and attached the reference values of AA and LA of Kroll and Ribbe (1983). The resulting diagram is shown in Fig. 7. The variation in data is nearly linear and can be fitted by the expression
When confining pressure is applied to albite that is initially in a disordered state (IA or HA), its Al,Si distribution will change towards order. This was attributed by Orville (1967) and Goldsmith and Jenkins (1985) to the entropy and volume changes of LA to HA in terms of the Clausius–Clapeyron equation
The authors emphasise that “the calculations were made although the transition takes place over a temperature range whereas the Clausius–Clapeyron equation is normally applied to univariant reactions with coexisting phases”. Goldsmith and Jenkins (1985) suggested K kbar−1 from data of Holland (1980). This means, for example, when an internally equilibrated IA is subjected to a pressure of 10 kbar, then in order to counteract the ordering tendency it would be necessary to increase the temperature by some 30 K to preserve the original state of order. Downs et al. (1994) investigated the structural changes in LA with pressure and suggested a mechanism for the pressure-dependent ordering. They found that the mean T–OC–T angle in alkali feldspars tends to stiffen with increasing Al,Si disorder so that, conversely, a disordered albite would yield to pressure by ordering.
In order to estimate the pressure effect, we follow an approach different from the Clausius–Clapeyron equation. It relies on the direct comparison of equilibrated structural states attained at low pressures (LPs) and high pressures (HPs). For this comparison, however, only LP samples equilibrated at T≥750 ∘C are suitable because for kinetic reasons it is unlikely that equilibrium is achieved below that temperature (Goldsmith and Jenkins, 1985). Figure 8 combines HP data of Goldsmith and Jenkins (1985) and Waterwiese et al. (1995) and LP data of Grundy and Brown (1969) and Kroll et al. (1980). A third-order polynomial has been drawn through the LP data, and the differences between the temperatures of the HP experiments and the temperatures found on the LP curve for the same Δ2θ(131) values have been related to the corresponding pressure differences, resulting in K kbar−1. The scatter of the HP data is to some degree due to the different pressures of the experiments (15–21 kbar). A curve has been drawn for P= 18 kbar, at which most of the Goldsmith and Jenkins experiments have been performed. The value of 4.2(2) K kbar−1 is not necessarily applicable, however, down to the temperatures where ordered low albite is stable.
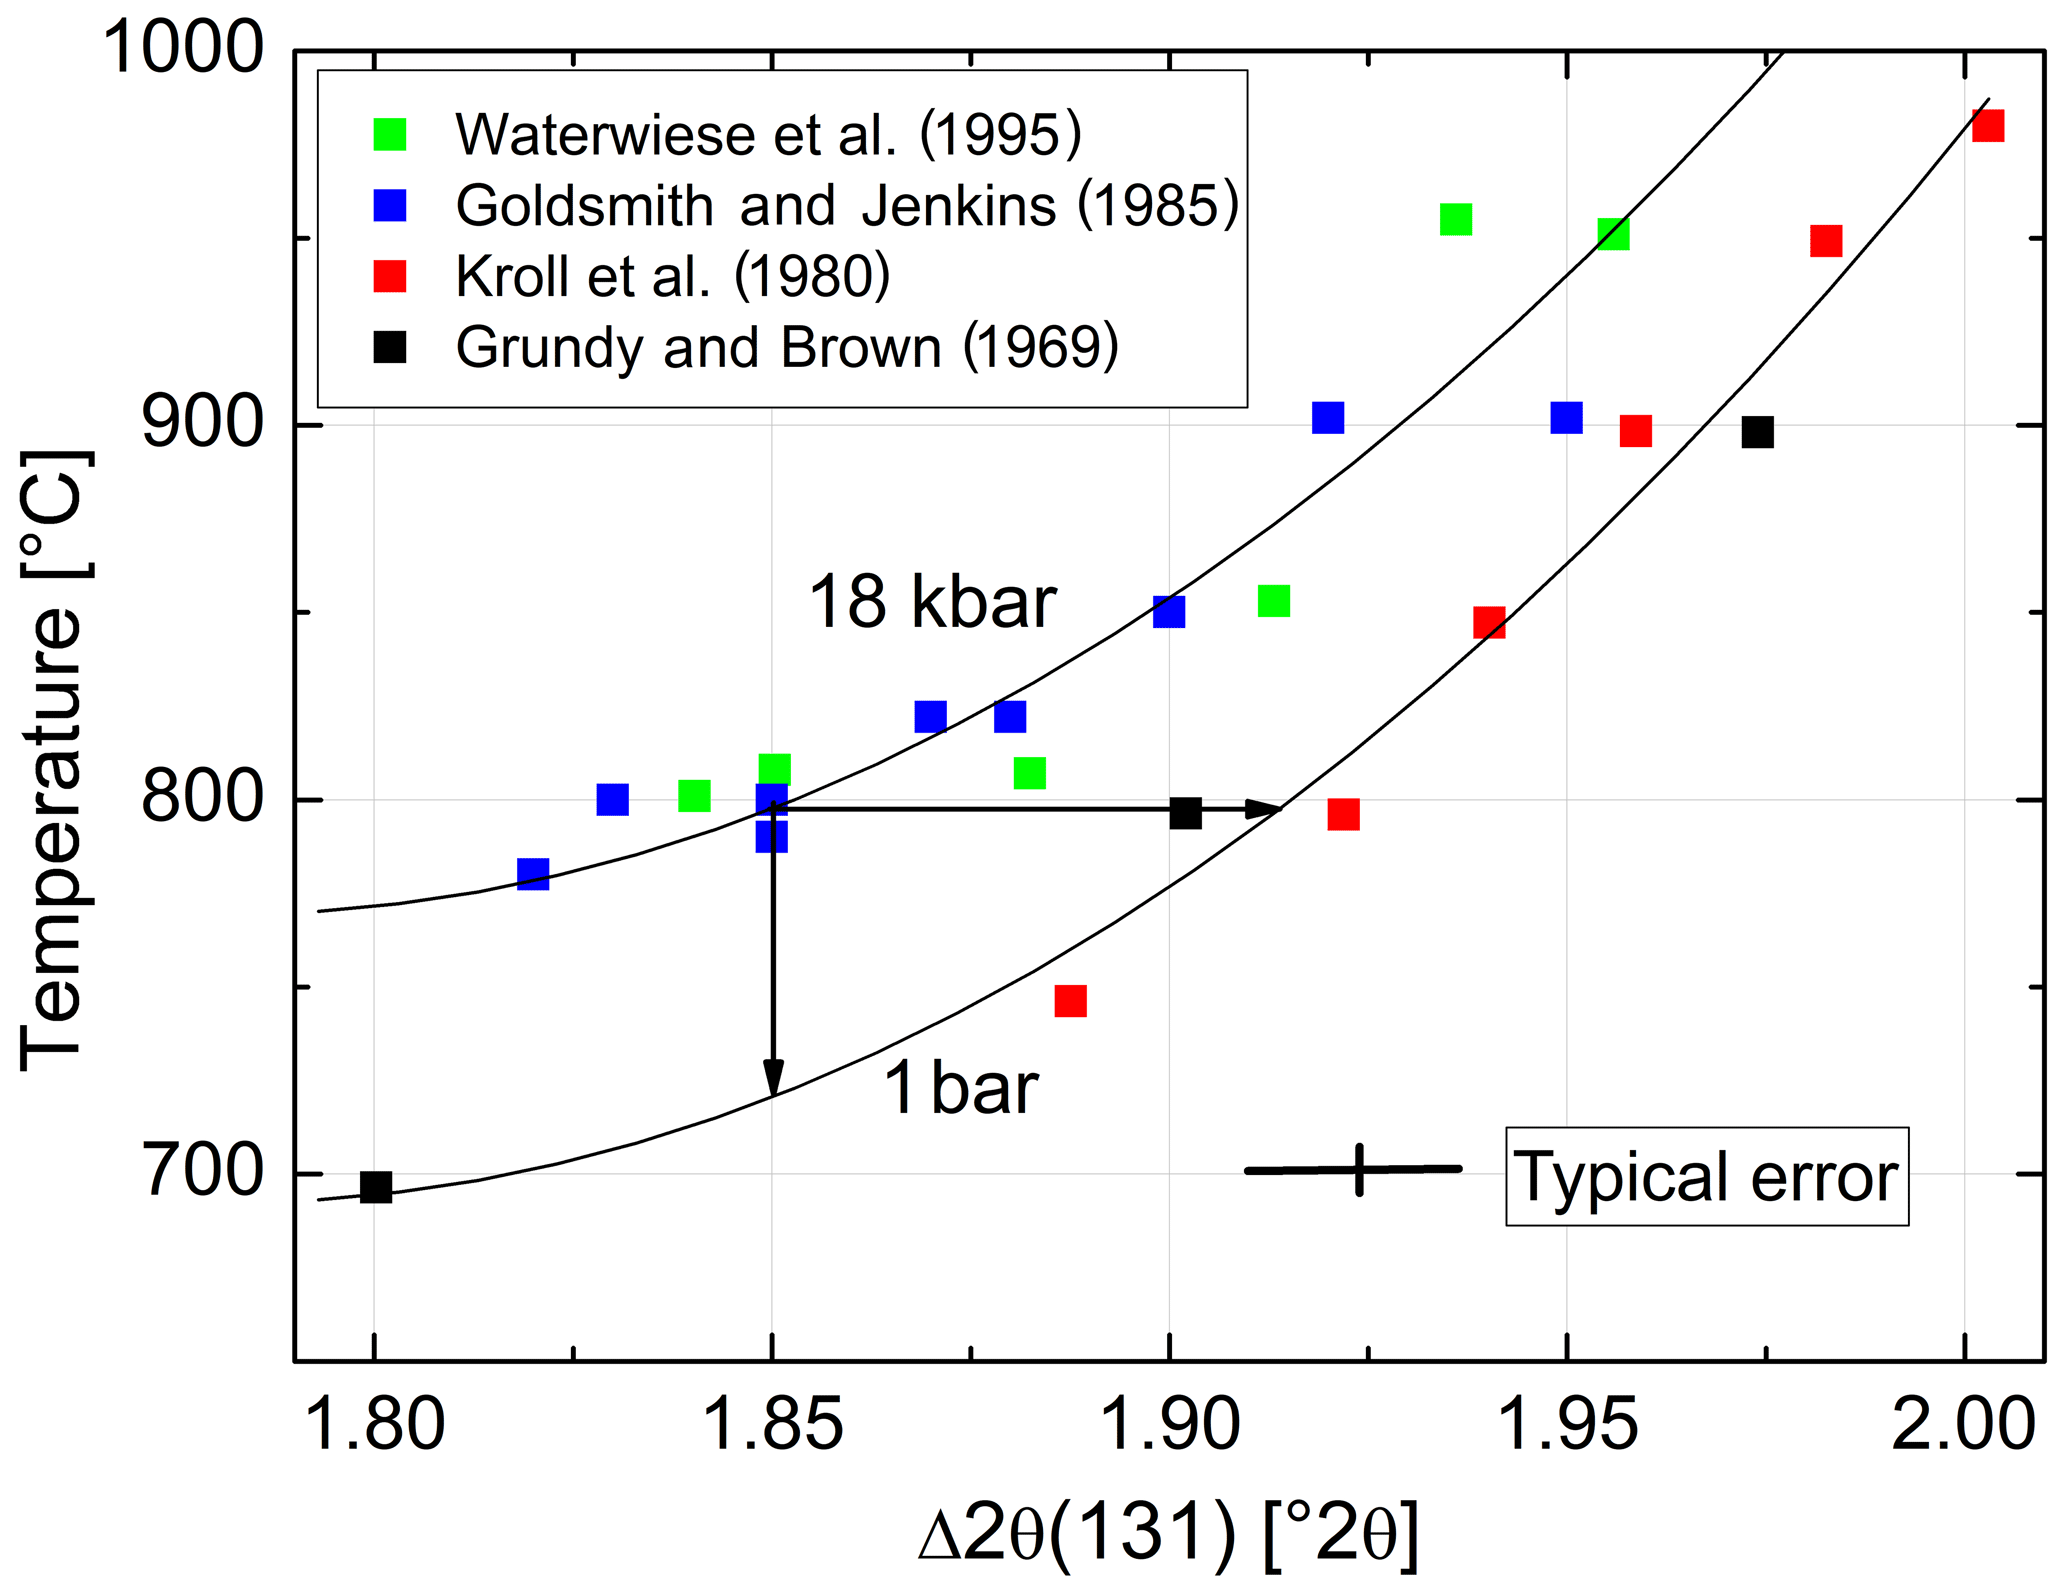
Figure 8Variation with temperature of Δ2θ(131) [∘] at 1 bar (lower curve) and 18 kbar (upper curve). Two arrows are added to provide an example: albite that is equilibrated at 800 ∘C, 18 kbar, has . Upon release of pressure at a constant 800 ∘C, Δ2θ(131) increases towards 1.92∘, indicating increased disorder. If the degree of order corresponding to 1.85∘ is to be kept constant, the temperature must be decreased by 76 ∘C.
Waterwiese et al. (1995) have taken care of this problem by applying a thermodynamic approach. Using Landau theory, Salje et al. (1985) have treated the thermodynamic behaviour of Na-feldspar in terms of two coupled order parameters, Q and Qod, related to the displacive lattice distortion and to the state of Al,Si order, respectively. Both order parameters are unity for LA at 0 K, but at equilibrium conditions they decrease with increasing temperature, eventually reaching zero at the HA–MA transition. Salje et al. (1985) calculated thermodynamic state properties ΔY=Y(albite) − Y(MA) as a function of temperature (Y denotes internal energy U or entropy S) for equilibrated albites. Taking the differences (T0=298.15 K), Waterwiese et al. (1995) obtained state properties owing to the transition from LA towards MA. In addition, they devised a method to describe Vtr(T) so that the Gibbs energy Gtr(P,T) is fully determined. As stated above, when albite, being in internal equilibrium at pressure P1 and temperature T1, is subjected to pressure P2>P1, then in order to avoid ordering, the temperature has to be raised, T2>T1, so that . Since Utr(T), Str(T) and Vtr(T) are known, it is possible to find from
the temperature T1 at which the albite at P1 has the same state of order as it has at (P2,T2). T2 must be larger than T1 because Vtr is positive. We have used Eq. (16) to adjust the experimental temperatures of Goldsmith and Jenkins (1985) and Waterwiese et al. (1995) to P=1 bar. In the range of 600 ∘C ∘C, the calibration according to Fig. 8 practically coincides with the adjustment after the Waterwiese method, the largest deviation being just 4 ∘C. Below 600 ∘C, the deviation becomes larger because ΔT∕ΔP is not a constant but steadily decreases to reach zero at 25 ∘C.
We are now prepared to convert the Δ2θ(131) indicator of order reported by Goldsmith and Jenkins (1985) into individual site occupancies valid at ambient or any other pressure using Eqs. (13), (14) and (16). We have added the HP runs of Waterwiese et al. (1995) in which (nearly) internal equilibrium has been achieved as well as the LP runs of Grundy and Brown (1969) and Kroll et al. (1980) at T≥750 ∘C. Figure 9 displays the variation with temperature of the thermodynamic order parameter (Salje 1985). The data points refer to the pressure P=1 bar. In addition, the Goldsmith and Jenkins data in the IA region are also plotted for P=18 kbar, omitting the data in the LA and HA regions to avoid confusion. The three regions can be characterised by linear changes connected by smooth transitions. Goldsmith and Jenkins (1985) note that, at a pressure of 18 kbar, LA begins to disorder at ≈660 ∘C, while IA turns into HA at ≈790 ∘C. At 1 bar these temperatures would be lower by about 70 ∘C, i.e. 590 and 720 ∘C, after application of the Waterwiese adjustment method. The disordering from LA to HA thus proceeds in a continuous manner and extends over only 80 ∘C, from 620 to 700 ∘C, when we consider only the temperature range in which most of the disordering occurs. Note that the analogous microcline to sanidine transition in K-feldspar, where the influence of the displacive order parameter Q is missing, is discontinuous (Carpenter and Salje, 1994).
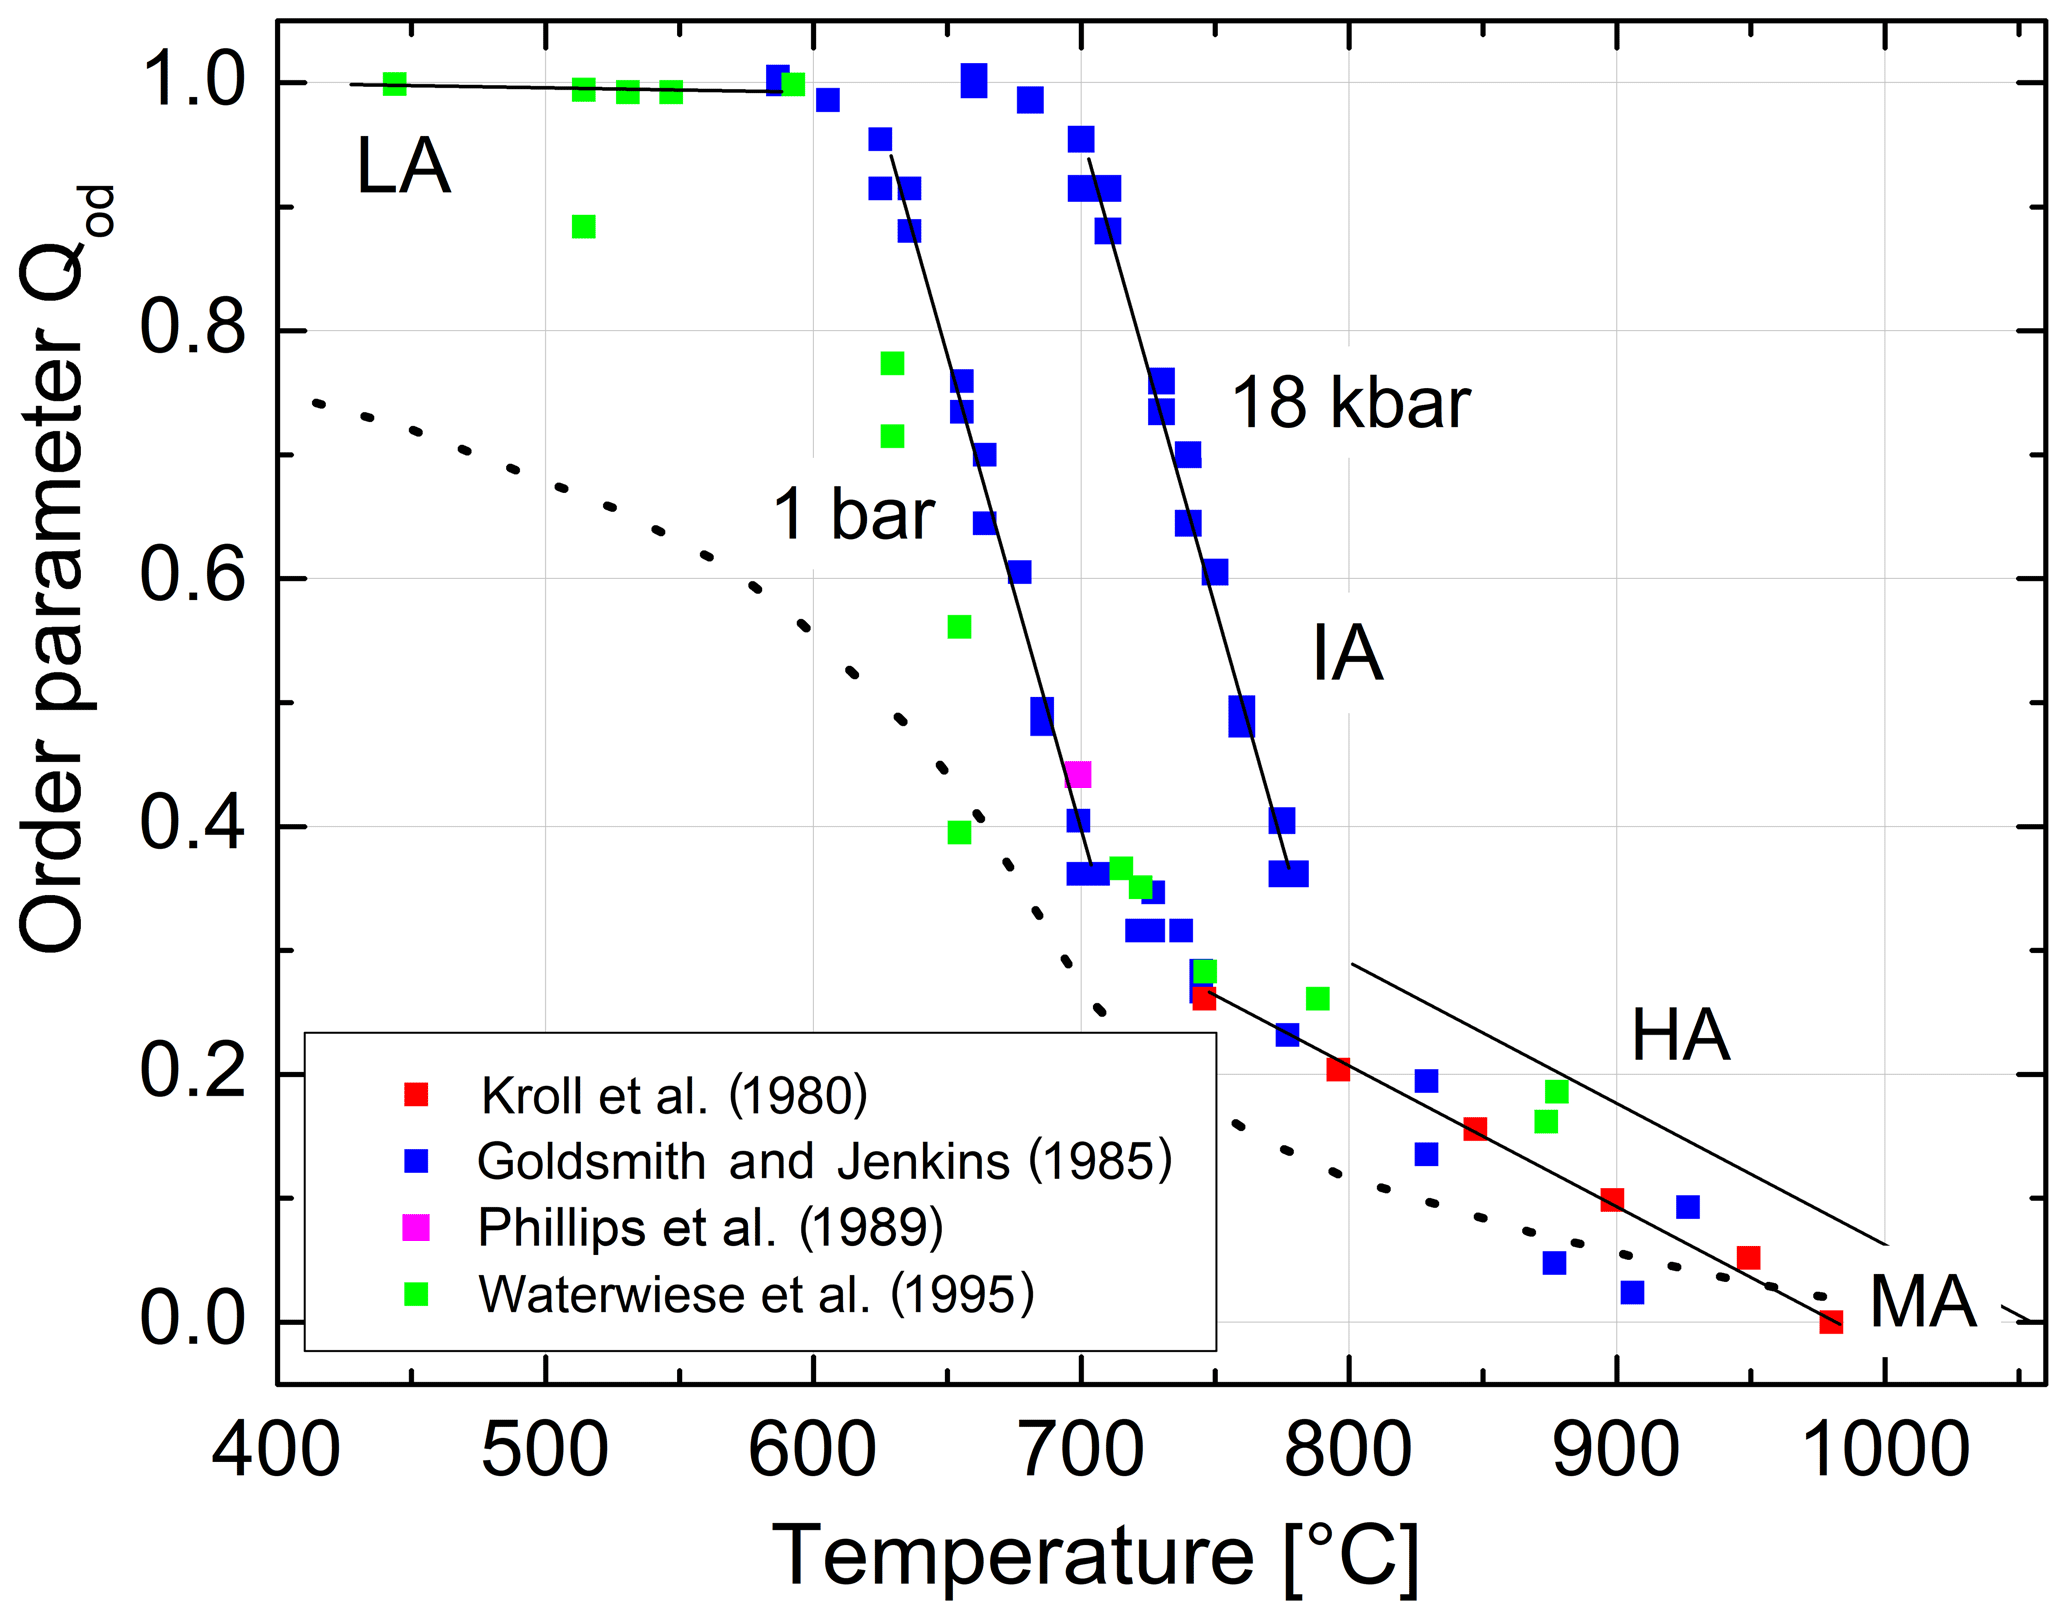
Figure 9Variation in the thermodynamic order parameter in Na-feldspar in equilibrium with temperature and pressure. Straight lines are drawn to guide the eye; the left ones refer to ambient pressure, and the right ones refer to 18 kbar. The dotted curve is taken from Salje et al. (1995).
The HA regime extends over a temperature range that is more than twice as large as the IA regime. Whereas in the IA region Al,Si order and disorder are the dominant structural processes, displacive structural shearing dominates in the HA region; that is, in the IA regime, the Qod order parameter dominates over the Q parameter, while the opposite is true for the HA regime. The changes in Q and Qod are reflected in the variation in the lattice angles α and γ. During disordering in the IA regime, Al leaves the T10 sites in the [110] diagonal in favour of the T1m sites in the [10] diagonal (Fig. 1), thereby widening the lattice angle γ towards 90∘. On the other hand, during heating in the HA regime, it is mainly the lattice angle α that changes towards 90∘ in response to the decrease in structural shearing.
From Fig. 9 we can judge the effect that increasing pressure has on the state of order. The effect is relatively small for HA but is drastic in the IA region. For example, intermediate albite in internal equilibrium at 700 ∘C, 1 bar, would become nearly fully ordered LA when subjected to P=18 kbar.
The variation in the individual Al site occupancies with temperature is displayed in Fig. 10. The phase transition HA→MA occurs at 980 ∘C, where t10 = t1m and Qod=0. Above that temperature MA is the stable phase. Note that the only one data point that derives from a structure refinement rather than reflection positions (Phillips et al., 1989) agrees well with the trend set by the recalculated Δ2θ(131) data of Goldsmith and Jenkins (1985). In the IA region, the site occupancies obtained from the lattice parameters of Waterwiese et al. (1995) plot 20 to 25 ∘C below the Goldsmith and Jenkins data. Waterwiese et al. (1995) assume an error of ±7 ∘C for their experiments, whereas Goldsmith and Jenkins consider their temperatures to be more accurate than ±2 ∘C. Thus, the deviation somewhat exceeds the mutual 2σ limit.
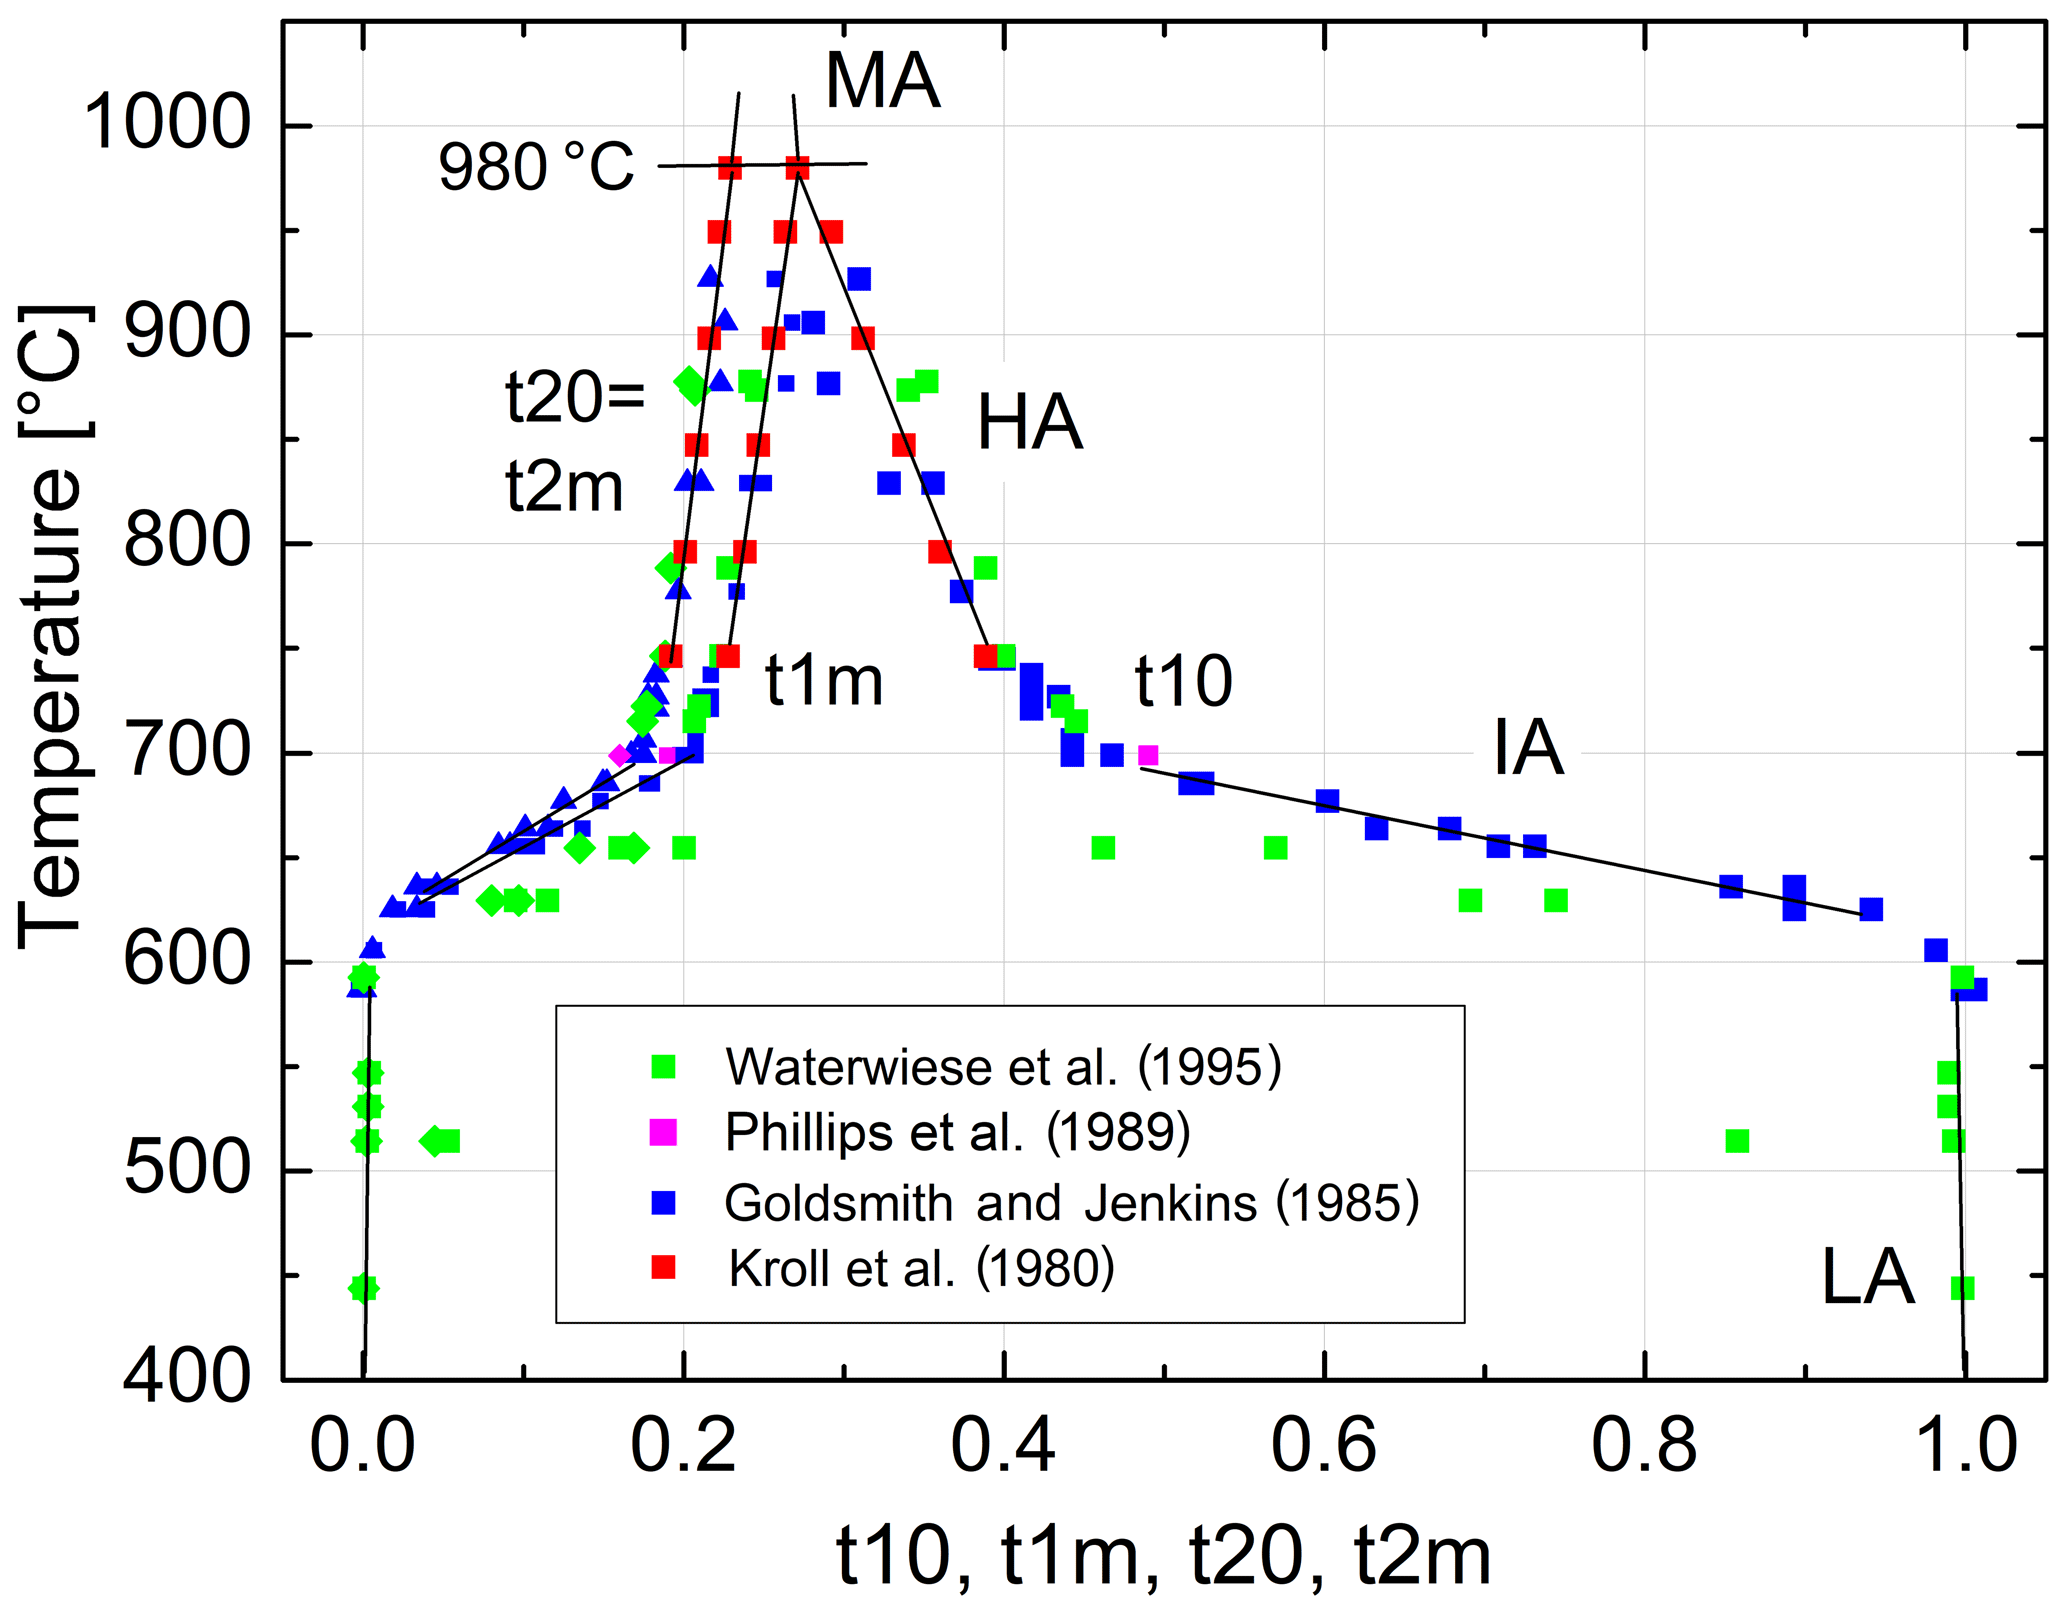
Figure 10Variation in the individual Al site occupancies in Na-feldspar in equilibrium with temperature at ambient pressure. Straight lines are drawn to guide the eye. t10 = Al∕(Al+Si) in the T10 tetrahedral site and similarly for t1m and t20= t2m.
8.1 Convergent and non-convergent disordering
It is frequently stated in the literature and in textbooks as well that monalbite (or analbite) is fully disordered. This does not apply, however, as is seen in Fig. 10. The statement neglects the character of the disordering process of albite. It is a convergent process in the sense that the T10 and T1m pair of tetrahedral sites as well as the T20 and T2m pair each converge to symmetrical equivalence when the site occupancies converge at the transition temperature T(HA→MA), where t10 = t1m = t1 and t20 = t2m = t2. Thermodynamically, there is no energetic reason that t1 should equal t2 at T(HA→MA). Above that temperature, monalbite is the stable state up to the melting point (1118 ∘C). In that region, the disordering process is non-convergent as it is in sanidine. Even if t1= t2 could be reached before melting, no phase transition needs to be related. Rather, at this point, a crossover could occur from a regime where t1> t2 to a regime with t1< t2. The thermodynamic condition for a crossover is discussed by Kroll et al. (2006) for the case of olivine MgFe[SiO4]. A more general treatment is given by Christy (1995).
8.2 The pressure correction
The transition from LA to HA at 1 bar occurs over practically the same temperature range as it does at ≈18 kbar, the two pairs of straight lines being nearly parallel (Fig. 9). Brown and Parsons (1989) compared the results of available non-reversed hydrothermal experiments and suggested a curve that has a gentler slope than indicated by the Goldsmith and Jenkins data. It has already been mentioned that the value for K kbar−1 derived for the range T>750 ∘C may not be valid towards temperatures at which LA is fully ordered. For the Waterwiese method, ΔT∕ΔP reaches zero at T=25 ∘C. The approach towards zero becomes pronounced only below ca. 500 ∘C. The gentle slope of the Brown and Parsons curve would indicate that this effect sets in at higher temperatures. The method of Waterwiese et al. (1985) relies on the ΔU and ΔS data of Salje et al. (1985), which, however, result in a course of Qod(T) that clearly deviates from the one set by the Goldsmith and Jenkins data, whether corrected or not (Fig. 9). This causes an element of uncertainty that cannot be resolved at present.
8.3 State of order in feldspars other than albite
There is only one feldspar other than low albite whose state of order we can be confident of; that is low microcline (LM). Anorthite, which is also usually taken to be fully ordered, is problematic, as shown by Angel et al. (1990), who found that the Val Pasmeda crystal had Qod=0.92. For LM, we have chosen the careful refinement by Strob (1983; Table 1). The sequence of sizes of the Si-centred tetrahedra is the same as in LA, , though the differences are less pronounced. From Eq. (8), assuming full order, we obtain calculated 〈T–O〉 distances that deviate from the observed ones only in the fourth decimal place. Furthermore, the three 〈Si–O〉 distances, which after removing the T–O–T angle influence (Eq. 9) should agree, do so with deviations in the fourth decimal place. Finally, the Al site occupancies comply with the assumption of full order. It thus appears that the analysis presented above can be applied to the full range of alkali feldspar compositions.
Commercial software from PTC Inc. (2020) and OriginLab Corporation (2020) has been used for the calculations.
Data were taken from the literature as cited in Tables 1 and 3.
HK performed the calculations and prepared the manuscript with substantial contributions from the co-authors.
The authors declare that they have no conflict of interest.
Our thoughts are with our friend, the late Horst Pentinghaus, KIT Karlsruhe, who has contributed much to this work through enduring fruitful discussions and never-ending practical help. He passed away shortly before this work was finished.
The authors are grateful to the reviewers, Andrew G. Christy and an anonymous referee, for carefully reading and commenting the manuscript, which greatly helped to improve the original text.
This paper was edited by Andrew Christy and reviewed by Andrew Christy and one anonymous referee.
Alberti, A. and Gottardi, G.: The determination of the Al-content in the tetrahedra of framework silicates, Z. Kristallogr., 184, 49–61, 1988.
Angel, R. J., Carpenter, M. A., and Finger, L. W.: Structural variation associated with compositional variation and order-disorder behavior in anorthite-rich feldspars, Am. Mineral., 75, 150–162, 1990.
Armbruster, Th., Bürgi, H. B., Kunz, M., Gnos, E., Brönnimann, St., and Lieneret, Ch.: Variation of displacement parameters in structure refinements of low albite, Am. Mineral., 95, 135–140, 1990.
Bader, R. F. W.: Atoms in molecules, Oxford Science Publications, Oxford, 1990.
Bambauer, H. U., Bernotat, W., Breit, U., and Kroll, H.: Perthitic alkali feldspar as indicator mineral in the Central Swiss Alps. Dip and extension of the surface of the microcline/sanidine transition isograd, Eur. J. Mineral., 17, 69–80, 2005.
Boisen Jr., M. B. and Gibbs, G. V.: A method for calculating fractional s-character for bonds of tetrahedral oxyanions in crystals, Phys. Chem. Miner., 14, 373–376, 1987.
Boisen Jr., M. B., Gibbs, J. V., Downs, R. B., and D'Arco, P.: The dependence of the SiO bond length on structural parameters in coesite, the silica polymorphs, and the clathrasils, Am. Mineral., 75, 748–754, 1990.
Brown, G. E., Gibbs, J. V., and Ribbe, P. H.: The nature and the variation in length of the Si-O and Al-O bonds in framework silicates, Am. Mineral., 54, 1044–1061, 1969.
Brown, W. L. and Parsons, I.: Alkali feldspars: ordering rates, phase transformations and behaviour diagrams for igneous rocks, Mineral. Mag., 53, 25–43, 1989.
Carpenter, M. A. and Salje, E. K. H.: Thermodynamics of nonconvergent cation ordering in minerals: III. Order parameter coupling in potassium feldspar, Am. Mineral., 79, 1084–1098, 1994.
Christy, A. G.: Isosymmetric structural phase transitions: phenomenology and examples, Acta Crystallogr., B51, 753–757, 1995.
Coulson, C. A.: Valence, Oxford University Press, London, 1961.
Curetti, N., Sochalski-Kolbus, L. M., Angel, R. J., Benna, P., Nestola, F., and Bruno, E.: High-pressure structural evolution and equation of state of analbite, Am. Mineral., 96, 383–392, 2011.
Downs, R. T., Hazen, R. M., and Finger, L. W.: The high-pressure crystal chemistry of low albite and the origin of the pressure dependency of Al-Si ordering, Am. Mineral., 79, 1042–1052, 1994.
Downs, R. T., Andalman, A., and Hudacsko, M.: The coordination numbers of Na and K atoms in low albite and microcline.as determined from procrystal electron density distributions, Am. Mineral., 81, 1344–1349, 1996.
Fleet, S. G., Chandrasekhar, S., and Megaw, H. D.: The structure of bytownite (“body-centered anorthite”). Acta Crystallogr., 21, 782–801, 1966.
Geisinger, K. L., Gibbs, G. V., and Navrotsky, A.: A molecular orbital study of bond lengths and angle variations in framework silicates, Phys. Chem. Miner., 11, 266–283, 1985.
Gibbs, G. V., Meagher, E. P., Newton, M. D., and Swanson, D. K.: A comparison of experimental and theoretical bond length and angle variations for minerals, inorganic solids, and molecules, in: Structure and bonding in crystals, Academic Press Inc., New York, vol. I, 195–225, 1981.
Gibbs, G. V., Ross, N. L., Cox, D. F., and Rosso, K. M.: Insights into the crystal chemistry of Earth materials rendered by electron density distributions: Pauling's rules revisited, Am. Mineral., 99, 1071–1084, 2014.
Goldsmith, J. R. and Jenkins, D. M.: The high-low albite relations revealed by reversal of degree of order at high pressure, Am. Mineral., 70, 911–923, 1985.
Grundy, H. D. and Brown, W. L.: A high-temperature X-ray study of the equilibrium forms of albite, Mineral. Mag., 37/286, 156–172, 1969.
Harlow, G. E. and Brown, G. E.: Low albite: an X-ray and neutron diffraction study, Am. Mineral., 65, 986–995, 1980.
Holland, T. J. B.: The reaction albite = jadeite + quartz determined experimentally in the range 600–1200 ∘C, Am. Mineral., 65, 129–134, 1980.
Hovis, G. L.: Behavior of alkali feldspars: Crystallographic properties and characterization of composition and Al-Si distribution, Am. Mineral., 71, 869–890, 1986.
Kroll, H.: Determination of Al,Si distribution in alkali feldspars from X-ray powder data, Neues Jb. Miner. Monat., 2, 91–94, 1971.
Kroll, H.: Estimation of the Al,Si distribution of feldspars from the lattice translations Tr[110] and Tr[10]. I. Alkali feldspars, Contrib. Mineral. Petr., 36, 141–156, 1973.
Kroll, H. and Ribbe, P. H.: Lattice parameters, composition and Al,Si order in alkali feldspars, in: Feldspar Mineralogy, edited by: Ribbe, P. H., Reviews in Mineralogy, 2, 57–100, 1983.
Kroll, H. and Ribbe, P. H.: Determining (Al,Si) distribution and strain in alkali feldspars using lattice parameters and diffraction-peak positions: A review, Am. Mineral., 72, 491–506, 1987.
Kroll, H., Bambauer, H. U., and Schirmer, U.: The high albite – monalbite and analbite – monalbite transitions, Am. Mineral., 65, 1192–1211, 1980.
Kroll, H., Kirfel, A., and Heinemann, R.: Order and anti-order in olivine II: Thermodynamic analysis and crystal-chemical modelling, Eur. J. Mineral., 18, 691–704, 2006.
Laves, F.: Al/Si-Verteilungen, Phasen-Transformationen und Namen der Alkalifeldspäte, Z. Kristallogr., 113, 265–296, 1960.
Laves, F. and Goldsmith, J. R.: Polymorphism, order, disorder, diffusion and confusion in the feldspars, Curs. y Conf del Inst. “Lucas Mallada”, 8, 71–80, 1961.
Liebau, F.: Structural chemistry of silicates, Springer-Verlag, Berlin, Heidelberg, 1985.
Martin, R. F.: Cell parameters and infrared absorption of synthetic high to low albites, Contrib. Mineral. Petrol., 26, 62–74, 1970.
Meneghinello, E., Alberti, A., and Criciano, G.: Order-disorder process in the tetrahedral sites of albite, Am. Mineral., 84, 1144–1151, 1999.
Newton, M. D. and Gibbs, J. V.: Ab initio calculated geometries and charge distributions for H4SiO4 and H6Si2O7 compared with experimental values for silicates and siloxanes, Phys. Chem. Miner., 6, 221–246, 1980.
OriginLab Corp.: OriginPro 8.1 SR3, One Roundhouse Plaza, Northhampton MA 01060, USA, available at: https://www.originlab.com, last access: 27 May 2020.
Orville, P. M.: Unit-cell parameters of the microcline-low albite and the sanidine-high albite solid solution series, Am. Mineral., 52, 55–86, 1967.
Phillips, M. W. and Ribbe, P. H.: The variation of tetrahedral bond lengths in sodic plagioclase feldspars, Contrib. Mineral. Petr., 39, 327–339, 1973.
Phillips, M. W., Ribbe, P. H., and Gibbs, G. V.: Tetrahedral bond length variations in anorthite, Am. Mineral., 58, 495–499, 1973.
Phillips, M. W., Ribbe, P. H., and Pinkerton, A. A.: Structure of intermediate albite, NaAlSi3O8, Acta Crystallogr., C45, 542–545, 1989.
Prewitt, C. T., Sueno, S., and Papike, J. J.: The crystal structures of high albite and monalbite at high temperatures, Am. Mineral., 61, 1213–1225, 1976.
PTC Inc.: Mathcad-Software 15.0, vs.M050, 140 Kendrick Street, Needham, MA 02494 USA, available at: https://www.ptc.com, last access: 27 May 2020.
Ribbe, P. H.: Average structures of alkali feldspars and plagioclases: systematics and applications, in: Feldspars and feldspathoids. Structures, properties and occurrences, edited by: Brown, W. L., NATO ASI series, 137, 1–54, 1984.
Ribbe, P. H.: The crystal structures of the aluminum-silicate feldspars, in: Feldspars and their reactions, edited by: Parsons, I., NATO ASI series, 421, 1–49, 1994.
Salje, E.: Thermodynamics of sodium feldspar I: Order parameter treatment and strain induced coupling effects, Phys. Chem. Miner., 12, 93–98, 1985.
Salje, E., Kuscholke, B., Wruck, B., and Kroll, H.: Thermodynamics of sodium feldspar II: Experimental results and numerical calculations, Phys. Chem. Miner., 12, 99–107, 1985.
Scambos, T. A., Smyth, J. R., and McCormick, T. C.: Crystal-structure refinement of high sanidine from upper mantle, Am. Mineral., 72, 973–978, 1987.
Smith, J. V.: Feldspar minerals. I. Crystal structure and physical properties, Springer-Verlag Berlin, Heidelberg, 1974.
Smith, J. V., Artioli, G., and Kvick, Å.: Low albite, NaAlSi3O8: neutron diffraction study of crystal structure at 13 K, Am. Mineral., 71, 727–733, 1986.
Stewart, D. B. and Ribbe, P. H.: Structural explanation for variations in cell parameters of alkali feldspars with Al/Si ordering, Am. J. Sci., 267-A, 444–462, 1969.
Strob, W.: Strukturverfeinerung eines Tief-Mikroklins, Zusammenhänge zwischen < T-O > Abständen und Al,Si-Ordnungsgrad und metrische Variation in einer Tief-Albit/Tief-Mikroklin-Mischkristallreihe, Inaugural-Dissertation, Westf. Wilhelms-Universität, Münster, 1983.
Su, S. C., Ribbe, P. H., Bloss, F. D., and Goldsmith, J. R.: Alkali feldspars: Structural state determined from composition and optic axial angle 2V, Am. Mineral., 71, 1384–1392, 1986.
Tribaudino, M., Gatta, G. D., Aliatis, I., Bersani, D., and Lottici, P. P.: Al-Si ordering in albite: A combined single-crystal X-ray diffraction and Raman spectroscopy study, J. Raman Spectrosc., 49, 2028–2035, 2018.
Wainwright, J. E. and Starkey, J.: Crystal structure of a metamorphic low albite, Progr. Geol. Soc. America Mtg. Mexico City, p. 310, 1968.
Waterwiese, T., Chatterjee, N. D., Dierdorf, I., Göttlicher, J., and Kroll, H.: Experimental and thermodynamic study of heterogeneous and homogeneous equilibria in the system NaAlSiO4-SiO2, Contrib. Mineral. Petr., 121, 61–73, 1995.
Wenk, H.-R. and Kroll, H.: Analysis of P, I and C plagioclase structures, Bull. Mineral., 107, 467–487, 1984.
Winter, J. K., Okamura, F. P., and Ghose, S.: A high-temperature structural study of high albite, monalbite, and the analbite – monalbite phase transition, Am. Mineral., 64, 409–423, 1979.
- Abstract
- Dedicated by Herbert Kroll to Peter Baumgart for decades of caretaking
- Introduction
- T–O bond length variation
- Al,Si distribution in intermediate to high albite and analbite
- Unit cell dimensions and Al site occupancies
- Calibration of tr[110] − tr[] versus Δ2θ(131)
- The effect of pressure on the state of order
- The Al,Si distribution at equilibrium with temperature and pressure
- Discussion
- Code availability
- Data availability
- Author contributions
- Competing interests
- Acknowledgements
- Review statement
- References
The requested paper has a corresponding corrigendum published. Please read the corrigendum first before downloading the article.
- Article
(2922 KB) - Full-text XML
- Abstract
- Dedicated by Herbert Kroll to Peter Baumgart for decades of caretaking
- Introduction
- T–O bond length variation
- Al,Si distribution in intermediate to high albite and analbite
- Unit cell dimensions and Al site occupancies
- Calibration of tr[110] − tr[] versus Δ2θ(131)
- The effect of pressure on the state of order
- The Al,Si distribution at equilibrium with temperature and pressure
- Discussion
- Code availability
- Data availability
- Author contributions
- Competing interests
- Acknowledgements
- Review statement
- References