the Creative Commons Attribution 4.0 License.
the Creative Commons Attribution 4.0 License.
Mullite-2c – a natural polytype of mullite
Stephan Lenz
Johannes Birkenstock
Lennart A. Fischer
Hartmut Schneider
Reinhard X. Fischer
A single crystal (∼ 20 µm × 20 µm × 330 µm) of mullite-2c, a natural polytype of mullite, was separated from a radially grown cluster of acicular crystals from Ettringer Bellerberg (Quarternary Eifel volcanic fields, Germany). The chemical composition determined from electron microprobe analysis (EMPA) is , corresponding to x=0.22(8) in the generalised mineral formula . Only Fe3+ as foreign cation was considered in the refined structure model, partially replacing Al3+ in the octahedral chains. A crystal of a similar type, though exhibiting a significantly different composition with x=0.02, was first described in 2015, tentatively named “sillimullite” by Fischer et al. (2015). This crystal and our new sample have similar structural properties, now classified as a polytype of mullite, designated mullite-2c. Single-crystal X-ray diffraction showed that the mullite-2c crystal investigated here exhibits partial Si ∕ Al ordering in the double chains of (Si,Al)O4 tetrahedra in contrast to the sample described in 2015 as being completely ordered. The ordering in mullite-2c results in a doubled c lattice parameter with respect to mullite. It crystallises in space group Pnam, with cell parameters for the new sample of a=7.5432(5) Å, b=7.7048(5) Å, c=5.7965(3) Å, V=336.89(6) Å3 and Z=1. X-ray powder diffraction data are presented with a detailed discussion of the differences between the diffraction patterns of sillimanite, mullite and mullite-2c. Crystals of mullite-2c are translucent to lightly violet, they possess a vitreous lustre and the calculated density is 3.199 g cm−3. The optical character is biaxial (+), with refractive indices determined by spindle-stage microscopy of nx=1.6673, ny=1.6687 and nz=1.680(4) (adjusted to conform to 2VZ=39(4)∘). Applying the Gladstone–Dale approach, the compatibility index is 0.007, representing superior compatibility. In terms of chemical composition and structural features mullite-2c is an outstanding example of mullite-type compounds falling into the postulated miscibility gap between sillimanite and mullite. Its crystal structure combines characteristics from both mullite (oxygen vacancies, triclusters of tetrahedral building units) and sillimanite (high degree of Si ∕ Al ordering in the tetrahedral building units, causing the doubled c parameter). The lattice parameters (normalised to 1c) of the new sample lie between those of sillimanite and 3 / 2 mullite; the chemical composition is close to 3 / 2 mullite and thus differs significantly from the silica-rich composition of the species previously determined by Fischer et al. (2015), indicating a relatively large compositional variation.
- Article
(2631 KB) - Full-text XML
-
Supplement
(287 KB) - BibTeX
- EndNote
In spite of the fact that mullite occurs rarely in natural rocks, synthetic mullites certainly belong to the most important phases not only for traditional ceramics, such as pottery and refractories, but also for engineering ceramics in the form of monolithic mullite ceramics, mullite fibres, mullite coatings and mullite-based composites (see, e.g. Schneider and Komarneni, 2005). That is why the crystal structure and structure-related properties have been intensively studied in past years (see, e.g. Schneider et al., 2015).
The mineral mullite belongs to the family of mullite-type compounds as defined by Fischer and Schneider (2005) and Fischer et al. (2012) and can in principle be considered a member of the general compositional series , with sillimanite (x=0), 3 / 2 mullite (x=0.25) and 2 / 1 mullite (x=0.40) as its main compounds. In contrast, natural mullites have a chemical composition at the SiO2-rich side of the system Al2O3−SiO2 and generally show a composition with x<0.25 (Lenz et al., 2019). Cameron (1976b) proposed the presence of a miscibility gap at the SiO2-rich side of the system between sillimanite and 3 / 2 mullite based on the coexistence of both minerals in natural rocks. The presence of a miscibility gap would also be supported by differences in the crystal structures of sillimanite and mullite crystallising in different space groups, Pbnm (sillimanite) and Pbam (mullite), with Si ∕ Al ordering in sillimanite and oxygen vacancies in mullite. The ordering causes a doubling of the c parameter of the unit cell of sillimanite compared to that of mullite. Burnham (1964) stated that the mullite structure theoretically fits to any composition of the series. Lenz et al. (2019) have demonstrated that many of the chemical compositions of natural mullites fall into the assumed miscibility gap. In addition, Aramaki (1961) and Cameron and Ashworth (1972) described Fe- and Ti-bearing sillimanites from the Asama volcano, Japan, which are deficient in their Si concentration, and Cameron (1976a) described a natural mullite with a composition that is intermediate between sillimanite and 3 / 2 mullite. All these minerals are supposed to be formed under low-pressure conditions. Hariya et al. (1969) synthesised aluminium silicates with unit-cell dimensions between sillimanite and mullite under high temperature and high pressure. They produced mullites from kaolin at temperatures of 1300 to 1500 ∘C and pressures of 3.5–20 kbar, yielding phases with cell parameters that are intermediate between those of sillimanite and 3 / 2 mullite. Their interpretation was a variable degree of ordering at the tetrahedral Al and Si sites. On the other hand, they transformed natural sillimanite (1500 ∘C, 7.5 kbar) into a mullite-type phase with unit-cell parameters shifted towards 3 / 2 mullite, assuming a decrease in the ordering. Hariya et al. (1969) concluded that a continuous isomorphous series could exist between sillimanite and mullite. A complete transformation from sillimanite to 3 / 2 mullite takes place at high temperature (1600 ∘C) and ambient pressure (see, e.g. Holdaway, 1971; Greenwood, 1972; Guse et al., 1979; Rahman et al., 2001; Igami et al., 2019). Natural mullites presented in Agrell and Smith (1960), Cameron and Ashworth (1972), and Cameron (1976a, b, 1977b) also show intermediate unit-cell dimensions. Moreover, Taylor (1928), and Agrell and Smith (1960) observed faint sillimanite-like superstructure reflections (l= odd) in single-crystal X-ray diffraction patterns of mullite. Cameron and Ashworth (1972) and Cameron (1976a, 1977a) also obtained weak but sharp l= odd superstructure reflections in single-crystal electron diffraction measurements of natural mullites. Fischer et al. (2015) first described, in structural detail, a new variant of mullite with the tentative name “sillimullite”, found in a natural sample from Ettringer Bellerberg, Germany. It combines features from mullite (oxygen vacancies, tricluster formation) and sillimanite (Si ∕ Al ordering with doubled c parameter). Thus, it represents an intermediate state between the two minerals in terms of crystal structure and chemical composition. Given these partially contradicting results, more detailed data are needed for samples lying in the supposed miscibility gap.
Table 1Crystal data, data collection parameters and structure refinement details for mullite-2c.
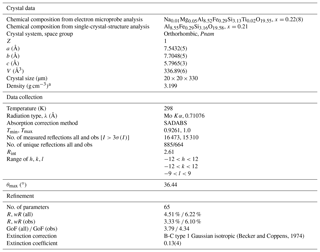
a Calculated based on the empirical formula and the unit cell parameters obtained from the single-crystal measurement.
,
,
,
,
,
n is the number of reflections and p is the number of parameters refined.
In this work, we present the determination of the crystal structure and optical properties of a natural mullite-type sample similar to that of Fischer et al. (2015) yet significantly distinct in terms of composition and important details of the structural arrangement. Similarities and differences to the sample in Fischer et al. (2015) are highlighted. The main focus lies on the Si ∕ Al ordering scheme, a detailed discussion of the identification of mullite-2c from powder X-ray diffraction patterns, the determination of anisotropic refractive indices and the Gladstone–Dale compatibility index as well as a comparison with mean values derived from electronic polarisabilities and a brief discussion of possible formation conditions of this mineral.
2.1 Sample
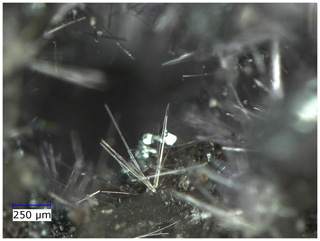
A crystal with dimensions of ∼ 20 µm × 20 µm × 330 µm was selected from a rock sample from the Ettringer Bellerberg volcano, Quaternary eastern Eifel volcanic fields, Germany, found on a pyrometamorphosed basement xenolith. The crystals of that sample occur as very fine needles grown as radiating aggregates in cavities of the host rock (Fig. 1). They show a length of up to 600 µm parallel [001] and a diameter of up to 20 µm, the latter being less than 5 µm on average. These crystals were presumably formed under high-temperature and low-pressure conditions. The type material was deposited in the collection of the Museum of Natural History, Berlin, Germany, catalogue number MFN_MIN_2018_01121. All investigations (single-crystal X-ray diffraction, optical measurement on a spindle stage, electron microprobe analyses) were carried out on the same crystal.
Table 2(a) Electron microprobe analyses of mullite-2c given in weight percent. (b) Electron microprobe analyses of mullite-2c given in atoms per formula unit (apfu). Calculation corresponds to a normalisation of the sum of M3+, M4+ and Mg2+ to 12.
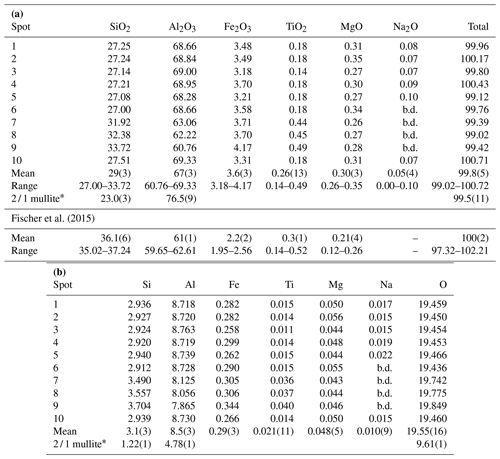
b.d.: below limit of detection; * 2 / 1 mullite was used as a reference.
2.2 Single-crystal X-ray diffraction
The single-crystal X-ray diffraction measurement was carried out on a Bruker D8 VENTURE diffractometer using Mo Kα radiation (λ=0.71076 Å). The instrument is equipped with a curved TRIUMPH monochromator, a 0.3 mm collimator, a four-circle goniometer in κ geometry and a PHOTON 100 CMOS area detector. Crystal data, data collection parameters and the refinement details are listed in Table 1. The program JANA2006 (Petříček et al., 2014) was used for the confirmation of the space group, averaging of the intensities and refinement of the crystal structure. Projections of the crystal structure were drawn with STRUPLO (Fischer and Messner, 2015). Inspection of sections in reciprocal space (calculated with Bruker APEX2 instrument control software) confirmed the presence of 2c superstructure reflections (l= odd), causing the doubling of lattice parameter c with respect to that of the unit cell of mullite.
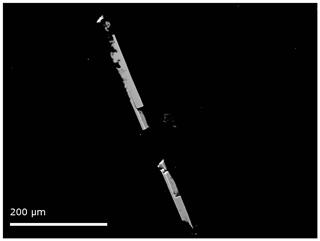
Figure 2Backscattered electron image of the single-crystal mullite-2c from the microprobe analysis. The acicular crystal broke into two pieces during the preparation.
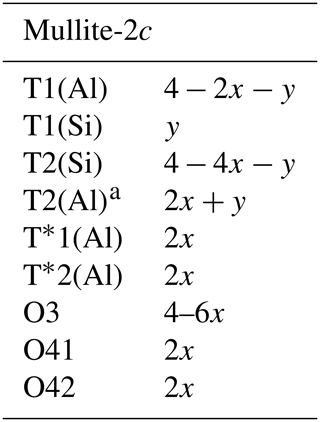
Table 3Atomic coordinates, Wyckoff positions (Wyck.), site occupancies (Occ.) and equivalent isotropic displacement factors Ueq (Å2) for mullite-2c.
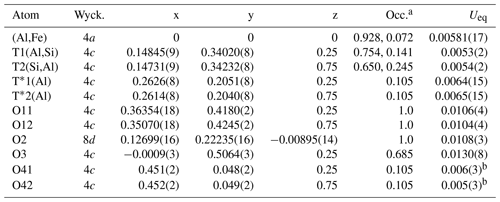
a Occupancies of the octahedral and tetrahedral sites were derived from EMPA. Occ(Al) = 1−Occ(Fe); the other partial occupancies result from Table 5 by using x=0.21 and scaling all equations in Table 5 by 1∕4, e.g. Occ(T1(Al)) . b Isotropic displacement parameters.
2.3 Electron microprobe analysis
Quantitative chemical analyses of the crystal were carried out on a CAMECA SX100 electron microprobe analyser (EMPA) in wavelength-dispersive mode (WDS) at the Institut für Mineralogie, Leibniz Universität Hannover. Data were collected at 10 different spots on the crystal, mounted in epoxy resin and polished (Fig. 2). During the preparation the crystal broke into two smaller pieces. The instrument is equipped with five wavelength-dispersive spectrometers and was operated with a focused electron beam with an acceleration voltage of 15 kV and a beam current of 15 nA. Counting times for each element were 10 s for the peak and 5 s for the background. Wollastonite (Si Kα1), kyanite (Al Kα1), hematite (Fe Kα1), rutile (Ti Kα1), periclase (Mg Kα1) and albite (Na Kα1) were used as standards. Raw X-ray intensities were treated for matrix effects with a PAP correction (Pouchou and Pichoir, 1991). Synthetic 2 / 1 mullite was used as a reference material and to account for the strong matrix effect of Al. The analytical results are given in Table 2.
2.4 Measurement of the refractive indices
Refractive indices of the crystal were determined by the immersion method. A detailed description of the immersion procedure is given by Bloss (1981). For this study, a spindle stage attached to a polarisation microscope was used. The investigated crystal was mounted on the spindle and finally inserted into the immersion cell filled with immersion oil. The set-up is described in detail by Medenbach (1985). The orientation of the crystal was determined by recording the extinction curves. The object spindle was rotated in steps of 10∘, and for each step the microscope-stage angles for extinction under crossed polarisers were measured. With the extinction data, the orientation of the principal axes of the indicatrix and the optic axial angle were calculated using the program EXCALIBRW (Gunter et al., 2005). Then the refractive indices corresponding to the three main axes of the indicatrix were measured using a filter in the yellow-light region. The compatibility index was calculated with the program POLARIO (Fischer et al., 2018) according to the definition in Mandarino (1981). The program was also used to calculate the mean refractive index from electronic polarisabilities taken from Shannon and Fischer (2016).
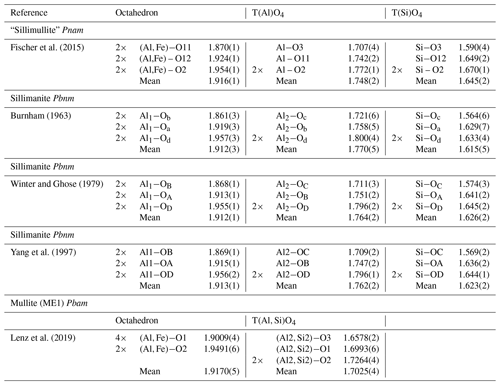
Table 4Selected interatomic distances (Å) and meana distances (Å) of mullite-2c.
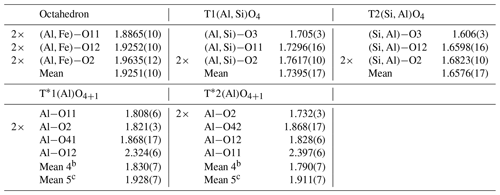
a Uncertainties of the mean values were calculated by the following error propagation: , where di is the ith distance, N is the number of distances, b is the mean value for a 4-fold coordinated T* atom, and c is the mean value for a 5-fold coordinated T* atom.
3.1 Crystal-structure refinement
The crystal has orthorhombic symmetry with space group Pnam, and the refined single-crystal unit-cell parameters are a=7.5432(5) Å, b=7.7048(5) Å, c=5.7965(3) Å, V=336.89(6) Å3 and Z=1. The crystal-structure refinement converged at Robs=3.33 % for 664 unique reflections with Fo>3σ(Fo) (more experimental details in Table 1). Final atomic parameters are listed in Table 3, and selected interatomic distances are listed in Table 4. All atoms except O41 and O42 could be refined with anisotropic displacement parameters (atomic parameters including a full set of anisotropic displacement parameters are given in Table S1 in the Supplement). The refinement was started from the crystal-structure model provided by Fischer et al. (2015). Site occupancies were derived and modified from the mullite occupation scheme (see Table 6; Fischer et al., 1994) to correspond to the doubled unit-cell volume according to the compositional series , with 2x corresponding to the number of oxygen vacancies per unit cell. Ignoring the minor amounts of Ti4+ and Mg2+, which are insignificant in terms of their contributions to the calculated intensities, occupancies were set according to Table 5 such that the total Si ∕ (Al+Fe) ratio corresponds to the (Si+Ti) ∕ (Al+Fe) ratio yielded from the EMPA results. Fixed occupancies for all atoms were set in accordance with the chemical composition and as functions of the x value (Table 5). The corresponding chemical composition used in the refinement was Al8.55Fe0.29Si3.16O19.58, i.e. x=0.21. The tetrahedrally coordinated (Si,Al) sites T1 and T2, the extra Al sites T*1 and T*2, and the oxygen positions O41 and O42 were constrained pairwise to have the same occupation to guarantee complete tetrahedra and diclusters and triclusters. To determine the distribution of Si4+ and Al3+ over T1 and T2 sites, the refinement of site-occupation factors is prevented due to the similarity in scattering factors. However, we inferred from the interatomic T–O distances that the T1(Al) site has an occupation of 15.7(29) % by Si, and 27.4(49) % of the T2(Si) site is occupied by Al (for details, see Sect. 4.1). The total amount of Fe (based on EMPA and considered to be Fe3+) was placed exclusively on the octahedral site.
3.2 Chemical analysis
Averaging the electron microprobe analyses from 10 different spots yields
an average composition of
29(3) wt % SiO2, 67(3) wt % Al2O3, 3.6(3) wt % Fe2O3,
0.26(13) wt % TiO2,
0.30(3) wt % MgO and
0.05(4) wt % Na2O (Table 2a),
corresponding to 41(3) mol % SiO2, 56(3) mol % Al2O3,
1.90(13) mol % Fe2O3, 0.28(14) mol % TiO2,
0.63(7) mol % MgO and
0.07(6) mol % Na2O. The analyses reveal a broad variance in the Si
and Al concentrations. The amount of SiO2 ranges between 27.00 and
33.72 wt %, and that of Al2O3 varies between 60.76 and 69.33 wt %.
The resulting atoms per formula unit (Table 2b) are calculated based on a
normalisation of the tri- and tetravalent cations and Mg2+ to a total
of 12 cations, according to
(see Lenz et al., 2019). This general compositional formula is
derived from the known mullite compositional series considering the doubled
unit-cell volume and the extra cations. With the assumption that all iron is
ferric, the empirical formula of the analysed crystal is
Na0.01Mg0.05Al8.52Fe0.29Si3.13Ti0.02O19.55, corresponding to x=0.22(8).
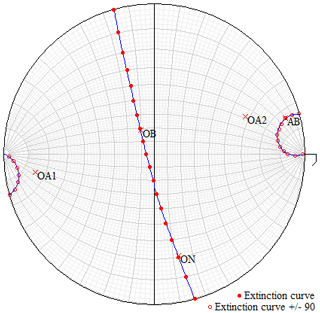
Figure 3Graphical output plotted by EXCALIBRW obtained from the extinction data of a mullite-2c crystal. This crystal is from the same rock sample as the specimen investigated by single-crystal X-ray diffraction and EMPA. The stereographic projection shows the observed extinction positions (solid and hollow dots) including the calculated extinction curves and the orientation of the optical axes (OA1 and OA2) as well as the directions of the three principal axes of the biaxial indicatrix, AB, OB and ON, which represents the acute bisectrix, obtuse bisectrix and optic normal.
3.3 Optical properties
The crystals from the rock sample, including the one investigated here, are translucent to pale violet, showing a vitreous lustre. The optical character of the examined crystal is biaxial (+) with an optic axial angle 2VZ of 39(4)∘ as determined from its extinction curves (see Sect. 2.4). The refractive indices, as inferred from immersion measurements, are nx=1.668(4), ny=1.668(4) and nz=1.680(4), where nx and ny could not be distinguished within the precision of the measurements. However, just a marginal shift from to nx=1.6673 and ny=1.6687 would perfectly match the 2VZ angle, applying Eq. (1) (see, e.g. Bloss, 1961):
Based on the standard uncertainty of 2VZ, the adapted indices nx and ny have an uncertainty of ±0.0002. The mean observed refractive index 〈n〉 is 1.672(7), and the mean refractive index calculated using the Gladstone–Dale constants from Mandarino (1981) is 1.677, and using electronic polarisabilities after Shannon and Fischer (2016), it is 1.659. The extinction positions, the calculated extinction curves, and the locations of the optical axes and principal axes of the indicatrix are shown in the stereographic projection in Fig. 3. The optical orientation is , , . The Gladstone–Dale compatibility index () based on n=1.677 is 0.007, and thus it is in the range of superior compatibility.
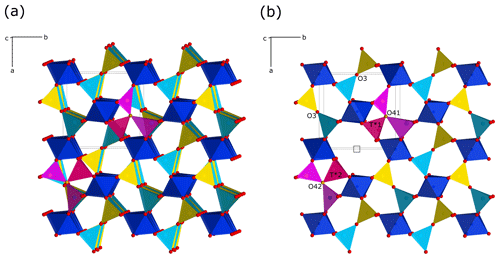
Figure 4Crystal structure of mullite-2c projected to the a–b plane (view direction parallel c, slightly rotated about the a and b axis). The octahedra are predominantly occupied by Al and to some extent by Fe. The blue tetrahedra are mainly occupied by Al (T1 site), and the yellow ones are mostly occupied by Si (T2 site). An oxygen vacancy is shown at 1, 1∕2, 1. Triclusters are composed of two TO4 groups (light violet) and one T*O4 tetrahedron (magenta), connected by the O41∕O42 atom (ochre). The outline of one unit cell is shown in the upper left. (a) Projection of four unit cells. (b) Representation of the uppermost layer of the structure, emphasising the oxygen vacancy.
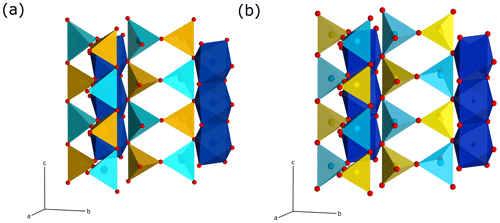
Figure 5Crystal-structure representations of the sillimanite and mullite-2c tetrahedral double chains. The left chains correspond to the chain 1∕2, 0, z, and the right ones to chain 0, 1∕2, z, in Fig. 4a. The colour coding of the polyhedra corresponds to that in Fig. 4. The double chains in the mullite-2c structure are shifted against each other by an offset of 1∕2 c compared to sillimanite. View direction is perpendicular to the c axis and is slightly rotated about c and b. (a) Sillimanite. (a) Mullite-2c.
4.1 Crystal structure and polytypism
According to the criteria given in Fischer and Schneider (2005) and Fischer et al. (2012), the crystal structure of the investigated mineral can be assigned to the group of mullite-type compounds. It exhibits linear chains of edge-sharing MO6 octahedra (M is mainly Al, Fe minor), running parallel c with tetrahedral T2O7 dicluster groups (T = Si, Al) cross-linking neighbouring octahedral chains (Fig. 4). Fischer et al. (2015) demonstrated that its space group (Pnam) is a klassengleiche subgroup of index 2 of mullite (Pbam), and thus it represents a subgroup of the hypothetical tetragonal aristotype P4∕mbm. The refined crystal structure shows mixed characteristics of both mullite and sillimanite. On the one hand, similar to sillimanite, the distribution of Si and Al over the T sites (dicluster groups) is ordered; however, due to the larger fraction of Al compared to Si and a slight additional disorder (see below), this is not to 100 %. Hence, two T sites are to be distinguished: T1 is mainly occupied by Al, and T2 is mainly occupied by Si, representing the partial ordering being responsible for the doubling of the c parameter compared to mullite, where Si and Al are statistically distributed on a single T site. On the other hand, the crystal structure shows oxygen vacancies at the O3 site. This causes a shift of the affected T sites to two new T* sites forming two triclusters, each consisting of two TO4 and one T*O4 tetrahedra. Therefore, the bridging oxygen atom of the dicluster is shifted from the O3 to the O4 position. However, in contrast to the relationships in mullite, the present crystal has two crystallographically independent T* and O4 positions, which result from the doubling of the c axis and the associated symmetry reduction in the supercell. At the vacancy, the former T1 site is shifted to the new T*1 site connected by O41 to form the tricluster. The T2 site is shifted to the T*2 site and bonded to O42 to form another tricluster (see Fig. 4). This ordering scheme of Fischer et al. (2015) is confirmed by our results. Compared to sillimanite, neighbouring double chains of TO4 diclusters have an offset of 1∕2 of a unit cell in the c direction (see Fig. 5). This leads to a change of the space-group setting, from Pbnm (sillimanite) to Pnam. As pointed out by Fischer et al. (2015), in principle, Pnam could be transformed into Pbnm by a simple interchange of lattice vectors a and b, but this would yield a reversed ratio of these lattice parameters relative to sillimanite and mullite and would not avoid the shift of 1∕2 c in the tetrahedral double chains.
As described in the previous paragraph, the difference to the mullite structure is the order–disorder relationship of the T-site aluminium and silicon positions. In mullite, Al and Si are statistically distributed and share the same crystallographic T site. The crystal structure of mullite-2c has two independent T positions. The crystal can be considered to be built up by a stacking of layers of similar structure units along c with a periodicity of 2, which is reflected in a doubled c axis. However, it can be clearly distinguished from sillimanite. Thus, the structure can be described as a polytype of mullite following the guidelines on mineral nomenclature of the Commission on New Minerals, Nomenclature and Classification (CNMNC) of the International Mineralogical Association (Nickel and Grice, 1998), which states that “Polytypes are substances that occur in several different structural modifications, each of which may be regarded as being built up by the stacking of layers of (nearly) identical structure and composition and with the modifications differing only in their stacking sequence.” For this reason, this mineral is designated as mullite-2c.
Deviating from the description in Fischer et al. (2015), the T1(Al) and T2(Si) positions are occupied to equal fractions to guarantee the integrity of tetrahedral di- and triclusters in the modified structure model presented here. For charge balance, a certain amount of Si must be replaced by Al on the T sites, which equals twice the x value (expressed in units of apfu – atoms per formula unit). The analysis of the interatomic distances showed that the mean T1–O bond length is slightly shorter than average aluminium–oxygen distances reported in the literature (Burnham, 1963; Winter and Ghose, 1979; Yang et al., 1997). Similarly, the mean T2–O distance is a little longer than average silicon–oxygen distances in sillimanite (compare Table 4 and 6). This is in accordance with the observations made by Fischer et al. (2015). Apparently, the distribution of Si and Al in the tetrahedral double chains is not strict but partially disordered beyond the slight disorder imposed by the above-mentioned non-equal fractions of Si and Al on the T sites. From the average reference distances in sillimanite ( Å and Å) we calculated that the observed distances in mullite-2c correspond to an occupation of 17.8(32) % of Si on the T1(Al) site and 25.3(45) % Al on the T2(Si) site. Uncertainties in brackets were determined by error propagation considering the average values and the standard uncertainties of the observed bond lengths and of the reference bond lengths averaged over values given by Burnham (1963), Winter and Ghose (1979), and Yang et al. (1997; see Supplement). These results clearly confirm the partial ordering of Al and Si in the double chains, but they represent a slight excess of Si compared with the chemical analysis. In order to achieve charge balance and to match the measured chemical composition, the fractions of Si and Al were varied “symmetrically” (lowering Si, increasing Al) within the error margins, yielding 15.7(29) % Si on T1(Al) and 27.4(49) % Al on T2(Si).
The final refinement converged at Robs=3.33 %, which is slightly better than a refinement with a mixed occupation only on T2 (with 11.7 % Al), with Robs=3.46 %. A refinement carried out with the structure model provided by Fischer et al. (2015) led to negative isotropic displacement parameters of the atoms T*1 ∕ T*2 and O41∕O42, with Robs=6.21 %. We also applied the new model with improved restrictions on the Al ∕ Si distribution in a refinement versus the X-ray single-crystal diffraction data set of Fischer et al. (2015) using the published composition of x=0.12. This refinement resulted in R1=5.77 %, which is a slight improvement compared to the published R1 value of 5.9 %. This demonstrates that the principles of the improved structure model can be applied to mullite-2c with other compositions as well.
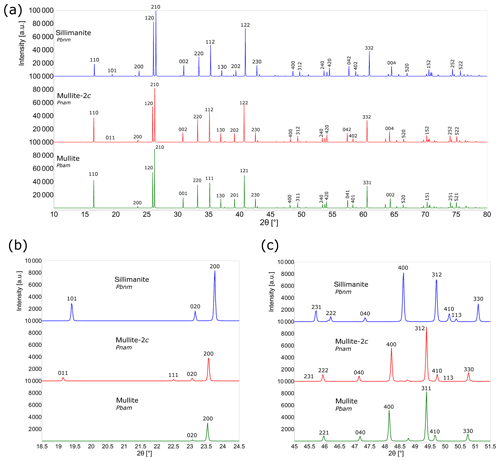
Figure 6Comparison of the calculated powder XRD patterns (CuKα) for sillimanite, mullite-2c and mullite. (a) Simulated powder diffractograms from 10 to 80∘2θ. (b) Powder patterns from 18.5 to 24.5∘2θ. (c) Details in the powder diffraction patterns from 45 to 51.5∘2θ. The 231 peak of mullite-2c barely appears.
Due to the structural similarities of mullite-2c, sillimanite and mullite, their X-ray powder diffractograms are also very similar. Accordingly, it is difficult to distinguish the three phases in a powder–diffraction pattern. Figure 6 shows the calculated powder diagrams for Cu Kα radiation, and a detailed view reveals some significant differences. The 011 reflection of mullite-2c exhibits an intensity of only about 20 % of the corresponding 101 reflection of sillimanite, and these do not appear in the mullite pattern (Fig. 6b). Furthermore, the 111 reflection is clearly visible for mullite-2c, yet it has an intensity of ∼ 0 in the sillimanite diffractogram, even though it is allowed by the reflection conditions of space group Pbnm. Figure 6c shows that the 231 reflection barely appears in the mullite-2c diffraction pattern. A comparison of selected X-ray lines (those shown in Fig. 6b and c) for sillimanite, mullite-2c and mullite are presented in Table 7a. The strongest X-ray lines calculated for these mineral phases are listed in Table 7b. Intensities and the corresponding d spacings of a simulated powder pattern of mullite-2c are listed in Table S2 of the Supplement.
Table 7(a) Comparison of selected X-ray powder diffraction lines of sillimanite, mullite-2c and mullite calculated for Cu Kα radiation (d in Å). (b) Comparison of the strongest calculated X-ray powder diffraction lines of sillimanite, mullite-2c and mullite for Cu Kα radiation (d in Å).
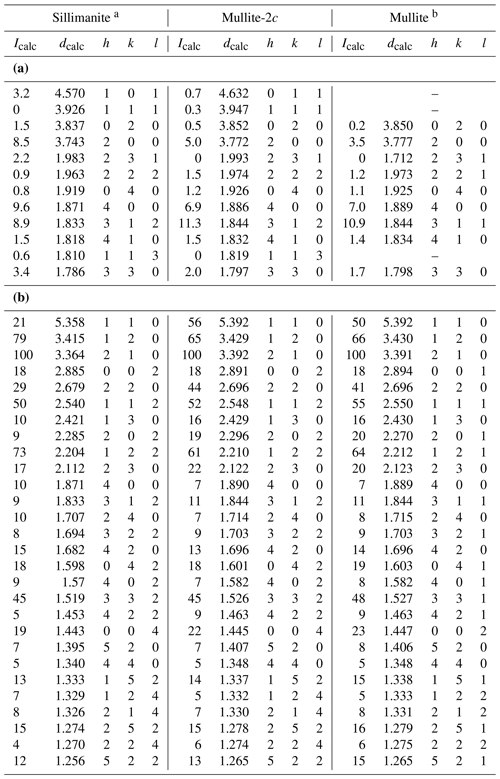
a Calculated from the crystal-structure model of Burnham (1963). b Calculated from specimen ME1 from Lenz et al. (2019).
4.2 Chemical composition and lattice parameters
As shown in Table 2, the EMPA analyses yielded a broad variance in the chemical composition and thus indicate a great heterogeneity of the crystal. The average composition results in x=0.22(8), a value that is intermediate between sillimanite (x=0) and 3 / 2 mullite (x=0.25) yet much closer to the latter. As mentioned above, the occupancies in the crystal-structure model were adapted to the EMPA results with an x value of 0.21. The slightly differing x values arise from the fact that the mineral formula derived from microprobe analyses contains Mg. Since Mg is not included in the structure model and the calculation of the formula is based on a normalisation of Al, Si and Mg, the x values are not exactly identical. Nevertheless, a refinement of the site occupation factor of atom O41 as a free parameter, together with constraints for the related atoms according to the relations from Table 5 in terms of x, yielded a chemical composition with x=0.208(3), which is very close to the EMPA-derived value of 0.22 and to the preset value of 0.21 in the structure model. Although the crystal investigated by Fischer et al. (2015) and the one studied here are from the same locality, they have significantly different chemical compositions. The former has a composition of x=0.02 and is thus very close to sillimanite. The composition of the present crystal is not far from 3 / 2 mullite. Even though only two examples of mullite-2c are known so far, this may indicate a broad compositional range of this polytype with . Fischer et al. (2015) discussed that such elevated silicon concentrations derived from EMPA may not reflect the pure composition of the crystal but may arise from a possible segregation of amorphous SiO2 nanoparticles within the matrix of the crystal. So, maybe, its true composition is close to x=0.12, which resulted from the crystal-structure refinement. Even in this case, however, the compositional range of mullite-2c would still be fairly broad. Besides that, EMPA has shown how variable the chemical composition can be even within the same small crystal. Hence, it is not surprising to find this relatively wide range of chemical compositions across different crystals. Aramaki (1961), Cameron and Ashworth (1972), and Cameron (1976a, b, 1977b) also reported minerals with compositions between sillimanite and mullite, but, unfortunately, they did not present any structural data. Thus, it is not clear whether their samples may be of the mullite-2c type or not.
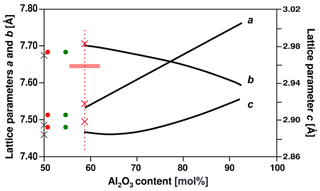
Figure 7Lattice parameters plotted versus Al2O3 concentration of the mullite compositional series , modified plot after Fischer et al. (1996). The left ordinate refers to lattice parameters a and b, and the right one refers to c. Red crosses display lattice parameters of mullite-2c for the chemical composition of the EMPA. Red and green dots represent lattice parameters from Fischer et al. (2015) for a composition derived from EMPA (red) and single-crystal-structure refinement (green), respectively. Grey crosses show lattice parameters of sillimanite (Burnham, 1963). Fe2O3 is assigned to the Al2O3 content. The horizontal red bar represents the standard deviation of the microprobe composition. For comparison with mullite the c parameter of mullite-2c and sillimanite is halved.
Figure 7 shows the mullite-2c lattice parameters from the single-crystal refinements plotted against the Al2O3 concentration (Fe2O3 assigned to Al2O3) in comparison with the lattice parameter trend lines of synthetic mullite from Fischer et al. (1994). We found lattice parameters a and b for our sample (red crosses) to be only slightly larger and thus in reasonable agreement with the curves, whereas c is strongly increased. This increase is presumably caused by the incorporation of the foreign cations: Agrell and Smith (1960) observed an increase in c and of the cell volume with increasing amounts of Fe and Ti for iron- and titanium-bearing natural mullites and sillimanites. In our case Al3+ in the octahedral chains is most likely partially replaced by Fe3+.
The refractive indices of the mullite-2c crystal are higher, and its birefringence of 0.012 is a bit lower compared to those of natural mullites (see Lenz et al., 2019, and the references therein). As shown by Lenz et al. (2019), the incorporation of foreign cations like Mg, Ti and, above all, Fe has a significant impact on the refractive indices. Even small amounts of such cations increase refractive indices noticeably. The iron concentration in the mullite-2c crystal investigated here is much higher compared to natural mullites from the literature. This is most likely the reason for the elevated refractive indices.
4.3 Formation and occurrence
Referring to the partial ordering of Si and Al at the tetrahedral sites, mullite-2c can be considered to be a highly ordered mullite. This raises the following question: which mechanism might cause such an ordering? It is known that sillimanite transforms into mullite under high temperature and ambient pressure, accompanied by Si ∕ Al disordering (see, e.g. Holdaway, 1971; Greenwood, 1972; Guse et al., 1979; Rahman et al., 2001; Igami et al., 2019). Igami et al. (2017) showed that mullitisation starts at temperatures above ∼ 1200 ∘C. Rahman et al. (2001) demonstrated that a complete transformation from sillimanite to 3 / 2 mullite takes place after heat treatment for 24 h at 1600 ∘C together with an exsolution of amorphous SiO2. Hariya et al. (1969) have synthesised mullite-type phases showing unit-cell dimensions between sillimanite and 3 / 2 mullite, applying high temperatures (1300 and 1500 ∘C) and high pressures up to 20 kbar. Holland and Carpenter (1986) carried out annealing experiments on sillimanite at high temperatures and high pressures (1300–1700 ∘C and 18–20 kbar). They produced phases slightly enriched in Al2O3, showing diffraction patterns with l= odd reflections, which presumably might indicate Si ∕ Al ordering similar to our crystal. However, at temperatures ≥ 1650 ∘C the l= odd reflections become weaker, and thus the Si ∕ Al distribution potentially becomes increasingly disordered. Beger et al. (1970) performed similar annealing experiments at 1500 ∘C under even higher pressures up to 24 kbar. They did not observe any change of the chemical composition but rather a change in the symmetry and concluded that there was disordering of the Si and Al sites. Recently, Igami et al. (2019) performed several annealing experiments on sillimanite under high temperatures at ambient conditions as well as high pressures. Synchrotron X-ray powder diffraction revealed that the run at 1500 ∘C and 10 kbar yielded two phases: sillimanite and a newly formed Si-rich mullite. Moreover, they could show that sillimanite became partially disordered. It may be deduced that a transformation of sillimanite or mullite to a mostly ordered mullite might occur if high temperatures and pressures are applied. Moreover, it might be possible that upper and lower limits for pressure and temperature conditions exist for the formation of mullite-2c. However, it is rather unlikely that a mineral found on a basement xenolith from Ettringer Bellerberg has experienced pressures of ≥20 kbar, but Aramaki and Roy (1962) have synthesised mullites with intermediate lattice parameters together with small amounts of corundum at 727(10) ∘C and 2.9 kbar from a gel mixture with 3 / 2 mullite composition (60 mol % Al2O3 and 40 mol % SiO2). Such hydrothermal formation conditions appear to be more conceivable for minerals originating from volcanic rocks.
Descriptions of natural aluminium silicates with a composition between sillimanite and 3 / 2 mullite can also be found in the literature. Aramaki (1961) and Cameron and Ashworth (1972) described iron- and titanium-bearing sillimanites from the Asama volcano, Japan. Cameron and Ashworth (1972) and Cameron (1976a, 1977a) did observe weak but sharp sillimanite-type superstructure reflections in single-crystal electron diffraction patterns of natural mullites, which possibly arose from a Si ∕ Al ordering. Cameron (1977a) further discusses that Fe3+ may stabilise the Si–Al ordering if Ti is absent. All crystals investigated in his work with sillimanite-type superstructures have a ratio of 0.7–1.0. This is in agreement with the crystal studied here, having a ratio of 0.9. Although no detailed structural analyses were carried out on those samples, we assume that such specimens could correspond to mullite-2c.
Mullite-2c samples apparently exhibit a broad range of chemical compositions. The crystal structure shows features of sillimanite as well as mullite, but it clearly differs from both. The largely ordered Si ∕ Al distribution causes a stacking of structurally similar layers in the (001) plane, with a 2-fold periodicity and thus a doubling of lattice parameter c; however this stacking has an offset of 1∕2 c with respect to neighboured tetrahedral chains – representing an important difference to sillimanite. Due to the order–disorder relationship, this mineral represents a polytype of mullite and is therefore correctly denoted as mullite-2c. For future investigations of mullite-type minerals and synthetic analogues it must be carefully distinguished between mullite and its (partially) ordered polytype mullite-2c. It will be interesting to learn more about the mullite-2c structure, e.g. whether it can be described by randomly distributed oxygen vacancies in an ordered matrix or if it consists of nanoscale mullite domains. Knowing more of the formation conditions of this mineral may open the way to a controlled synthesis of mullite-type compounds with different compositions and tetrahedral Si ∕ Al ordering. The findings presented here on a partially ordered mullite might usher in a new era of mullite in material science. So far, all research was restricted to the compositional series of with 2 / 1 and 3 / 2 mullites as main members. In this context it will be interesting to learn how the properties of mullite-2c, such as the thermal behaviour (thermal expansion, heat capacity, thermal conductivity), the thermo-mechanical behaviour (strength, compressibility, elasticity) and other properties, like electrical conductivity and the optical behaviour, differ from those of “normal” 3 / 2 (3Al2O3•2SiO2) and 2 / 1 mullite (2Al2O3•SiO2) and whether the application of mullite ceramics can be extended by using mullite-2c.
It will be a challenge to try synthesising mullite-2c phases with hitherto unknown properties in ceramic materials. Some of the past work of mineralogists, describing mullites in the “miscibility gap”, and material scientists, characterising the transformation of sillimanite under high pressure, might be reevaluated to investigate if the specimens described in their work might have been mullite-2c instead of normal mullites. Further work is in progress to study mullite-2c by spectroscopic methods, DFT (density functional theory) calculations and high-temperature X-ray diffraction.
The single-crystal X-ray diffraction data set (*.hkl file) and CIF of mullite-2c are deposited in the Supplement.
The CIF may also be obtained from the joint CCDC/FIZ Karlsruhe online deposition service at https://www.ccdc.cam.ac.uk/structures/ (last access: 6 March 2020) by quoting the deposition number CSD 1988520.
The supplement related to this article is available online at: https://doi.org/10.5194/ejm-32-235-2020-supplement.
RXF and HS were responsible for the project design. LAF carried out the electron microprobe analyses. Single-crystal X-ray diffraction experiments, structure refinement and measurement of the refractive indices were done by SL. RXF, JB and SL interpreted and discussed the refinement results. All authors discussed the results and improved the paper, which was written by SL.
The authors declare that they have no conflict of interest.
We thank the Commission on New Minerals, Nomenclature and Classification (CNMNC) of the International Mineralogical Association (IMA) for their helpful comments recognising the polytypic nature of this mineral and the reviewers for their valuable comments.
This research has been supported by the Deutsche Forschungsgemeinschaft (grant no. FI 442/24-1).
The article processing charges for this open-access publication were covered by the University of Bremen.
This paper was edited by Paola Comodi and reviewed by Marco Pasero and Diego Gatta.
Agrell, S. O. and Smith, J. V.: Cell dimensions, solid solution, polymorphism, and identification of mullite and sillimanite, J. Am. Ceram. Soc., 43, 69–76, 1960.
Aramaki, S.: Sillimanite and cordierite from volcanic xenoliths, Am. Mineral., 46, 1154–1165, 1961.
Aramaki, S. and Roy, R.: Revised phase diagram for the system Al2O3—SiO2, J. Am. Ceram. Soc., 45, 229–242, 1962.
Becker, P. J. and Coppens, P.: Extinction within the limit of validity of the Darwin transfer equations. I. General formalism for primary and secondary extinction and their applications to spherical crystals, Acta Crystallogr. A, 30, 129–147, https://doi.org/10.1107/S0567739474000337, 1974.
Beger, R. M., Burnham, C. W., and Hays, J. F.: Structural changes in sillimanite at high temperature, in: Abstracts with Programs of the Annual Meeting of the Geological Society of America, Milwaukee, USA, 11–13 November 1970, 490–491, 1970.
Bloss, F. D.: An introduction to the methods of optical crystallography, Holt, Rinehart and Winston, New York, USA, 294 pp., 1961.
Bloss, F. D.: The spindle stage: principles and practice, Cambridge University Press, Cambridge, UK, 340 pp., 1981.
Burnham, C. W.: Refinement of the crystal structure of sillimanite, Z. Kristallogr., 118, 127–148, 10.1524/zkri.1963.118.16.127, 1963.
Burnham, C. W.: Crystal structure of mullite, Carnegie Institution of Washington Year Book, 63, 223–227, 1964.
Cameron, W. E.: A mineral phase intermediate in composition between sillimanite and mullite, Am. Mineral., 61, 1025–1026, 1976a.
Cameron, W. E.: Coexisting sillimanite and mullite, Geol. Mag., 113, 497–514, 1976b.
Cameron, W. E.: Nonstoichiometry in Sillimanite: Mullite Compositions with Sillimanite-Type Superstructures, Phys. Chem. Miner., 1, 265–272, 1977a.
Cameron, W. E.: Mullite: a substituted alumina, Am. Mineral., 62, 747–755, 1977b.
Cameron, W. E. and Ashworth, J. R.: Fibrolite and its relationship to sillimanite, Nature, 235, 134–136, 1972.
Fischer, R. X. and Messner, T.: STRUPLO, a new version of the structure drawing program, Universität Bremen, available at: https://www.brass.uni-bremen.de/user_data_struplo.html (last access: 11 June 2019), 2015.
Fischer, R. X. and Schneider, H.: The mullite-type family of crystal structures, in: Mullite, edited by: Schneider, H. and Komarneni, S., Wiley-VCH, Weinheim, Germany, 1–46, 2005.
Fischer, R. X., Schneider, H., and Schmücker, M.: Crystal structure of Al-rich mullite, Am. Mineral., 79, 983–990, 1994.
Fischer, R. X., Schneider, H., and Voll, D.: Formation of aluminum rich 9:1 mullite and its transformation to low alumina mullite upon heating, J. Eur. Ceram. Soc., 16, 109–113, https://doi.org/10.1016/0955-2219(95)00139-5, 1996.
Fischer, R. X., Burianek, M., and Shannon, R. D.: POLARIO, a computer program for calculating refractive indices from chemical compositions, Am. Mineral., 103, 1345–1348, https://doi.org/10.2138/am-2018-6587, 2018.
Fischer, R. X., Gaede-Köhler, A., Birkenstock, J., and Schneider, H.: Mullite and mullite-type crystal structures, Int. J. Mater. Res., 103, 402–407, https://doi.org/10.3139/146.110713, 2012.
Fischer, R. X., Tikhonova, V., Birkenstock, J., Fischer, L. A., Herrmann, K., Mengel, K., and Schneider, H.: A new mineral from the Bellerberg, Eifel, Germany, intermediate between mullite and sillimanite, Am. Mineral., 100, 1493–1501, https://doi.org/10.2138/am-2015-4966, 2015.
Greenwood, H. J.: AlIV-SiIV disorder in sillimanite and its effect on phase relations of the aluminum silicate minerals, Geol. Soc. Am. Mem., 132, 553–572, 1972.
Gunter, M. E., Downs, R. T., Bartelmehs, K. L., Evans, S. H., Pommier, C. J. S., Grow, J. S., Sanchez, M. S., and Bloss, F. D.: Optic properties of centimeter-sized crystals determined in air with the spindle stage using EXCALIBRW, Am. Mineral., 90, 1648–1654, https://doi.org/10.2138/am.2005.1892, 2005.
Guse, W., Saalfeld, H., and Tjandra, J.: Thermal transformation of sillimanite single crystals, Neues Jb. Miner. Monat., 4, 175–181, 1979.
Hariya, Y., Dollase, W., and Kennedy, G.: An experimental investigation of the relationship of mullite to sillimanite, Am. Mineral., 54, 1419–1441, 1969.
Holdaway, M. J.: Stability of andalusite and the aluminum silicate phase diagram, Am. J. Sci. 271, 97–131, 1971.
Holland, T. J. B. and Carpenter, M. A.: Aluminium/silicon disordering and melting in sillimanite at high pressures, Nature, 320, 151–153, 1986.
Igami, Y., Ohi, S., and Miyake, A.: Sillimanite-mullite transformation observed in synchrotron X-ray diffraction experiments, J. Am. Ceram. Soc., 100, 4928–4937, https://doi.org/10.1111/jace.15020, 2017.
Igami, Y., Ohi, S., Kogiso, T., Furukawa, N., and Miyake, A.: High-temperature structural change and microtexture formation of sillimanite and its phase relation with mullite, Am. Mineral., 104, 1051–1061, https://doi.org/10.2138/am-2019-6732, 2019.
Lenz, S., Birkenstock, J., Fischer, L. A., Schüller, W., Schneider, H., and Fischer, R. X.: Natural mullites: chemical composition, crystal structure, and optical properties, Eur. J. Mineral., 31, 353–367, https://doi.org/10.1127/ejm/2019/0031-2812, 2019.
Mandarino, J.: The Gladstone-Dale relationship; Part IV, The compatibility concept and its application, Can. Mineral., 19, 441–450, 1981.
Medenbach, O.: A new microrefractometer spindle-stage and its application, Fortschr. Mineral., 63, 111–133, 1985.
Nickel, E. H. and Grice, J. D.: The IMA Commission on New Minerals and Mineral Names: procedures and guidelines on mineral nomenclature, Miner. Petrol., 64, 237–263, https://doi.org/10.1007/bf01226571, 1998.
Petříček, V., Dušek, M., and Palatinus, L.: Crystallographic computing system JANA2006: general features, Z. Krist.-Cryst. Mater., 229, 345–352, https://doi.org/10.1515/zkri-2014-1737, 2014.
Pouchou, J.-L. and Pichoir, F.: Quantitative analysis of homogeneous or stratified microvolumes applying the model “PAP”, in: Electron probe quantitation, edited by: Heinrich, K. F. J. and Newbury, D. E., Springer, New York, USA, 31–75, 1991.
Rahman, S., Feustel, U., and Freimann, S.: Structure description of the thermic phase transformation sillimanite–mullite, J. Eur. Ceram. Soc., 21, 2471–2478, https://doi.org/10.1016/S0955-2219(01)00386-7, 2001.
Schneider, H. and Komarneni, S.: Mullite, Wiley-VCH, Weinheim, Germany, 487 pp., 2005.
Schneider, H., Fischer, R. X., and Schreuer, J.: Mullite: Crystal Structure and Related Properties, J. Am. Ceram. Soc., 98, 2948–2967, https://doi.org/10.1111/jace.13817, 2015.
Shannon, R. D. and Fischer, R. X.: Empirical electronic polarizabilities of ions for the prediction and interpretation of refractive indices: Oxides and oxysalts, Am. Mineral., 101, 2288–2300, 2016.
Taylor, W. H.: The structure of sillimanite and mullite, Z. Krist.-Cryst. Mater., 68, 503–521, 1928.
Winter, J. K. and Ghose, S.: Thermal expansion and high-temperture crystal chemistry of the Al2SiO5 polymorphs, Am. Mineral., 64, 573–586, 1979.
Yang, H., Hazen, R. M., Finger, L. W., Prewitt, C. T., and Downs, R. T.: Compressibility and crystal structure of sillimanite, Al2SiO5, at high pressure, Phys. Chem. Miner., 25, 39–47, 1997.


