the Creative Commons Attribution 4.0 License.
the Creative Commons Attribution 4.0 License.
 | 30 Jan 2020
Comment on “Water decreases displacive phase transition temperature in alkali feldspar” by Liu et al. (2018)
Herbert Kroll
Peter Schmid-Beurmann


Anorthoclases, (Na,K)[AlSi3O8] (synonymous with K-analbites), possess a topochemically monoclinic Al,Si distribution, characterized by the order parameter (Harris et al., 1989) where is the Al content of the T1 (T2) tetrahedral site. On short-term heating under dry conditions, anorthoclases undergo – without changing their Al,Si distribution – a displacive phase transition that leads from triclinic () to monoclinic symmetry (C2∕m). The transition temperature drops with increasing K-feldspar (Or) component from about 980 ∘C in pure analbite (Or0) to room temperature at about Or36 (Hovis, 1980, Figs. 2–4; Kroll et al., 1980, Fig. 8; Kroll et al., 1986, Fig. 6; Zhang, 1996, Fig. 14; Hovis et al., 1999, Fig. 6). When the degree of Al,Si order in the topochemically monoclinic state increases, the transition temperature drops to some degree. Consequently, the Or content, at which the transition occurs at room temperature, decreases as well from about Or36 to about Or30 (Hovis, 1980, Fig. 2; Kroll et al., 1980, Fig. 8). So far, apart from the minor influence of Qt, the transition temperature of anorthoclases has been related in the literature to their chemical composition, i.e. their Or–Ab–An content (Kroll and Bambauer, 1981, Fig. 7; Smith and Brown, 1988, Fig. 7.27).
Liu et al. (2018) investigated by in situ X-ray powder diffraction and Raman spectroscopy the transition behaviour of three anorthoclases of similar compositions (Or31–Or33). They found vastly different transition temperatures ranging from 200–300 to 500–600 ∘C. The authors related their findings to the different “water” contents of the samples. This conclusion appears unsound for several reasons.
-
The temperature, Tc, at which the displacive phase transition occurs in binary and ternary feldspars has been determined by many authors (e.g. Laves, 1952; MacKenzie, 1952; Kroll et al., 1980; Hovis, 1980; Kroll and Bambauer, 1981; Harlow, 1982; Salje et al., 1985; Salje, 1986; Zhang et al., 1996; Hovis et al., 1999). The total number of Tc values obtained so far is clearly larger than 50. The samples derive from very different sources: natural anorthoclases, hydrothermally synthesized samples, long-term heated anorthoclases, and samples prepared by ion exchange from heated as well as unheated natural Or and Ab endmembers. Despite of this, the transition temperatures all follow from the Or–Ab–An contents of the samples without significant outliers (compare Zhang et al., 1996, Fig. 14) like the one presented by Liu et al. (2018) for their sample no. 1. This sample deviates from the expected Tc by about 350 ∘C (Fig. 1). The deviation is ascribed by Liu et al. (2018) to its low “water” content, while samples no. 2 and no. 3 which have high “water” contents are in better agreement with Tc expected from their composition.
If the different “water” contents were the reason for the different transition temperatures, then all of the more than 50 samples investigated so far, with Tc values following from their Or–Ab–An contents, would represent a more or less uniform population with high “water” content, and none of the samples would have a low content because then it would stick out with regard to Tc. A uniform population with high contents of “water” is highly unlikely, however, considering that some samples have been hydrothermally synthesized while others have been prepared from natural samples that had previously been dry-heated above 1000 ∘C for weeks, and yet their Tc values are in accord with their Or–Ab–An contents.
-
Table 1 shows the results by Liu et al. (2018). The difference in the “water” content between samples no. 2 and no. 3 is 46 ppm, with no effect on Tc. The difference between no. 3 and no. 1 is 117 ppm, with Tc now increasing by ca. 300 ∘C. It does not appear plausible that a loss of 117 ppm “water” should increase Tc by 300 ∘C while a loss of 46 ppm has no effect. Furthermore, Liu et al. (2018) state that the error associated with the “water” content amounts to 30 %. Then, samples no. 1 and no. 3 agree within 1.5 error limits. All three samples agree within less than 2 mutual error limits.
-
Although a large number of Tc values is available for comparison, Liu et al. (2018) chose only five data (their Fig. 9a): one from an earlier paper of the authors (Yang et al., 2016), one from Salje (1986), and three others from Harlow (1982). Unfortunately, the data of Harlow were adopted from Yang et al. (2016) where they have already been confused. Harlow (1982) investigated three anorthoclases and reported three transition temperatures: 183, 395, and 683 ∘C (his Fig. 2). Rather than quoting these temperatures, Yang et al. (2016) and Liu et al. (2018) preferred 400, 510, and 750 ∘C. These are not the transition temperatures, however, but those temperatures above the transition at which Harlow decided to collect his X-ray intensity data for structure refinements. Consequently, Fig. 9a of Liu et al. (2018) is deteriorated. A corrected version is given in Fig. 1, where two curves have been added to the data points of Liu et al. (2018), which were calculated from Kroll et al. (1980) (the equation is given below their Fig. 8). The curves show the evolution of Tc vs. Or content for samples that were equilibrated at 1050 and 800 ∘C, respectively, with respect to their topochemically monoclinic Al,Si distributions. While the Tc values of the samples no. 2 and no. 3 of Liu et al. (2018) grossly agree with the upper curve, sample no. 1 heavily deviates, contrasting to the misleading Fig. 9a of Liu et al. (2018).
-
The data point of Yang et al. (2016) in Fig. 9a (Liu et al., 2018) poses another problem. It is plotted at Or41 and Tc=200 ∘C. However, even if allowing for a certain An content, anorthoclases with Or41 do not undergo a displacive phase transition at some elevated temperature because they are already monoclinic at room temperature (Kroll and Bambauer, 1981, Fig. 7). On the other hand, the unit cell volume is a good indicator of the Or content of alkali feldspars. Applying the respective equation of Kroll et al. (1986) results in Or19.8, which is dramatically different from Or41 of Yang et al. (2016).
Similarly, calculating the Or content of sample no. 1 of Liu et al. (2018) from cell volume results in Or22.6. This would shift the data point no. 1 from Or31 somewhat closer to the upper Tc curve in Fig. 1. The authors do not comment on the discrepancies of the Or contents.
-
For their sample no. 1, Liu et al. (2018) report values for the unit cell angle γ as a function of temperature. These values are way off any data ever given in the literature for anorthoclases. If one looks up Table 6 of Hovis (1986) or Table 5 of Kroll et al. (1986) (or any other relevant table in the literature, e.g. Zhang et al., 1996) it is obvious that An-poor anorthoclases Or20–30 have γ≈90.1 to 90.2∘ (with very little scatter) rather than (Liu et al., 2018, Table 2). At 100 ∘C their γ still equals 90. 4518(1)∘ (note the tiny standard deviation compared to the first γ value). The authors may want to reconsider the unusual behaviour of the γ angle.
-
In Fig. 6 of Liu et al. (2018) cell edge lengths are plotted versus temperature. The figure raises questions. In the temperature evolution of some cell edges inflection points occur while they are missing in others. For example, a shows inflection points in samples no. 1 and no. 2 but not in no. 3, while b has such points in no. 1 and no. 3 but not in no. 2, c behaves similarly to b. This is a strange result in view of the fact that the three samples have nearly the same composition and undergo the same displacive transition. The authors are encouraged to comment on the inconsistent behaviour of the cell edges.
-
Again, although the samples possess nearly the same composition, the diffractograms shown in Fig. 2a look vastly different. Obviously, at least sample no. 1 suffers from a strong texture effect. Other than for samples no. 2 and no. 3, the intensities of the (0k0) reflections of sample no. 1 are clearly larger than the intensities of the (hkl) reflections. Details on handling texture have not been reported by Liu et al. (2018).
-
Furthermore, obvious indexing errors are apparent in Fig. 2a. In the diffractogram of sample no. 1, the () reflection is located at 23–24∘ 2θ while in reality ∘ (CuKα1) for Or31 (Kroll et al., 1986, Fig. 2). Also, for sample no. 2 a strong reflection is erroneously indexed as (200) while in reality (200) has an intensity close to zero. Further, it is not clear why the reflection which is the strongest reflection in the range is weak in all three diffractograms, in particular that of sample no. 1. All this casts severe doubts on the reliability of the measurement and indexing procedures that the authors have followed.
The authors state that they have employed an average of 40 reflections for the determination of the lattice parameters. In view of the strong and different effects of texture seen in the three diffractograms it is doubtful that the same set of 40 reflections has been used. A careful selection and indexing of reflections is, however, crucial for the determination of reliable lattice parameters of a triclinic material.
-
In order to produce reliable lattice parameters it is highly recommended to use an internal standard to eliminate systematic errors. The authors may want to comment on the correction procedure they have chosen.
Above, we have compared Or contents obtained from electron probe microanalysis and unit cell volume. It may seem conflicting that we question the accuracy of the lattice parameters on the one hand but on the other hand use the cell volume to deduce Or contents. However, erroneous α and γ angles in the range between 90 and 90.5∘ have only a minor effect on the value of V, and erroneous cell edges may compensate to some degree so that V may still provide a rough idea of the Or content. Nevertheless, the Or contents deduced from V must be looked at with reservation. In any case, the great discrepancies between the two Or contents of the critical sample no. 1 of Liu et al. (2018) and of the sample of Yang et al. (2016) need to be clarified.
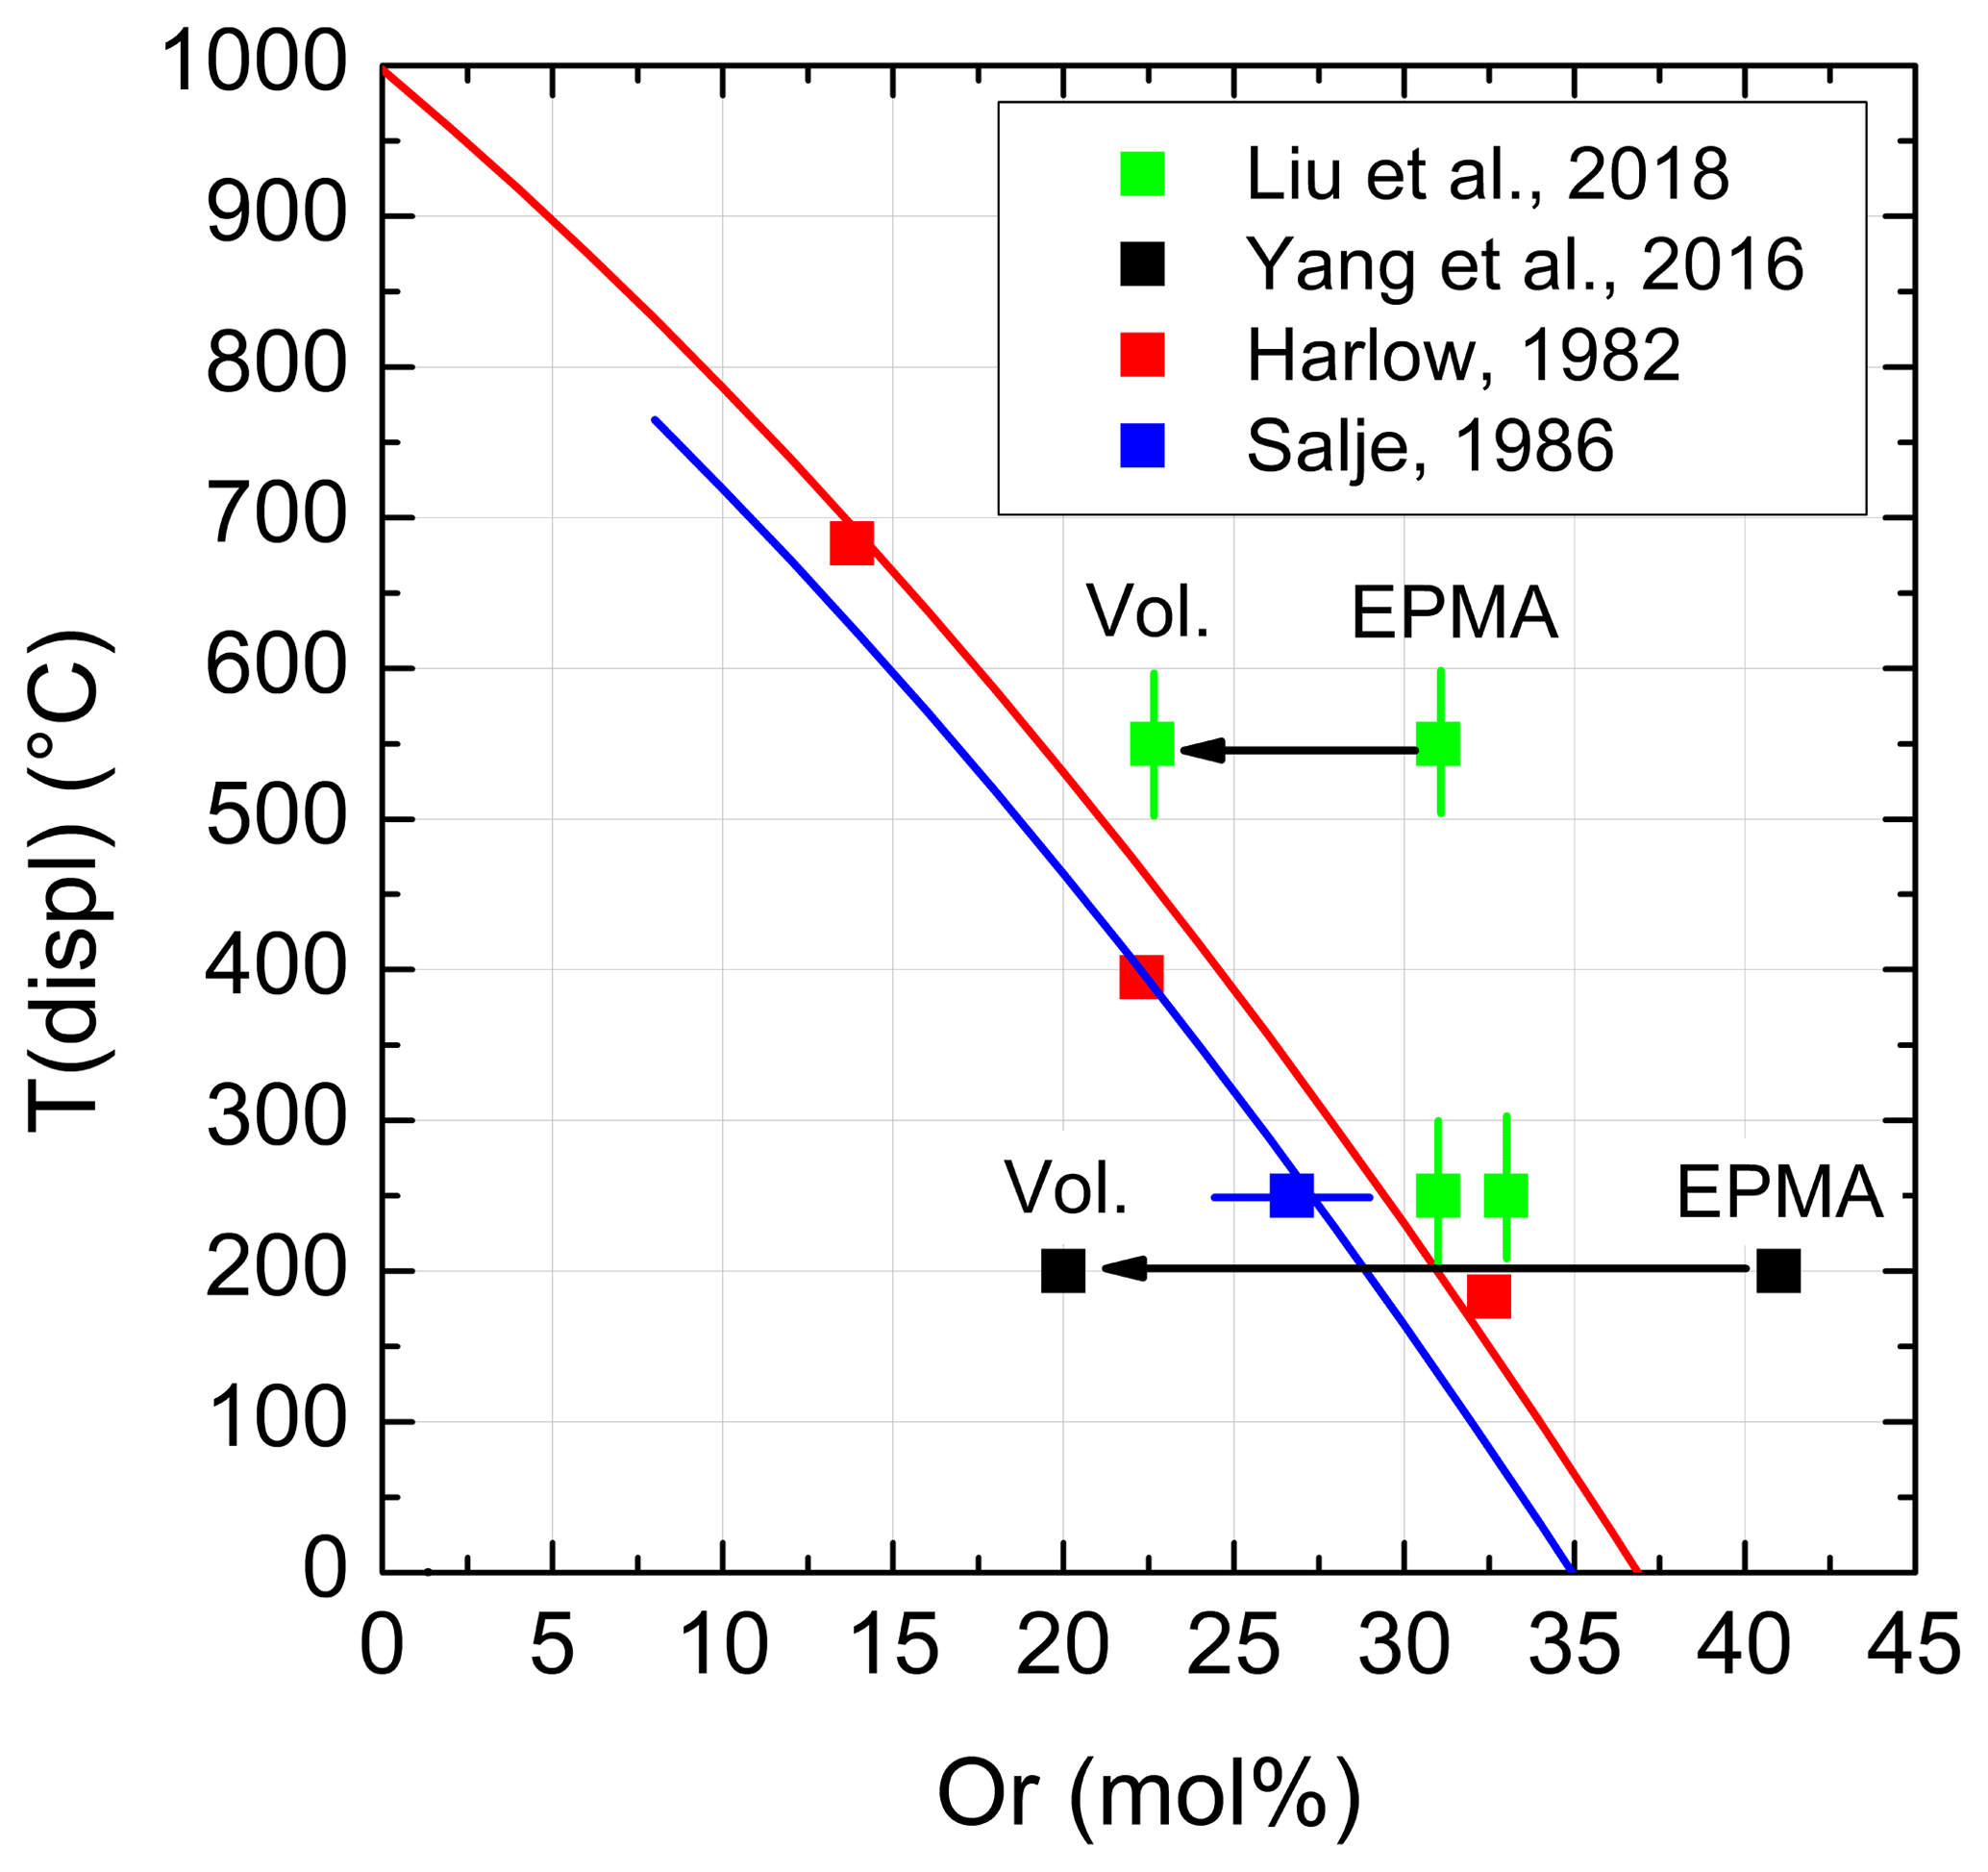
Figure 1Variation with Or content of the temperature of the displacive phase transition in a few anorthoclases. The figure corresponds to Fig. 9a of Liu et al. (2018) but now contains the correct transition temperatures of Harlow (1982). Indicated errors were taken from the literature. Two curves have been added that relate to samples with topochemically monoclinic Al,Si distributions equilibrated at 1050 ∘C (upper curve) and 800 ∘C (lower curve) (Kroll et al., 1980, Fig. 8; also see Zhang et al., 1996, Fig. 14). EPMA and Vol. denote Or contents determined from electron microprobe analysis and unit cell volume, respectively.

The title “Water decreases displacive phase transition temperature in alkali feldspar” does not appear to be appropriate. (1) The authors base their conclusion on the behaviour of one single outlying data point (no. 1) but fail to properly consider the large number of transition temperatures offered in the literature. (2) Except for their own data points, they only plot four other points, three of which are wrongly cited. (3) The cell angles γ of the critical sample no. 1 are far outside accepted ranges. (4) Or contents derived from microprobe analyses and cell volumes differ by as much as 10 to 20 mol %. (5) Cell edge lengths are plotted inconsistently and violate the second-order character of the displacive phase transition. (6) Due to the different texture effects of the samples and the lack of an internal standard, it is doubtful that their determination of lattice parameters led to reliable results. (7) Based on just one outlier in more than 50 data points that were unfortunately ignored, the authors make far-reaching suggestions like “This study may have implications for understanding the seismic discontinuities and heterogeneities in the Earth's crust”. Undoubtedly, it would be interesting to investigate the extent to which the “water” content of nominally dry alkali feldspars is capable of affecting their transition behaviour. Such work, however, should be performed with greater care on a representative number of samples and with proper consideration of the literature.
Commercial software from PTC Inc. (2020) and OriginLab Corporation (2020) has been used for the calculations.
Data were taken from the literature (Kroll et al., 1980; Harlow, 1982; Salje 1986; Yang et al., 2016; Liu et al., 2018).
HK performed the calculations and prepared the manuscript with substantial contributions from the co-author, PSB.
The authors declare that they have no conflict of interest.
The paper has been examined by three independent reviewers and an associate editor. Patrick Cordier as the editor-in-chief added helpful comments. We are grateful to all of them for their effort and their thoughtfulness.
This paper was edited by Patrick Cordier.
Harlow, G. E.: The anorthoclase structures: The effects of temperature and composition, Am. Mineral., 67, 975–996, 1982.
Harris, M. J., Salje, E. K. H., Grittier, B. K., and Carpenter, M. A.: Structural states of natural potassium feldspar: An infrared spectroscopic study. Phys. Chem. Miner., 16, 649–658, 1989.
Hovis, G. L.: Angular relations of alkali feldspar series and the triclinic-monoclinic transformation, Am. Mineral., 65, 770–778, 1980.
Hovis, G. L.: Behavior of alkali feldspars: Crystallographic properties and characterization of composition and Al-Si distribution, Am. Mineral., 71, 869–890, 1986.
Hovis, G. L., Brennan, S., Keohane, M., and Crelling, J.: High-temperature X-ray investigation of sanidine-Analbite solid solutions: thermal Expansion, phase transitions, and volumes of mixing, Can. Mineral., 37, 701–709, 1999.
Kroll, H. and Bambauer, H. U.: Diffusive and displacive transformation in plagioclase and ternary feldspar series, Am. Mineral., 66, 763–769, 1981.
Kroll, H., Bambauer, H. U., and Schirmer, U.: The high albite-monalbite and analbite-monalbite transitions, Am. Mineral., 65, 1192–1211, 1980.
Kroll, H., Schmiemann, I., and von Cölln, G.: Feldspar solid solutions, Am. Mineral., 71, 1–16, 1986.
Laves, F.: Phase relations of the alkali feldspars, I. Introductory remarks, II. The stable and pseudo-stable phase relation in the alkali feldspar system, J. Geol., 60, 436–450 and 549–574, 1952.
Liu, W., Yang, Y., Xia, Q. K., Ye, Y., Wang, Z. P., Zhang, P. P., and Li, G. W.: Water decreases displacive phase transition temperature in alkali feldspar, Eur. J. Mineral., 30, 1071–1081, https://doi.org/10.1127/ejm/2018/0030-2775, 2018.
MacKenzie, W. S.: The effect of temperature on the symmetry of high-temperature soda-rich feldspars, Am. J. Sci., 250A, 319–342, 1952.
OriginLab Corp.: OriginPro 8.1 SR3, One Roundhouse Plaza, Northhampton MA 01060, USA, available at: http://www.OriginLab.com, last access: 23 January 2020.
PTC Inc.: Mathcad-Software 15.0, vs.M050, 140 Kendrick Street, Needham, MA 02494 USA, available at: http://www.ptc.com, last access: 23 January 2020.
Salje, E. H. K., Kuscholke, B., and Kroll, H.: Thermodynamics of sodium feldspar II: Experimental results and numerical solutions, Phys. Chem. Miner., 12, 99–107, 1985.
Salje, E. K. H.: Raman spectroscopic investigation of the order parameter behaviour in hypersolvus alkali feldspar: Displacive phase transition and evidence for Na-K site ordering, Phys. Chem. Miner., 13, 340–346, 1986.
Smith, J. V. and Brown, W. L.: Feldspar minerals: crystal structures, physical, chemical, and microtextural properties, 2nd Edn., Springer-Verlag, Berlin, 1988.
Yang, Y., Wang, Z. P., Tian, Z. Z., Xia, Q. K., and Li, G. W.: High-temperature phase transition and local structure of a hydrous anorthoclase, Phys. Chem. Miner., 43, 111–118, 2016.
Zhang, M., Wruck, B., Graeme Barber, A., Salje, E. K. H., and Carpenter, M. A.: Phonon spectra of alkali feldspars: Phase transitions and solid solutions, Am. Mineral., 81, 92–104, 1996.
watercontent in the nominally dry feldspars has a profound influence on the transformation behaviour. Their arguments, however, are not sound. We point to a number of errors and omissions.