the Creative Commons Attribution 4.0 License.
the Creative Commons Attribution 4.0 License.
 | 07 Jan 2026
Trace element distribution between rhyolitic melts and minerals in highly crystalline assemblages: experimental approach using a quartz trap
Francesco Vetere
Kristina Schimetzek
Maurizio Petrelli
Fleurice Parat
André Stechern
Christian Singer
Francois Holtz
Crystallization experiments of a dacitic composition were conducted in a temperature range of 675–775 °C at 200 MPa in order to determine the evolution of the trace element partitioning between residual melts and coexisting mineral assemblages with ongoing crystallization. The starting composition was doped with ∼100 ppm of a series of incompatible trace elements. The adopted experimental approach consisted of performing two-step experiments. In a first step, long-time crystallization experiments were performed, starting with glass powder to obtain a mineral assemblage in equilibrium with residual melt. The phase assemblage was composed of melt, plagioclase, amphibole, biotite, and a few oxides. Because of the small size of crystal-free melt pools, a separation of glass from minerals was achieved by the use of the mineral grain trap technique in second-step experiments. The melts from first-step experiments were rhyolitic, allowing quartz to be used as a mineral trap.
The following elements were analysed by means of laser ablation inductively coupled plasma mass spectrometry (LA-ICP-MS) analysis: P, Y, Zr, Nb, Cs, Ce, Yb, and U. Although the initial trace element concentrations were low, only Cs and U show a clearly incompatible behaviour, with a systematic enrichment in the melt with decreasing melt fraction from ∼85 area % to 65 area %. We demonstrate that the other elements are controlled either by the crystallization of accessory phases for P (apatite) and Zr (zircon) and/or by their incorporation into mineral phases (mainly amphibole, biotite, and oxide). In particular, changes in the relative proportions of mafic phases vs. plagioclase during ongoing crystallization may lead to changes in bulk mineral melt partition coefficients from >1 to <1. At constant temperature (T), the proportions of mafic phases vs. plagioclase are strongly controlled by water activity, and the meltwater content is therefore a crucial parameter that controls the evolution of trace element concentrations in residual melts. The comparison of our data with published partitioning coefficients is in good agreement for Cs, U, and Y. However, and may be higher than estimated previously for Yb, Ce, and Zr. Nb is less compatible than predicted, with a bulk partitioning value in the range of 1.5 to 2.
- Article
(6285 KB) - Full-text XML
-
Supplement
(825 KB) - BibTeX
- EndNote


Our knowledge of geological processes leading to the differentiation of Earth and other rocky planets is derived from geochemical analyses on trace elements or isotopes in rocks (e.g. Halliday, 2000; Van Orman et al., 2002). One of the crucial tools to trace high-temperature geochemical processes is based on the application of partition coefficients (Kd values) of trace elements between melts and co-existing minerals (Blundy and Wood, 2003). These values are essential for accurately modelling magma differentiation processes, such as partial melting, crystallization and fractionation processes, and magma mixing. Magmatic conditions during differentiation, including temperature, pressure, oxygen fugacity, volatile content, and the crystallization sequence of minerals, can be disentangled by analysing trace elements with different properties (e.g, compatible vs. incompatible). Ultimately, they provide the basis for linking observed mineral and/or melt compositions in volcanic and plutonic rocks to the geological processes that generate and modify silicic magmas.
Trace element distributions between rhyolitic melts and co-existing minerals have previously been constrained from the analysis of glasses and co-existing minerals in volcanic rocks (e.g. Nash and Crecraft, 1985; White et al., 2003; Pichavant et al., 2024). These mineral–melt partition coefficients (Kd values) are widely applied in igneous petrology. However, their validity relies on the assumption that minerals and glass in volcanic samples were in equilibrium at the time of crystallization. Several studies have shown that this assumption is not always valid: natural systems may preserve evidence of both equilibrium and disequilibrium trace element partitioning, and discrepancies have been documented between experimentally derived Kd values and those measured in volcanic rocks for specific elements (e.g. Sr, Ba, REE; Blundy and Wood, 2003; Bindeman et al., 1998). In addition, the existence of long-lived, high-crystallinity magma reservoirs (e.g. Bachmann and Bergantz, 2008; Di Salvo et al., 2020) further complicates the issue as crystal cargos may not always equilibrate with coexisting melts. Therefore, caution is required when applying natural partitioning data to model silicic magma evolution, and targeted experimental studies are essential to evaluate mineral–melt equilibrium under crustal conditions. To avoid this potential problem, trace element distributions between melts and minerals can be determined from experiments in which minerals crystallize at equilibrium conditions from silicate melts (see the review in Nielsen et al., 2017). A large number of crystallization experiments have been performed under conditions of high temperature and pressure by using piston cylinder apparatus (e.g. Klemme et al., 2002; Rubatto and Hermann, 2007). The pressure range investigated with piston cylinders is relevant for conditions in subduction zone environments, but much fewer experimental data are available at the low temperatures and low pressures relevant to conditions prevailing in shallow silicic magma reservoirs. Under these conditions, constraining trace element partitioning in silicic systems at a relatively low temperature is experimentally challenging. Achieving near-equilibrium between melt and minerals requires crystallization from a homogeneous starting melt. In addition, the minerals produced are often too small for reliable analysis by laser ablation inductively coupled plasma mass spectrometry (LA-ICP-MS) or secondary ion mass spectrometry or SIMS (e.g. Rubatto and Hermann, 2007), particularly in runs with high crystallinity. Experiments with strong undercooling result in the formation of large phases (e.g. London and Morgan, 2017). However, this type of experiment may not be ideal for the determination of equilibrium trace element distributions between phases: at high undercooling, nucleation is difficult, and large phases crystallize with a fast growth rate (with sometimes skeletal textures; e.g. Hammer and Rutherford, 2002; Mollard et al., 2012; Giuffrida et al., 2017) so that equilibrium distribution between the solid phases and melt is not guaranteed. Partial-melting experiments usually contain unreacted mineral cores or peritectic phases that may not be in equilibrium with the melt, and the produced melts have heterogeneous distributions of trace elements (e.g. García-Arias et al., 2012; Michaud et al., 2021). As a result, experimental data on trace element concentrations in amphibole and biotite in equilibrium with silicic melts at low temperatures and pressure are scarce.
As discussed in several experimental studies conducted on silicic systems at low temperature, equilibrium-phase assemblages can best be obtained by using powdered glasses as starting materials (e.g. Holtz et al., 1992b; Scaillet et al., 1995). If such glass powder is brought directly to the desired subliquidus experimental temperature, nucleation is enhanced because heterogeneities along the boundaries between the initial glass grains act as seeds for crystals. Because of the strong nucleation, the diffusion distances to be travelled for elements to reach the crystal–melt interface during crystal growth are short, which contributes to the formation of homogeneous near-equilibrium phases. However, the major difficulty lies in analysing these experimental products because the minerals are numerous but small (especially biotite and amphibole; see, for example, typical textures in Scaillet et al. 1995; Da Silva et al., 2017; Li et al., 2018). In addition, due to the near-eutectic compositions of rhyolitic systems, the crystallinity of experimental products is usually high as soon as quartzo-feldspathic phases start to crystallize. Thus, pure-glass pools are only present in small domains, making the glass analysis for trace elements difficult as well. Due to the analytical problems mentioned above, it is difficult to reconstruct accurately the evolution of trace element concentrations in residual silicic melts with ongoing crystallization from experimental products.
This study presents a two-step experimental approach that was applied to determine the equilibrium trace element distribution between silicic melt and the co-existing mineral assemblage. The results are used to evaluate the equilibrium distribution of trace elements in rhyolitic glass and to discuss the partition coefficient determined previously to constrain the evolution of trace element concentrations along the liquid line of descent in highly crystalline magmatic systems. The experimental starting composition was chosen to be representative of the dacite from the Fish Canyon tuff (e.g. Whitney and Stormer, 1985; Lipman et al., 1996; Bachmann et al., 2002). This dacite is interpreted to have formed through the remobilization of a crystal mush, triggered by rejuvenation processes associated with the influx of volatiles into a highly crystalline magma reservoir (Bachmann and Bergantz, 2003).
Table 1Composition of the starting material used for the experiments.
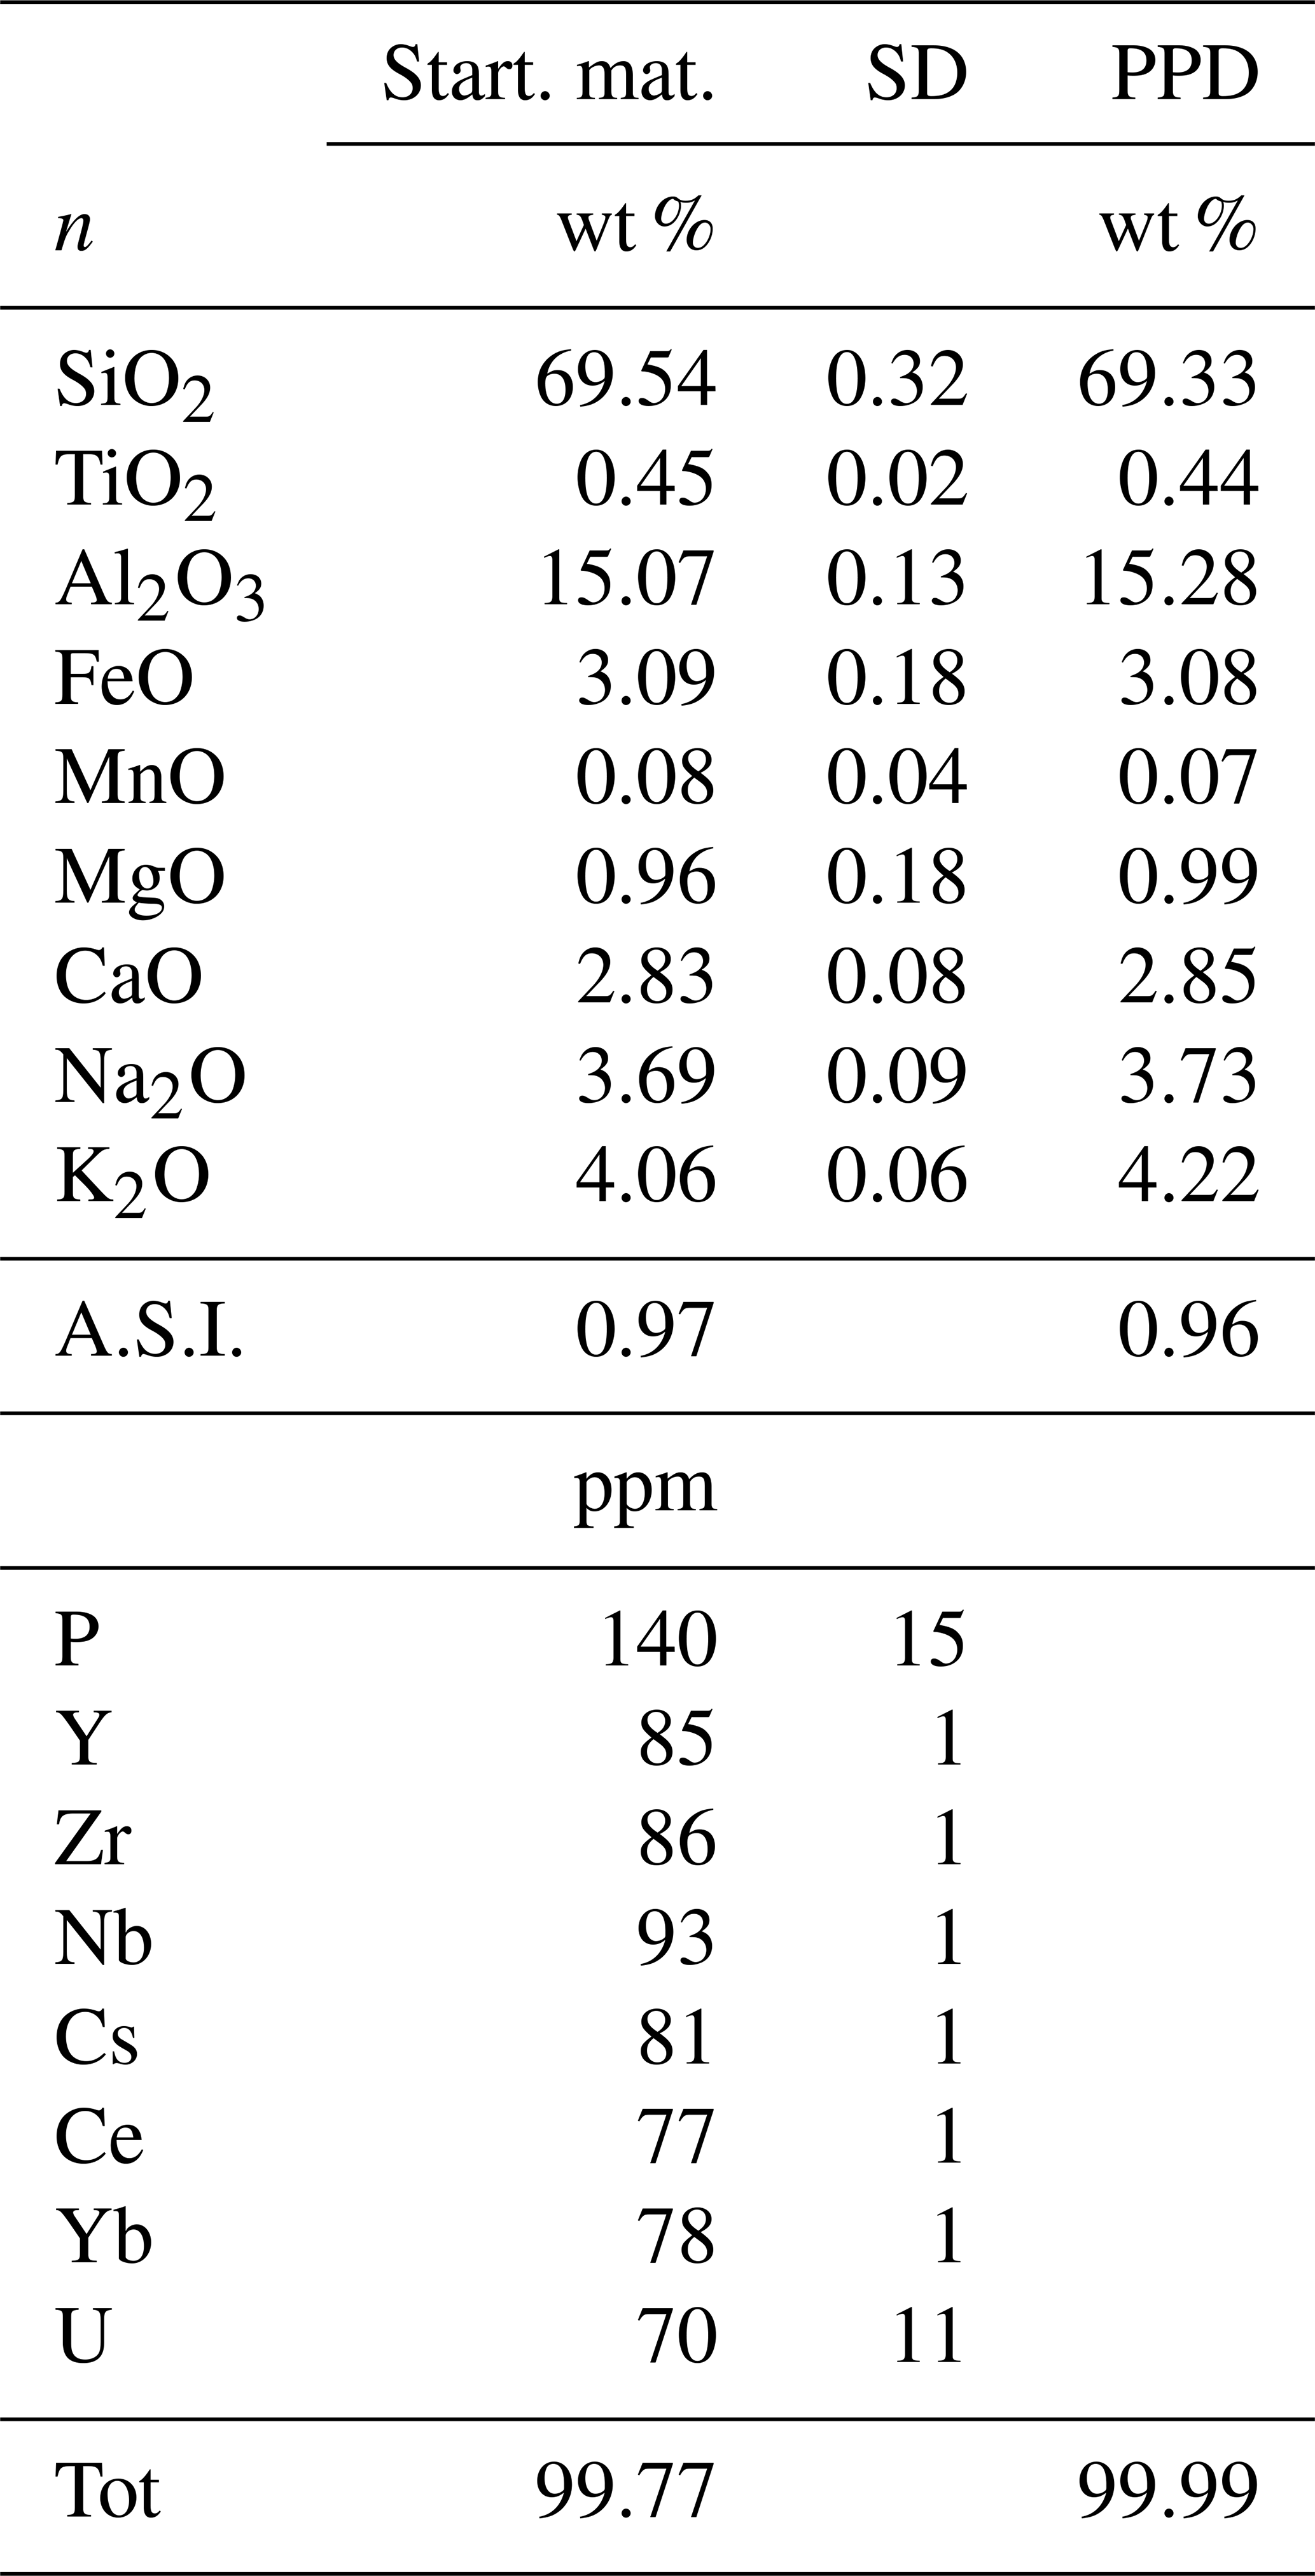
Note that the data are based on the average value of 25 microprobe analyses for major elements and 15 laser ablation analyses for trace elements. The major element composition of the natural reference material is also given (PPD: Pagosa Peak Dacite). A.S.I. refers to the Aluminium Saturation Index, calculated as Al2O3 (CaO + Na2O + K2O) on a molar basis.
2.1 Starting material and experiments
The starting material used for the crystallization experiments was a glass with a major element composition similar to that of the Fish Canyon dacite (Pagosa Peak Dacite reported in Bachmann et al., 2002; see Table 1). Oxides and carbonates were mixed with an agate ball mill and, afterwards, were melted in a platinum crucible at 1600 °C and 1 atm for 3 h.
Fast quenching was performed by inserting the hot crucible directly into a water bath. The obtained glass was crushed to a grain size of <1 mm with a mortar and pestle and then ground to a fine powder (ca. 20–50 µm) by using a rotary mill. Of the total of 100 g of the produced starting glass, 20 g was doped with ca. 100 ppm of P, Y, Zr, Nb, Cs, Ce, Yb, and U. For each element a standard solution with 1000 ppm was used. The glass powder and the trace element solutions were heated in an agate mortar to about 60 °C for 3 d, leading to the evaporation of the solvent. The doped glass was fused again and then was quenched and crushed (to a grain size of <1 mm with a mortar and pestle) three times in a platinum crucible under conditions identical to reported above. Final products were then ground into a fine powder with a rotary mill. As a final step, the powder was mingled in a ball mill for 5 h to ensure as much homogeneity as possible. Small glass chips of the doped starting glass were collected and used for analyses of the starting material. The major element composition and homogeneity of the doped starting material were confirmed by electron probe microanalysis (EPMA) and laser ablation analyses (LA-ICP-MS). The results are displayed in Table 1 and show that the doping procedure was relatively successful as 70 to 93 ppm of each trace element is present in the starting material, except for phosphorus, with 140 ppm.
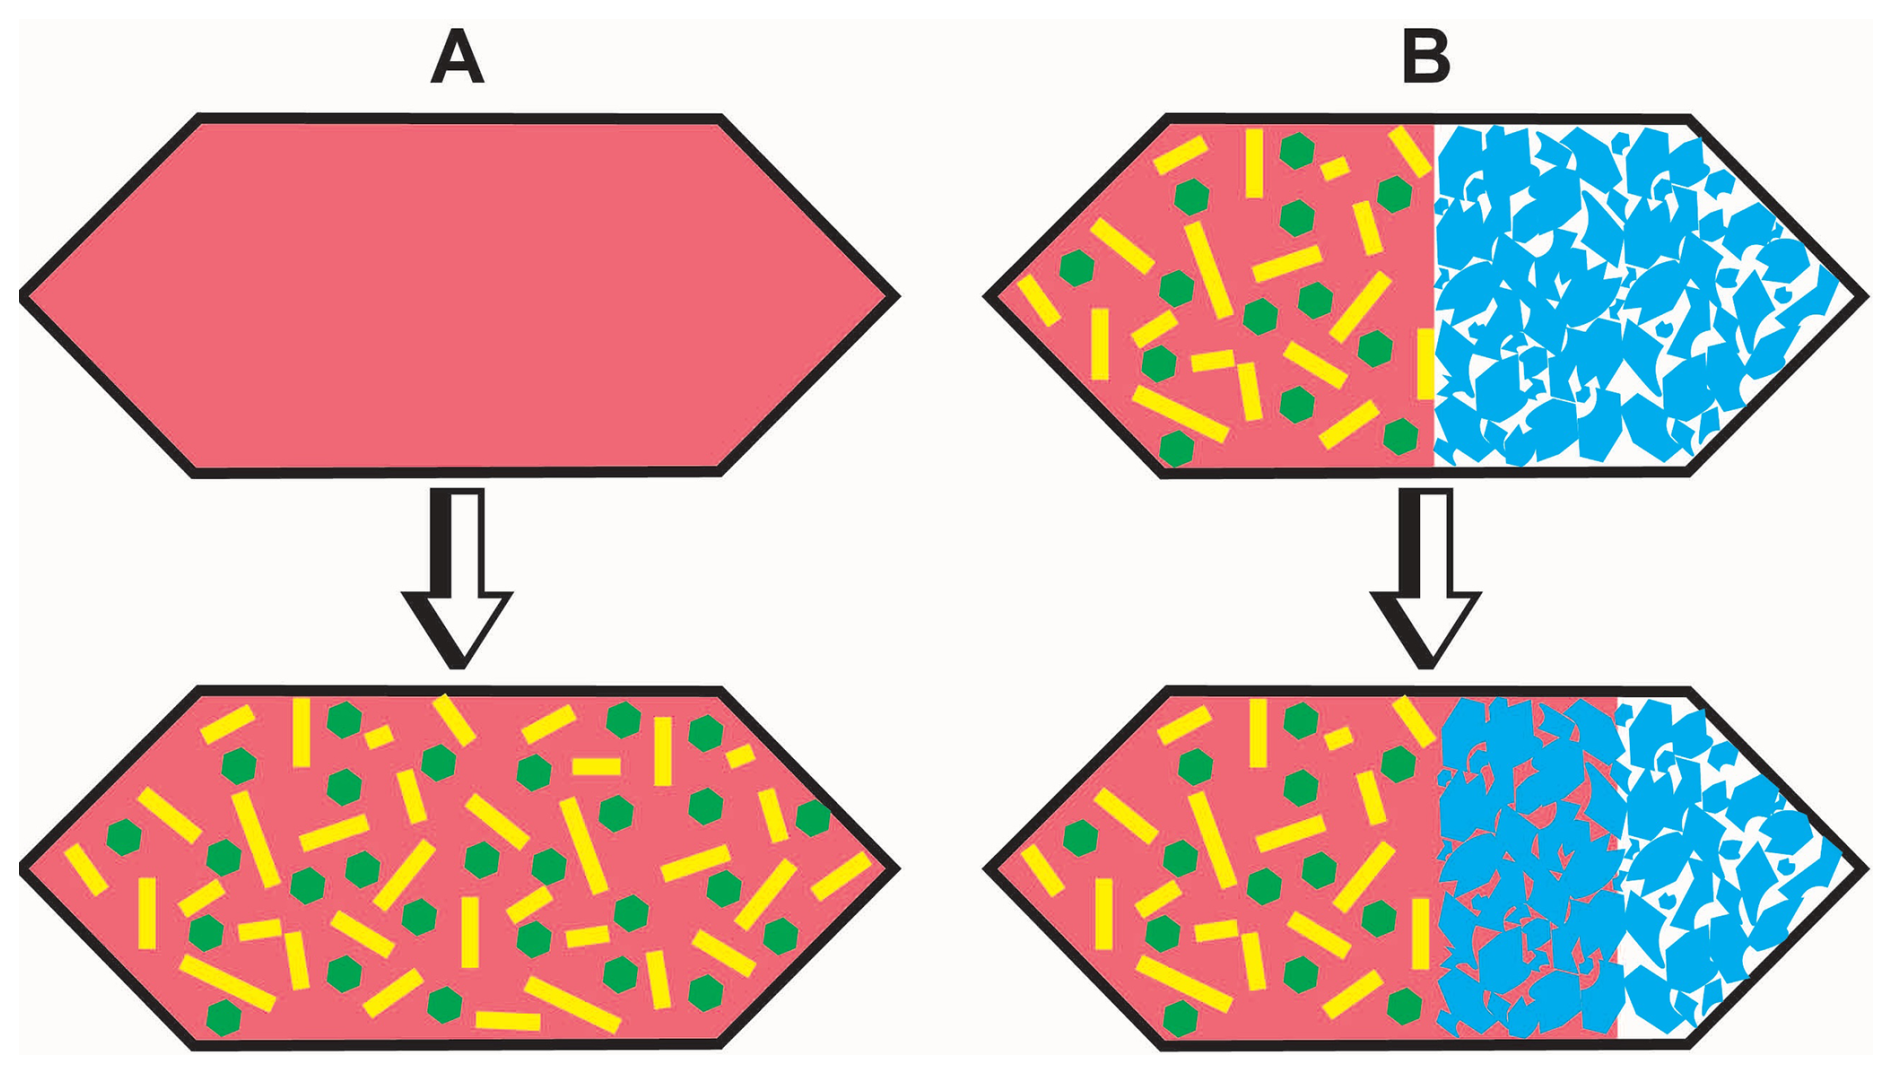
Figure 1(A) Schematic sketch of the first-step experiment. A glass powder is loaded into a capsule, and a partial crystalline sample is produced during the experiment. Reddish colour: glass; green and yellow: minerals. (B) Schematic sketch of the second-step experiment. Part of the product from the first-step experiment is loaded into a capsule also containing the trap material (quartz). During the experiment melt is sucked into cavities of the trap material. Red: glass; green and yellow: minerals; blue: trap material.
2.2 Two-step experimental approach
The analysis of phases synthesized from crystallization experiments is difficult, especially for trace element analyses by LA-ICP-MS, due to small mineral phases and small melt pools. Therefore, we designed a two-step experimental approach in order to have large crystal-free melt pools with sizes ranging between 25 and 50 µm. The first-step experiments consisted of crystallization experiments that produced partly crystallized samples whose residual glasses are in equilibrium with solid phases. In second-step experiments, a separation of glass from minerals was achieved by the use of the mineral grain trap technique (e.g. Kushiro and Hirose, 1992). The experimental products of step 1 were placed together with the mineral grain trap material (for details, see the text below and Fig. 1). During this second step, pore spaces in the trap material were expected to be filled with melt of the partially crystallized sample. Crystals are expected to be hindered from entering the trap so that a filtering of the melt is achieved. This two-step experimental approach is similar to that proposed by Baker and Stolper (1994). The approach consisting of two steps was deemed to be necessary because the time necessary to reach the equilibrium crystal fraction and to homogenize the residual melt with the crystals in terms of trace elements is expected to be much longer than the extraction of the first melts in the mineral grain trap, a problem which may become particularly serious in silicic systems. Thus, placing a mineral trap directly in the first-step experiment could lead to a segregation of melts that are not in equilibrium with the mineral assemblage.
Using a diamond powder trap (e.g. Kushiro and Hirose, 1992; Baker and Stolper, 1994; Stalder et al., 2001; Kessel et al., 2005), experimental studies show that liquids (melt or fluids) produced in partial-melting experiments are pulled between the diamond grains due to the pressure gradient between the sample (at experimental pressure) and the pore space in the diamond. Our tests at 200 MPa were not successful in trapping melts between diamonds, probably because melts were too viscous, and we decided to use other materials. Since trace elements had to be analysed in the interstitial glasses, zircon could not be used because chemical interaction between melt and the zircon minerals of the trap could affect the trace element distribution (Kushiro and Hirose, 1992). Thus, quartz grains with sizes >200 µm (Norwegian Crystallites, Product NC1S 0-150) and with a purity of >99.99 % SiO2 were used as trapping material. Quartz is expected to start dissolving in the interstitial melt during the second-step experiments if the products are not saturated with respect to this phase in the first-step experiments. However, the dissolution of quartz should be moderate (aSiO2 is only slightly <1) considering the low temperatures of the experiments and the silica-rich system that is investigated (see the discussion below). Figure 1 shows a schematic sketch of the experimental approach with the two experimental steps.
For the first step, Au metal tubing with an inner diameter of 4.0 mm, an outer diameter of 4.4 mm, and a length of 20 mm was used as the capsule material. Au tubes were welded onto one end and loaded with ∼150 mg doped glass powder with the addition of 7 wt % (∼10.5 mg) of deionized water in order to achieve water-saturated conditions (at 200 MPa, water-saturated conditions should be achieved by adding ∼6 wt % H2O according to Holtz et al., 1992a). For the second step, we used an Au metal tube with an inner diameter of 2.8 mm, an outer diameter of 3.2 mm, and a length of 20 mm. Approximately 20 mg of partly crystallized material, derived from the first-step experiment, was loaded into the Au capsules. The partially crystallized powered material was compressed into the capsules by using a brass rod in order to obtain a flat surface, on top of which the trap material (∼50–60 mg) was loaded and compressed. Approximately 1 mg of deionized water was added with a syringe to ensure water saturation, as for the first-step experiment. The experiments were performed at 200 MPa and temperatures of 775, 725, and 675 °C.
Temperature (T) cycling was performed following the procedure described by Mills et al. (2011) and Mills and Glazner (2013) in order to enlarge as much as possible the size of crystals and melt pools. Cycling was applied during the first 8 to 10 d. In the experiments at 725 and 675 °C, maximum temperature variations were 15 °C above (T+15 °C) and 15 °C below (T−15 °C) the target temperature. At 775 °C, T was cycled with 25 °C above (T+25 °C) and 5 °C below (T−5 °C) the experimental target T, following the procedure applied by Erdmann and Koepke (2016). In both cases, the applied period of the cycling was 4 h (Table S1 in the Supplement). The transition between the high-temperature plateau (∼2 h) and the low-temperature (∼2 h) plateau was achieved within ∼5 min. After cycling, the temperature was then held constant to reach a total run duration of 28 to 31 d to ensure near-equilibrium conditions (Table S1).
The second-step experiments were much shorter. Durations of 3, 9, 24, and 48 h were tested to check to which extent an interaction of partly crystallized material with the trap material (dissolution of the quartz trap in the melt) did occur. The second-step experiments conducted for 24 h were duplicated so that two experimental capsules containing a fragment of the first-step experiment and the quartz trap were loaded next to each other in the same cold-seal pressure vessel. These 24 h experiments were subsequently used for trace element analysis.
2.3 Experimental apparatus
All experiments were conducted at the Institut für Erdsystemwissenschaften (Leibniz Universität Hannover) in externally heated horizontal cold-seal pressure vessels (CSPVs) pressurized with water. The samples were placed at the end of a drill hole of 22 cm length (diameter of 0.6 cm) in the autoclave. The remaining space of the autoclave was filled with Ni rods. The oxygen fugacity in the capsule is buffered by the nickel nickel oxide assemblage because the autoclave is made mainly of an Ni-rich alloy in addition to the Ni filler rods. A K-type thermocouple is placed into a hole at the end of the autoclave, and the tip of it sits close to the sample. An external furnace is pulled over the autoclave. At the end of the experiments, isobaric quenching was performed by using a flux of compressed air to cool the autoclave.
After quenching, capsules were pinched and soaked in epoxy in order to immobilize the loose-trap material grains and then were cut into halves along the longitudinal axis and, finally, were embedded in 1 in. round epoxy mounts and polished. Since the addition of copper powder into the epoxy mounts reduces problems with electronic charge during electron probe micro analysis (EPMA), we adopted this methodology.
3.1 Electron probe micro analyses (EPMAs)
Major elements in glasses and minerals (including P) were analysed by means of EPMA. Analyses were performed using a Cameca SX 100 at the Institut für Erdsystemwissenschaften (Leibniz Universität Hannover). All analyses were performed at 15 keV acceleration voltage. Major element analyses of minerals were performed with a focused beam, a beam current of 15 nA, and 10 s counting time for all elements. A defocused beam of 5 µm with a beam current of 4 nA was used for small “glass pools”, and a defocused beam of 10 µm with a beam current of 10 nA was used for larger “glass pools” and for the starting glass. The counting times for all major elements were 10 s. Phosphorus was analysed at the end of all analyses by using a beam current of 60 nA and 30 s counting times. Matrix corrections are made with Pouchou and Pichoir's (1991) PAP model. The rhyolitic glass standard material VG-568 of the Smithsonian National Museum of Natural History was used as the internal standard (see Jarosewich et al., 1980).
3.2 Laser ablation inductively coupled plasma mass spectroscopy (LA-ICP-MS)
Trace element analyses were performed using LA-ICP-MS. Analyses of trace element concentrations in glasses were performed in two different laboratories. A Finnigan Element 2 LA-ICP-MS operated with the software “GEOLAS Plus” was used at the OSU-OREME platform (University of Montpellier, France). The laser beam size was 26 and 51 µm. A laser repetition rate of 7 Hz and a laser power of 12 J cm−2 were chosen. A total of 420 pulses of the laser (1 min) were used for ablating the sample after 2 min of background measurement. The glasses NIST612 and BIR-1 were used as the external standards. Al2O3 and CaO determined by means of EPMA were used as the internal standard. For data processing, the software “Glitter” was used (Griffin et al., 2008). With visualization of the signal intensity versus time, a precise selection of blanks and signals can be performed. The drift is compensated for by internal standard calculations using Glitter.
A Teledyne Photon Machine G2 laser ablation apparatus coupled to a Thermo iCAP-Q ICP-MS was used at the Department of Physics and Geology (University of Perugia, Italy). The analyses were performed on single spots of 25 µm. Data were collected for P, Y, Zr, Nb, Cs, Ce, Yb, and U with a repetition rate and laser power of 8 Hz and 4 J cm−2, respectively. The NIST 610 reference material, Si concentrations determined by means of EPMA, and USGS BCR2G glass were used as the calibration standard, internal standard, and quality control, respectively. Data reduction was carried out using the Iolite v.3 software package (Paton et al., 2011). Under the reported analytical conditions, precision and accuracy are typically better than 10 % (Petrelli et al., 2016a, b).
3.3 Phase proportions
Back-scattered electron (BSE) images were collected at the Bundesanstalt für Geowissenschaften und Rohstoffe (BGR, Hanover) to approach phase proportion via image analysis techniques. A scanning electron microscope (SEM) with a mineral liberation analyser (MLA) was used to characterize the first-step experimental run products. Image analysis was performed by using the “ImageJ” software on BSE images collected with the SEM. For all experiments, between 15 and 50 images were used in order to provide statistically relevant data. For each sample, an area of ca. 800 µm2 was analysed in order to quantify phase proportions. Finally, mass balance calculations were also performed using major element concentrations, as well as trace element concentrations.

Figure 2Back-scattered electron images of experimental products over the investigated temperature range (675–775 °C). Mineral abbreviations: Amp: amphibole; Bt: biotite; Mag: magnetite; Plg: plagioclase. The scale bar is 50 µm. Note that the melt fraction increases with increasing temperature, as expected.
4.1 Phase assemblage and textures
The phase assemblage in the experimental products consists of glass, plagioclase, magnetite, amphibole, and biotite. Figure 2 shows representative BSE images of the experimental products. As expected, the melt fraction and the size of the solid phases are larger in the high-temperature run, probably as a result of increasing undercooling (see also Stechern et al., 2024). Biotite is observed in the whole T range, but at 775 °C, biotite was concentrated only in one region where relatively large (10–20 µm) biotite crystals were present. Such a heterogeneous distribution of relatively large biotite crystals was also observed by Puziewicz and Johannes (1988), who suggested that the larger biotite crystals could possibly precipitate from the vapour phase. The results also show that, in our experimental T range, quartz and sanidine are not stable under water-saturated conditions in the Fish Canyon Tuff natural dacite composition, confirming the findings of Johnson and Rutherford (1989) and Da Silva et al. (2017), who used very similar starting melt compositions. The absence of quartz and alkali feldspar at the lowest temperature of 675 °C indicates that both phases start to crystallize close to solidus temperatures at 200 MPa and nearly water-saturated conditions for the investigated composition. They also suggest that the water-saturated solidus curve of natural multicomponent systems may be slightly lower than that classically assumed for the synthetic haplogranite system (Johannes and Holtz, 1996).
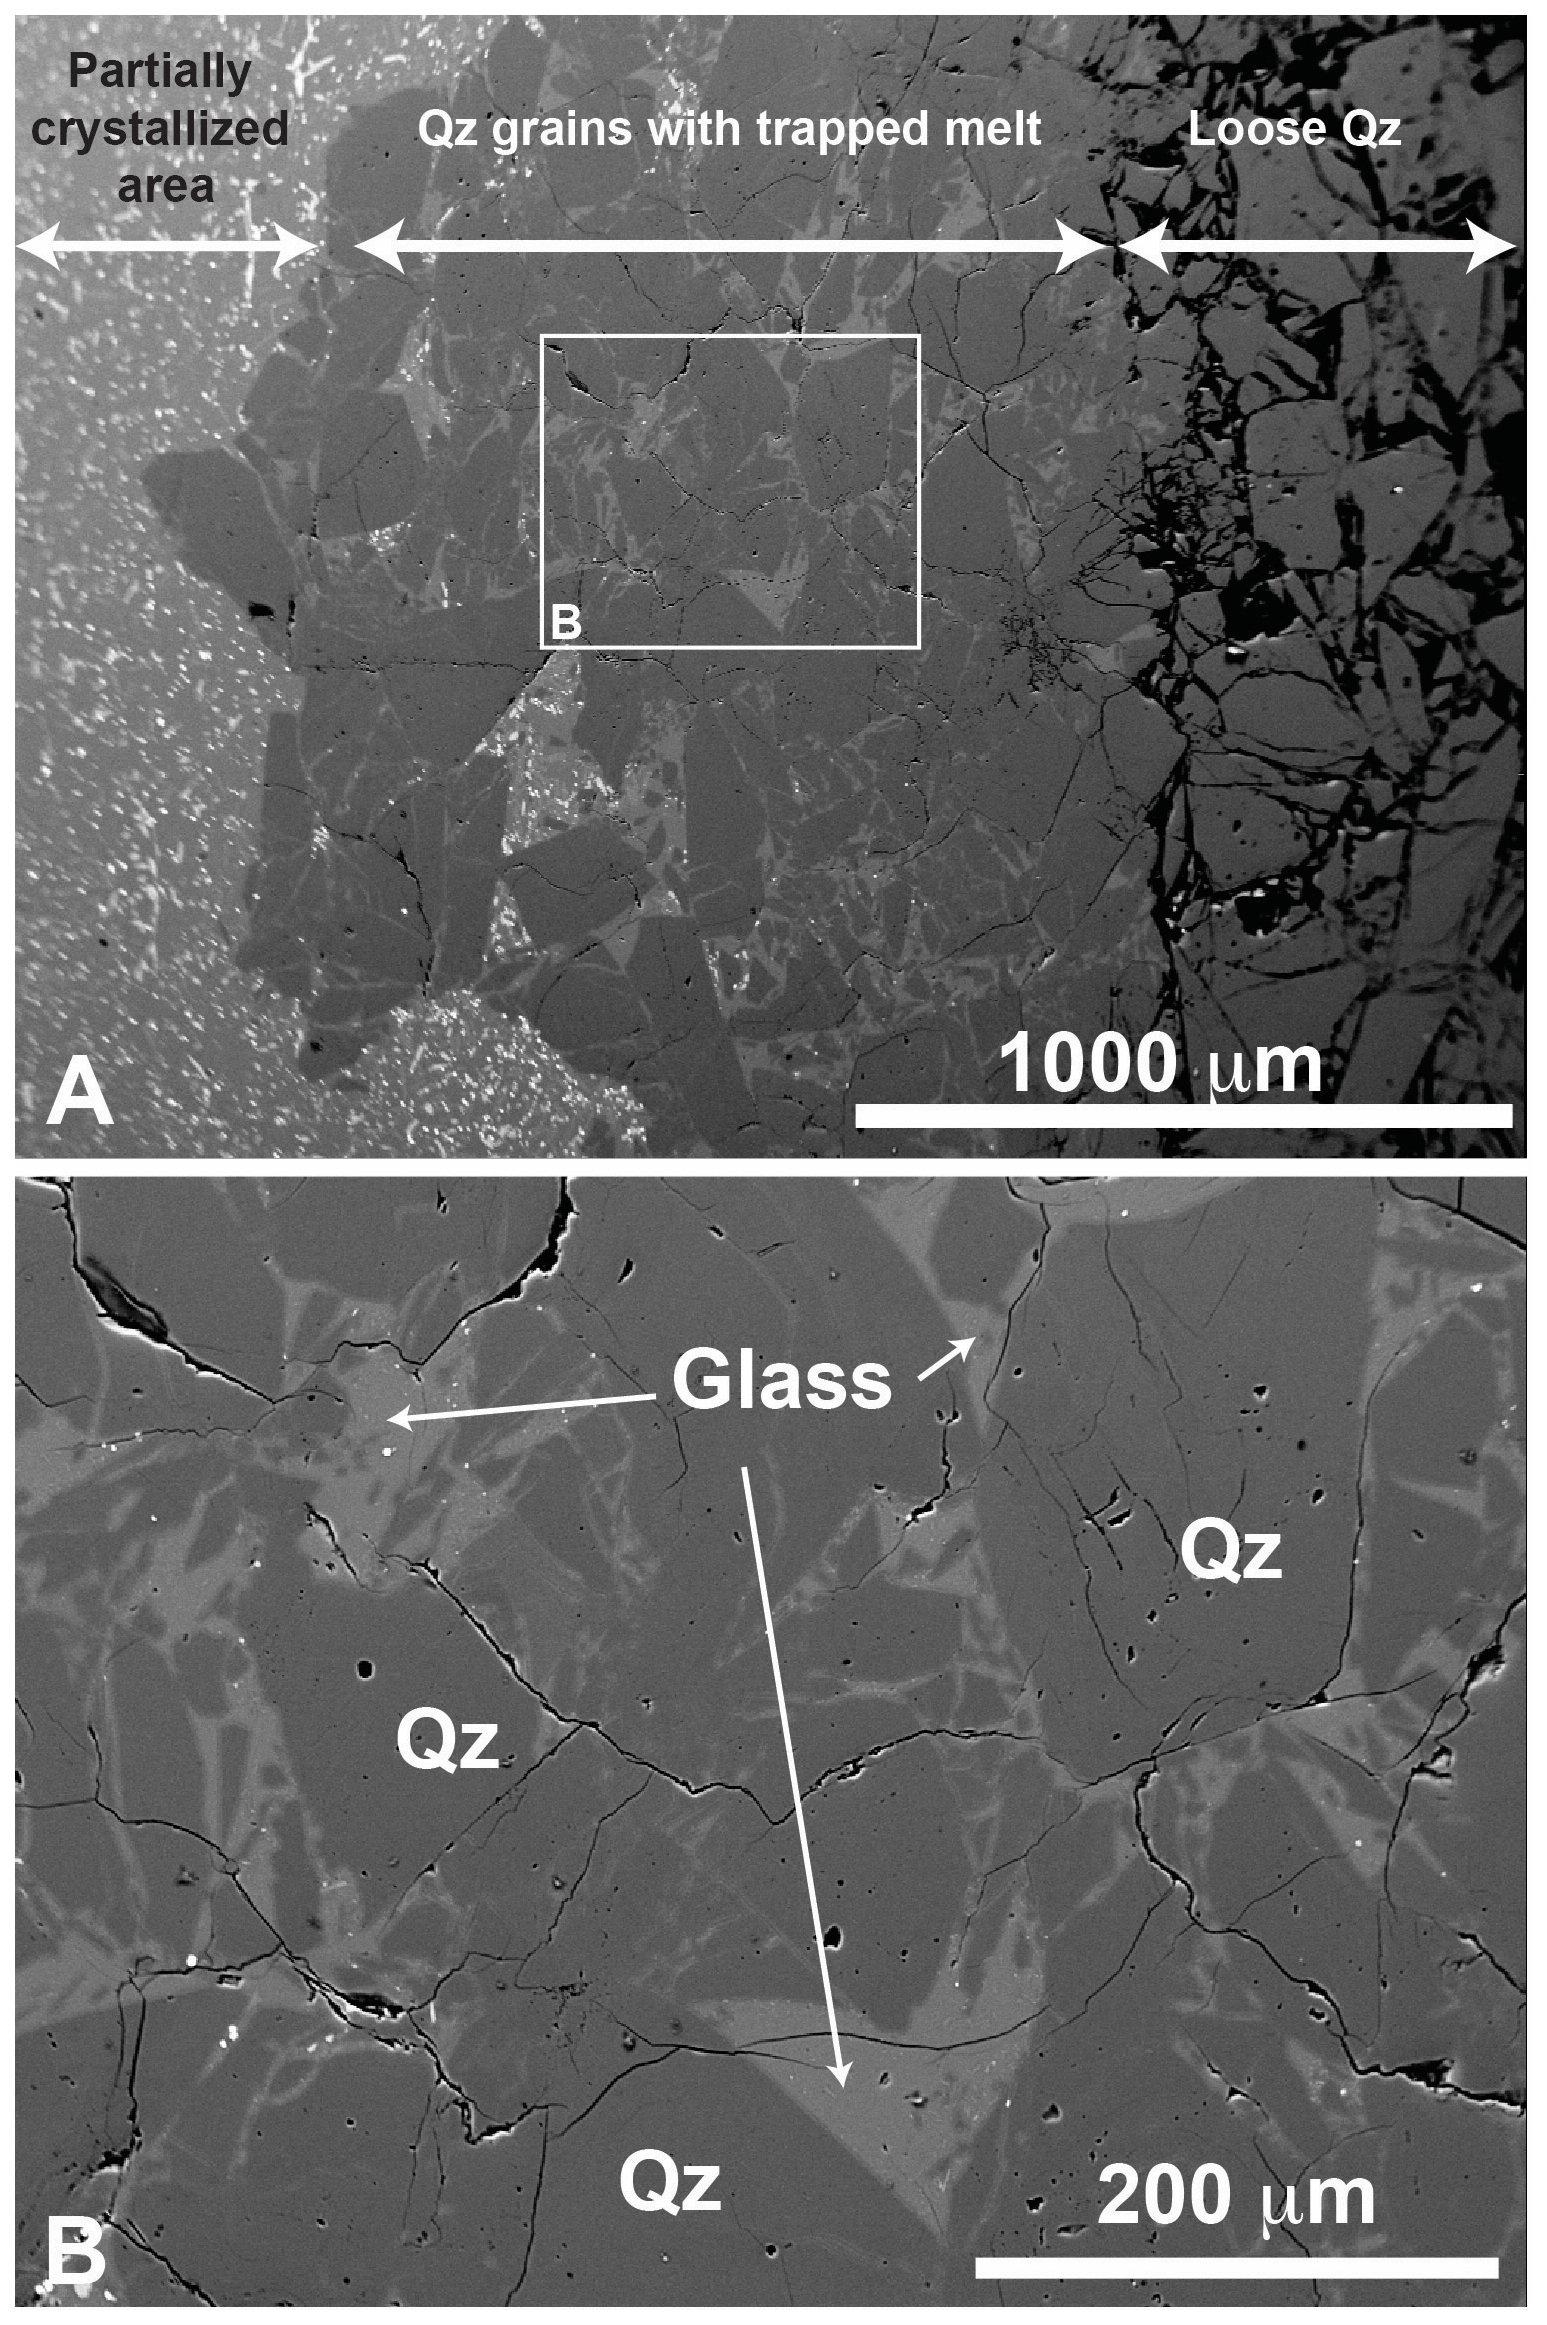
Figure 3(A) BSE images of the quartz (Qz) trap in the 775 °C experiment. The partially crystallized assemblage from the first-step experiment can be observed on the left side of panel (A), and quartz grains are on the right side. Part of the cavities between the quartz grains is filled with glass. A detail of the area in the white rectangle in panel (A) is displayed in panel (B), highlighting the successful trapping of melt domains without crystals.
The typical texture of the crystal-free melt pools within quartz traps (second-step experiments) is shown in Fig. 3. The size of melt pools in quartz cavities can reach several tens of µm. The higher the temperature, the higher the melt ability to flow and the deeper the melt permeation. In order to test the effect of the run duration on the pore space filling in the trap, the second-step experiments were conducted with different run durations (3, 9, 24, and 48 h). No significant effect of run duration could be observed, indicating that the transport of the melt between quartz grains occurs in the very first stages of the experiment. For consistency, only second-step experimental products after a 24 h run duration were used for the trace element analysis of run products.
4.2 Composition of phases
Being relatively large, melt pools from the first-step experimental products obtained at 775 and 725 °C can be analysed by means of EPMA using 10 µm beam size. For the experiment at 675 °C, the beam size had to be reduced to 5 µm. Due to the relatively larger size of the crystals, we were able to analyse all solid phases in the 775 °C experimental products. At lower temperatures, the crystallinity was higher, and the mineral phases were smaller (see Fig. 2) so that only plagioclase and a few oxides were analysed accurately in the 725 °C experimental products. For the experimental products obtained at 675 °C, it was difficult to obtain EPMA analyses of pure mineral phases without an overlap with glass.
Table 2Composition of the glasses (wt %) in first-step experiments.
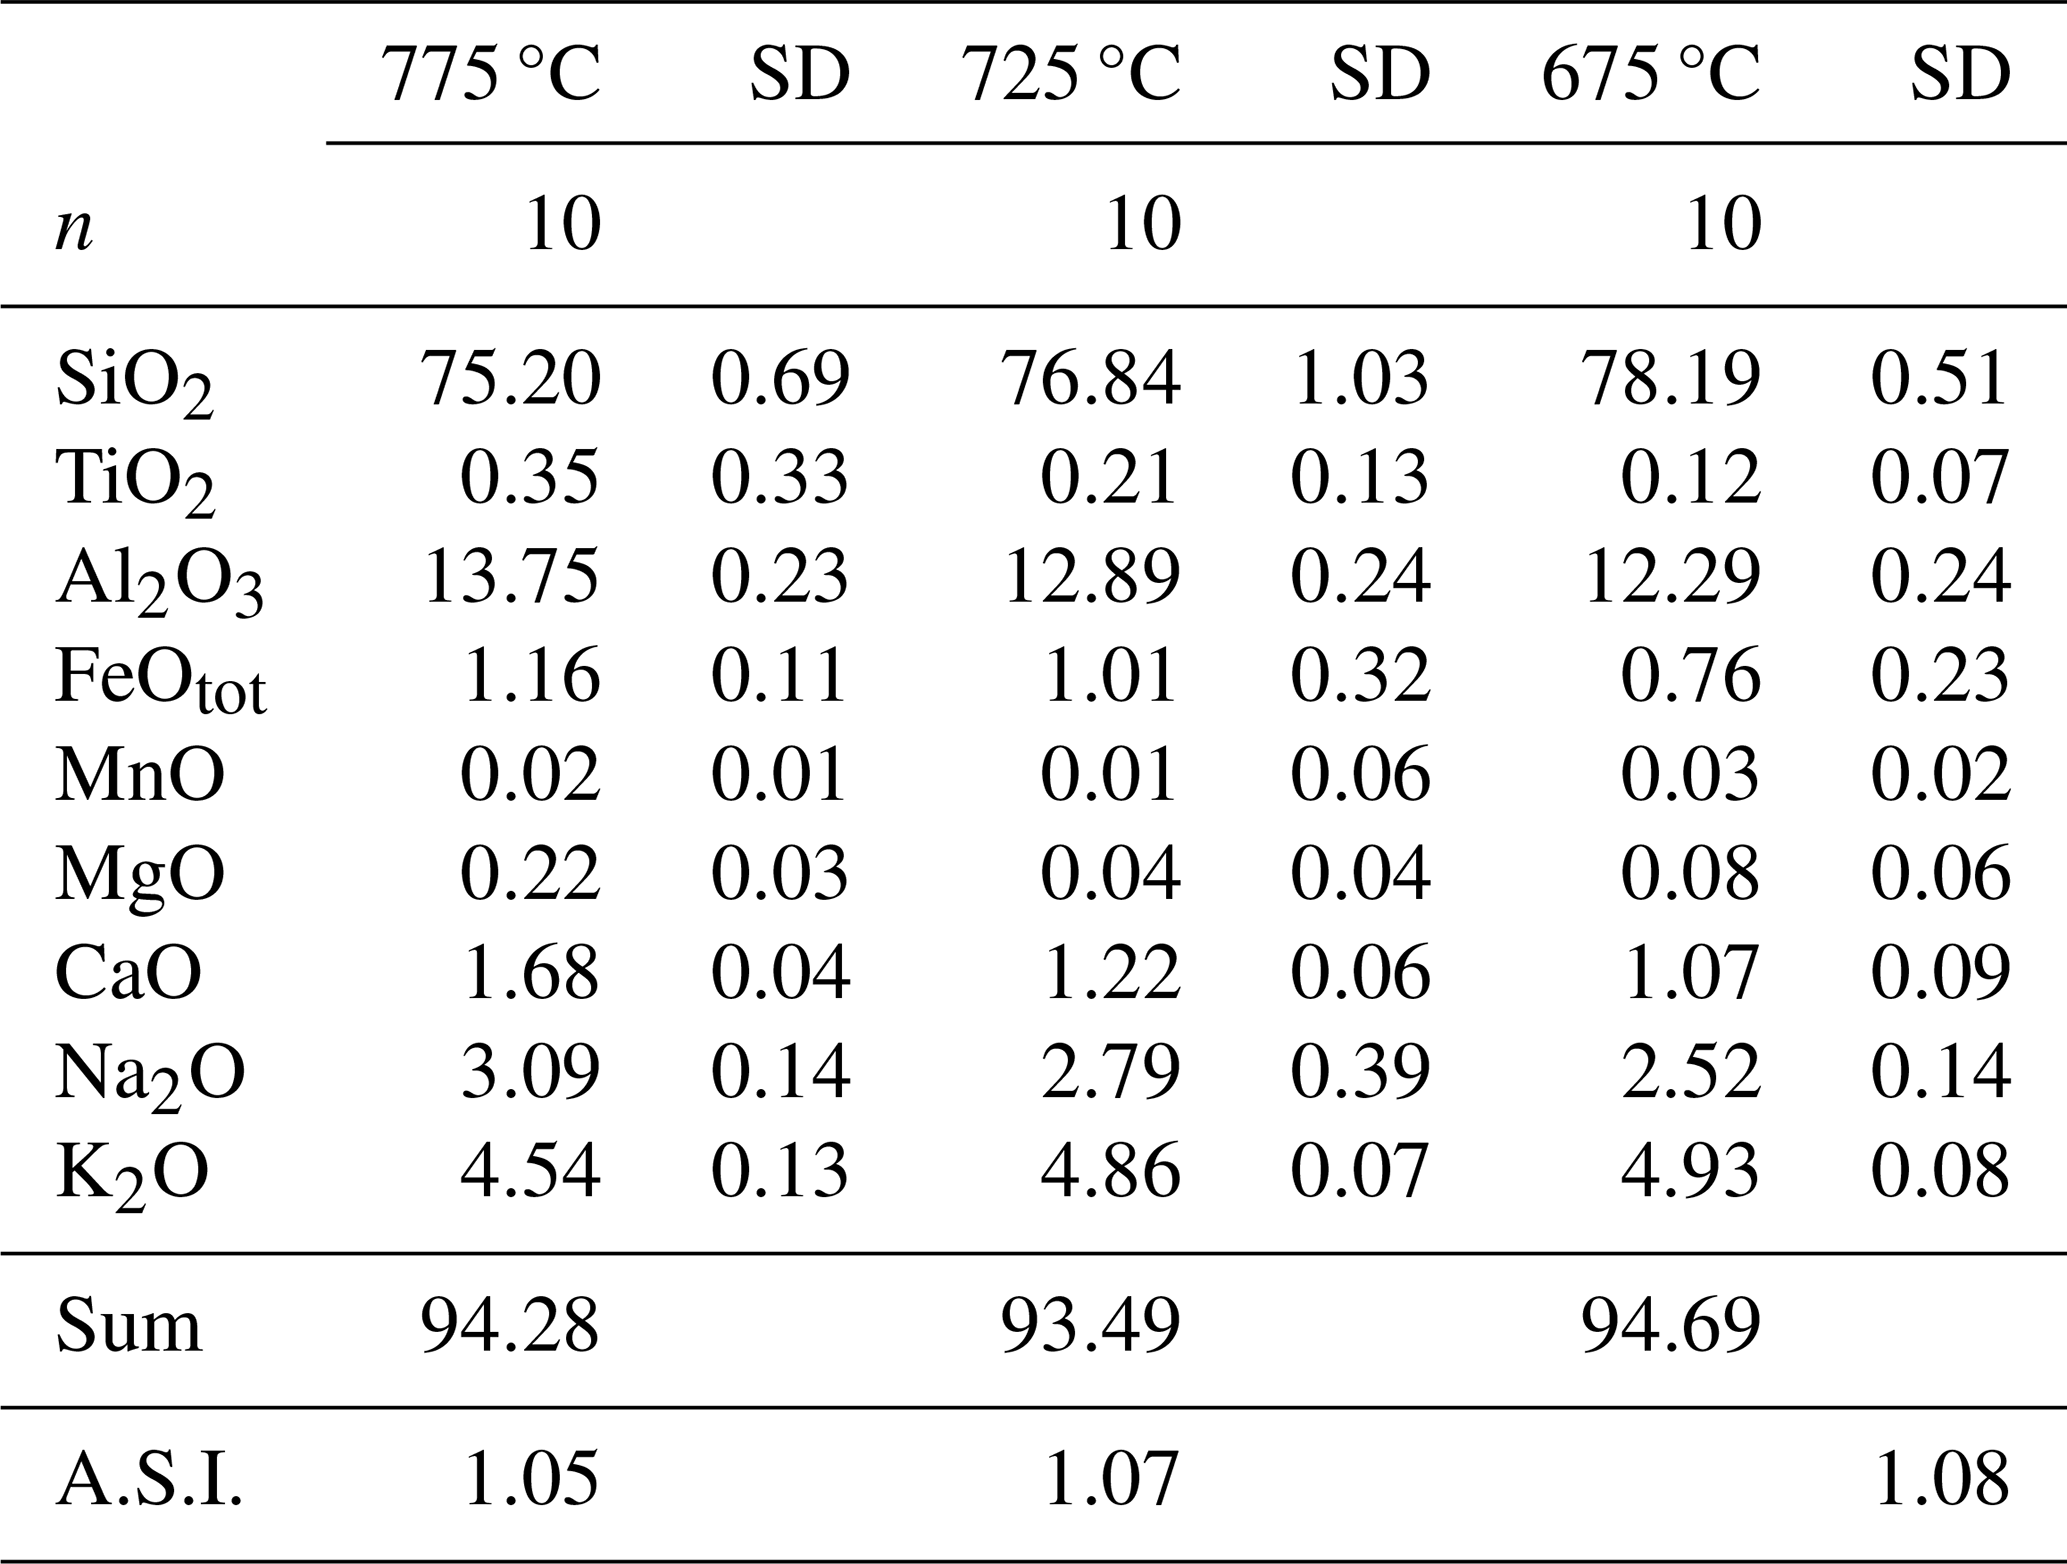
Note that the data are normalized to 100 %. “Sum” refers to the total prior to normalization. “n” refers to number of analyses. “SD” refers to 1 sigma standard deviation. A.S.I. refers to the Aluminium Saturation Index, calculated as Al2O3 (CaO + Na2O + K2O) on a molar basis.
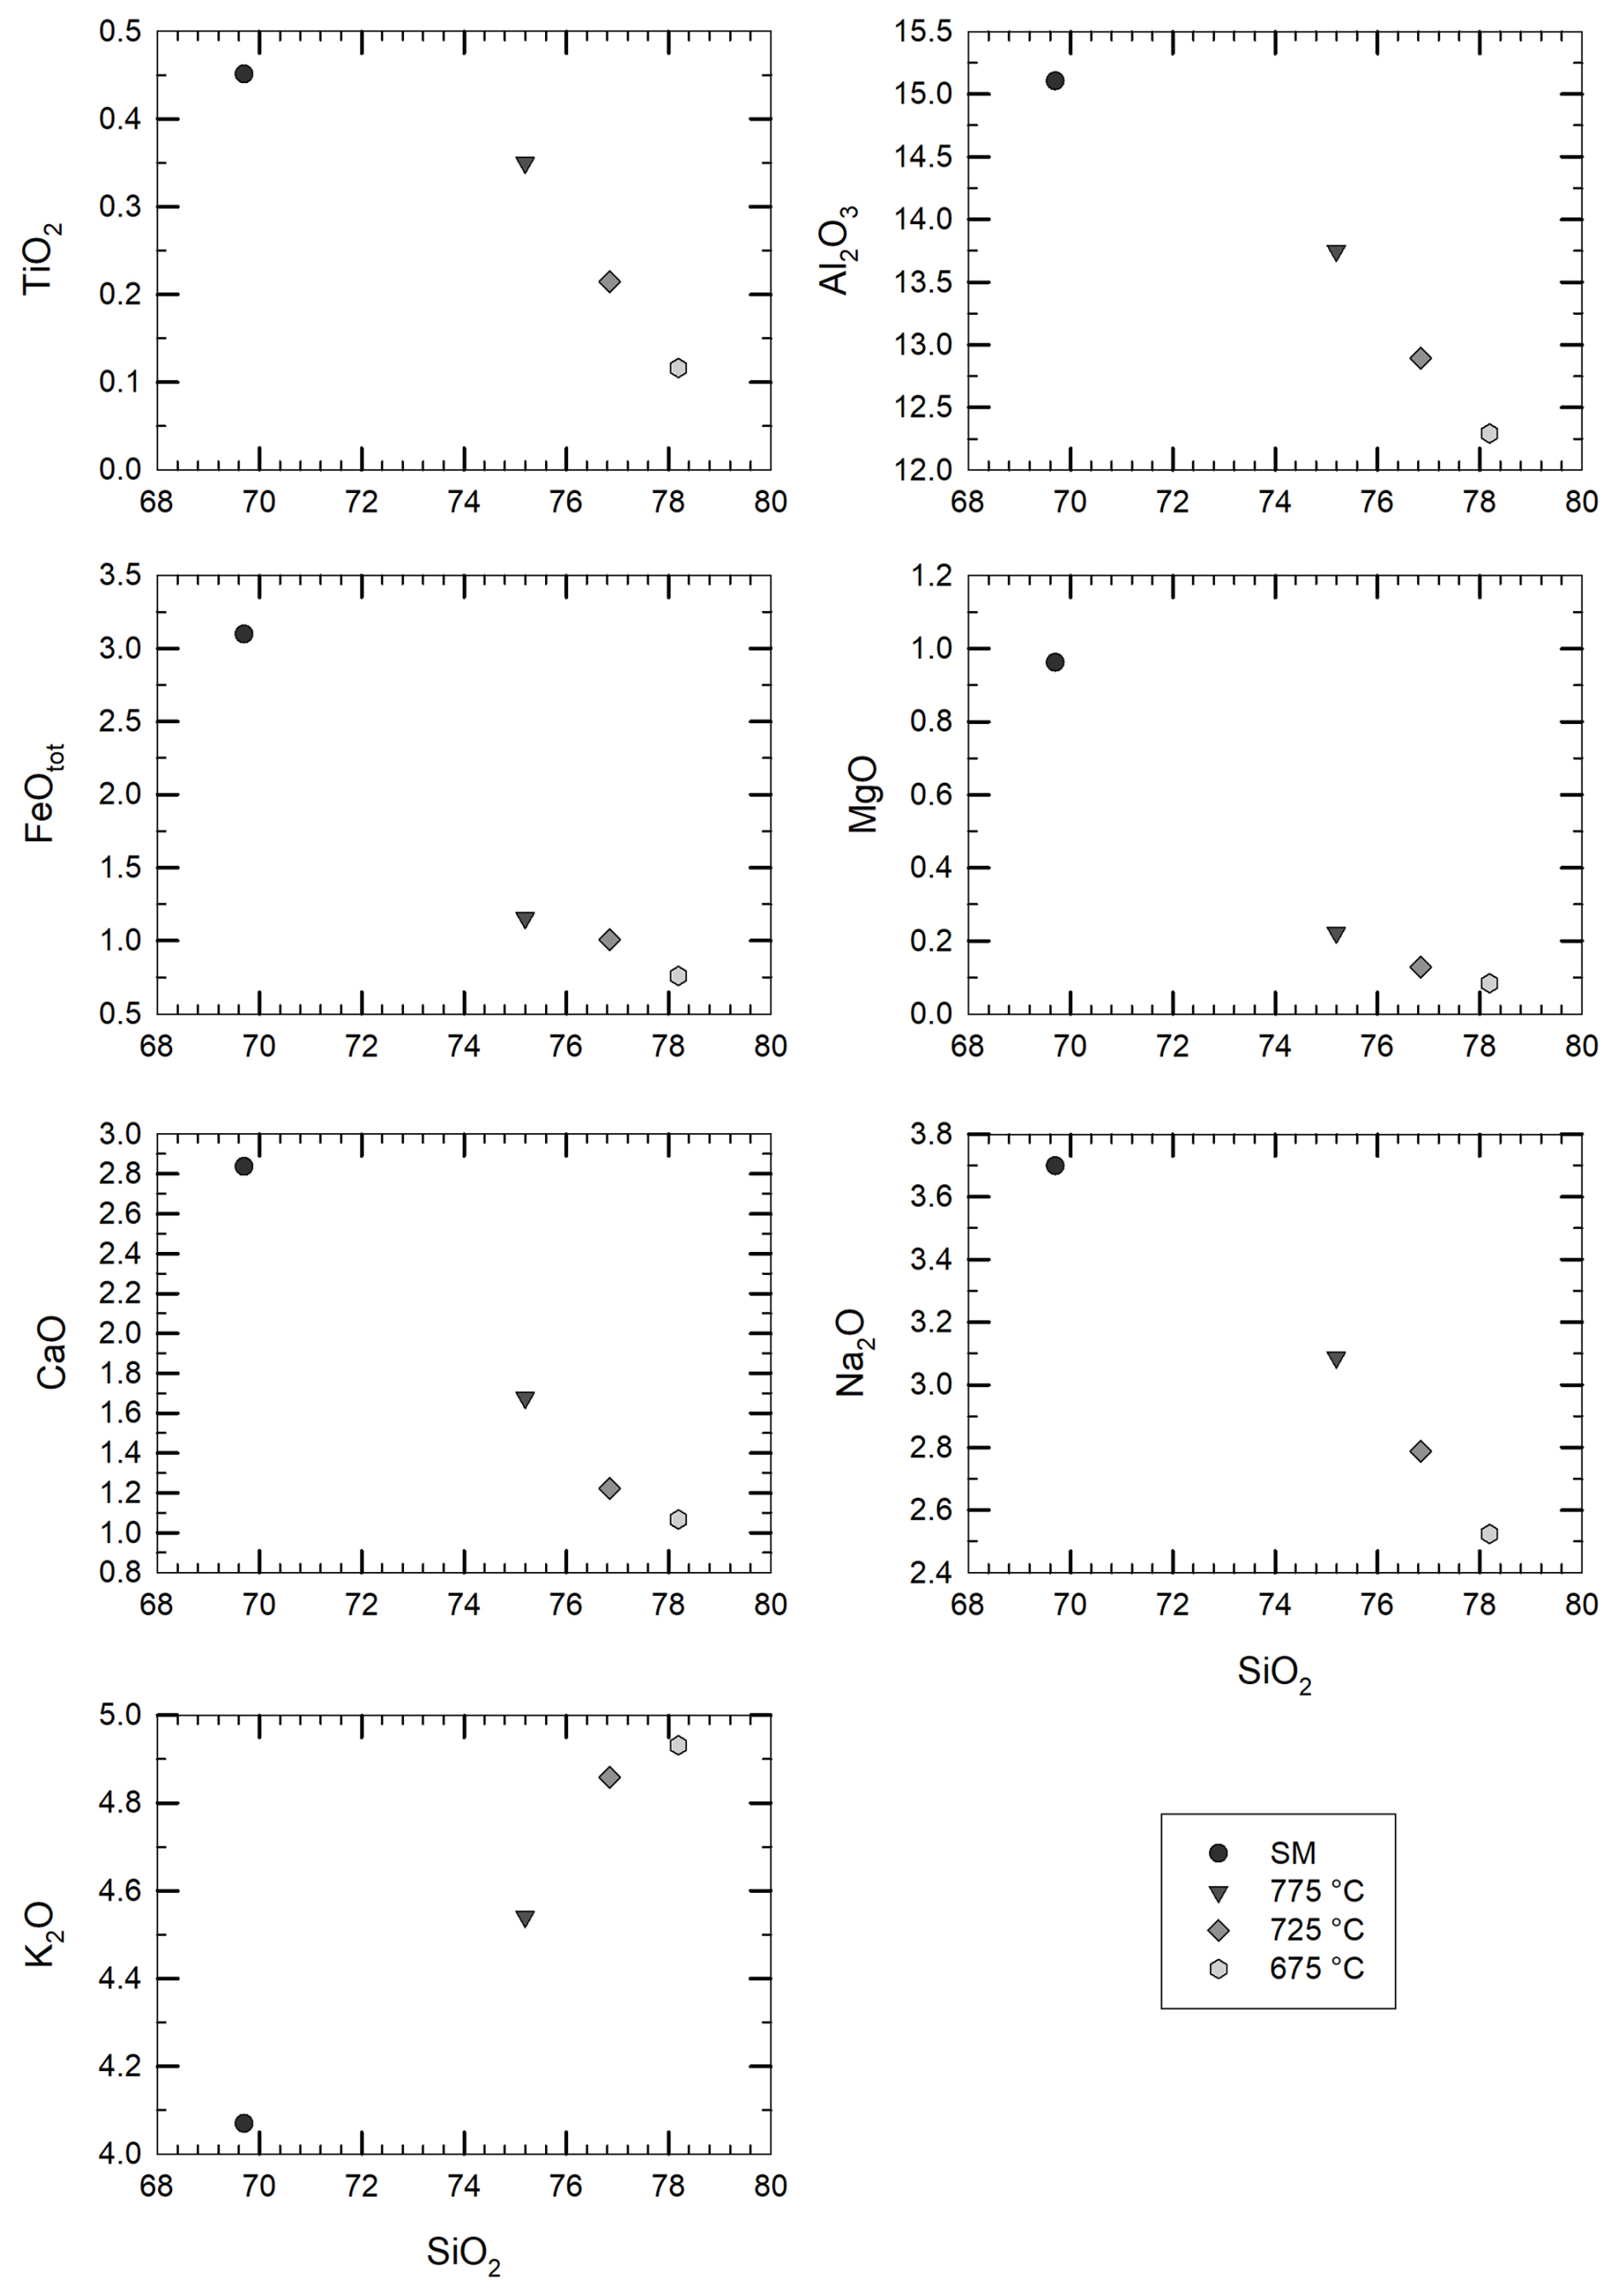
Figure 4Change in the residual glass composition (in wt % of element concentrations) upon crystallization of the starting material (SM). The analyses are recalculated to a total of 100 % oxides, as presented in Tables 1 and 2. The black dots refer to the starting material composition, while grey symbols (from dark to light grey) refer to the crystallization experiments (see corresponding temperatures in the legend).
Major element compositions of experimental glasses obtained after the first-step experiments are given in Table 2 (data normalized to 100 % assuming an anhydrous composition) and are shown in Fig. 4 together with the composition of the starting material for comparison. SiO2 content in glass increases with decreasing T from ∼75 wt % at 775 °C up to ∼78 wt % at 675 °C, whereas CaO, Al2O3, FeO, MgO, and Na2O decrease with cooling and crystallization. Only K2O increases with crystallization from 4.5 wt % at 775 °C to 4.9 wt % at 675 °C, which is a further indication confirming that alkali feldspar do not crystallize in our experimental series. The composition of the mineral phases that could be analysed is given in Table S2.
Plagioclase is An-rich at high temperatures, as expected (675 °C: approximately An37Ab58Or5; 725 °C: An44Ab53Or3; 775 °C: An48Ab49Or3). The composition of biotite and amphibole could not be analysed accurately in all products due to the small size of mafic phases, especially biotite. The Mg (Mg + Fet) ratio in amphibole is 0.64 (725 and 775 °C), and the Mg (Mg + Fet) in biotite is 0.70 (775 °C), where Fet is the molar proportion of total iron. We calculated the amphibole–biotite Fe–Mg exchange coefficient according to the following:
where Fet and Mg are the molar proportions of Fet and Mg, respectively. At 775 °C, is 1.00. This value is in the same range as that obtained for experiments in dacitic systems, varying between 0.95 and 1.11 in the temperature range of 700–850 °C (Fig. S1 and Table S3) (Dall'agnol et al., 1999; Costa et al., 2004; Holtz et al., 2005; Bogaerts et al., 2006). Values for tonalitic and andesitic systems are higher and range from 1.20 to 1.25 in the same temperature range (Marxer and Ulmer, 2019; Marxer et al., 2022). However, if analyses with a high standard deviation are excluded, the data compilation may indicate an increase in with temperature.

Figure 5SiO2 concentrations in glasses analysed after the second-step experiments. The analyses are recalculated to a total of 100 % (analytical data are given in the Appendix (Table S4). The data show the differences in terms of SiO2 concentrations in glasses far from the quartz trap and within the quartz grains of the trap. Glasses within the grains have higher SiO2 concentrations due to the dissolution of quartz. Results are from second-step experiments at 775 and 725 °C with run durations of 3 and 9 h.
In the second-step experimental products, the compositions of glasses were investigated in two different domains: glasses away from the grain trap and glasses filling the space between the quartz trap. As mentioned above, dissolution of the quartz grains at the contact with trapped melts was expected. Figure 5 illustrates the enrichment of SiO2 in the glasses between the quartz grains of the traps of second-step experiments after 3 and 9 h at 775 and 725 °C. The analytical data are given in Table S4. The SiO2 content of glass faraway from the glass trap is identical within error to the initial SiO2 content (glass from first-step experiments). However, glasses within the trap are enriched by ∼2 wt % to 3 wt % in SiO2. This high SiO2 concentration of ∼78 wt %–79 wt % in the glasses within the quartz trap indicates that dissolution kinetics were fast enough to almost saturate melt pools with respect to quartz after 3 h.
Table 3Glass and mineral proportions.
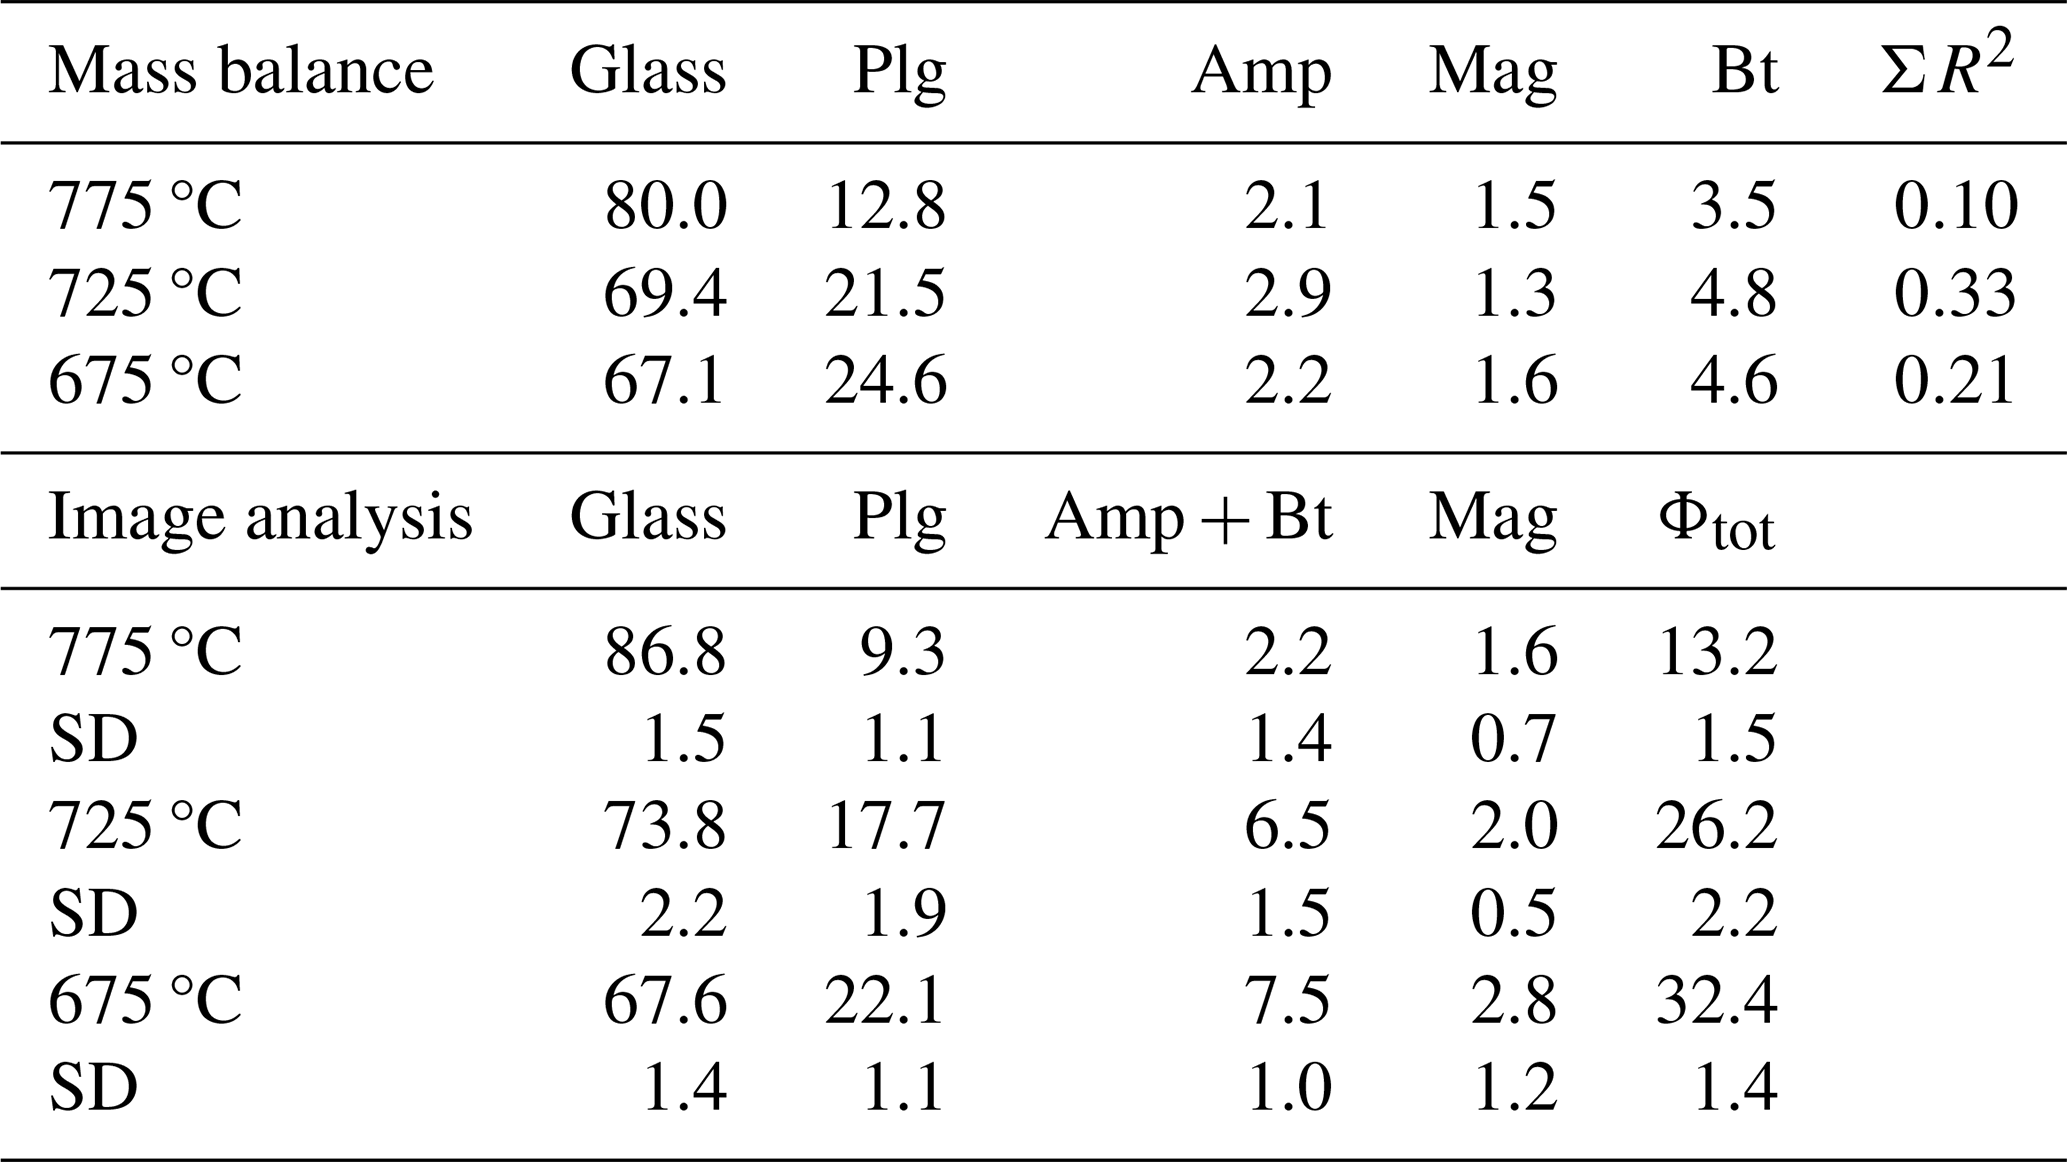
Note that the glass and mineral proportions in the experimental products are estimated by means of mass balance and image analysis.
4.3 Proportion of phases
Mass balance calculations using a least-squares fit to the starting composition were performed for all runs to estimate the proportion of phases. The mineral compositions used for the mass balance calculation are given in Table S2. As mentioned above, only phases obtained in the experiments at 775 °C (plagioclase, amphibole, biotite, and magnetite) and 725 °C (plagioclase and magnetite) could be analysed accurately, and the compositions of these phases were used for mass balance calculations at 725 °C (amphibole, biotite at 775 °C) and 675 °C. The results of the phase proportions calculated by mass balance are displayed in Table 3 and Fig. S2. As expected, a decrease in glass proportion as temperature decreases is observed. The glass proportion is estimated to be 80 wt % at 775 °C and decreases to ∼67 wt % at 675 °C. Plagioclase proportions change from ∼13 wt % to 25 wt % as T decreases from 775 to 675 °C, whereas magnetite proportions remain approximately constant for all runs (1.3 wt %–1.6 wt %). A slight increase in the amount of biotite is calculated from the highest to lowest experimental temperature (Table 3).
The proportion of phases estimated from image analysis conducted on BSE images of all first-step experimental run products are given in Table 3 and are shown in Fig. S2. As for mass balance calculations, glass is the most represented phase at all temperatures, decreasing from 87 area % at 775 °C to 67 area % at 675 °C. Plagioclase proportion increases from 9 area % to 22 area %. Amphibole and biotite are not distinguishable by the grey scale in BSE images and are therefore classified as one population (Table 3). The amount of magnetite is estimated to be 1 area %–2 area %.
There is a general agreement between the two independent approaches applied to constrain phase proportions. In the 775 °C experiment, the proportions of both mafic phases and plagioclase are lower in the image analysis approach, leading to a difference in the estimated melt fraction of ∼7 %. The higher proportion estimated by mass balance could, in part, be explained by the density difference between melt and crystalline phases. However, the opposite is observed for the 725 °C experiment, indicating that this variation is rather related to the uncertainty of both approaches.
Table 4Average value of trace element concentration melts and minerals and estimated bulk partitioning coefficients.
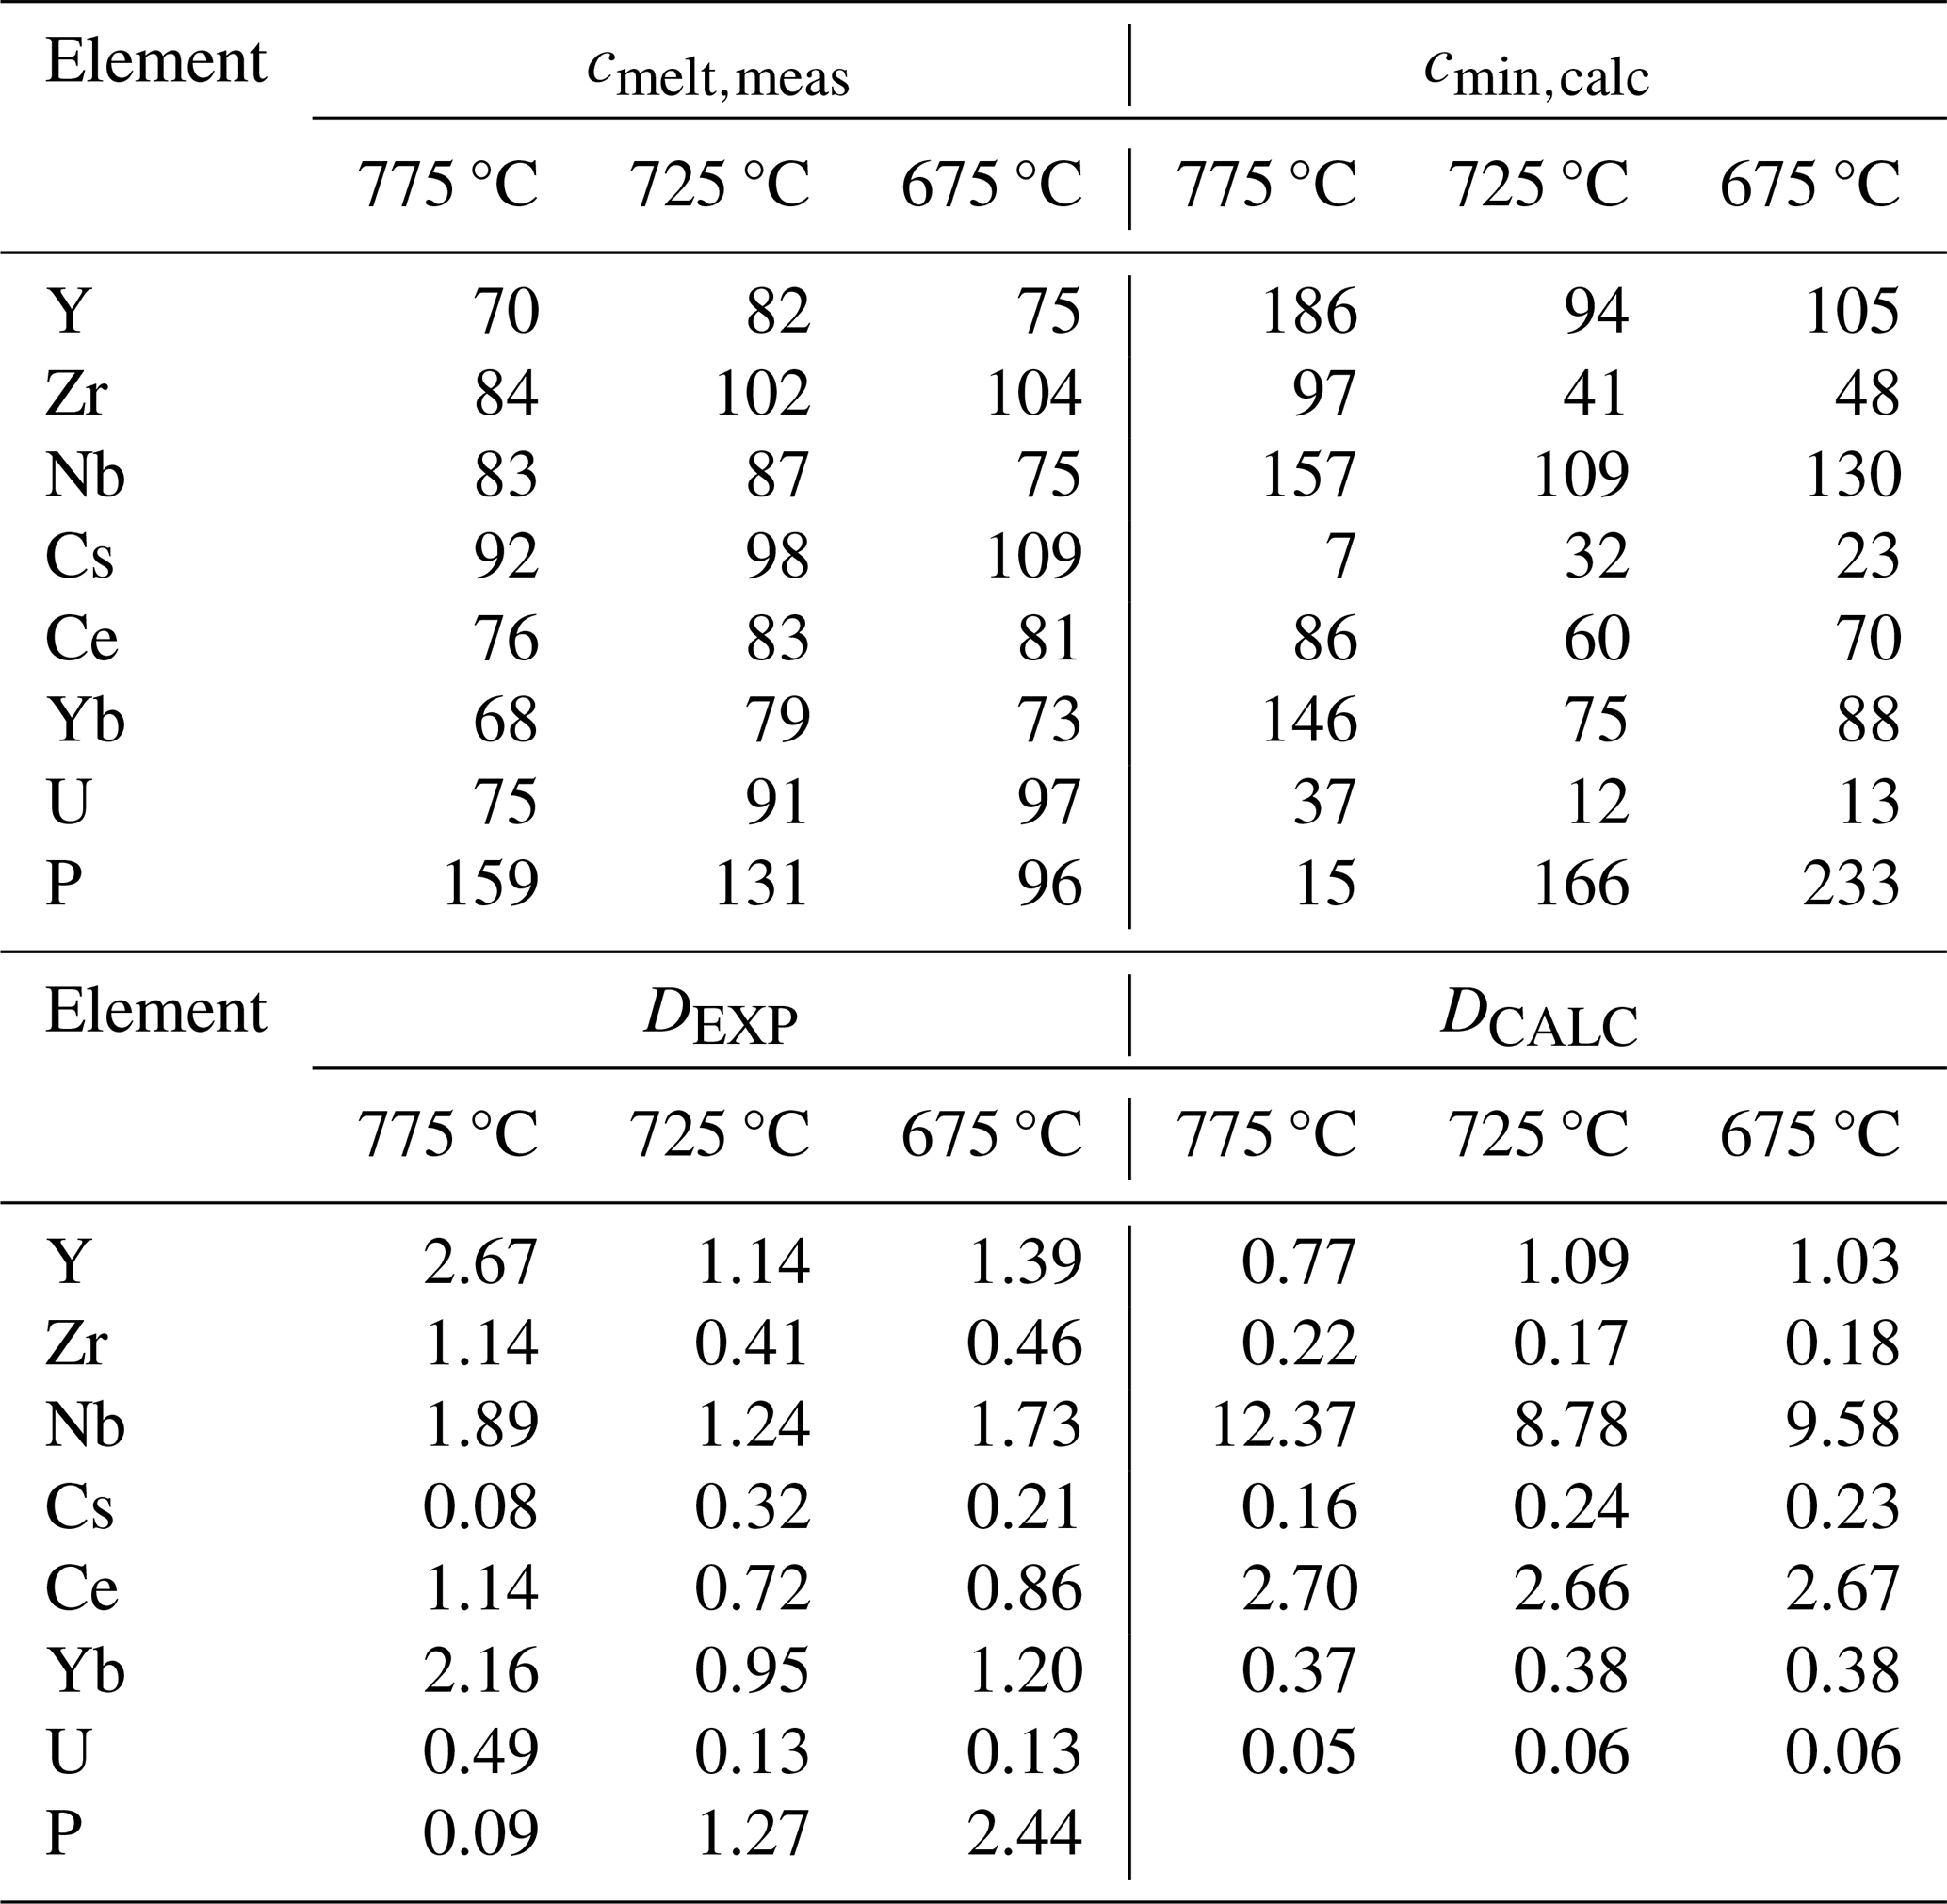
Note that the listed trace element concentrations in experimental glasses (cmelt,meas) were determined with LA-ICP-MS at Perugia (typical relative error reported in the description of the LA-ICP-MS instrumentation: 10 %). The trace element concentrations in the mineral assemblage (cmin,calc) were calculated by mass balance using the proportions determined by image analysis. DEXP is the bulk between crystal and melts calculated from the measured trace element concentrations in melts. DCALC is the calculated bulk crystal melt partitioning coefficient using values for each mineral phase estimated from the literature (for references, see the text).
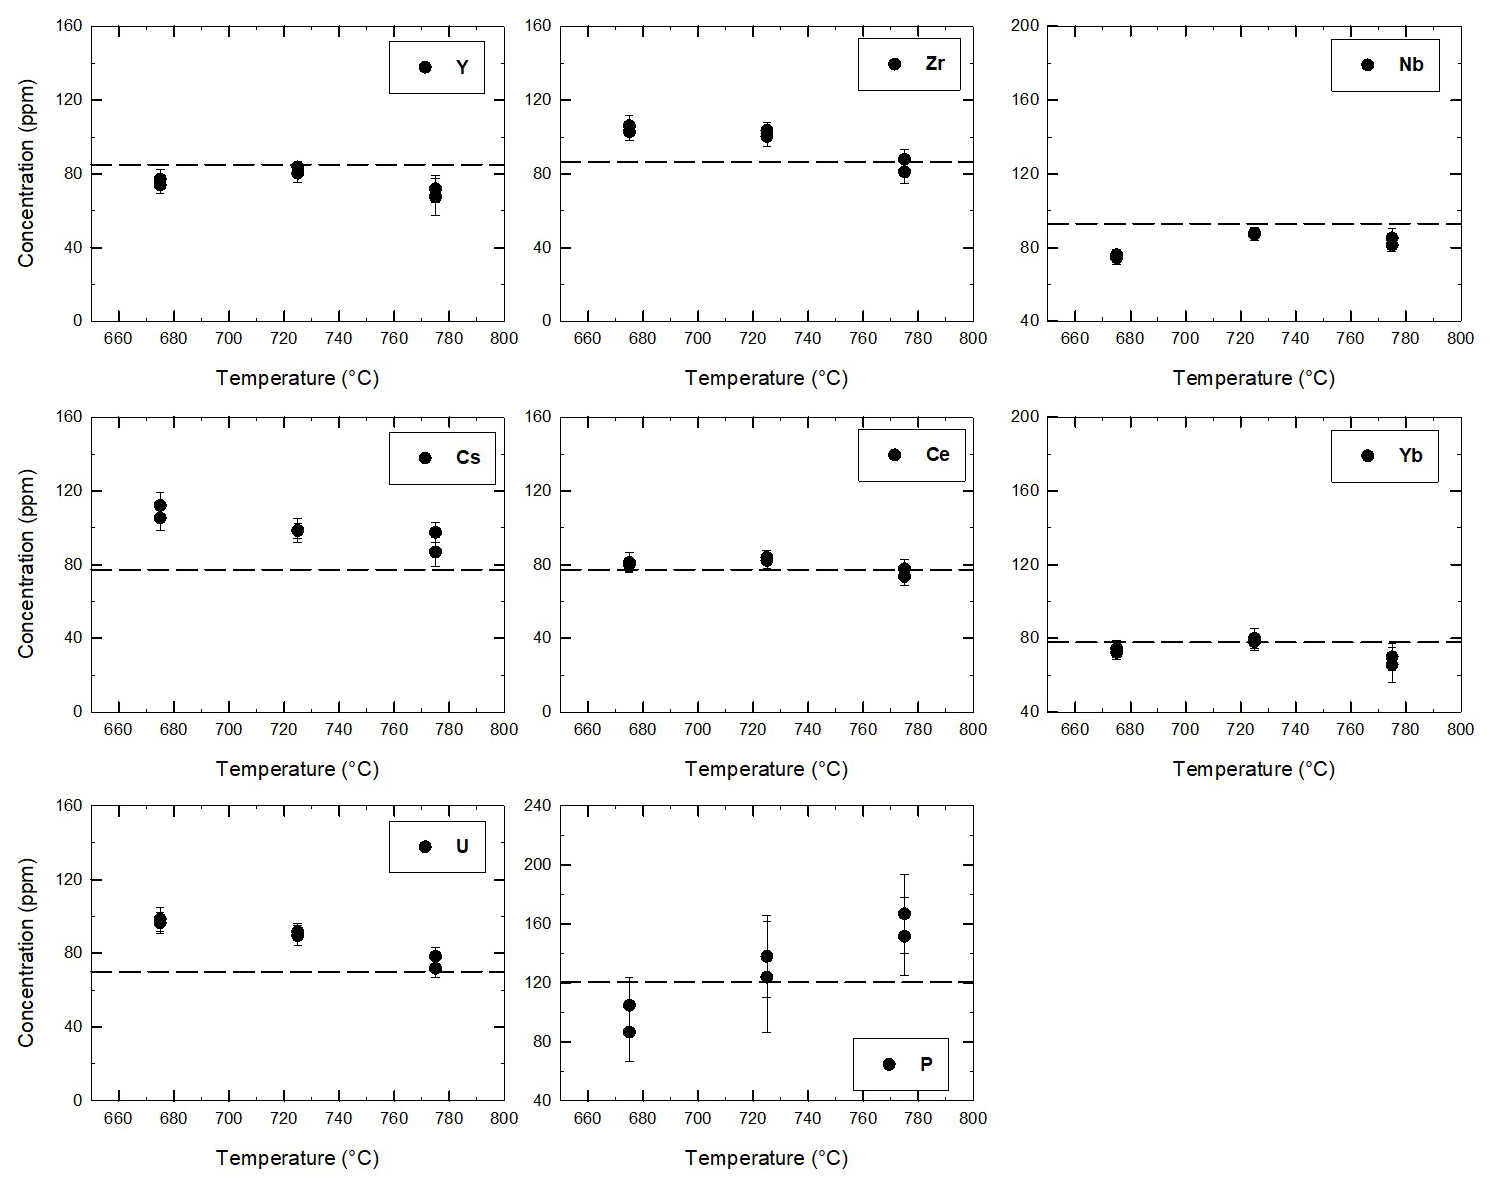
Figure 6Concentration of trace elements in glasses between the quartz trap obtained in Perugia by means of LA-ICP-MS for the three experiments at 675, 725, and 775 °C. The dashed lines mark the initial concentration in the starting glass. The experiments used to determine the trace element concentrations in glasses were duplicated, explaining why two points are plotted for each temperature.
4.4 Trace element concentration in glasses
The trace element concentration in the glasses within the quartz traps (data obtained at Perugia and Montpellier) is reported in Fig. S3. The comparisons of LA-ICP-MS analyses obtained at Montpellier (France) and Perugia (Italy) are consistent for all trace elements, providing very similar trends throughout the entire range of investigated temperature. However, there is a lower scatter in the Perugia dataset when compared with the Montpellier dataset (Fig. S3), probably because of the systematically lower beam size applied at Perugia, which avoids possible contaminations. For this reason, the smaller beam size in Perugia was used to confirm data obtained in Montpellier. Considering the smaller uncertainty range of the Perugia dataset, we will use this dataset in the following discussion. The average concentrations of trace elements measured at Perugia (average of 10 measurements) are given for each temperature in Table 4 and are shown in Fig. 6. As mentioned above, the 24 h experiments used to determine the trace element concentrations in glasses were duplicated. Thus, for each temperature, two analytical points, corresponding to the average value of glass analyses in each experiment, are reported in Fig. 6. The concentrations obtained from these duplicate experiments performed at the same temperature are identical within error, and this observation is also consistent with the major element analyses (Table S4). In general, three different behaviours of the trace element concentrations can be observed (Fig. 6): (1) the concentrations increase with decreasing temperature for the elements Cs and U and partly for Zr; (2) the concentrations do not change significantly or remain nearly constant within error for the four elements Ce, Yb, Y, and Nb; (3) the concentration of P decreases with decreasing temperature.
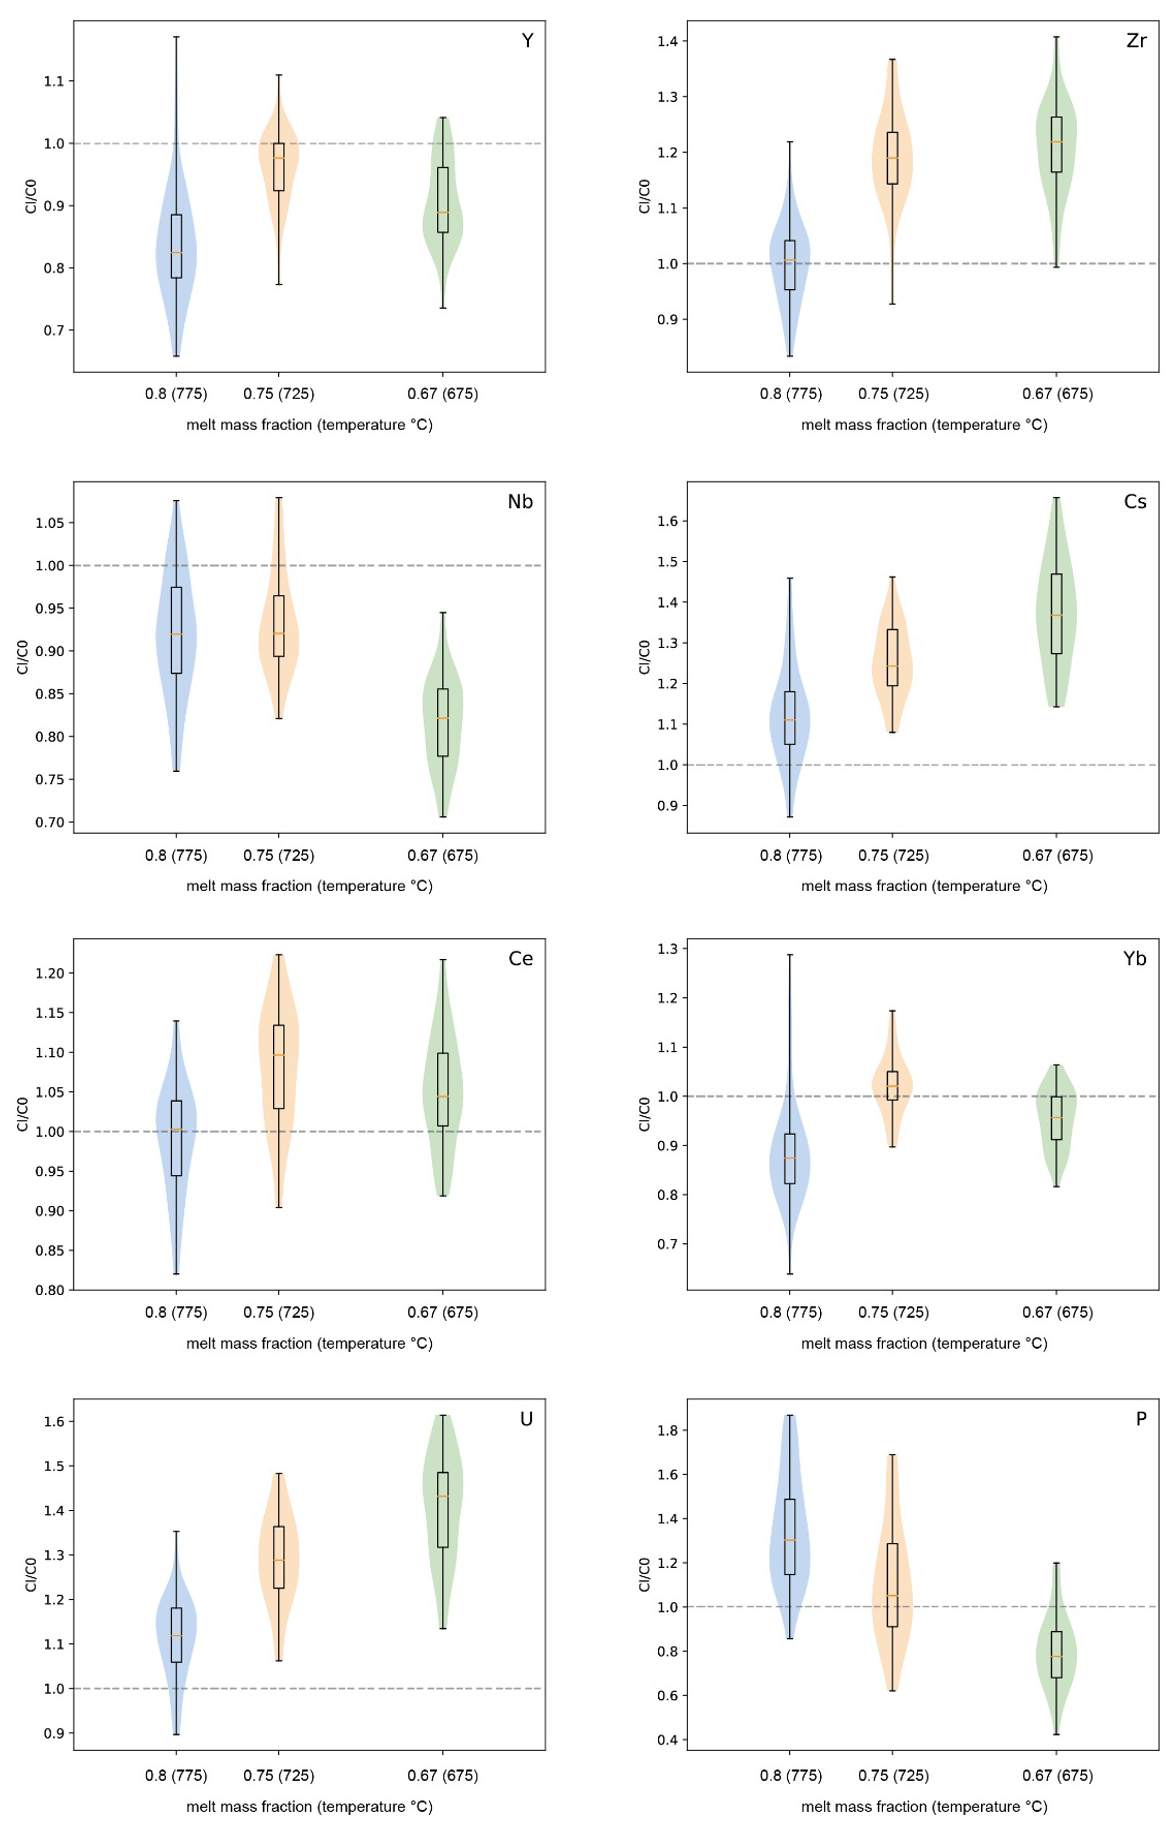
Figure 7Trace element concentration ratio between residual melt (Cl) and starting glass (C0) (including error propagation by Monte Carlo analyses).
5.1 Partitioning of trace elements between melt and mineral assemblage
The enrichment or depletion of each trace element relative to the initial composition is expressed as , where Cl is the concentration of the element in the liquid (melt) after the experiment, and C0 is its initial concentration in the starting material. The ratio, obtained by Monte Carlo analyses, including the error propagation for the partition estimations, is reported in Fig. 7. As expected from the analytical results shown in Fig. 6, Cl is always higher than C0 for Cs and U, and clearly increases with decreasing melt fraction (or decreasing temperature) (see also Fig. S4), indicating that these elements demonstrate incompatible behaviour in the investigated system in the temperature range of 675–775 °C.
The concentrations of Ce, Yb, Y, and Nb do not increase systematically with decreasing temperature. Considering the fact that the initial concentrations of all trace elements are in the same range, the behaviour of Ce, Yb, Y, and Nb should be very similar to that of Cs and U (same trend as in Fig. 7) if they were to be strongly incompatible. In contrast, the is ≤1 for Yb, Y, and Nb, indicating that these elements should be incorporated into one of the four major phases, which would most probably be biotite and/or amphibole rather than plagioclase or magnetite. An alternative explanation could be that one or several accessory mineral phase(s) buffer the concentrations of Yb, Y, and Nb. For example, apatite or xenotime ((Y,Yb,REE)PO4) could be such accessory phases for Yb and Y. However, since the initial trace element concentrations are very low, it is nearly impossible to detect such accessory phases in the run products. For Ce, is close to 1 at 775 °C and slightly above 1 at lower temperatures (higher crystallinity). The is identical within error at 675 and 725 °C, which indicates that Ce may be incorporated into the crystalline phases, which could be related to the crystallization of apatite or plagioclase.
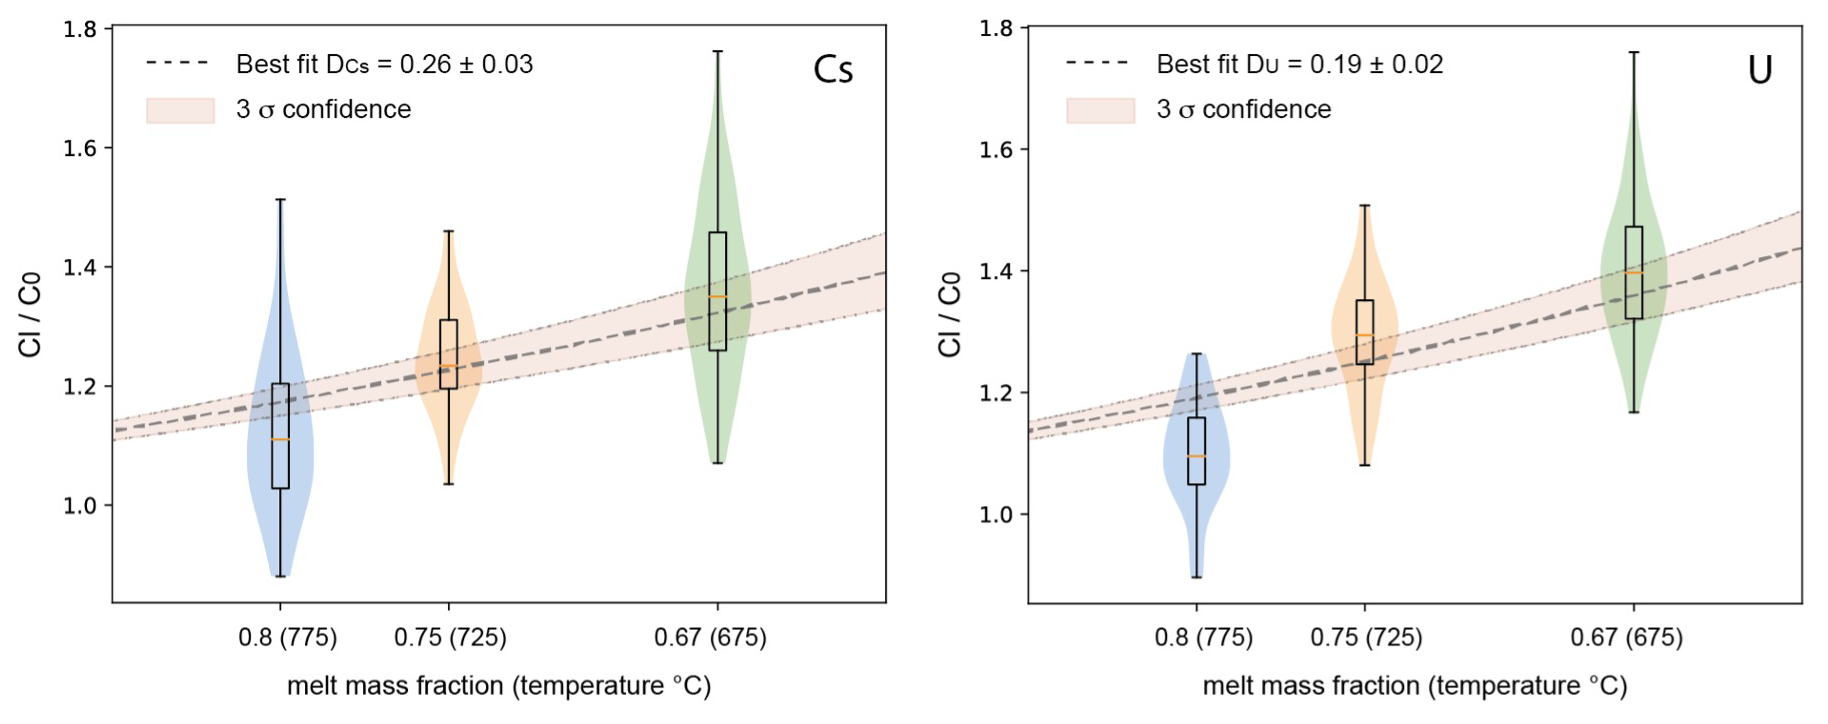
Figure 8Trace element concentration ratio between residual melt (Cl) and starting glass (C0), showing the enrichment of Cs and U in the residual liquid assuming a constant bulk partition coefficient between crystals and melt (DCs and DU, respectively; including error propagation by Monte Carlo analyses).
5.2 Partitioning of Zr and P and role accessory minerals
The evolution of Zr and P concentrations in the residual glasses can be compared with the zircon solubility and apatite solubility models proposed in the literature. For Zr, at 775 °C, the concentration of the melt does not differ significantly from that of the starting material (84 and 86 ppm, respectively). Considering the high melt fraction at 775 °C, this value is not expected to change significantly if Zr saturation was not reached and if some Zr is incorporated into minerals (similarly to Cs and U). The data in Table 4 could indicate that zircon solubility was reached between 725 and 675 °C since Zr concentrations are in the same range at 725 and 675 °C (102 and 104 ppm, respectively). Thus, zircon saturation at ∼100 ppm should have been reached between these two temperatures. However, except for the zircon saturation model of Gervasoni et al. (2016) predicting a concentration of 97 ppm at 675 °C, all other available models (Crisp and Berry, 2022; Borisov and Aranovich, 2019; Boehnke et al., 2013; Watson and Harrison, 1983; Baker et al., 2002) predict Zr concentrations at zircon saturation that are lower than 100 ppm at 675 °C (70 to 29 ppm). Applying one of the most recent zircon solubility models of Borisov and Aranovich (2019); incorporating all the literature data available before 2019 to evaluate zircon solubility; and using the melt compositions obtained at 775, 725, and 675 °C (Table 2), the zircon saturation should be reached at 199, 114, and 64 ppm, respectively. The more recent model proposed by Crisp and Berry (2022) results in even lower values of 133, 63, and 29 ppm. This general underestimation of Zr concentration at zircon saturation contrasts with observations made by Marxer and Ulmer (2019) in the temperature range of 800–875 °C, noting that the zircon solubility models proposed so far (in 2019 and before) may overestimate Zr concentrations in melts derived from the crystallization of calc-alkaline tonalites.
Two explanations may be proposed for the discrepancy between most zircon saturation models and our data. The first one may be related to kinetic problems of nucleation and growth of zircon leading to an oversaturation of the melt. This cannot be excluded, but such problems may be negligible considering the long experimental duration, the temperature cycling that was applied to avoid nucleation delays, and the presence of many other phases that could play the role of nucleation sites. A second explanation may be related to the application to low temperatures at which Zr concentrations at zircon saturation are expected to be very low (in glasses from run products). All solubility models mentioned above were calibrated from the regression of data obtained at high temperatures (typically above 900–1000 °C), under which conditions pure melts coexisted with zircon (zircon “in excess”). As a result of the high temperatures, Zr concentrations in the glasses were high. When extrapolated to low Zr concentrations and far from the calibration range, small variations in the slope of the regressions can easily explain the variation range that is observed between the models and the differences compared to our data (see also the discussion in Marxer and Ulmer, 2019). However, when applied for thermobarometry, these small variations in Zr concentrations can translate to strong differences in terms of estimated temperatures. The contrasting results between our data and those of Marxer and Ulmer (2019), both resulting from laser ablation analyses from products of crystallization experiments, most probably indicate that compositional parameters of melts become particularly important when temperature and zircon solubility become low. For example, based on the model of Watson and Harrison (1983), a compositional variation of 2 wt % SiO2 at the expense of Al2O3 can lead to a change in the Zr concentration of 30 % at 675 °C. Our high silica–rhyolite compositions obtained at 675 °C are more Si- and K-rich and contain less Al, Ca, and Fe when compared to those of Marxer and Ulmer (2019). However, as mentioned above, good calibration data for zircon solubility at low temperatures are crucially missing.
The P concentration is lower than that of the starting material at 675 °C (96 ppm; 0.022 wt % P2O5), identical within uncertainty at 725 °C (131 ppm; 0.030 wt % P2O5), and higher at 775 °C (159 ppm; 0.036 wt % P2O5, Table 4). This evolution implies that melts became saturated with respect to apatite in the temperature range of 675–725 °C and that the saturation temperature should be reached with a phosphorus content of less than 130 ppm (0.030 wt % P2O5 if the P concentration in mineral phases is negligible). The melt compositions given in Table 2 were applied to determine the phosphate solubility (whitlockite and apatite) using the most recent model proposed by Tollari et al. (2006). Tollari et al. (2006) performed experiments at 1 atm in F-bearing systems, but their general model also took experiments performed in other systems into account (in particular, apatite solubility data in water-bearing and peraluminous systems, e.g. Pichavant et al., 1992). Depending on temperature, the phosphorus contents at phosphate saturation are in the range of 0.25 wt % to 0.35 wt % P2O5 (or 1090 and 1527 ppm P, respectively) if the model of Tollari et al. (2006) is applied for the starting dacitic composition. However, if the compositions of the residual melts listed in Table 2 are used, the calculated phosphorus contents at phosphate saturation are higher and increase with decreasing temperature (0.61 (2662 ppm), 1.03 (4494 ppm), and 1.15 (5018 ppm) wt % P2O5 (P) at 775, 725, and 675 °C, respectively), which is not predicted from solubility laws based on Arrhenian behaviour. Such concentrations are significantly higher than our results (less than 0.05 wt % P2O5 or 218 ppm P), indicating that the model of Tollari et al. (2006) overestimates apatite solubility for evolved rhyolitic compositions. On the other hand, the model of Harrison and Watson (1984) predicting concentrations in the range 0.012 (52 ppm) to 0.002 (9 ppm) wt % P2O5 (P) (775 to 625 °C, respectively) would underestimate the apatite solubility, which may be due to the slightly peraluminous melt compositions leading to higher solubility (Pichavant et al., 1992).
5.3 Bulk partition coefficients between crystals and melt
A bulk partition coefficient Dexp for the trace elements can be determined from our analytical data using the initial trace element concentration, the trace element concentration in the glass, and the modal proportions of the phases. Thus, it is interesting to check to which extent this value fits with bulk partition coefficients Dcalc calculated from literature data on partitioning between minerals and melt. In the following, Dcalc values were determined using partitioning data for biotite, plagioclase, and ilmenite proposed by Pichavant et al. (2024) based on the analyses of peraluminous rhyolites of Macusani (the partitioning for ilmenite was assumed to be identical to that of magnetite). For amphibole, partitioning data were taken from other studies. The applied partitioning data and corresponding references are given in Table S5.
Our experimental approach simulates equilibrium crystallization so that the bulk partition coefficient D estimated from our analytical data can be calculated following the classical equation proposed for equilibrium crystallization:
where Cl is the trace element concentration in the liquid (melt), C0 is the initial trace element concentration, D is the bulk partition coefficient between the crystalline assemblage and melt (, where Kd refers to a bulk partition coefficient for a specific element, and X refers to the fraction of phase), and F is the melt fraction.
The concentration in the mineral assemblage is not known but can be calculated because Cl, C0, and the value of F are known (F is calculated by means of mass balance or image analysis, Table 3). The results are shown in Table 4.
The data in Table 4 indicate that Dexp values for Cs and U are different when comparing the three experimental products. Assuming that, for each mineral phase, the Kd value does not change significantly in the investigated temperature interval, the variation of Dexp must be related to different proportions of mineral phases in the crystalline assemblage. In any case, as already mentioned above, these two elements are clearly incompatible, and, assuming a constant bulk Dexp value over the investigated temperature interval, the data can best be fitted with a DCs value of 0.26 and a DU value of 0.19 (Fig. 8). The value is in good agreement with the calculated value, which is in the range of 0.16–0.23 (Table 4). The calculated bulk is 0.05 and 0.06 (Table 4), which is lower than our experimental data, implying that U may be less incompatible than expected. This difference may be due to a higher partitioning of U in amphibole, which is also confirmed by results from Nandedkar et al. (2016).
As discussed above, the evolution of Ce, Yb, Y, and Nb indicates that these elements are partly incorporated into mineral phases and that they are rather compatible. The bulk Dexp values extracted from our experiments for Yb, Y, and Nb are mostly between 1 and 2. The highest values are systematically observed in the 775 °C experiment, where the proportion of mafic phases relative to plagioclase is the highest. This indicates that Yb, Y, and Nb may be preferentially incorporated into mafic phases. Based on the database given in Table S6, Yb and Y are most probably mainly incorporated into amphibole, whereas Nb is incorporated into an oxide phase (magnetite) or biotite (Were and Keppler, 2021).
The bulk Dcalc values calculated using partitioning coefficients published so far differ in part from the Dexp values derived from experimental data. For Yb, the calculated values are below 1, but our values are close to or above 1, indicating that Yb may be less incompatible than expected and that calculated partitioning values for Yb may be underestimated for amphibole. Calculated values are significantly higher than for Nb, which could indicate that Nb may be more incompatible than expected in magnetite-bearing systems. However, a small variation in the estimated amount of magnetite may affect the calculated D values significantly. For example, if the oxide concentration were to be 0.5, 1, and 1.5 at 775, 725, and 675 °C, respectively, the would be in the range of 5.5 to 6 (Table 4). Values for are in the same range as those observed experimentally, especially at 725 and 675 °C. The values at 775 °C are lower than , but this may be due to an underestimation of the amounts of biotite and amphibole in the experiment. If the proportions estimated by mass balance are considered (∼5 % biotite + amphibole), the at 775 °C is 1.46 (Table 4), which fits better with the Y trend determined experimentally. For Ce, the higher calculated D values most probably indicate that the applied partitioning coefficient for Ce in plagioclase is too high or that apatite may also influence the Ce budget.
In conclusion, our experimental data show that only the two elements Cs and U are strongly incompatible during the crystallization of dacitic melts, in which amphibole and biotite and a few oxides are stable mafic phases, while plagioclase is the only stable tectosilicate phase. For these elements, we observe a clear relationship between crystallinity and trace element concentrations of Cs and U (Fig. S4). Since all other investigated trace elements differ from this behaviour, both the type and the amount of minerals that crystallize affect the trace element distributions significantly. For some elements such as Y, the trace element concentrations can be correctly predicted using available databases for trace element distributions. However, the behaviour of other elements such as Yb, Ce, and Nb is not predicted accurately. We also demonstrate that the prediction of some trace element concentrations in dacitic systems is extremely affected by small variations of mineral proportions, implying that crystallization models which do not predict perfectly the stability of mafic hydrous phases (e.g. amphibole, biotite) or oxides such as Rhyolite-MELTS (Gualda et al., 2012) need to be applied with caution to interpret trace element distributions in silicic volcanic systems.
Our results have important implications for (1) testing experimental approaches devoted to the determination of trace element partitioning in low-temperature highly crystalline systems and (2) the application to natural magmatic systems. Based on the results obtained for strongly incompatible elements (U, Cs), we demonstrate that the evolution of trace element concentrations in melts is directly proportional to the evolution of the crystallinity, as expected. Thus, our experimental approach based on two-step experiments (a crystallization experiment and a subsequent trap experiment) can be applied successfully to determine bulk partition coefficients of trace elements between complex mineral assemblages (biotite, amphibole, plagioclase, oxides, accessory phases) and residual melt in highly crystalline low-temperature rhyolitic and/or dacitic systems. Our approach is expected to be particularly useful in modelling the formation of porphyry deposits close to the solidus at the magmatic–hydrothermal transition, in which the budget of metals such as Cu, Mo, and W is primarily controlled by magmatic differentiation and which may involve several silicate phases (in particular, mica and amphibole), a fluid phase, and the saturation of minor accessory phases (e.g. Simon et al., 2008; Hsu et al., 2017).
Our experimental results further demonstrate that the modelling of trace element distributions in low-temperature, crystal-rich reservoirs based on high-temperature partitioning datasets may be problematic, especially for moderately incompatible elements (e.g. REE, HFSE) which may be highly sensitive to small changes in the modal proportions of amphibole and biotite and, in particular, to the saturation of a variety of accessory phases (e.g. silicates, phosphates, oxides, sulfides). This underscores that classical Rayleigh or batch fractionation models may not accurately capture trace element evolution in crustal silicic systems. In addition, the observed discrepancies between measured Zr and P concentrations and zircon or apatite solubility models indicate that accessory-phase saturation models calibrated at high temperatures may not be accurate when applied to low-temperature conditions. These findings affect the application of accessory-phase thermometry and geochemical proxies used to trace differentiation and highlight the need to account for temperature-dependent effects and modal mineralogy when interpreting the petrogenesis of evolved silicic magmas.
All the computations have been performed using Open source Python tools: pyton.org.
All data are available in the Supplement.
The supplement related to this article is available online at https://doi.org/10.5194/ejm-38-9-2026-supplement.
FV and FH: conceptualization, methodology, investigation, data curation, writing (original draft, review and editing), funding acquisition. KS and AS: experimental and analytical work. MP and FP: analytical work and interpretations. CS: data treatment and modelling. All of the authors have read and agreed to the published version of the paper.
At least one of the (co-)authors is a member of the editorial board of European Journal of Mineralogy. The peer-review process was guided by an independent editor, and the authors also have no other competing interests to declare.
Publisher's note: Copernicus Publications remains neutral with regard to jurisdictional claims made in the text, published maps, institutional affiliations, or any other geographical representation in this paper. While Copernicus Publications makes every effort to include appropriate place names, the final responsibility lies with the authors. Views expressed in the text are those of the authors and do not necessarily reflect the views of the publisher.
We acknowledge the Associate Editor, Didier Laporte; J.-F. Moyen; and an anonymous reviewer for their valuable feedback and constructive comments and suggestions that have helped to improve the manuscript.
This work was mainly supported by the funding of the German Science Foundation DFG (grant nos. HO1337/40 and HO1337/43) provided to Francois Holtz. The Alexander von Humboldt Foundation is acknowledged for the support to Francesco Vetere.
The publication of this article was funded by the open-access fund of Leibniz Universität Hannover.
This paper was edited by Didier Laporte and reviewed by J.-F. Moyen and one anonymous referee.
Bachmann, O. and Bergantz, G. W.: Rejuvenation of the Fish Canyon magma body: A window into the evolution of large-volume silicic magma systems, Geology, 31, 789–792, 2003.
Bachmann, O. and Bergantz, G. W.: The magma reservoirs that feed supereruptions, Elements, 4, 17–21, 2008.
Bachmann, O., Dungan, M. A., and Lipman, P. W.: The Fish Canyon Magma Body, San Juan Volcanic Field, Colorado: Rejuvenation and Eruption of an Upper-Crustal Batholith, Journal of Petrology, 43, 1469–1503, 2002.
Baker, D. R., Conte, A., Freda, C., and Ottolini, L.: The effect of halogens on Zr diffusion and zircon dissolution in hydrous metaluminous granitic melts, Contributions to Mineralogy and Petrology, 142, 666–678, 2002.
Baker, M. B. and Stolper, E. M.: Determining the composition of high-pressure mantle melts using diamond aggregates, Geochimica et Cosmochimica Acta, 58, 2811–2827, 1994.
Bindeman, I. N., Davis, A. M., and Drake, M. J.: Ion microprobe study of plagioclase–basalt partition experiments at natural concentration levels of trace elements, Geochimica et Cosmochimica Acta, 62, 1175–1193, 1998.
Blundy, J. and Wood, B.: Partitioning of trace elements between crystals and melts, Earth and Planetary Sciences Letters, 210, 383–397, 2003.
Bogaerts, M., Scaillet, B., and Vander Auwera, J.: Phase Equilibria of the Lyngdal Granodiorite (Norway): Implications for the Origin of Metaluminous Ferroan Granitoids, Journal of Petrology, 47, 2405–2431, https://doi.org/10.1093/petrology/egl049, 2006.
Boehnke, P., Watson, E. B., Trail, D., Harrison, T. M., and Schmitt, A. K.: Zircon saturation re-revisited, Chemical Geology, 351, 324–334, 2013.
Borisov, A. and Aranovich, L.: Zircon solubility in silicate melts: New experiments and probability of zircon crystallization in deeply evolved basic melts, Chemical Geology, 510, 103–112, 2019.
Costa, F., Scaillet, B., and Pichavant, M.: Petrological and Experimental Constraints on the Pre-eruption Conditions of Holocene Dacite from Volcán San Pedro (36° S, Chilean Andes) and the Importance of Sulphur in Silicic Subduction-related Magmas, Journal of Petrology, 45, 855–881, https://doi.org/10.1093/petrology/egg114, 2004.
Crisp, L. J. and Berry, A. J.: A new model for zircon saturation in silicate melts, Contributions to Mineralogy and Petrology, 177, 1–24, 2022.
Dall'agnol, R., Scaillet, B., and Pichavant, M.: An Experimental Study of a Lower Proterozoic A-type Granite from the Eastern Amazonian Craton, Brazil, Journal of Petrology, 40, 1673–1698, https://doi.org/10.1093/petroj/40.11.1673, 1999.
Da Silva, M. M., Holtz, F., and Namur, O.: Crystallization experiments in rhyolitic systems: the effect of temperature cycling and starting material on crystal size distribution, American Mineralogist, 102, 2284–2294, 2017.
Di Salvo, S., Avanzinelli, R, Isaia, R., Zanetti, A., and Druitt, T.: Crystal-mush reactivation by magma recharge: Evidence from the Campanian Ignimbrite activity, Campi Flegrei volcanic field, Italy, Lithos, 376–377, 105780, https://doi.org/10.1016/j.lithos.2020.105780, 2020.
Erdmann, M. and Koepke, J.: Experimental temperature cycling as a powerful tool to enlarge melt pools and crystals at magma storage conditions, American Mineralogist, 101, 960–969, 2016.
García-Arias, M., Corretgé, L. G., and Castro, A.: Trace element behavior during partial melting of Iberian orthogneisses: An experimental study, Chemical Geology, 292–293, 1–17, 2012.
Gervasoni, F., Klemme, S., Rocha-Júnior, E. R. V., and Berndt, J.: Zircon saturation in silicate melts: a new and improved model for aluminous and alkaline melts, Contrib Mineral Petrol, 171, 2, https://doi.org/10.1007/s00410-016-1227-y, 2016.
Giuffrida, M., Holtz, F., Vetere, F., and Viccaro, M.: Effects of CO2 flushing on crystal textures and compositions: experimental evidence from recent K-trachybasalts erupted at Mt. Etna, Contributions to Mineralogy and Petrology, 172, 90, https://doi.org/10.1007/s00410-017-1408-3, 2017.
Griffin, W. L., Powell, W. J., Pearson, N. J., and O'Reilly, S. Y.: GLITTER: data reduction software for laser ablation ICP-MS. Laser Ablation-ICP-MS in the earth sciences, Mineral. Assoc. Canada Short Course Ser., 40, 204–207, 2008.
Gualda, A. R. G., Ghiorso, M. S., Lemons, R. V., and Carley, T. L.: Rhyolite-MELTS: a Modified Calibration of MELTS Optimized for Silica-rich, Fluid-bearing Magmatic Systems, Journal of Petrology, 53, 875–890, https://doi.org/10.1093/petrology/egr080, 2012.
Halliday, A. N.: Terrestrial accretion rates and the origin of the Moon, Earth Planet. Sci. Lett., 176, 17–30, 2000.
Hammer, J. E. and Rutherford, M. J.: An experimental study of the kinetics of decompression-induced crystallization in silicic melts, J Geophys Res., 107, 1–23, 2002.
Harrison, T. M. and Watson, E. B.: The behaviour of apatite during crustal anataxis: equilibrium and kinetic considerations, Geochimica et Cosmochimica Acta, 48, 1468–1477, https://doi.org/10.1016/0016-7037(84)90403-4, 1984.
Holtz, F., Behrens, H., Dingwell, D. B., and Taylor, R.: Water solubility in aluminosilicate melts of haplogranitic composition at 2 kbar, Chemical Geology, 96, 289–302, 1992a.
Holtz, F., Pichavant, M., Barbey, P., and Johannes, W.: Effects of H2O on liquidus phase relations in the haplogranitic system at 2 and 5 kbar, American Mineralogist, 77, 1223–1241, 1992b.
Holtz, F., Sato, H., Lewis, J., Behrens, H., and Nakada, S.: Experimental Petrology of the 1991–1995 Unzen Dacite, Japan. Part I: Phase Relations, Phase Composition and Pre-eruptive Conditions, Journal of Petrology, 46, 319–337, https://doi.org/10.1093/petrology/egh077, 2005.
Hsu, Y.-J., Zajacz, Z., Ulmer, P., and Heinrich, C. A.: Copper partitioning between silicate melts and amphibole: Experimental insight into magma evolution leading to porphyry copper ore formation, Chemical Geology, 448, 151–163, 2017.
Jarosewich, E., Nelen, J. A., and Norberg, J. A.: Reference Samples for Electron Microprobe Analysis. Reprint, Geostandards and Geoanalytical Research, 4, 43–47, 1980.
Johannes, W. and Holtz, F.: Petrogenesis and Experimental Petrology of Granitic Rocks, Springer-Verlag, Berlin, Heidelberg, Minerals and Rocks 22, chief editor: Wyllie, P. J., edited by: El Goresy, A., von Engelhardt, W., Hahn, T., Pasadena, CA, 1996.
Johnson, M. C. and Rutherford, M. J.: Experimentally Determined Conditions in the Fish Canyon Tuff, Colorado, Magma Chamber, Journal of Petrology, 30, 711–737, 1989.
Kessel, R., Ulmer, P., Pettke, T., Schmidt, M. W., and Thompson, A. B.: The water–basalt system at 4 to 6 GPa: Phase relations and second critical endpoint in a K-free eclogite at 700 to 1400 °C, Earth and Planetary Science Letters, 237, 873–892, 2005.
Klemme, S., Blundy, J. D., and Wood, B. J.: Experimental constraints on major and trace element partitioning during partial melting of eclogite, Geochimica et Cosmochimica Acta, 66, 3109-3123, 2002.
Kushiro, I. and Hirose, K.: Experimental Determination of Composition of Melt Formed by Equlibrium Partial Melting pf Peridotite at High Pressures Using Aggregates of Diamond Grains, Proceedings of the Japan Academy, 68B, 63–68, 1992.
Li, X., Zhang, C., Behrens, H., and Holtz, F.: Fluorine partitioning between titanite and metaluminous silicate melt: Experiments at 50–200 MPa and 875–925 °C, European Journal of Mineralogy, 30, 33–44, https://doi.org/10.1127/ejm/2017/0029-2689, 2018.
Lipman, P. W., Dungan, M. A., Brown, L. L., and Deino, A.: Recurrent eruption and subsidence at the Platoro caldera complex, southeastern San Juan volcanic field, Colorado: New tales from old tuffs, Geological Society of America Bulletin, 108, 1039–1055, 1996.
London, D. and Morgan VI, G. B.: Experimental Crystallization of the Macusani Obsidian, with Applications to Lithium-rich Granitic Pegmatites, Journal of Petrology, 58, 1005–1030, 2017.
Marxer, F. and Ulmer, P.: Crystallization and zircon saturation of calc-alkaline tonalite from the Adamello Batholith at upper crustal conditions: an experimental study, Contributions to Mineralogy and Petrology, 174, 84, https://doi.org/10.1007/s00410-019-1619-x, 2019.
Marxer, F., Ulmer, P., and Müntener, O.: Polybaric fractional crystallisation of arc magmas: an experimental study simulating trans-crustal magmatic systems, Contrib. Mineral. Petrol., 177, 3, https://doi.org/10.1007/s00410-021-01856-8, 2022.
Michaud, J. A.-S., Pichavant, M., and Villaros, A.: Rare elements enrichment in crustal peraluminous magmas: insights from partial melting experiments, Contributions to Mineralogy and Petrology, 176, 96, https://doi.org/10.1007/s00410-021-01855-9, 2021.
Mills, R. D. and Glazner, A. F.: Experimental study on the effects of temperature cycling on coarsening of plagioclase and olivine in an alkali basalt, Contributions to Mineralogy and Petrology, 166, 97–111, 2013.
Mills, R. D., Ratner, J. J., and Glazner, A. F.: Experimental evidence for crystal coarsening and fabric development during temperature cycling, Geology, 39, 1139–1142, 2011.
Mollard, E., Martel, C., and Bourdier, J. L.: Decompression-induced experimental crystallization in hydrated silica-rich melts: I. Empirical models of plagioclase nucleation and growth kinetics, J. Petrol., 53, 1743–1766, https://doi.org/10.1093/petrology/egs031, 2012.
Nandedkar, R. H., Hürlimann, N., Ulmer, P., and Müntener, O.: Amphibole–melt trace element partitioning of fractionating calc-alkaline magmas in the lower crust: an experimental study, Contributions to Mineralogy and Petrology, 171, 71, https://doi.org/10.1007/s00410-016-1278-0, 2016.
Nash, W. P. and Crecraft, H. R.: Partition coefficients for trace elements in silicic magmas, Geochimica et Cosmochimica Acta, 56, 403–417, 1985.
Nielsen, R. L., Ustinusik, G., Weinsteiger, A. B., Tepley III, J. F., Johnston, A. D., and Kent, A. J.: Trace element partitioning between plagioclase and melt: An investigation of the impact of experimental and analytical procedures, Geochim. Geophys. Geosyst., 18, 3359–3384, 2017.
Paton, C., Hellstrom, J., Paul, B., Woodhead, J., and Hergt, J.: Iolite: Freeware for the visualisation and processing of mass spectrometric data, Journal of Analytical Atomic Spectrometry, 26, 2508–2518, 2011.
Petrelli, M., Laeger, K., and Perugini, D.: High spatial resolution trace element determination of geological samples by laser ablation quadrupole plasma mass spectrometry: implications for glass analysis in volcanic products, Geosciences Journal, 20, 851–863, 2016a.
Petrelli, M., Morgavi, D., Vetere, F., and Perugini, D.: Elemental imaging and petro-volcanological applications of an improved Laser Ablation Inductively Coupled Quadrupole Plasma Mass Spectrometry, Periodico di Mineralogia, 85, 25–39, 2016b.
Pichavant, M., Montel, J. M., and Richard, L. R.: Apatite solubility in peraluminous liquids: Experimental data and an extension of the Harrison-Watson model, Geochimica et Cosmochimica Acta, 56, 3855–3861, 1992.
Pichavant, M., Erdmann, E., Kontak, D. J., Michaud J. A.-S., and Villaros, A.: Trace element partitioning in strongly peraluminous rare-metal silicic magmas – Implications for fractionation processes and for the origin of the Macusani Volcanics (SE Peru), Geochimica et Cosmochimica Acta, 365, 229–252, 2024.
Pouchou, J. L. and Pichoir, F.: Quantitative analysis of homogeneous or stratified microvolumes applying the model PAP, in: Electron probe quantification, edited by: Heinrich, K. F. and Newbury, D. E., 31–75, Plenum Press, New York, https://doi.org/10.1007/978-1-4899-2617-3_4, 1991.
Puziewicz, J. and Johannes, W.: Phase equilibria and compositions of Fe-Mg-Al minerals and melts in water-saturated peraluminous granitic systems, Contributions to Mineralogy and Petrology, 100, 156–168, 1988.
Rubatto, D. and Hermann, J.: Experimental zircon/melt and zircon/garnet trace element partitioningand implications for the geochronology of crustal rocks, Chemical Geology, 241, 38–61, https://doi.org/10.1016/j.chemgeo.2007.01.027, 2007.
Scaillet, B., Pichavant, M., and Roux, J.: Experimental Crystallization of Leucogranitic Magmas, Journal of Petrology, 36, 663–705, 1995.
Simon, A. C., Candela, P. A., Piccoli, P. M., Mengason, M., and Englander, L.: The effect of crystal-melt partitioning on the budgets of Cu, an, and Ag Am. Mineral., 93, 1437–1448, 2008.
Stalder, R., Ulmer, P., Thompson, A., and Günther, D.: High pressure fluids in the system MgO–SiO2– H2O under upper mantle conditions, Contributions to Mineralogy and Petrology, 140, 607–618, 2001.
Stechern, A., Blum-Oeste, M., Botcharnikov, R. E., Holtz, F., and Wörner, G.: Magma storage conditions of Lascar andesites, central volcanic zone, Chile, Eur. J. Mineral., 36, 721–748, https://doi.org/10.5194/ejm-36-721-2024, 2024.
Tollari, N., Toplis, M. J., and Barnes, S. J.: Predicting phosphate saturation in silicate magmas: an experimental study of the effects of melt composition and temperature, Geochimica et Cosmochimica Acta, 70, 1518–1536, 2006.
Van Orman, J. A., Grove, T. L., and Shimizu, N.: Diffusive fractionation of trace elements during production and trans- port of melt in Earth's upper mantle, Earth Planet. Sci. Lett., 198, 93–112, 2002.
Watson, E. B. and Harrison, T. M.: Zircon saturation revisited: temperature and composition effects in a variety of crustal magma types, Earth Planet. Sci. Lett., 64, 295–304, 1983.
Were, P. and Keppler, H.: Trace element fractionation between biotite, allanite, and granitic melt, Contributions to Mineralogy and Petrology, 176, 74, https://doi.org/10.1007/s00410-021-01831-3, 2021.
White, J. C., Holt, G. S., Baker, B. F., and Ren, M.: Trace-element partitioning between alkali feldspar and peralkalic quartz trachyte to rhyolite magma. Part I: Systematics of trace-element partitioning, American Mineralogist, 88, 316–329, 2003.
Whitney, J. A. and Stormer, J. C.: Mineralogy, Petrology, and Magmatic Conditions from the Fish Canyon Tuff, Central San Juan Volcanic Field, Colorado, Journal of Petrology, 26, 726–762, 1985.