the Creative Commons Attribution 4.0 License.
the Creative Commons Attribution 4.0 License.
 | 24 Feb 2026
Deciphering crystal growth in a sector-zoned interpenetration twin of loparite from Mt Khibiny (Kola Peninsula, Russia) through atomic-scale characterisation of growth sectors and twin boundaries
Nina Daneu
José Alberto Padrón-Navarta
Martin Šala
Kristina Mervič
Gerlinde Habler
Goran Dražič
Petruša Borštnar
Aleksander Rečnik
Rainer Abart
Loparite is a natural perovskite (ABO3) with a complex composition, essentially a solid solution between loparite(-Ce) (Na0.5Ce0.5TiO3), lueshite (NaNbO3), and perovskite (CaTiO3), with small amounts of many other elements. The majority of reported loparite crystals are spinel-type interpenetration twins with compositional zoning. Associated with the high variability of compositions, different crystal structures of loparite were described, and the origin of twinning has not been addressed so far.
In this work, we studied a loparite twin composed of two symmetrically intergrown cuboctahedra. Microprobe analyses revealed that the cubic and octahedral growth sectors have slightly different compositions. According to atomic-scale analyses, the cubic sectors with a lower Na:LREE ratio have a disordered orthorhombic structure, while the octahedral sectors with a higher Na:LREE ratio show partial ordering of Na and light rare-earth elements along A-type lattice planes in the [001] direction. The degree of ordering was evaluated by quantitative high-angle annular dark-field scanning transmission electron microscopy (HAADF-STEM). Atomic-scale analyses of (111) and {112} twin boundary (TB) contacts have shown that all TBs contain a 1–2 nm thin layer of an Si-rich amorphous phase.
Our observations suggest that the loparite twin was established in the nucleation stage of crystallisation, followed by independent crystallisation of both twin domains from the melt. The initial crystal form was cubic; octahedral sectors evolved when the crystal size was still in the nanometre range, as a result of slow crystal growth. Differences in structural ordering between adjacent growth sectors developed during slow cooling due to the compositional variations. Our results imply that compositionally zoned crystals might show different structural ordering within single domains, which should be considered when interpreting bulk diffraction data of compositionally zoned perovskites.
- Article
(12970 KB) - Full-text XML
-
Supplement
(5360 KB) - BibTeX
- EndNote


Loparite(-Ce) is a naturally occurring perovskite (ABO3) with nominal composition Na0.5Ce0.5TiO3. Besides cerium, it usually contains other light rare-earth elements (LREEs), such as lanthanum, praseodymium, and neodymium. It also typically forms solid solutions with lueshite (NaNbO3), tausonite (SrTiO3), and perovskite (CaTiO3) in different ratios (Mitchell et al., 2017). In addition, loparite often contains trace amounts of tantalum, thorium, uranium, barium, and other elements (Chakhmouradian et al., 2007; Kogarko, 2022). Consequently, loparite crystals show complex chemistry with many different elements occupying the A and B structural sites of the ABO3 perovskite structure, and even crystals from the same locality may have different compositions (Suk et al., 2013). The crystal structure of loparite can be described as pseudocubic (Chakhmouradian et al., 1999) due to the small deviations of atoms from the ideal positions of the cubic perovskite structure (structure aristotype). These deviations occur because of the compositional complexity of loparite crystals, in which cations on the A and B sites can differ significantly in size and charge (Table 1). Despite challenges, researchers have attempted to determine the crystal structure of loparite, primarily using X-ray diffraction (both single crystal and powder) and neutron diffraction. Different crystal structures have been reported for natural loparites, from cubic (Haggerty and Mariano, 1983), cubic with a doubled unit cell (Zubkova et al., 2000), tetragonal (Mitchell et al., 2000a), and orthorhombic (Mitchell et al., 2000a; Popova et al., 2017), as given in Table 1. In addition to its complex chemical composition, the crystal structure determination of loparite is further complicated by the fact that the crystals are typically twinned and/or sector zoned (Chakhmouradian et al., 2007).
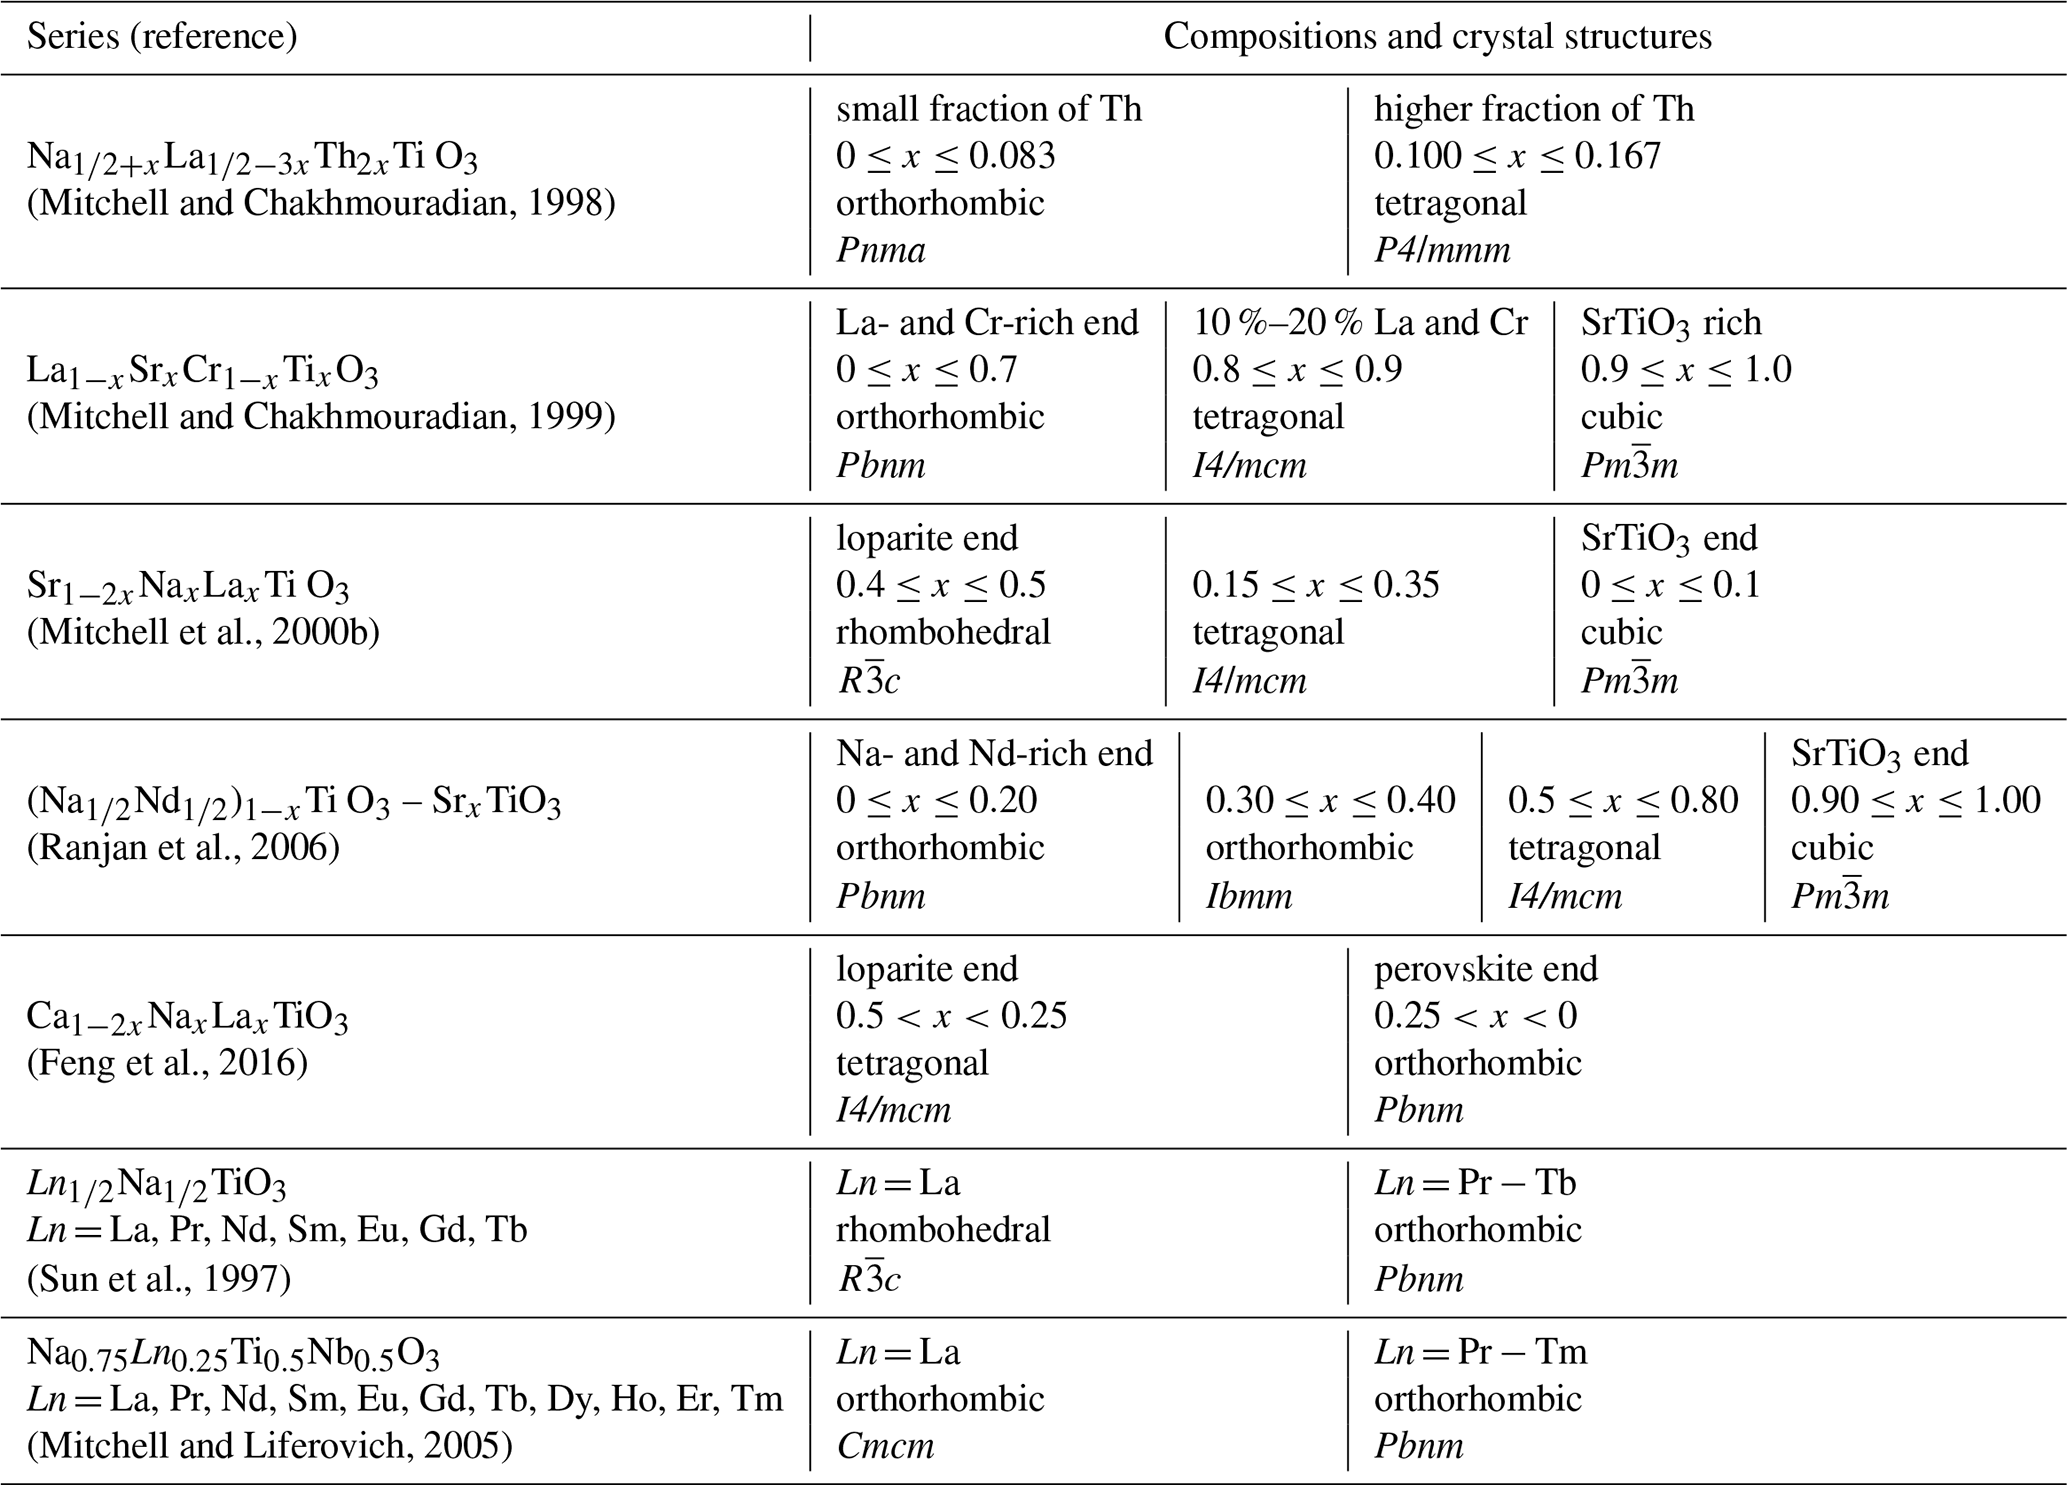
To gain a deeper insight into the structural characteristics of naturally occurring loparites, studies of synthetic perovskite titanates with complex compositions have been performed. Suk and Kotel'nikov (2008) synthesised loparites under simulated natural conditions; the obtained crystals were compositionally zoned, and twins were not reported. More commonly, complex perovskite titanates are synthesised by solid-state sintering. While this approach does not directly replicate natural conditions, it provides valuable insights into structural changes within a specific system. The main findings of these studies are summarised in Table 2 and show that, in general, lueshite-, loparite-, and perovskite-rich compositions with predominately Na or Ca and LREE elements on the A sites crystallise in three-tilt space groups (Glazer, 1972) like orthorhombic or rhombohedral; compositions with a mixture of larger and smaller elements on the A sites (e.g. Th) crystallise in tetragonal symmetry exhibiting ordering on the A sites; and compositions with a high fraction of tausonite are cubic.
Table 1Elemental compositions and structures of natural loparite crystals from different localities. The compositions are given as structural formulae in atomic per cent recalculated to three oxygens and as molar fractions of major components. Structural data are based on single-crystal XRD for Sarambi loparite and on powder XRD for the other samples.
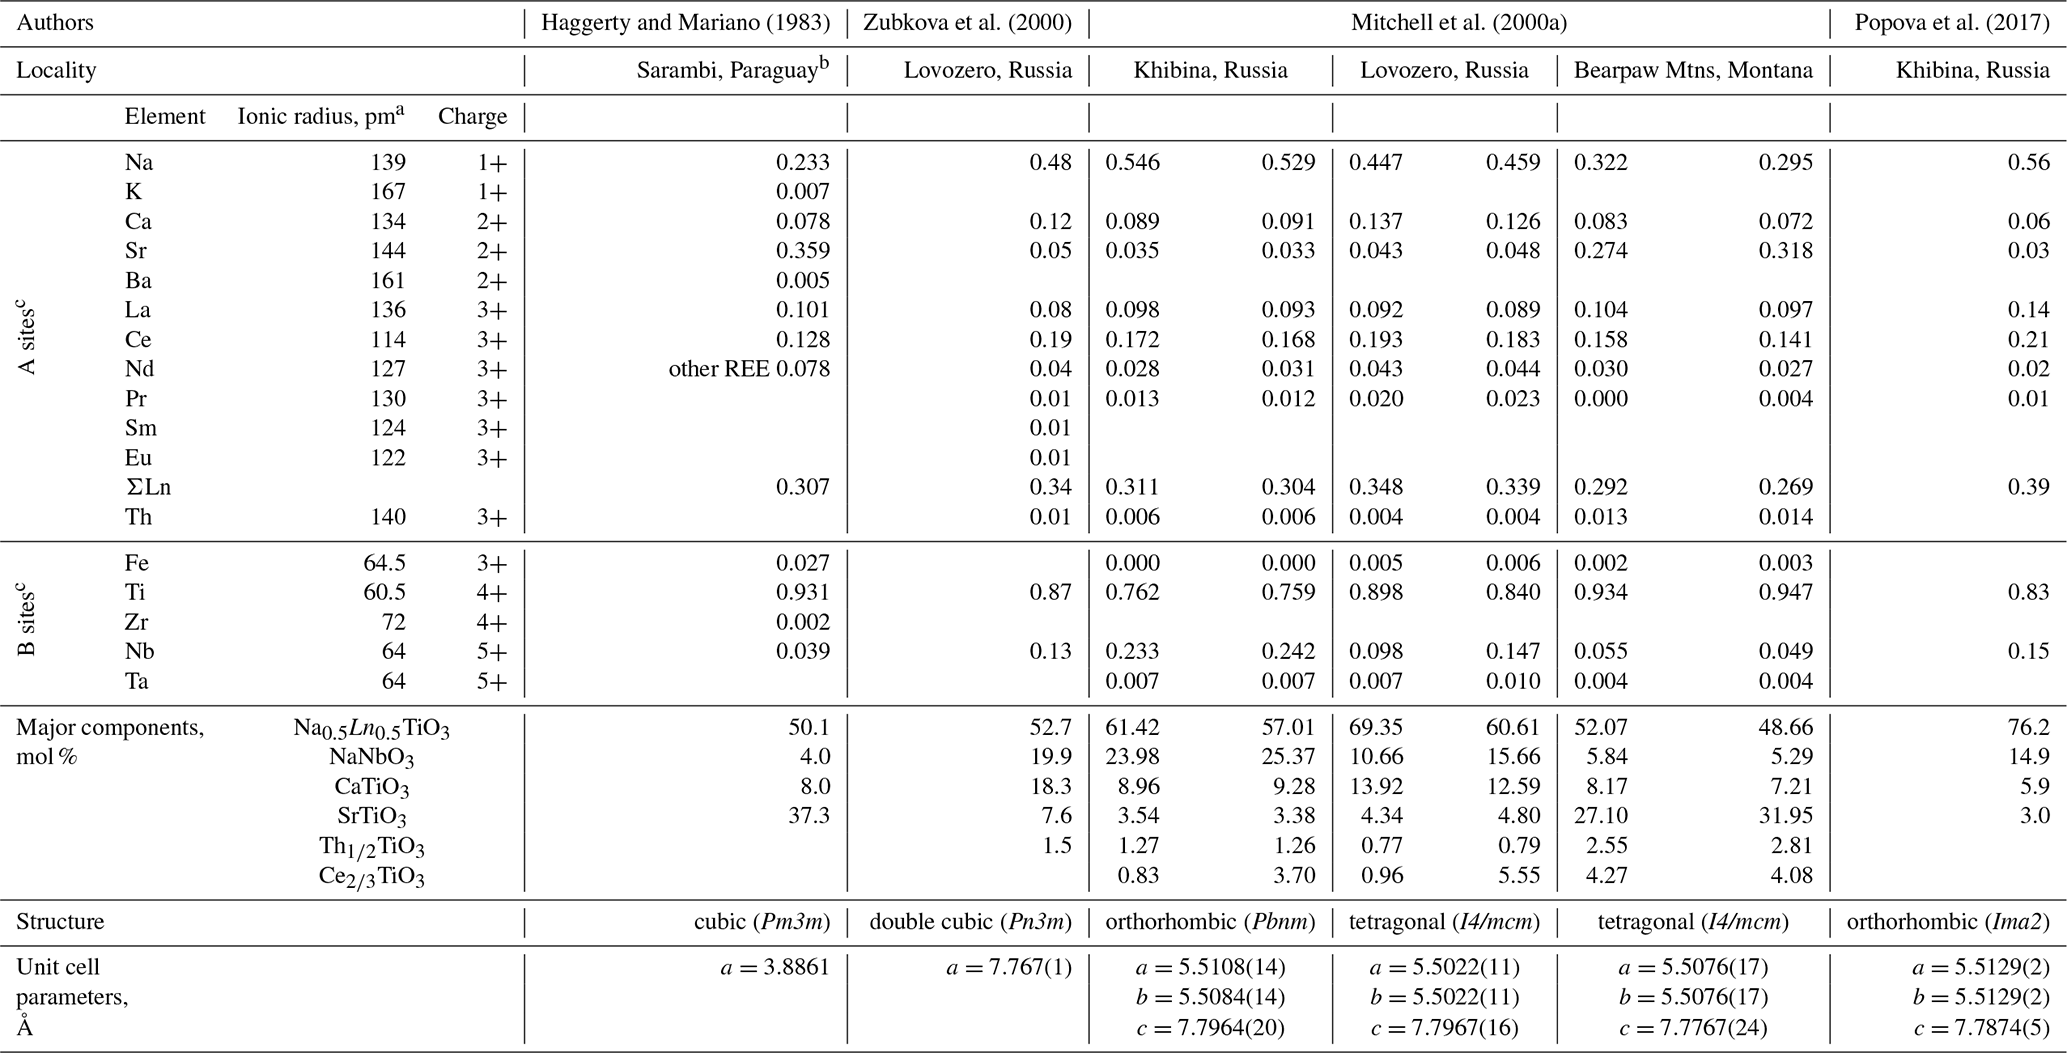
a Shannon's effective ionic radii (Alsalman et al., 2023; Baloch et al., 2021; Shannon, 1976). b Average of the two T591R samples of Sr-loparite. c Structural formulae based on 3 atoms of oxygen.
Table 2Synthesised perovskite-based compositions and the results of structural analyses.
The genesis of growth twins is commonly attributed to attachment of small crystallites in twinned orientation in the nucleation stage of crystallisation, especially under conditions of supersaturation (Buerger, 1945). The formation of penetration twins, for example, (111) twins in galena, was explained by changes in crystal habit from octahedral to cubic during progressive growth. The initial octahedral crystallites with (111) faces are supposed to facilitate attachment of crystallites in twin orientation, whereas the later change in crystal morphology to cubic results in the development of interpenetrating cubes (Senechal, 1976; Aoki, 1979). Following this mechanism, Pavlushin (2025) recently proposed that diamond interpenetration twins form at an early stage of crystal growth through the coalescence of flat-faced octahedral crystals (fibrous diamond cuboids) in twin orientation. The initial octahedral growth habit of the crystals was inferred based on the presence of an octahedral growth ridge along the equatorial (111) TB. A similar mechanism, but at the level of a unit cell, was applied to explain the formation of hydrothermally synthesised BaTiO3 interpenetration twins when the starting TiO2 powder is pre-treated to contain face-sharing Ti2O9 unit groups that act as nuclei for BaTiO3 twins (Qin et al., 2010).
Based on arguments about crystal symmetry and energy of the twin plane, Senechal (1980) proposed an alternative theory of twin formation on a nucleus, likely resulting from impurities. Klapper (1987) suggested that, besides the questions of symmetry and nucleation, the structure of the TBs is key to the occurrence of twinning. This idea was later validated by atomic-scale studies of TBs in natural minerals and synthesised materials using transmission electron microscopy (TEM). It has been shown that the local atomic structure and chemical composition can provide useful insights into the mechanism of twinning. Contact twins can form by the incorporation of impurities into the TB plane, stabilising the local twin stacking. Examples of impurity-induced defects are beryllium-induced (111) twins in MgAl2O4 spinel (Daneu et al., 2007a; Drev et al., 2013); (111) twins in BaTiO3 that form during sintering under reducing conditions, triggering reduction of Ti4+ to Ti3+ (Rečnik and Kolar, 1996); and Cu-rich {110} TBs in interpenetration twins of pyrite (Rečnik et al., 2016). These TBs have lower formation energies than the main phase. Therefore, crystals or grains, in which such interfaces nucleate, exhibit accelerated growth along these contacts, as long as the conditions for their formation are fulfilled. Growth twins can also form by epitaxial growth on a structurally related nucleus or by topotaxial exsolution from a structurally related phase. Typical examples are corundum-/rutile-type intergrowths (Daneu et al., 2007b, 2014; Rečnik et al., 2015; Padrón-Navarta et al., 2020; Daneu et al., 2022). The differences in the formation mechanism of impurity-induced or epi-/topotaxial twins are reflected in the local atomic structure and composition of the interface, which can be directly studied by atomic-resolution TEM/STEM techniques.
In this work, we analysed the growth sectors and TBs in a sector-zoned interpenetration twin of loparite from the Khibiny region, Kola Peninsula, to provide insight into the formation of these unique twins.
2.1 Morphology of the investigated loparite crystal
For our study, we used a symmetrically developed interpenetration twin of loparite with a diameter of about 4 mm from Mt Malyi Mannepakhk, Khibiny Massif, Murmansk Oblast, Russia (Fig. 1a). The crystal consisted of obverse (O) and reverse (R) twin domains with cuboctahedral morphology (Fig. 1b), related by a 180° rotation about the [111] axis, consistent with pseudocubic symmetry. Although loparite is not truly cubic, its structure can be described as pseudocubic; for simplicity, this notation is used throughout the paper, except where explicitly stated otherwise. The twin domains are separated by the main (111) twin boundary (marked with a blue line in Fig. 1a) and six {112} twin boundary contacts (marked with red lines in Fig. 1a) that lie perpendicular to the main (111) twin boundary. By analogy with diamond interpenetration twins (Pavlushin, 2025), the (111) TB is the “equatorial junction”, whereas the (112) TBs are “meridional junctions”. In the analysed loparite twin, all TB contacts are enclosed with cubic facets.
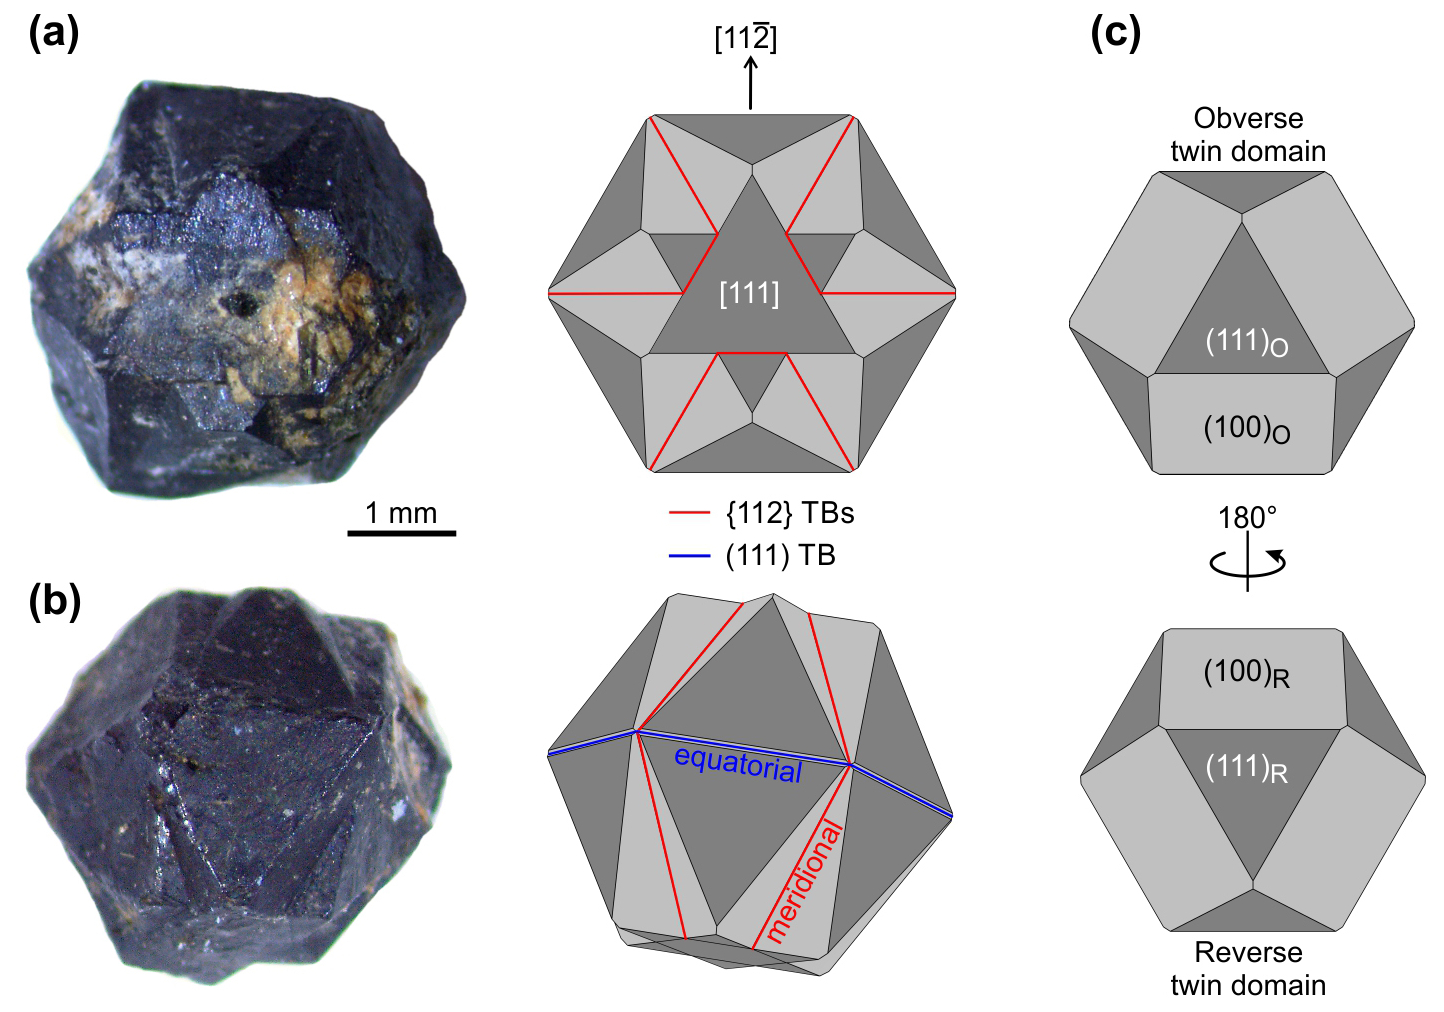
Figure 1Interpenetration twin of loparite from the Khibiny Massif (Kola Peninsula, Russia) used in this study. (a) The crystal is oriented along the [111] zone axis, where {112} TBs are oriented edge-on. (b) A tilted view of the crystal shows the main (111) TB, which divides the twin into two symmetric halves. (c) The twin is an asymmetric intergrowth of obverse (O) and reverse (R) twin domains with comparable sizes enclosed by {100} and {111} facets (cuboctahedrons), which are rotated by 180° relative to each other.
2.2 Preparation of samples for microstructural and nanoscale analyses
For microstructural and atomic-scale analyses, the crystal was first cut along the [111] axis, i.e. parallel to the (111) twin boundary. In this cross-section, the {112} TBs are oriented edge-on, and sharp contacts between the {100} and {111} sectors are visible when observed in composition contrast mode using the backscattered electron (BSE) signal in a scanning electron microscope (SEM; see Fig. 2 in Sect. 3.1). The second cross-section was prepared (nearly) parallel to one of the {112} TBs for edge-on view of the equatorial (111) twin boundary. Both cross-sections were polished for microstructural analyses by SEM and to identify suitable regions for the preparation of focused ion beam (FIB) samples for atomic-scale analyses. For EBSD-EDS mappings, the cross-sections were additionally polished with colloidal silica. Samples for scanning transmission electron microscopy (STEM) were prepared using a dual-beam FIB (Helios Nanolab 650) with Ga+ ions for cutting and thinning the lamellae. In the CS-1, the FIB foils were prepared across the {112} TBs and across the sector boundaries, whereas in the CS-2, the FIB lamellae were cut perpendicular to the {111} twin boundary. In both CSs, the lamellae were oriented close to one of the pseudocubic 〈110〉 zone axes.
2.3 Electron backscatter diffraction (EBSD)
The EBSD-EDS mappings were conducted on non-coated sections under low-vacuum conditions using a Zeiss EVO-MA 15 SEM at the Instituto Andaluz de Ciencias de la Tierra (Granada, Spain), equipped with an Oxford Instruments Nordlys Nano EBSD and Oxford UltimMax-170 EDS detectors. It was set to a 17 kV acceleration voltage, 24 mm working distance, and a probe current < 500 pA, with 4×4 binning, low (0) gain, and step sizes of 14–19 µm for EBSD acquisition. Loparite was initially indexed as orthorhombic (Mitchell et al., 2000a) based on the structural file (.cif) obtained from the American Mineralogist Crystal Structures Database (code 0005639; Downs and Hall-Wallace, 2003). However, the orientation data were affected by misindexing due to pseudosymmetry (e.g. Fig. 2a). Using the cubic reference structure of tausonite (SrTiO3) provided a statistically more reliable definition of the TBs (see an example of a perpendicular section to the one shown in Fig. 2a indexed with the cubic structure in Fig. S5b).
2.4 Electron probe microanalysis (EPMA)
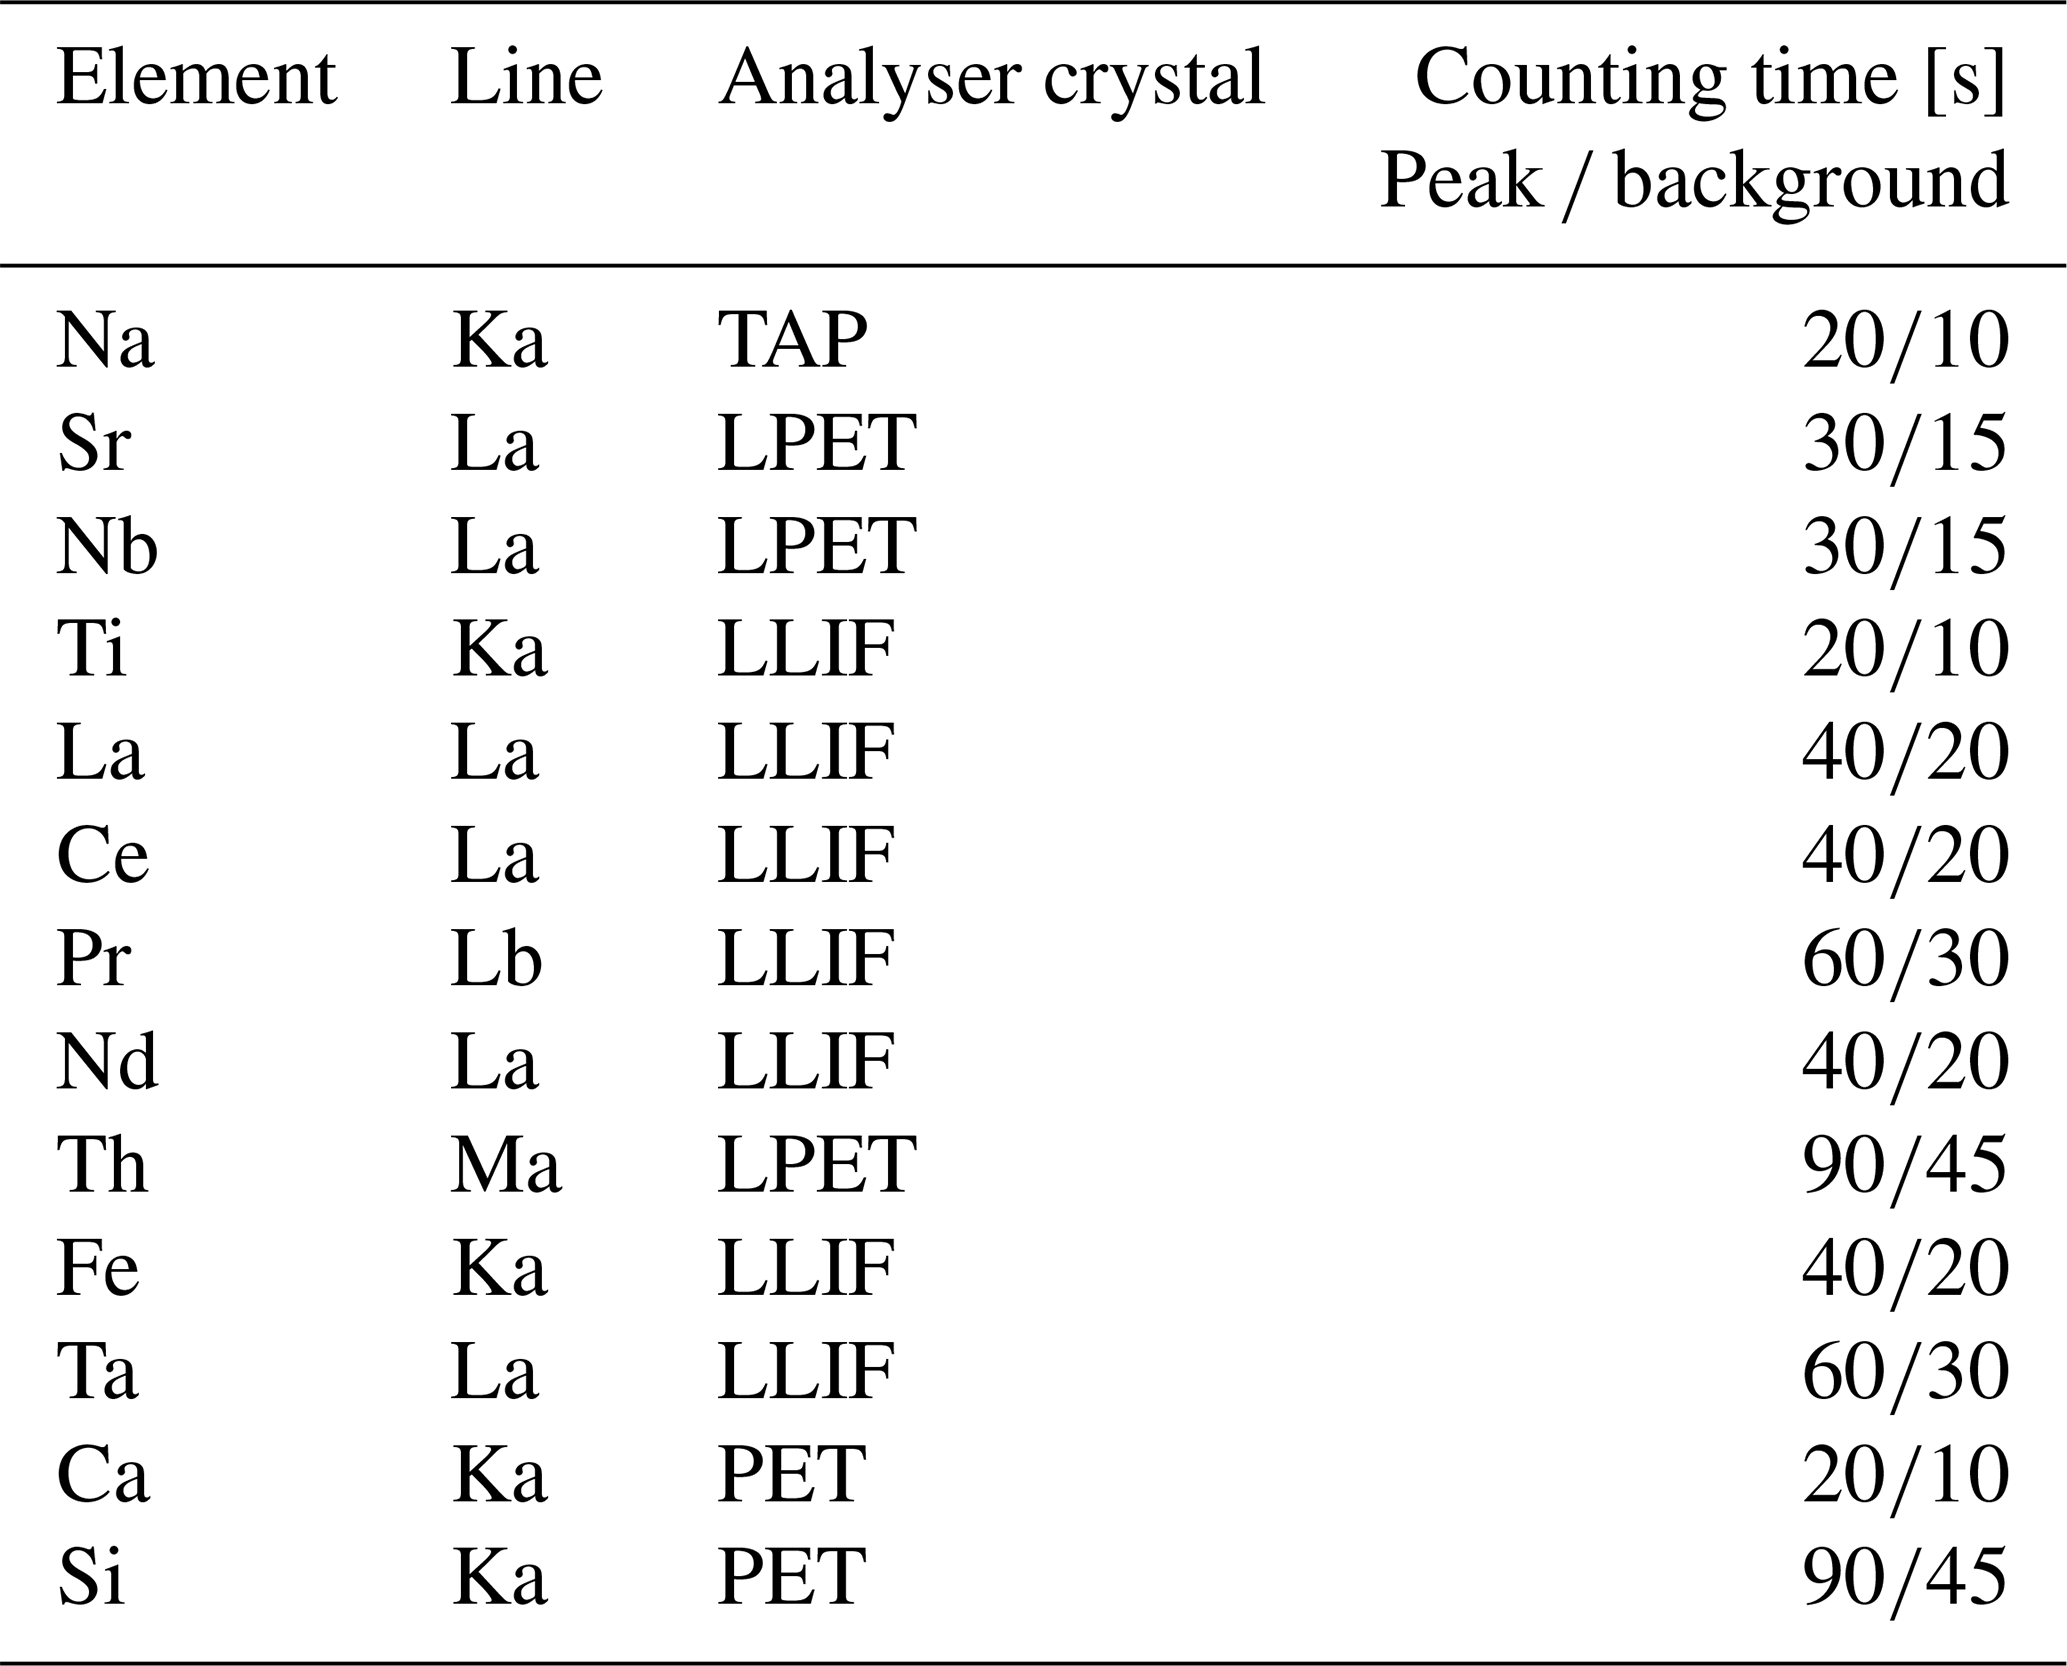
Spatially resolved mineral chemical analyses in the different growth sectors were performed using a CAMECA SXFive field emission gun (FEG) electron probe microanalyser (EPMA) in the EPMA laboratory of the Core Facility Electron Beam Microanalysis, Faculty of Earth Sciences, Geography and Astronomy, at the University of Vienna (Austria). The instrument is equipped with an FEG Schottky emitter and five crystal spectrometers. Quantitative point analyses were performed at an acceleration voltage of 15 kV and 31 nA beam current. The analytical settings used for the different elements are listed in Table 3. Natural and synthetic mineral standards were used for calibration.
2.5 Laser ablation–inductively coupled plasma–time-of-flight–mass spectrometry (LA-ICP-TOFMS) mapping
Experiments were performed with an Analyte G2 193 nm ArF* excimer laser ablation system (Teledyne Photon Machines Inc., Bozeman, MT) equipped with a standard two-volume ablation cell (HelEx II). The LA system was connected to a time-of-flight ICP-MS instrument (Vitesse, Nu Instruments (Wrexham, UK)) via the Aerosol Rapid Introduction System (ARIS) coupled to the LA Adaptor Assembly glass expansion unit (Glass Expansion Inc., Pocasset, MA), a long-pulse module with a total aerosol particle washout time of approximately 100 ms. The parameters were set for the highest ratio and best image quality according to Van Elteren et al. (2019).
2.6 Quantitative scanning transmission electron microscopy (STEM)
STEM studies were performed using a probe-corrected atomic-resolution microscope (JEOL ARM200 CF, Jeol Ltd., Tokyo, Japan) operated at 200 kV and equipped with a high-angle annular dark-field (HAADF) detector with inner and outer semi-angles of 68 and 180 mrad, respectively. EELS spectra were acquired for thickness determination using the Gatan DualEELS Quantum ER spectrometer. Before the analyses, the FIB lamellae were coated with a 1–2 nm amorphous carbon layer (PECS 682, Gatan Inc., Pleasanton, USA) to enhance sample stability under the high-energy electron beam.
For quantitative analysis of experimental atomic-scale HAADF-STEM images, the atomic column intensities were normalised by subtracting the detector background signal (LeBeau et al., 2008). The local maxima in the images were determined using the Find Maxima algorithm in ImageJ. Pixel intensities of each atomic column were integrated within an approximated 2D Gaussian profile. The mask size for determining atomic column intensities was set to approximately the full width at half maximum (FWHM) of the atomic column intensity profiles.
To quantitatively evaluate HAADF-STEM images obtained in cubic and octahedral growth sectors, experimental images were compared with simulations of predicted structural models. Structural models of both sectors were prepared based on the orthorhombic crystal structure of the Khibina loparite(-Ce) determined by Mitchell et al. (2000a) (Table 1). Structural data (the CIF file) were obtained from the American Mineralogist Crystal Structures database (no. 0005639) (Downs and Hall-Wallace, 2003). The starting composition was modified to prepare disordered and partially ordered structural models of loparite, as observed by HAADF-STEM. Due to the complex chemical composition and variable average atomic column compositions, models with 12×8 pseudocubic unit cells were constructed to ensure statistically relevant information in the simulated images and for comparison with experimental images. The average composition of atomic columns was adjusted based on EPMA using custom-written Python scripts. Separate models were prepared for each analysed thickness (4.8, 9.8, 19.7, 29.6, and 59.5 nm) to ensure comparable average compositions across models with different thicknesses. Structural models were visualised using Vesta (Momma and Izumi, 2011).
Simulations of HAADF-STEM images were carried out using the quantitative image simulation software QSTEM, employing the multislice method and the frozen-phonon approximation (Koch, 2002). The following microscope parameters were used: acceleration voltage 200 kV, chromatic aberration Cc 1.1 mm, probe convergence semi-angle 24 mrad, annular detector angular range from 68 to 180 mrad, and energy spread dE=0.4 eV. A total of 30 phonon configurations at a temperature of 300 K were calculated with included thermal diffuse scattering (TDS), produced by inelastic electron interactions with phonons. Absolute intensities of the individual atomic columns in simulated HAADF images were determined using a procedure similar to the one for the experimental images (without the background subtraction).
For atomic-scale EDXS mapping, we used the aberration-corrected microscope Spectra 300 (Thermo Fisher Scientific, the Netherlands), operated at 200 kV and equipped with a high-brightness field-emission gun (X-FEG) and a Super-X EDX detector with four 30 mm2 windowless, collimated SDDs. The maps were acquired on 200×200 px areas with a pixel size of 23 pm and a dwell time of 20 µs.
3.1 Cross-section parallel to the (111) twin boundary
Figure 2 shows the analysis of a polished cross-section near the central part of the crystal parallel to the (111) twin boundary (the virtual centre of the twin lies above the cross-section plane). The section was examined by electron back-scatter diffraction (EBSD; Fig. 2a) for orientation mapping and back-scattered electron imaging (SEM-BSE; Fig. 2b) to reveal compositional inhomogeneities. The EBSD map confirmed that the crystal is composed of two twin domains. Analysis of the orientation data using cubic indexing with the Mtex toolbox (Hielscher and Schaeben, 2008; Bachmann et al., 2010) revealed a unique twin orientation relation plane and direction. The TBs are related by a 60° rotation around the common [111] axis, and the twin contacts between the two twin domains extend along {112} planes. The {112} TBs extending from the centre towards the edges of the crystal are edge-on oriented and connected by {112} twin contacts lying inclined with respect to the viewing direction. Imaging with SEM-BSE revealed areas with distinctly higher and lower signal intensities (Fig. 2b), indicating the presence of regions with different average chemical compositions. They are separated by sharp contacts, which lie parallel to the {112} TBs but do not coincide with them. The brighter and darker regions are equivalent in both twin domains, indicating their synchronous growth during crystallisation. Such regions with different chemical compositions inside a single crystal are known as growth sectors or sector zoning and form as a result of the incorporation of cations with various sizes and charges along different crystallographic directions (Dowty, 1976; Watson and Liang, 1995; Rakovan, 2009). The darker regions correspond to the {111} sectors, whereas the brighter regions correspond to the {100} sectors. Similar sector zoning was observed in loparites from Mont Saint-Hilaire, Quebec, Canada (Chakhmouradian et al., 2007).
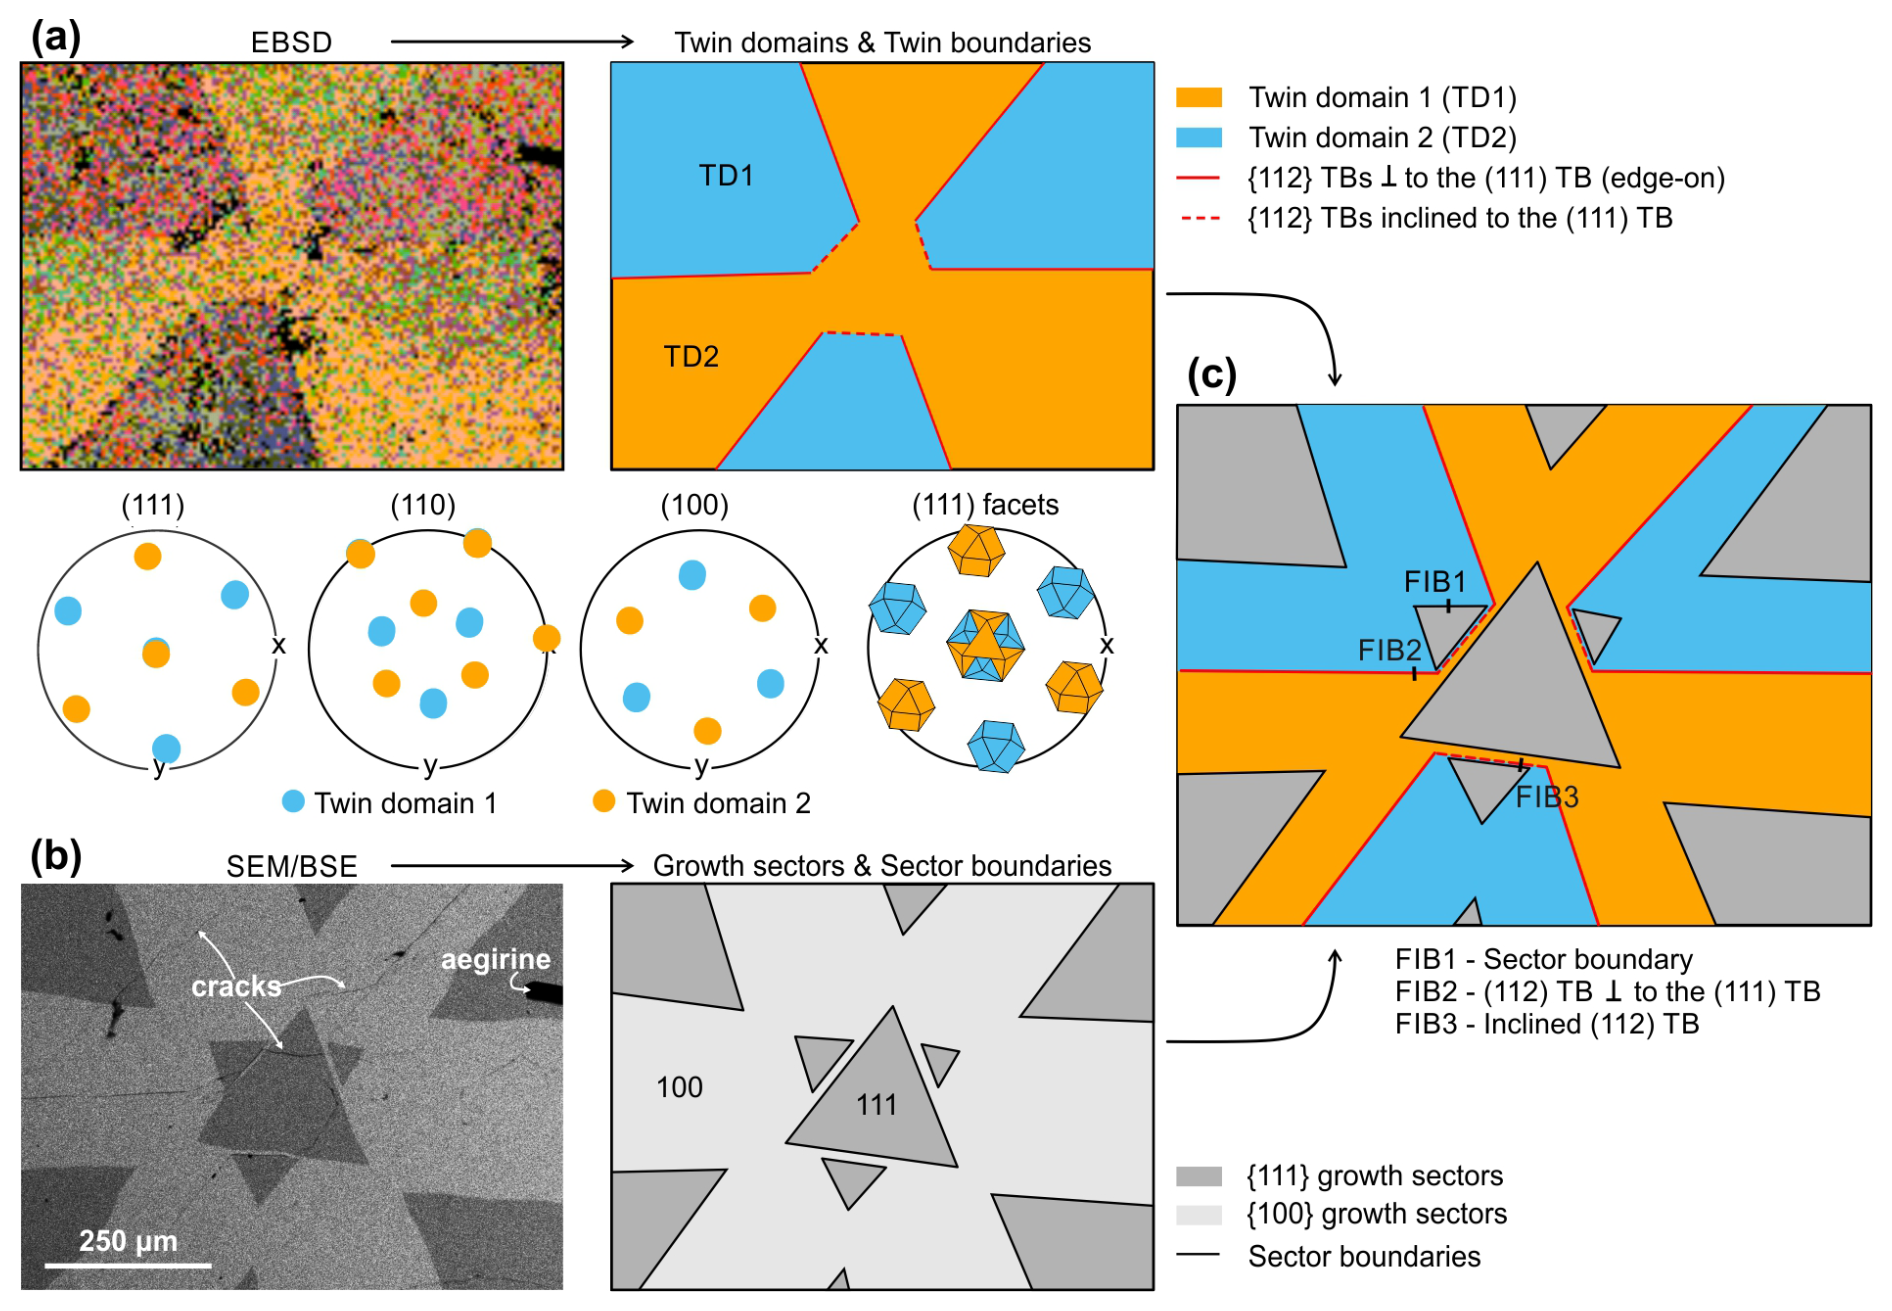
Figure 2(a) EBSD analysis of the central part of the (111) cross-section with pole figures and schematic presentation of the twin domains and TBs. (b) Backscattered SEM image of the cross-section showing areas with different composition indicating the presence of growth sectors in 111 and 100 directions. (c) Schematic presentation of the complex crystal cross-section with the location of the FIB cuts for the TEM study.
Figure 2c schematically shows the complex configuration observed in the loparite cross-section parallel to the [111] zone axis, including twin and sector boundaries. It can be observed that the {112} TBs always lie within the cubic sectors. In addition to sector zoning, SEM analysis revealed a few larger inclusions of aegirine (NaFeSi2O6) and many microcracks, which are typically filled with a phase that appears darker in SEM-BSE images. This indicates that the cracks formed already during loparite crystallisation, and the openings were filled with the surrounding melt. Interestingly, in addition to numerous randomly oriented cracks penetrating the crystal, cracks are observed along nearly all TB contacts. Some of these cracks were closed, while most of them were open.
3.2 Chemical composition of the {100} and {111} growth sectors
Chemical composition of both growth sectors was analysed using EPMA and LA-ICP-TOFMS. EPMA analyses were performed as point analyses along line profiles in the {100} and {111} growth sectors in two neighbouring twin domains (TD1 and TD2) separated by a {112}-type TB, as shown on the cross-section in Fig. 3a. The results of EPMA measurements are graphically presented in Fig. 3b, and detailed numerical results are given in Table S1.
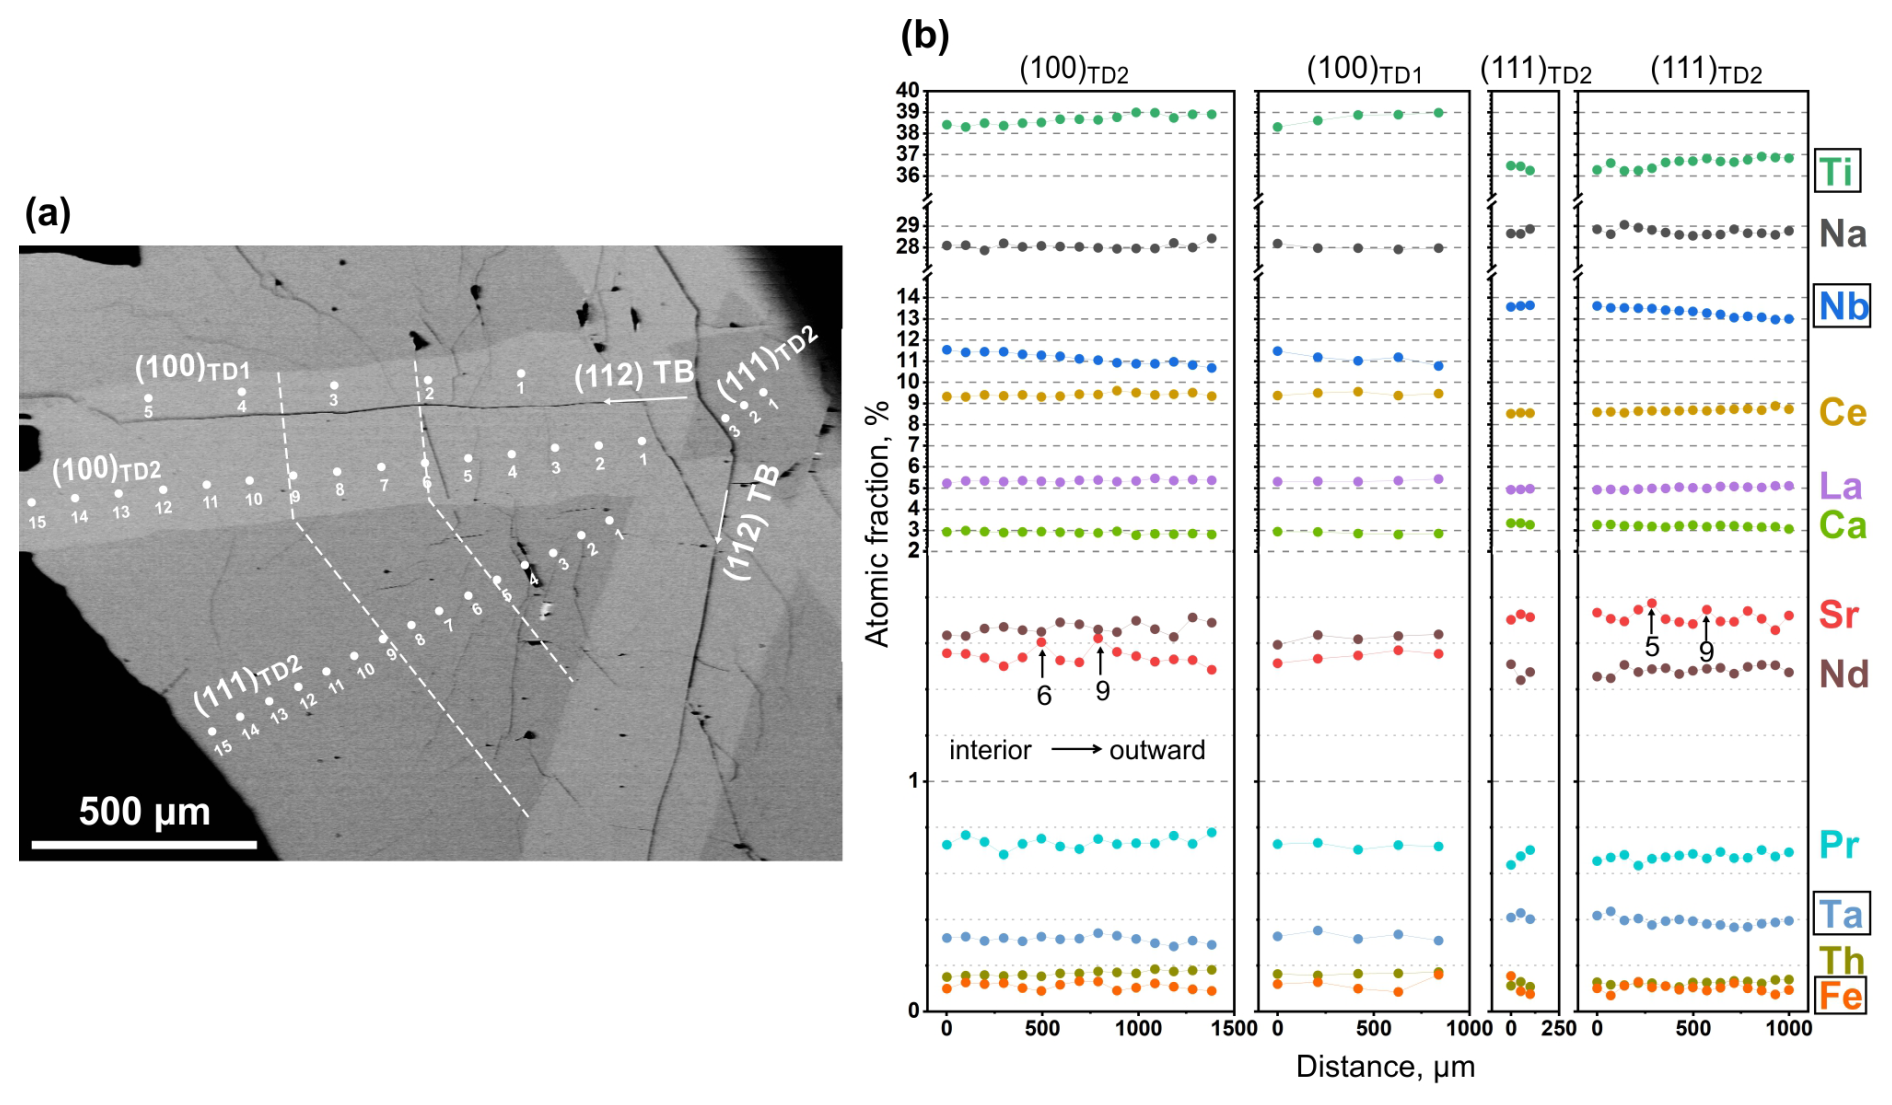
Figure 3(a) Low-magnification SEM image of the 111 cross-section with marked EPMA point analyses recorded as profiles in both growth sectors and twin domains. (b) Charts with the results in atomic percentages recalculated to the overall full occupancy of A and B sites. The original data are given in Table S1.
The main A-site elements are Na, Ce, La, Nd, Pr, Ca, and Sr, which represent ∼98 at. % of all elements on the A sites, whereas ∼99 at. % of all B sites are occupied by Ti and Nb. Other elements are present in fractions below 1 at. % and include Th on the A sites and Ta and Fe on the B sites. The compositions of the growth sectors in the region near the central part of the crystal, where FIB foils for structural analyses with HAADF-STEM were prepared, are given in Table 4.
Table 4Chemical compositions of (100) and (111) sectors in atomic fractions, recalculated to fully occupied A and B sites. Bold numbers signify a sector enriched in a certain element. The composition of the Khibina loparite reported by Mitchell et al. (2000a) is given for comparison.
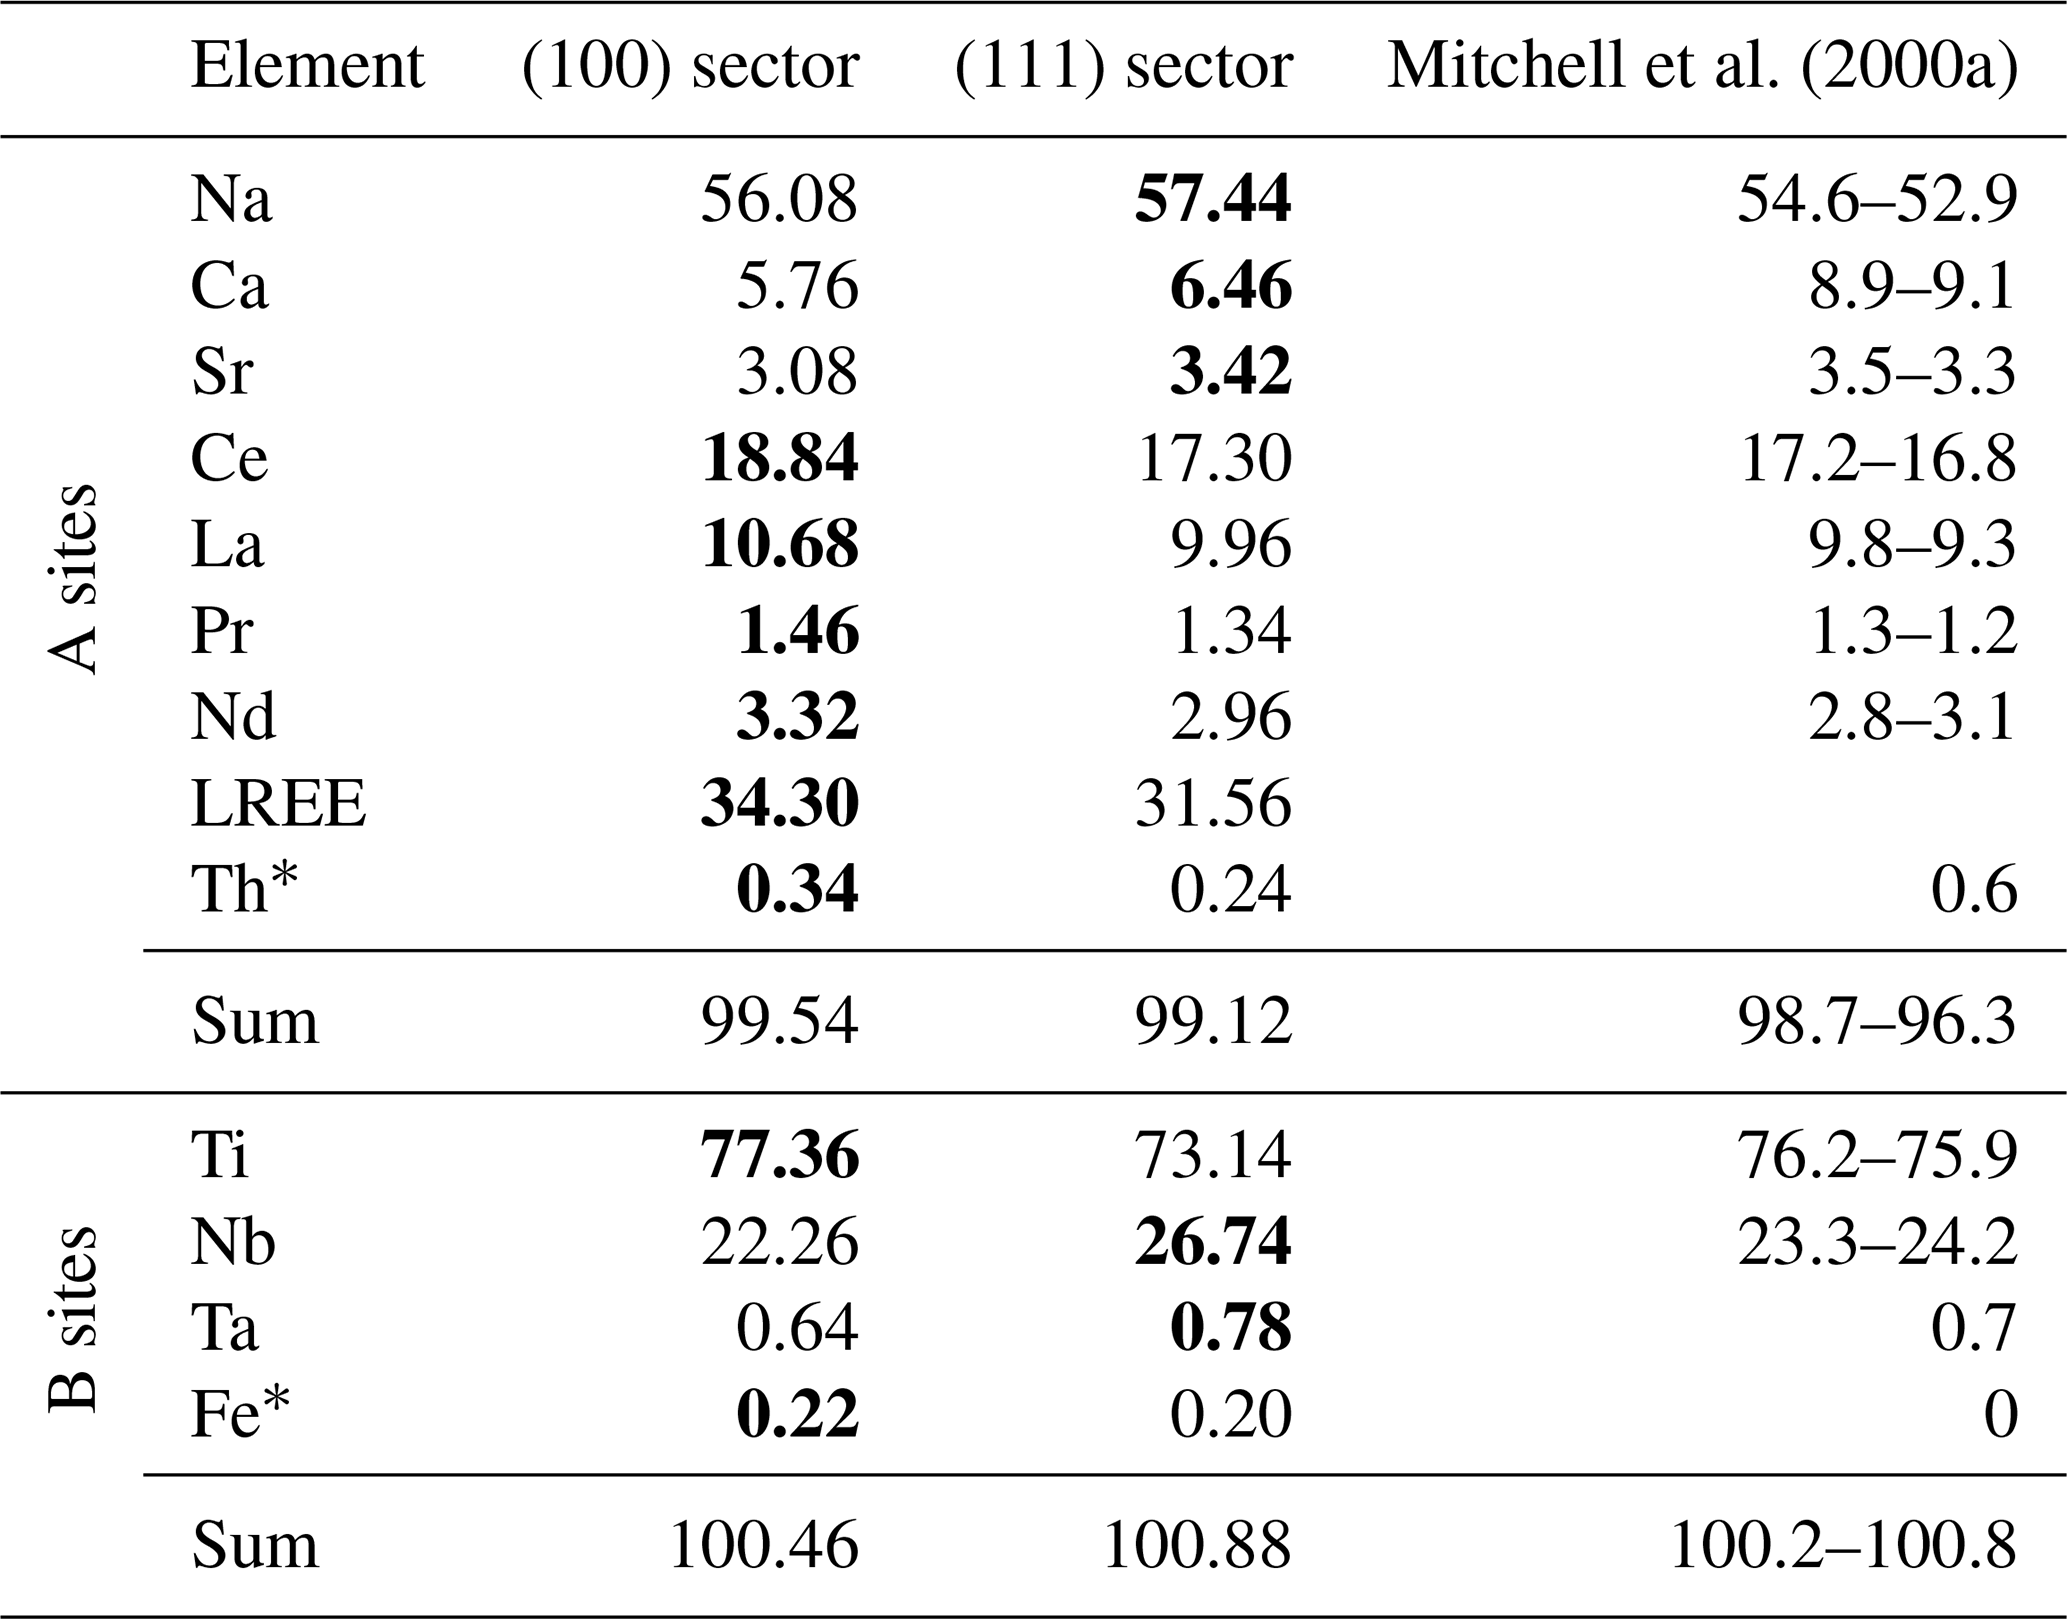
∗ Th and Fe were not considered in the preparation of structural models for quantitative HAADF-STEM analyses due to their low fractions.
The overall composition of the analysed crystal is close to that of the Khibina loparite studied by Mitchell et al. (2000a), which was classified as niobian–calcian loparite(-Ce). While EPMA was used to quantify the main elements in the loparite twin domains, LA-ICP-TOFMS was used to identify elements present in minor (trace) amounts. Nineteen additional elements were detected in both growth sectors and nine elements along the cracks (Table 5 and Fig. S1). The mapping has revealed that trace elements also clearly partition into the {100} and {111} sectors and that some elements are present along cracks as well as in the loparite structure. According to EPMA, chemical composition in both growth sectors and in both twin domains is fairly constant from the interior to the edge of the crystal. The concentrations of Na and Nb decrease slightly, whereas the concentration of Ti increases slightly from the interior towards the edge of the crystal; however, the change is small, within 2 at. %, calculated to 100 % occupancy of the specific sites. It is interesting to observe two positive deviations in the Sr concentration within the (100) and (111) sectors of TD2, where the profiles contained more measurement points. If the deviations coincide with the crystal growth front parallel to the crystal facets and indicate a slight chemical change in the melt during the growth, it can be concluded that the growth rate of the {100} facets slightly exceeds the growth rate of the {111} facets.
Table 5Elements present in trace amounts (and undetectable by EPMA, e.g. U) detected by LA-ICP-TOFMS in growth sectors and in the cracks. LA-ICP-TOFMS maps are shown in Fig. S1.
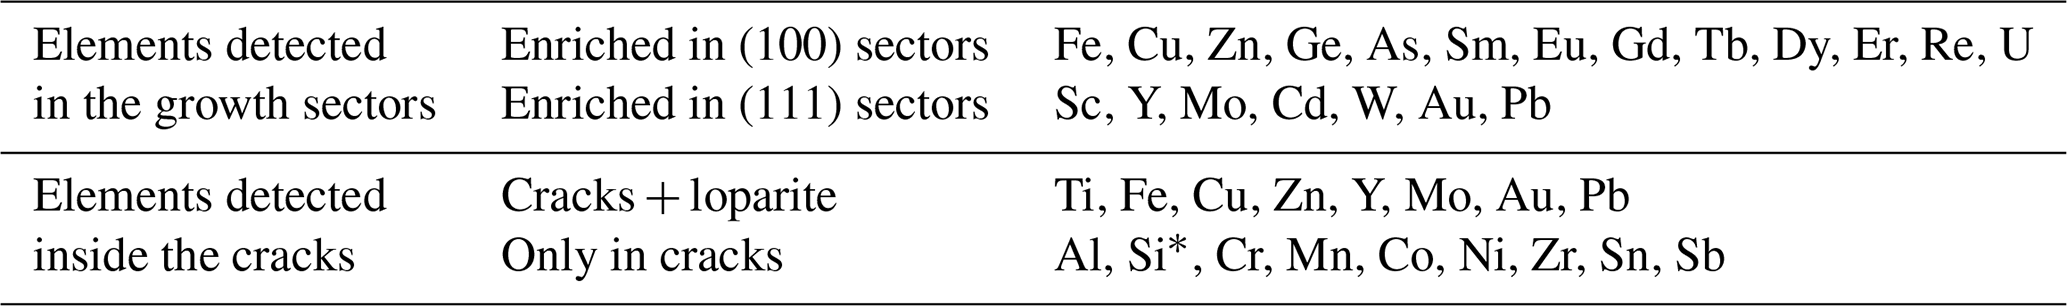
∗ The presence of Si along the cracks was confirmed by STEM/EDS.
3.3 Structural characterisation of the {100} and {111} sectors with STEM
A FIB foil was prepared across a sector boundary that shows distinct contrast in the backscattered SEM image (see inset in Fig. 4a). In the low-magnification HAADF-STEM image, however, the sector boundary is not visible (Fig. S2). The presence of both growth sectors and the rough location of the sector boundary in the sample was confirmed by STEM/EDXS spot analyses, accounting for relative compositional differences between the sectors (e.g. in Nb and Ti; see Table 4). Further analyses have shown that both sectors can be distinguished based on their structural characteristics. Figure 4a is an HAADF-STEM image of loparite along the [110] zone axis across the sector boundary.
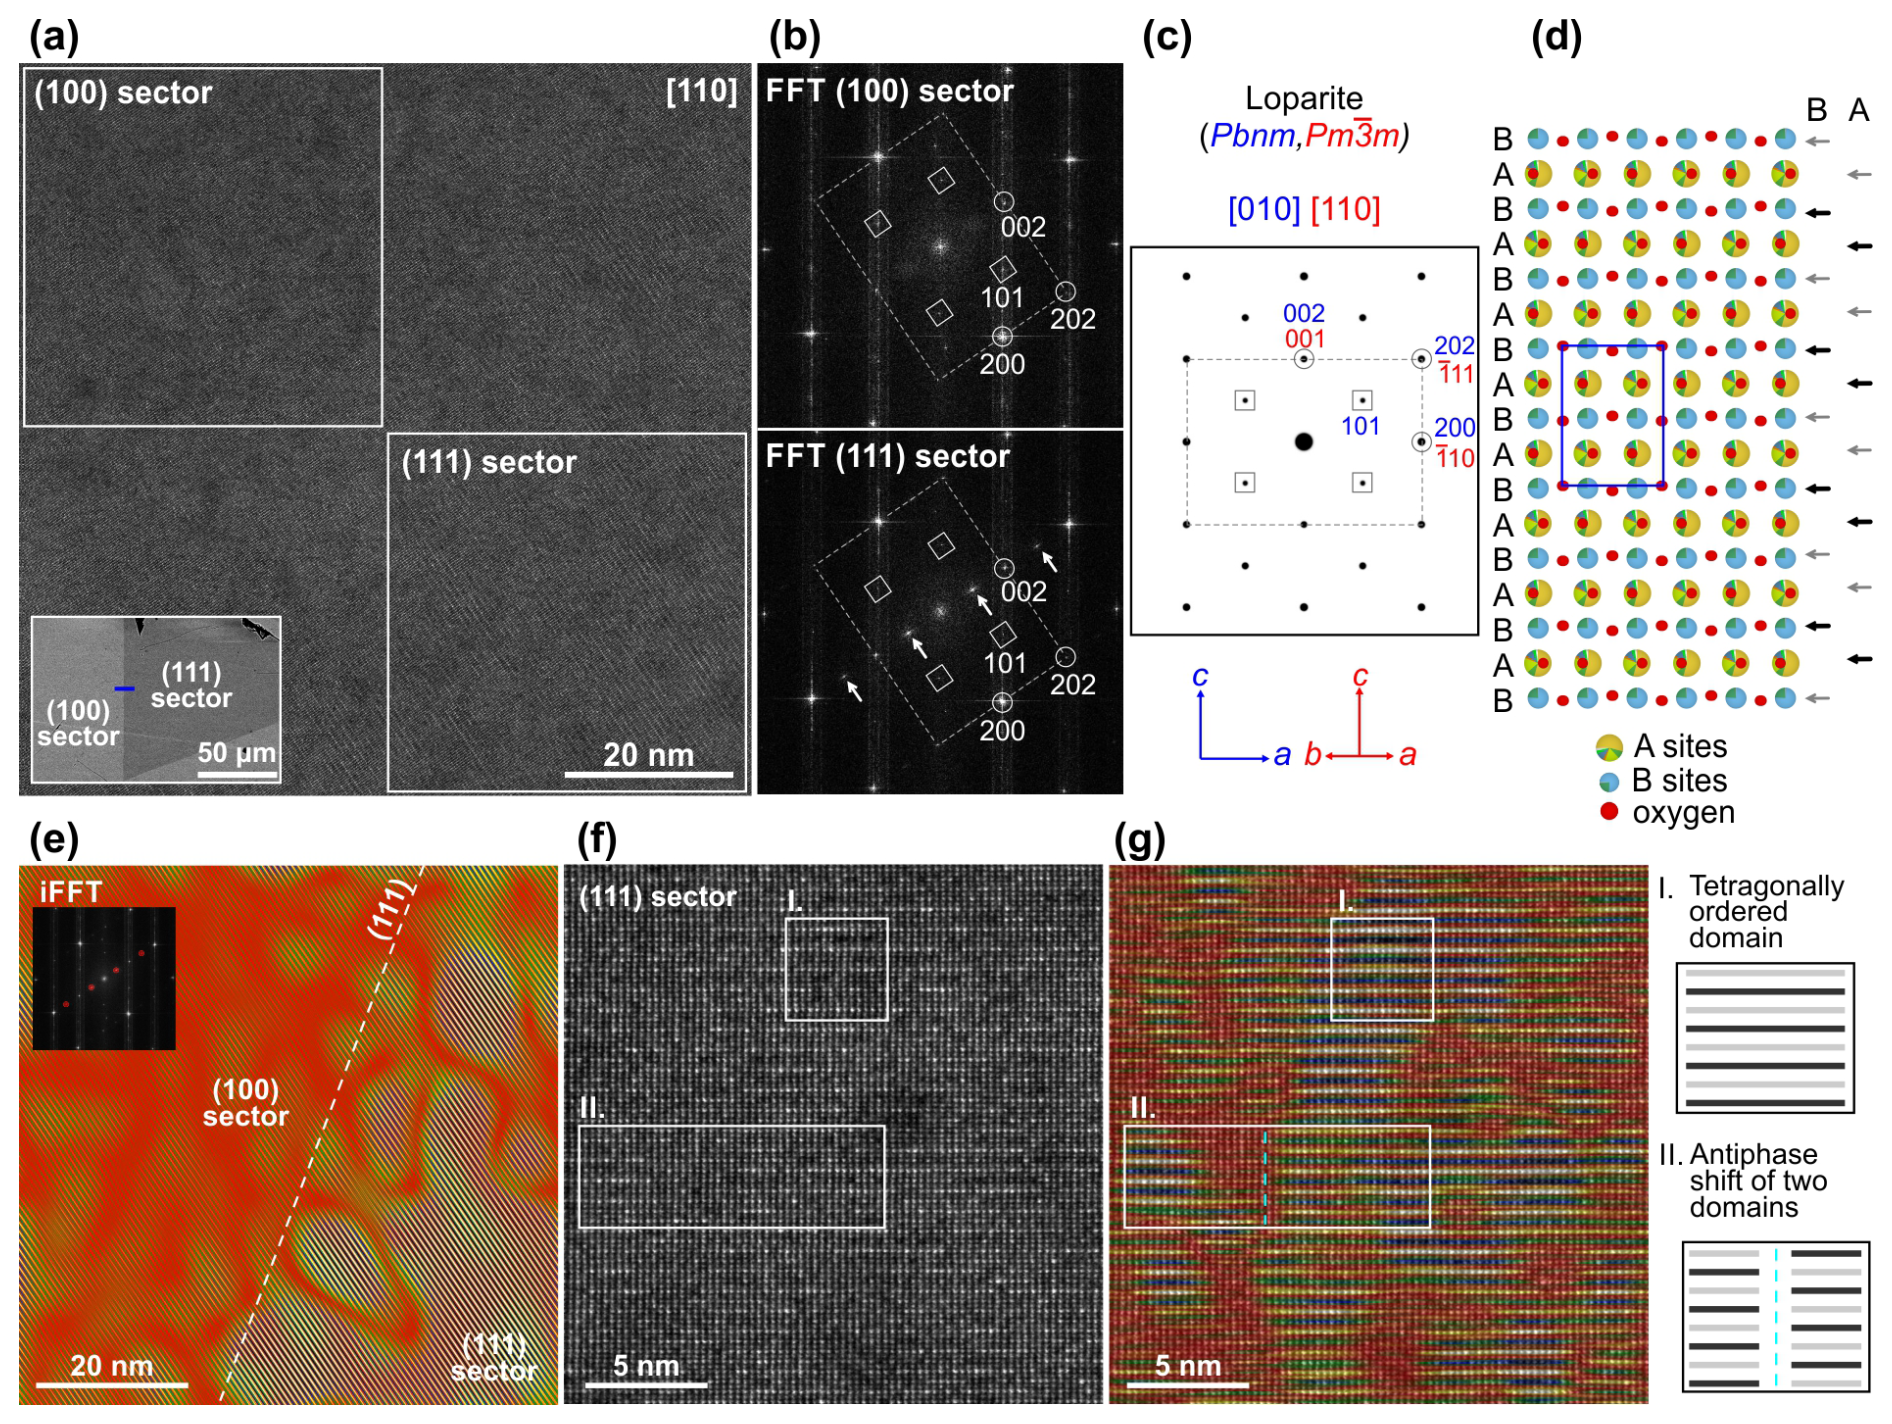
Figure 4(a) HAADF-STEM image of loparite oriented along the [110] pseudocubic zone axis across the sector boundary with marked regions where (b) FFT patterns were calculated. The FFT pattern from the (111) sector contains additional superstructure reflections indicated by arrows. (c) Simulated electron diffraction pattern for orthorhombic loparite indexed using pseudocubic and orthorhombic notations. (d) Loparite structure viewed along [010] (Pbnm) with marked A- and B-type lattice planes along the c axis. Any type of ordering to every second A- or B-type lattice plane (see the arrows on the right side of the model) would yield the superstructure reflections. (e) Inverse FFT (iFFT) image calculated using the additional reflections shows that superstructure ordering is present in the (111) sector. The boundary between the cubic and octahedral sectors follows a (111) lattice plane. (f) High-resolution image of the (111) sector, overlaid with the coloured iFFT image in (g) reveals nanosized domains with distinct tetragonal ordering (situation I). While many domains are in phase, only separated by apparently disordered boundaries, some are separated by an antiphase shift (situation II). Both situations are schematically presented on the right side of the image.
The area appears homogenous and continuously crystalline; however, calculated FFT patterns disclose a significant difference between the (100) and (111) sectors (Fig. 4b). FFT from the (100) sector (upper-left part of the image) contains weak {101} spots and fits to orthorhombic loparite (Mitchell et al., 2000a) oriented along the [010] zone axis (Pbnm). The calculated FFT pattern from the (111) sector (lower-right part of the image) is similar but contains additional diffraction spots between the orthorhombic (002) spots, indicating the presence of higher-order periodicity along the [001] zone axis, marked by arrows in the lower part of Fig. 4b. The calculated FFT pattern for orthorhombic loparite along this orientation is shown in Fig. 4c. A comparison of calculated diffraction patterns along three pseudocubic [110] zone axes of orthorhombic loparite and the corresponding [110] diffraction pattern of cubic tausonite is provided in Fig. S3. Here, the diffraction spots are indexed with orthorhombic (blue) and pseudocubic (red) indices for comparison. The orthorhombic crystal structure of loparite is shown in Fig. 4d. Alternating the composition of the A-type or B-type lattice planes along the c axis would yield superstructure reflections, as presented by the arrows on the right side of the structural model. To examine in which parts of the image shown in Fig. 4a the superstructural ordering occurs, we calculated the FFT pattern of the whole image and then an inverse FFT image, taking into account only the superstructure reflections. The result shown in Fig. 4e reveals that the alternating ordering is present mainly in the (111) sector (right side of the image), whereas it is almost completely absent in the (100) sector (left side of the image). The two regions are separated by a sector boundary, which runs parallel to the (111)-type lattice plane. A more detailed analysis of the (111) sector (Fig. 4f) reveals that tetragonal ordering is not continuous but occurs in the form of nanosized domains. An inverse FFT image was calculated to more clearly visualise areas with tetragonal ordering at atomic scale (Fig. 4g). Within a single domain, alternating lattice planes with higher and lower intensity are clearly visible, as shown in situation I of Fig. 4f–g. Many of the domains are in phase but separated by an apparently disordered region. Sometimes, the domains are separated by an antiphase shift, where a lattice plane with higher intensity meets a lattice plane with lower intensity; such a situation is marked as II in Fig. 4f–g.
3.4 Evaluation of structural ordering in both growth sectors with quantitative HAADF-STEM
Atomic-scale ordering in the cubic and octahedral growth sectors was investigated with quantitative HAADF-STEM, where experimental images are compared to image simulations. Due to the significant variations in the composition of different atomic columns, direct comparison of experimental images with image simulations is not possible. Instead, we used statistical parameters, such as relative variations in A- and B-type atomic column intensities and their intensity ratios, for indirect comparison of experimental images with image simulations. For the (111) sector, the analyses were combined with atomic-scale STEM/EDXS mapping.
3.4.1 Analysis of the (100) growth sector
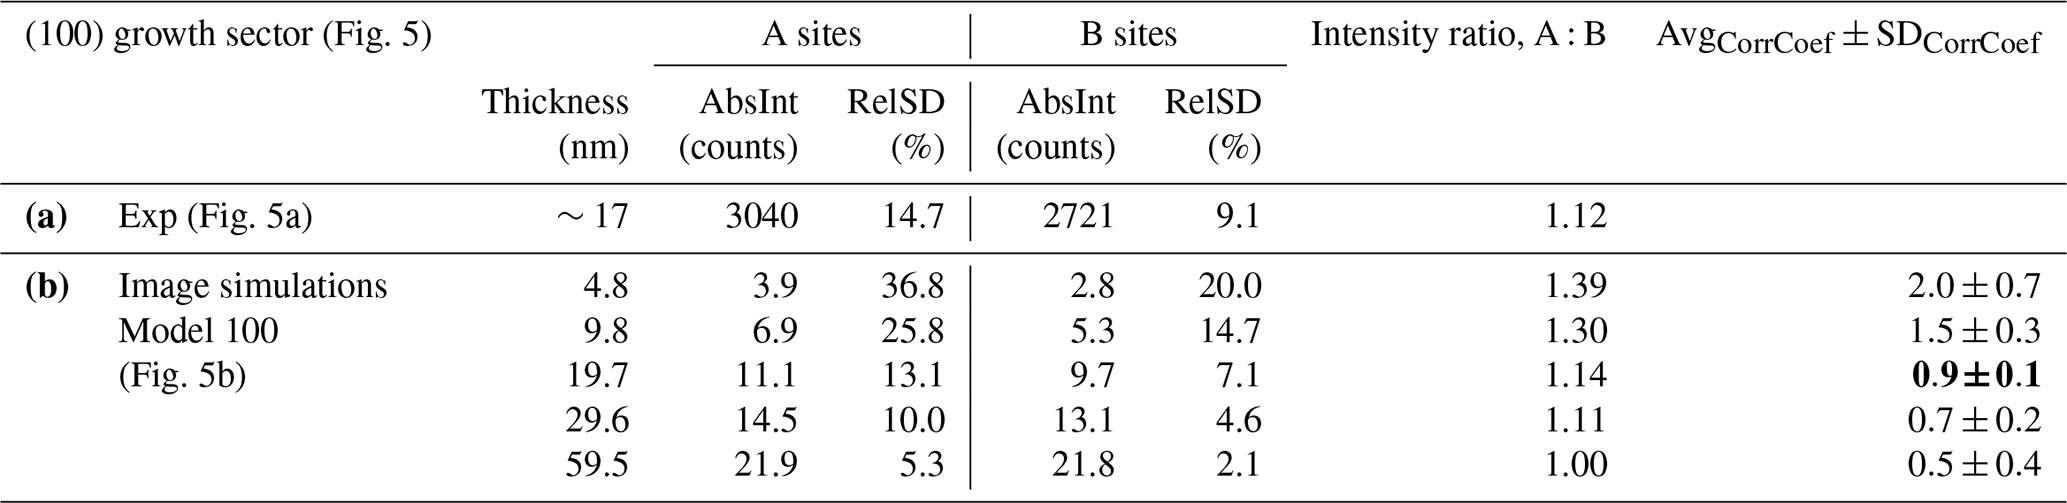
Figure 5a is an unprocessed high-magnification HAADF-STEM image of loparite acquired in the (100) sector oriented along the [110] zone axis with A- and B-site lattice planes alternating along the c axis. A sample thickness of around 17 nm was determined from the EELS low-loss spectrum. In the first step, absolute intensities of all atomic columns were measured (in counts). The A-site and B-site columns are easily distinguished based on the difference in their average intensities, since the average intensity of the B-site columns is lower. The results of the analyses obtained from the experimental image are given in Table 6a. In addition to average intensities, relative standard deviations of the A- and B-site columns were determined. The results show that in the (100) sector, subsequent lattice planes of the same type (A or B) show comparable intensities.
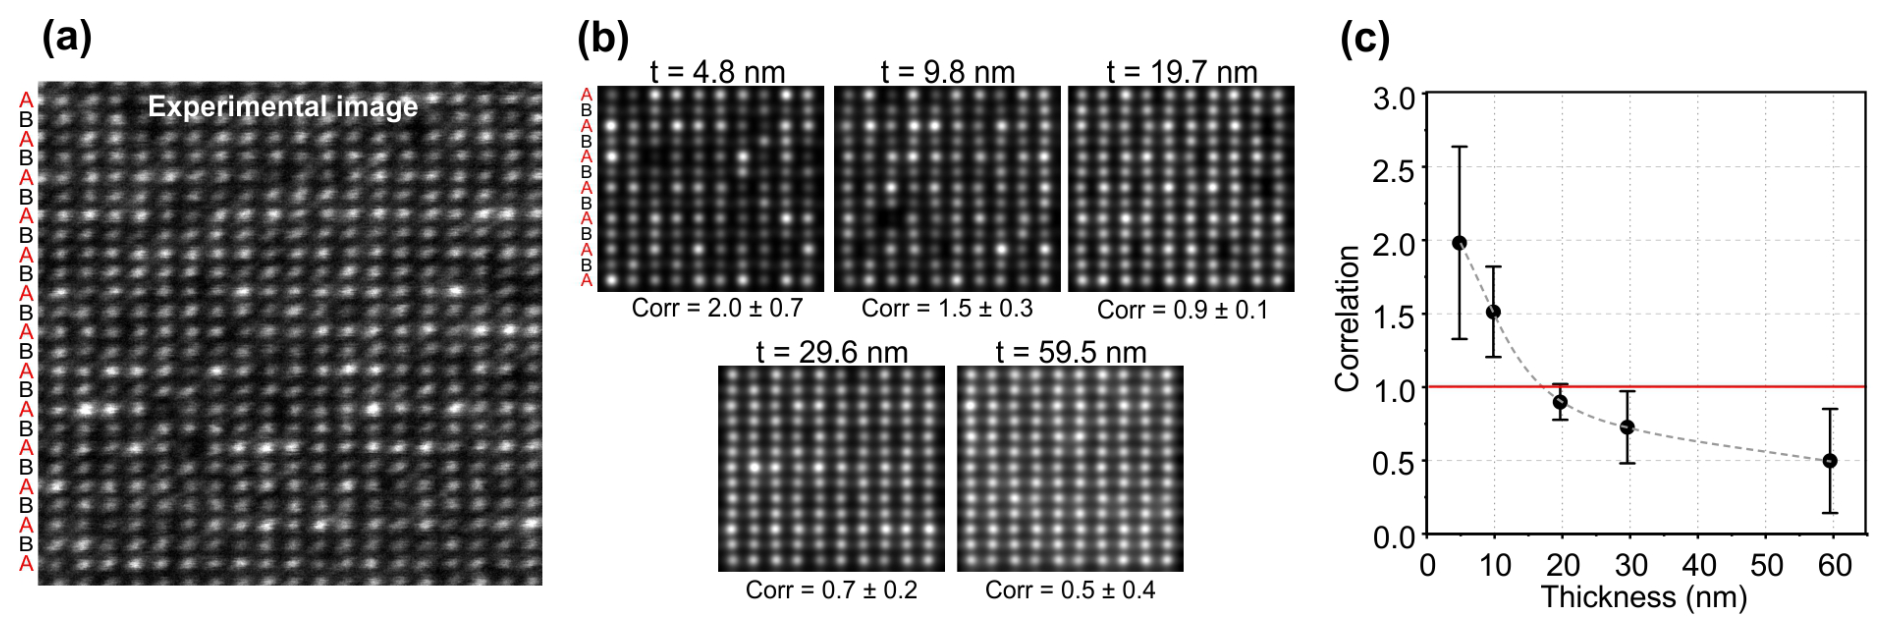
Figure 5Quantitative HAADF-STEM analysis of the (100) sector. (a) Experimental image and (b) image simulations for loparite model with composition as given in Table 3 and for different crystal thicknesses.
In the next step, the results obtained from the experimental image were compared with those from image simulations. A detailed description of the procedure is given in the Supplement (Sect. S1). For simulations of the (100) sector, we prepared structural models with thicknesses of 5 and 60 nm (Model 100) and random distributions of A- and B-site elements to the two types of structural sites based on the composition determined by EPMA (Table S2). Models with different thicknesses were prepared to observe trends in changes in atomic column intensity with increasing crystal thickness in phases of complex composition. Image simulations for five crystal thicknesses are shown in Fig. 5b. The results of image simulation quantifications are given in Table 5b.
For comparison of image simulations with the experimental image, we used intensity ratios between A and B atomic columns and the standard deviations of their intensities, a parameter mainly affected by the mixed occupancy of atomic columns with low- and high-Z elements. Based on the comparison of the three parameters, the correlation coefficient with standard deviation for each image was calculated. Values closer to unity (1) and with a smaller standard deviation indicate better agreement between the simulation and the experimental image.
The results of the correlation analysis are shown in Table 5 and graphically presented in Fig. 5c and show that the best match is obtained for the simulation with a thickness of 19.7 nm, which is close to the measured thickness of our sample.
Table 6Quantitative analysis of (a) the experimental image of the (100) sector (Fig. 5a) and (b) image simulations of the model with the average composition given in Table S3 and different thicknesses (Fig. 5b). The correlation between the image simulations and the experimental image was calculated using the geometric mean approach taking into account the characteristic parameters, i.e. the relative standard deviations (SD) of the A- and B-site intensities and A : B intensity ratio. The 19.7 nm model shows the average correlation coefficient closest to unity and the smallest standard deviation (bold), indicating the best agreement with the experimental image.
∗ Description of the calculation in Sect. S1.
The analysis of image simulations of crystals with different thicknesses shows that the relative standard deviations of the A- and B-site columns decrease rapidly with sample thickness. At small thicknesses, the relative standard deviations reach even 20 %–35 % of the absolute intensity, but already for 19.7 nm, the values drop to 10 %–15 % and at 60 nm even below 5 % for the A-site columns and below 1 % for the B-site columns. Also, the A : B intensity ratio decreases from 1.39 to unity, meaning that with increasing crystal thickness, the intensities of the different atomic columns become more and more similar. This highlights the importance of thin samples in quantitative HAADF-STEM analysis, especially for compositionally complex phases or high-entropy materials, which are gaining attention as advanced functional materials (Jiang et al., 2018).
3.4.2 Analysis of the (111) growth sector
Superstructure ordering in the (111) sector was first investigated using atomic-scale STEM/EDXS mapping (Fig. 6). The analysis was performed in a slightly thicker part of the sample to achieve a higher count rate. The results indicate that Ti and Nb are randomly distributed across all B sites, without preferential ordering to subsequent lattice planes, similar to the (100) sector. The superstructure ordering therefore stems from ordering to subsequent A-type lattice planes (denoted as A1 and A2) and not the B-type lattice planes. Indeed, varying intensities of the A1 and A2 lattice planes are clearly visible already in the HAADF image, where the contrast is approximately proportional to the average atomic number of the column raised to the power of 1.7. Alternating enrichment with Ce and La in A1 lattice planes is the most significant feature of this sector. It is expected that all LREEs show a similar trend, but their fraction in the sample is too low for reliable atomic-scale EDS mapping. The LREEs with a high atomic number (ZLREE>57) occupy about one-third of all A-type structural sites and contribute to the high intensity of the atomic columns in HAADF-STEM images. The difference between the intensities is not as pronounced, suggesting that the fraction of Na in the subsequent lattice planes is only slightly different. Sr and Ca occupy 10 at. % of all A sites and appear to be distributed equally between the two types.
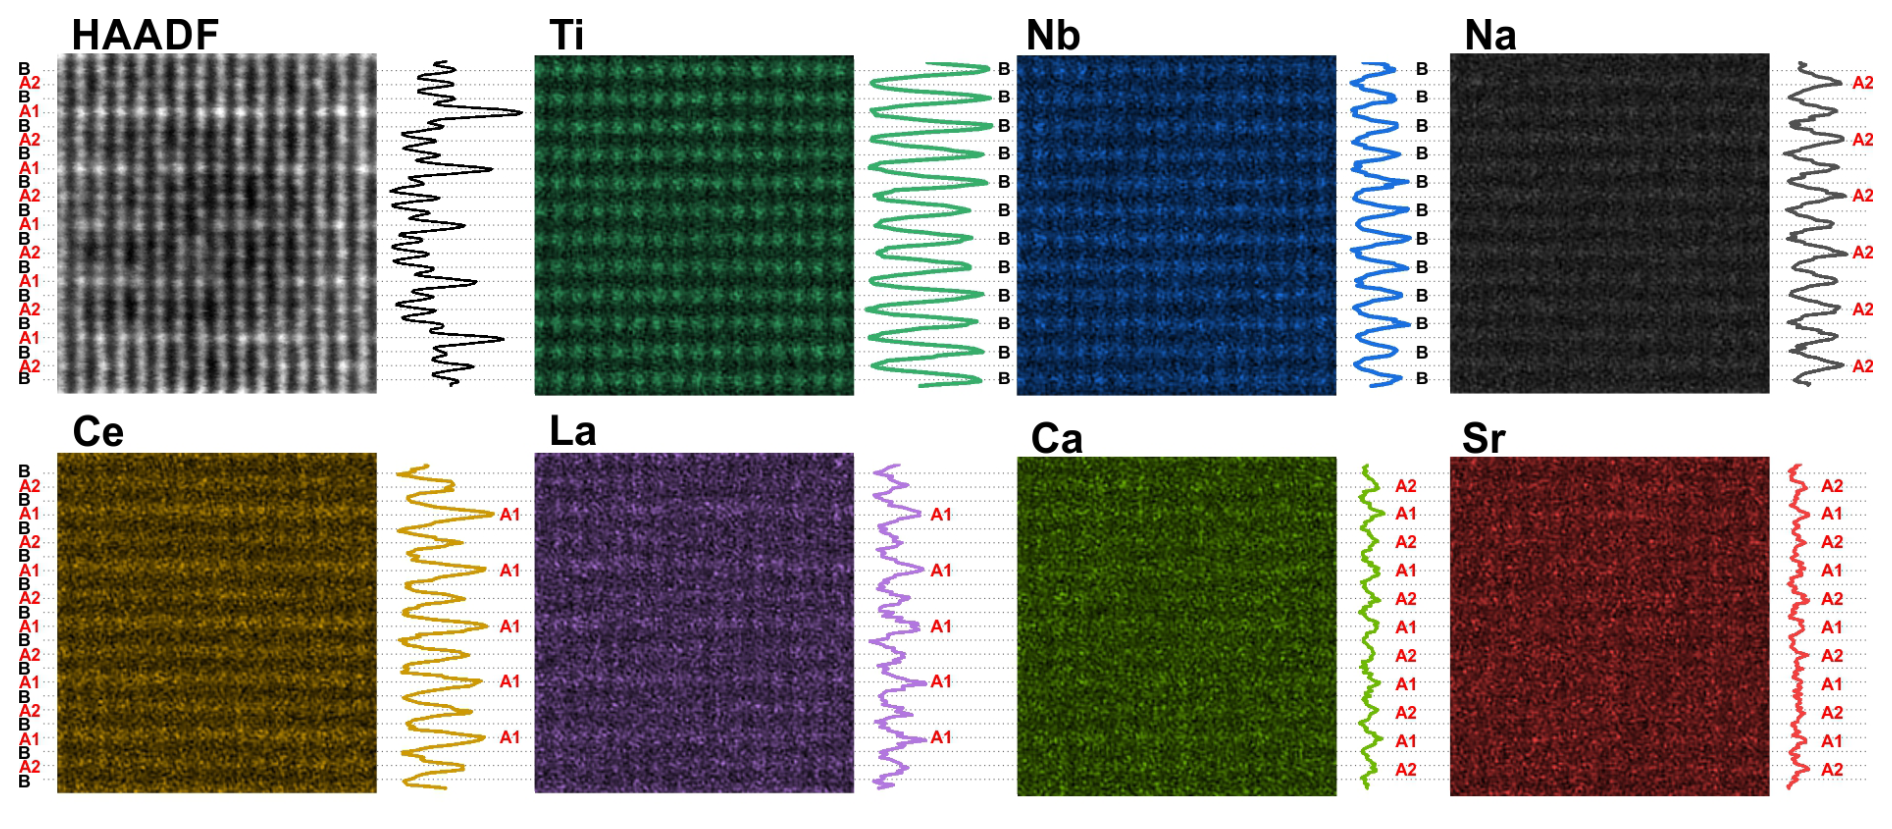
Figure 6Atomic-scale elemental analysis of the (111) sector. HAADF-STEM image with EDXS maps of the main elements and their intensity profiles showing the distribution of elements to the different types of structural sites. Nb and Ti randomly occupy the B-type sites without preferential ordering. Na shows slightly preferential enrichment at A2 sites, Ce and La preferentially segregate to the A1 sites, and Ca and Sr are randomly distributed to all A sites.
On the other hand, Na, as the lightest A-site species (ZNa=11), represents the most abundant A-site element and contributes to the darker contrast in HAADF-STEM images. For Na, the inverse trend as for the LREE is observed; the A2 columns contain slightly more Na than the A1 columns. The results of EDS mapping provide only qualitative insight into elemental ordering in the octahedral sector. Therefore, quantitative HAADF-STEM was used to more accurately evaluate the degree of elemental segregation to the A1 and A2 lattice planes. Based on the results of EPMA (Table 4) and atomic-scale STEM/EDXS mapping (Fig. 6), we prepared three models (111-1, 111-2, and 111-3) with different amounts of Na and LREE distributed to the A1 and A2 sites and Sr and Ca equally distributed to all A sites (Table 7). The distribution of the atoms was recalculated to full occupancy of each A-type site (ΣA∼1), as evidenced by the exact compositions given in Table S3.
Table 7Distribution of the main groups of elements to the A1 and A2 sites in the structural models for image simulations. Detailed elemental compositions of the models are given in Table S3.
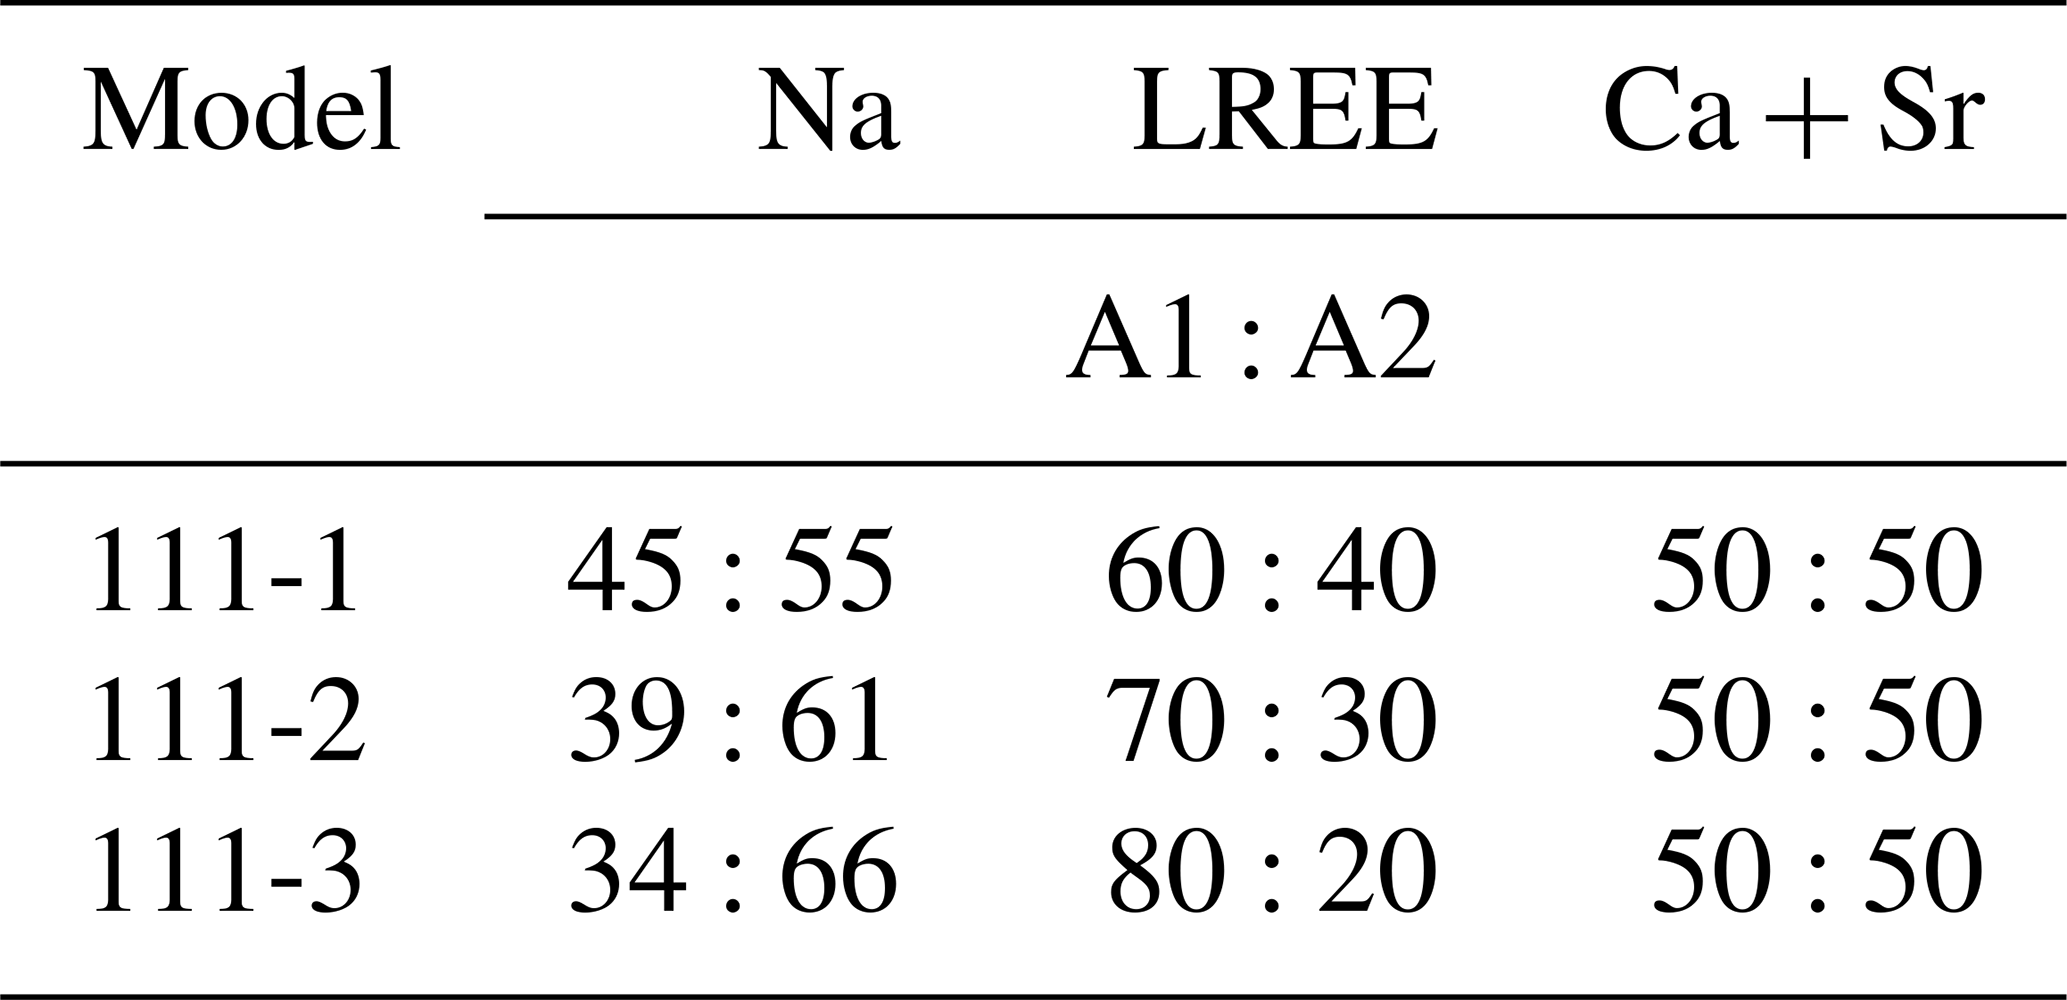
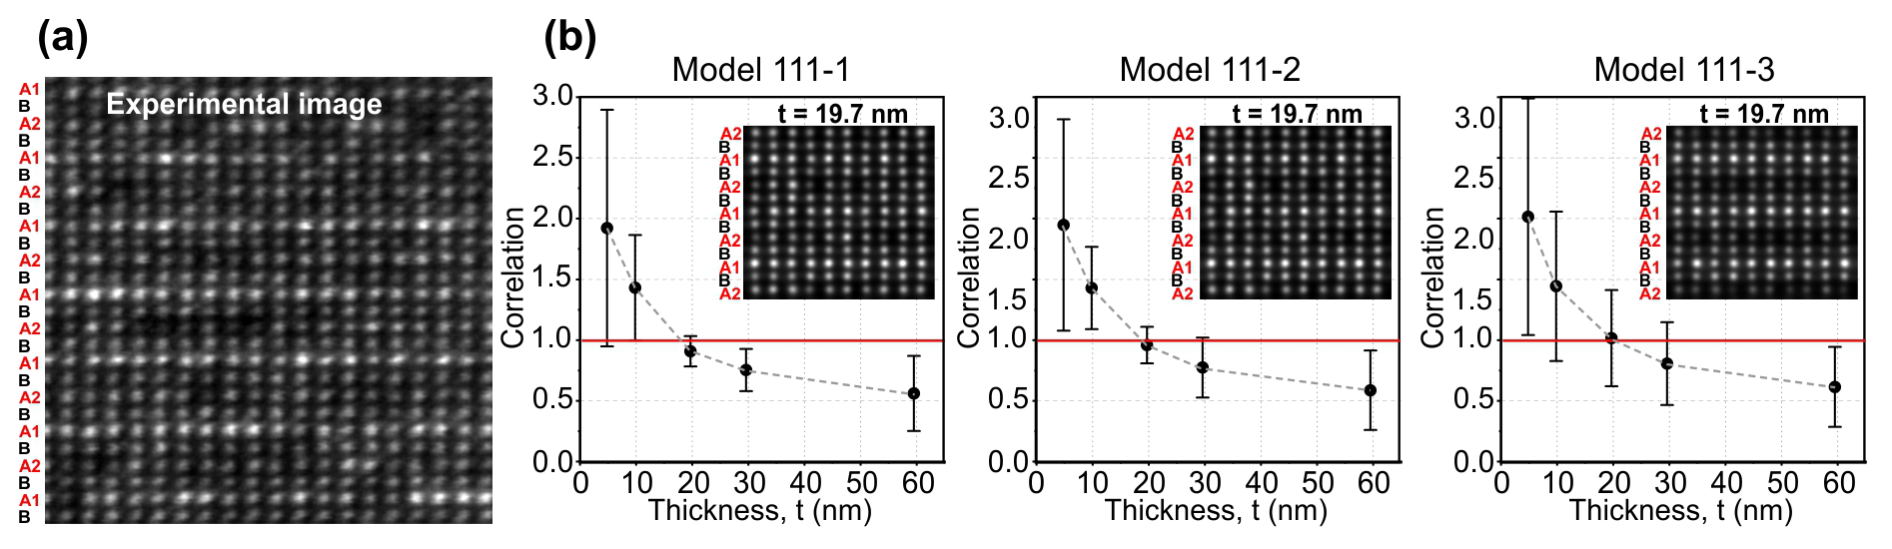
Figure 7(a) High-resolution experimental image typical of the (111) sector. (b) Image simulations of models 111-1, 111-2, and 111-3 with crystal thickness (t) of 19.7 nm.
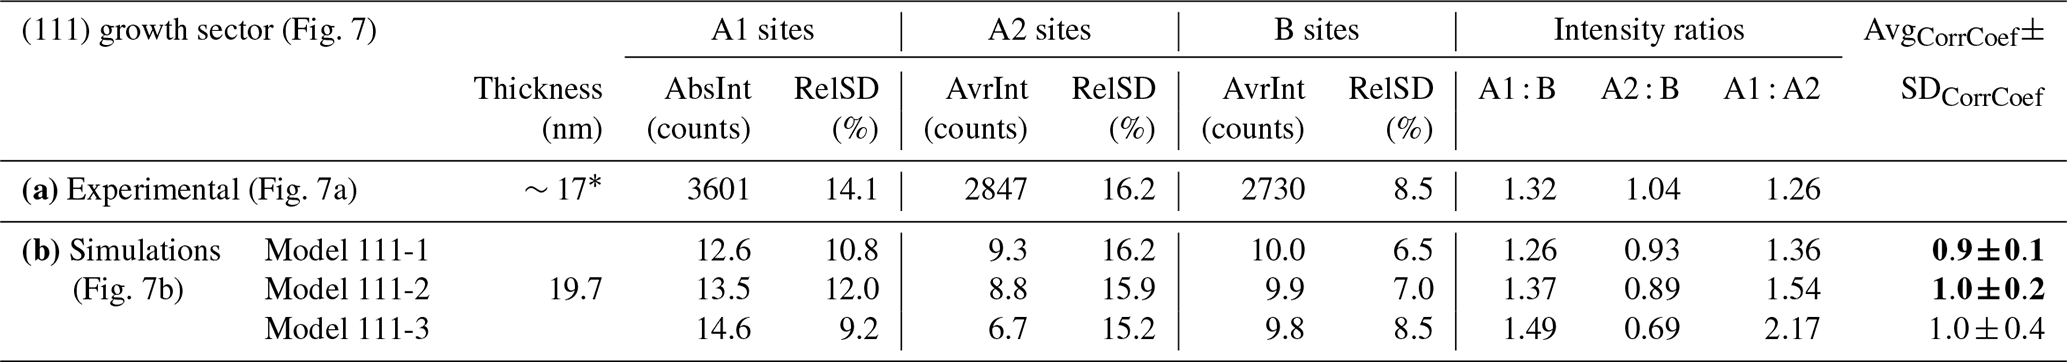
For quantitative HAADF-STEM, we recorded a high-resolution image in the thin part of the sample (Fig. 7a). The sampled area was approximately 17 nm thick as determined by EELS. The following parameters were determined from experimental images and image simulations: the average intensities of the A1-, A2-, and B-site columns, along with their relative standard deviations. The results obtained from the experimental image revealed that the A1 and A2 lattice planes have significantly different average absolute intensities. In contrast, no ordering was detected for the B-site lattice planes (Table 7a); these results are in agreement with STEM/EDXS mapping (Fig. 6). Moreover, the absolute intensity and the relative standard deviation of the B sites are similar to those in the (100) sector (Fig. 5a) due to the comparable thickness and fairly small difference in the composition of the B sites between the sectors. This implies that the only difference between the two sectors is the order of the A-type sites.
To evaluate the degree of LREE and Na ordering at the A1 and A2 sites, the experimental image was compared with image simulations of the three predicted models for crystal thicknesses between 5 and 60 nm. The results of image simulations for structural models with 19.7 nm thickness are given in Table 8b, the calculated images of the three models with 19.7 nm thickness are included in Fig. 8b, and detailed results for all crystal thicknesses are given in Table S5 and graphically presented in Fig. 7b.
Table 8(a) Quantitative analysis of the high-resolution image taken in the (111) sector. (b) Analyses of the image simulations of the three structural models with different distributions of Na and LREE to the A1 and A2 sites. Here, the results for 19.7 nm thick models are shown; the results for all models are given in Table S4. Structural models 111-1 and 111-2, with a thickness of 19.7 nm, have the highest correlation and lowest standard deviation, indicating their good fit to the experimental image (values in bold).
∗ Determined from EELS.
The correlation between the simulations and the experimental image was calculated using the same principle as for the (100) sector by taking into account standard deviations of the A1-, A2-, and B-site intensities and the A1 : B, A2 : B, and A1 : A2 intensity ratios. The results show that both structural models 111-1 and 111-2 show high correlation with the experimental image, whereas Model 111-3, where LREEs are distributed to the A1 and A2 lattice planes in an 80:20 ratio, shows significantly larger deviation from the experimental image. These results imply that in the (111) sector, the LREEs distribute to the alternating atomic layers in the 60:40 to 70:30 ratio, whereas Na distributes in the 45:55 to 39:61 ratio.
3.5 Analysis of the twin boundaries
In the second part of the study, we investigated the local atomic structure and composition of the main (111) TB and the meridional {112} TB contacts that are either perpendicular or inclined to the main (111) TB (see Fig. 2). If the (111) TB were the only TB, the crystal would be a simple spinel-type contact twin like for example in MgAl2O4 spinel (Hahn and Klapper, 2006; Daneu et al., 2007a) or in diamond (Lu et al., 2018). The formation of additional contacts along {112} planes, however, results in the formation of a symmetric twin intergrowth. To better understand the formation of the interpenetration twin, we studied the configuration of the TB contacts at the atomic scale.
3.5.1 Analysis of the (111) twin boundary
Samples for edge-on analysis of the main equatorial (111) TB were prepared from the cross-section cut (nearly) along one of the {112} TBs. The presence of the (111) TB was confirmed by EBSD (Fig. S5). Imaging of the (111) TB at low magnification in SEM reveals that the interface between the domains is not as tight as usually observed for impurity-induced twins or epitaxial twins (e.g. Daneu et al., 2007a, b, 2014; Padrón-Navarta et al., 2020), indicating that the twin domains are not in juxtaposition. The (111) TB in loparite appears porous or filled with secondary-phase inclusions that appear darker than the adjacent crystals in SEM-BSE images (Fig. 8a). The STEM/DF image (Fig. 8b) shows that the twin domains share a common interface, which also appears darker in the DF image. The interface is stepped with step lengths of approximately 100 nm and shows the presence of nanosized inclusions. Most of these inclusions were partially or fully etched out during the ion milling, especially in the thin part of the FIB lamella, leaving behind a void. EDS analysis of a preserved inclusion shows that it contains mainly Si and Al (Fig. 8c). Elements present in minor amounts, which were detected by LA-ICP-TOFMS (Table 5, Fig. S1), were below STEM/EDXS detection limit.
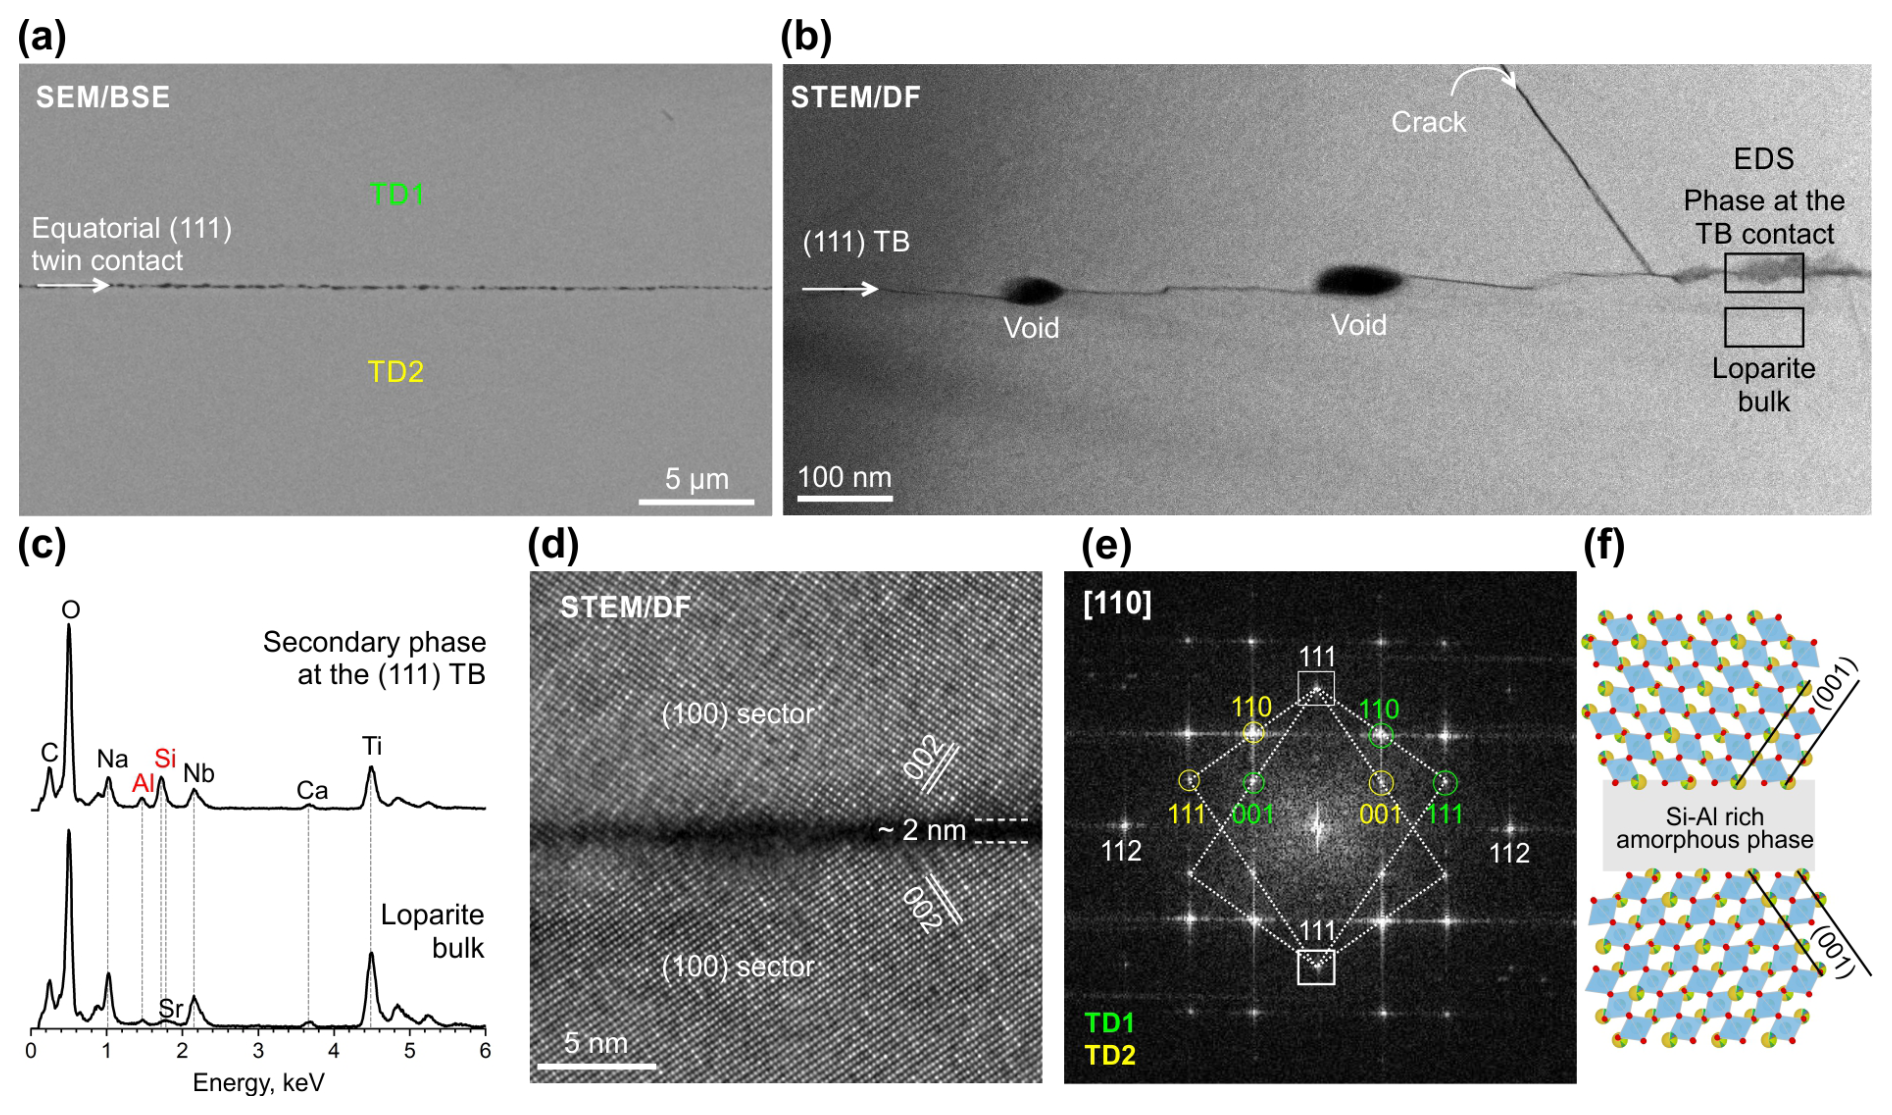
Figure 8(a) SEM-BSE micrograph of the (111) TB. (b) Low-magnification HAADF-STEM image of the TB shows steps, inclusions, and pores at the contact. (c) EDS analysis of an inclusion discloses that it is enriched in Si and Al. (d) High-resolution HAADF-STEM confirms twin orientation relationship between the domains. (e) The twin domains are separated by an approximately 1–2 nm thin layer of amorphous phase that prevents direct contact of the domains. (f) Schematic presentation of the twin interface configuration.
Imaging at higher magnifications revealed that the interface contains an approximately 1–2 nm thin amorphous layer (Fig. 8d). The FFT pattern calculated from the HR-STEM image in Fig. 8d confirms that the domains are in perfect twin orientation with coinciding diffraction spots from the (111) and (112) lattice planes, with the interface lying parallel to the common (111) plane (Fig. 8e). A direct contact between the twin domains was never found, implying that the conditions for a crystallographic interface are not fulfilled in this part of the crystal despite the well-defined crystallographic orientation relationship between the crystal domains. The actual situation with mirrored loparite domains separated by a thin layer of amorphous phase is schematically presented in Fig. 8f. FFT patterns also confirm that the main equatorial (111) TB runs through the cubic (100) sector as the superstructure reflections are not observed in the diffraction patterns.
3.5.2 Analysis of the {112} twin boundaries
In addition to the equatorial (111) TB, the crystal has six meridional {112} TBs (in each twin half separated by the equatorial TB) that lie perpendicular to the (111) interface. These TBs are connected by inclined {112} TBs (Fig. 2). When observed along the apparent 3-fold axis of the twin, the {112} TBs appear as nearly straight contacts crossing the cubic {100} sectors through the middle and parallel to the neighbouring sector boundaries (Fig. 2). In optical microscope and SEM, we often observed that cracks coincide with the TB contacts, and finding a tightly grown compact region of the contact suitable for the preparation of FIB lamella across a (112) TB was challenging. An example of a (112) twin boundary without a visible open crack, where the FIB lamella was prepared, is shown in Fig. S4a–c. After milling a trench in front of the subsequent FIB lamella, the (112) TB running vertically into the crystal can be observed as expected for the edge-on-oriented (112) TB. During ion thinning of the lamella, the region along the TB etched much faster than the neighbouring crystal domains. Consequently, while both crystal domains were still thick (not electron transparent), the contact was already milled to perforation (Fig. 9a). Nevertheless, some electron-transparent regions in both domains near the contact were found. High-resolution HAADF-STEM images were recorded in both neighbouring twin domains, along with the corresponding FFT patterns, which again confirm the well-defined crystallographic orientation relationship between the domains (Fig. 9b). Moreover, the FFT patterns do not show superstructure reflections, indicating that this TB also runs through the cubic sector. EDS analysis confirmed that the interface contains a layer of Si-rich amorphous phase; however, the (112) faces of the domains in contact are not stepped, and the thickness of the amorphous layer seems slightly larger than in the (111) TB.
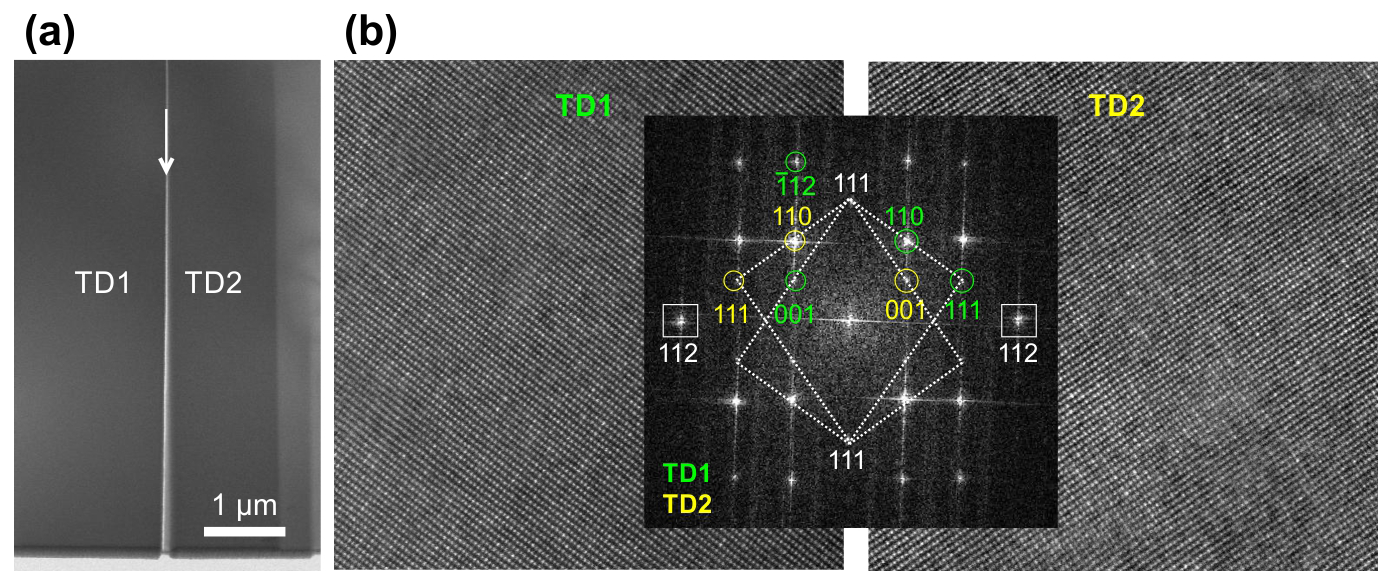
Figure 9(a) Low-magnification HAADF-STEM image of the {112} TB that runs perpendicular to the main (111) TB with an evident gap between the twin domains due to preferential ion etching of the Si-rich amorphous phase at the interface. (b) High-resolution images taken in the neighbouring twin domains shows the perfectly defined (112) twin orientation relationship. The lack of superstructure reflections in both domains confirms that the TB is located within the cubic sector.
We also analysed the second type of {112} twin contacts, which extend into the crystal at an angle with respect to the (111) TB, and connect two neighbouring vertical (112) TBs (see Fig. 2 for the lamella location). The SEM image taken during the FIB lamella preparation (Fig. S4a, d, e) and the low-magnification STEM image of the FIB lamella (Fig. 10a) clearly show the inclination of the contact with respect to the sample surface (which was polished approximately parallel to the (111) cross-section).
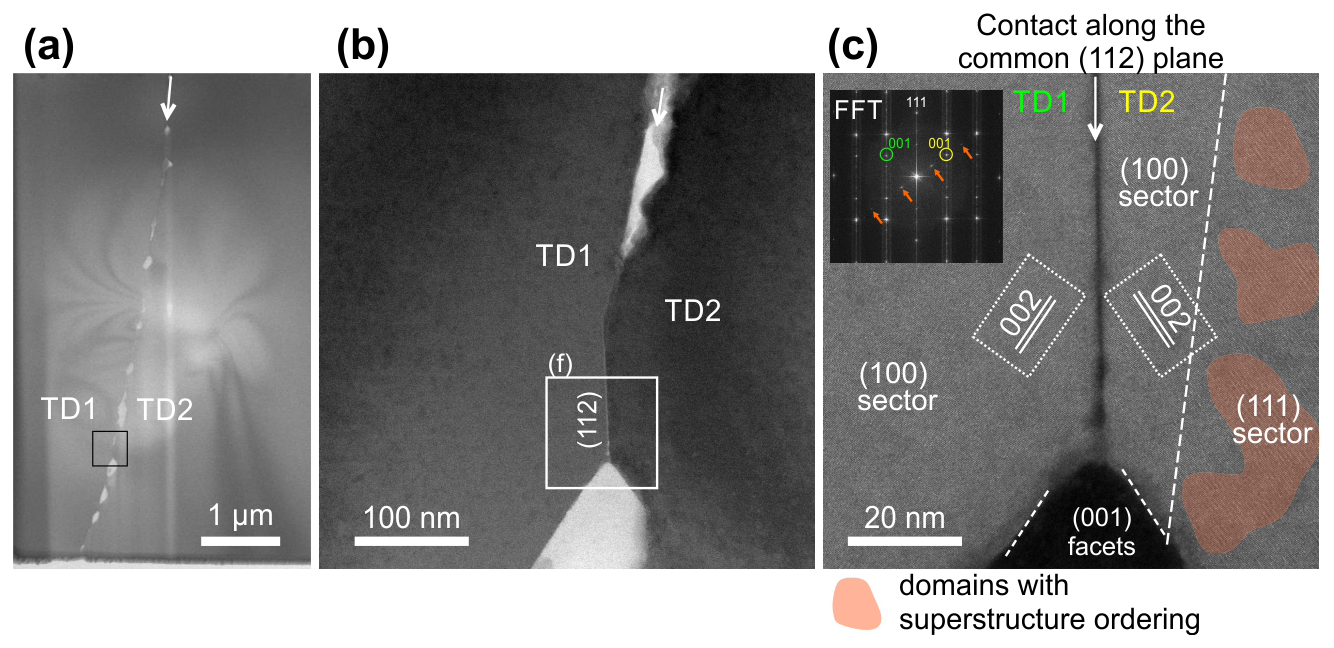
Figure 10(a) Low-magnification HAADF-STEM image of the inclined (112) twin contact. (b) The contact is stepped with some shorter sections running along the common (112) TB plane. (c) Also at interfaces running along the common (112) plane, the domains in twin orientation never come in direct contact but are separated by a thin layer of amorphous phase. Inset in the upper-left corner is FFT pattern from the whole area and shows the presence of superstructure reflections characteristic of the (111) sector. Inverse FFT was calculated to show that the areas that belong to the (111) sector start approximately 20 nm from the TB contact in the TD2.
STEM analysis has shown that the interface does not follow a well-defined direction, is heavily stepped, and contains many pores, similar to the (111) TB (Fig. 10a, b). Occasionally, short sections of the interface run parallel to the common {112} plane and, as in the previous two studied interfaces, here also the domains never come into direct contact but are separated by a thin (1–2 nm) layer of amorphous material (Fig. 10c). When the contact deviates from the common (112) lattice plane, the domains are stepped and frequently contain trapped pockets of amorphous phase. It is interesting to observe that the larger pockets are sometimes surrounded by {100} facets (Fig. 10c), which formed during liquid-phase-assisted crystallisation.
Another important observation here is the close proximity of the {111} sector. From the SEM image (Fig. S4), it seems that these interfaces practically coincide with the neighbouring sector boundaries. The FFT pattern calculated from the entire area in Fig. 10c actually revealed the presence of superstructure reflections characteristic of the {111} sector (see the inset) but only in the diffraction pattern that originated from the TD2. The inverse FFT pattern was calculated to disclose areas where the superstructure reflections originate. The analysis has revealed that the (111) sector is bound to the TD2, and the onset of this sector is approximately 20 nm from the TB interface. This confirmed that all TB contacts progress exclusively through the cubic sectors.
3.6 Formation of sector-zoned interpenetration twins of loparite
The studied loparite crystal is a symmetrically developed spinel-type twin composed of two interpenetrating cuboctahedra. The twinned crystal is characterised by re-entrant angles around the main equatorial (111) TB (the spinel-type TB) and six meridional (112) TBs that extend perpendicular to the main (111) TB (Fig. 1). The presence of re-entrant angles (ridges) suggests twin formation during crystal growth, whereas faceting indicates crystallisation from melt. The local configuration of the TB contacts with a thin layer of glassy phase between the domains in otherwise perfect twin orientation supports the formation of twins by growth. Such an interface configuration resembles general grain boundaries (GBs) rather than crystallographic defects like twin boundaries, in which domains in a twin orientation relationship are in direct contact, exhibiting well-defined lattice stacking across the interface. Boundaries with a thin layer of glassy phase at the contact are typically found between randomly oriented grains in polycrystalline ceramics sintered in the presence of a small amount of liquid phase (Ikuhara, 2001). Thin layers of amorphous (glassy) intergranular phase with an equilibrium thickness of around 1 nm (Tanaka et al., 1994) contain elements above the solubility limit in the neighbouring crystalline grains (under the given conditions) (Ma et al., 2013). The presence of a liquid phase at interfaces typically enhances diffusion processes and accelerates grain growth when the layer thickness is in the nanometre range (Luo et al., 1999). Although crystallisation of natural loparite typically proceeds in an alkaline fluid-magmatic environment (Suk and Kotel'nikov, 2008; Suk et al., 2013), the presence of aegirine inclusions indicates that the melt contained a significant fraction of silicon. Since Si is not soluble in loparite, it segregated to the TB contacts and cracks along with Al and minor amounts of transition metals (Cr, Mn, Co, Ni), Sn, and Sb during the crystallisation, as shown by LA-IC-TOF-MS. This analysis also revealed that elements with limited solubility in loparite (Fe, Cu, Zn, Y, Mo, Au and Pb) are found inside the loparite and along the cracks and TBs (Table 5).
The observed configuration of the TB contacts indicates that the twin orientation between the loparite domains was established during the initial stage of crystal growth (nucleation). Conditions for further formation of crystallographic twin interfaces were not met; therefore, crystallisation of the twin domains proceeded independently in the orientation relationship predefined by the nucleus. The new dataset reveals that all TB contacts reside inside the {100} sectors, suggesting that the initial loparite crystal form was cubic. In such a case, the (111) and {112} TB interfaces develop during independent and synchronous crystallisation of the crystal domains in a spinel-type twin orientation relationship. Equal growth rates across all TB contacts led to the development of a symmetric twin. During the crystallisation, an equilibrium amount of the melt is incorporated along the twin interfaces, where it solidifies to a few-nanometre-thin layer of amorphous (glassy) phase. The described formation of the loparite twin is fundamentally different from the twinning observed in MgAl2O4 spinel, where the (111) TBs are chemically stabilised by the incorporation of Be into the twin interfaces, forming a structurally well-defined and stable crystallographic contact (Daneu et al., 2007a; Drev et al., 2013). Such chemically induced interfaces have a lower energy of formation than the bulk phase and thus exhibit faster growth at the interface. Contact twins of MgAl2O4 develop as distinctly flattened morphologies due to the enhanced growth along the (111) TB in the initial crystal growth stage (Drev et al., 2013). At this point, it is interesting to note the occurrence of loparite twins with a prevailing {111} form and slightly flattened “flying saucer” morphology (Chakhmouradian et al., 2007), which implies facilitated growth along the equatorial (111) that may be linked to the local atomic structure and composition of the (111) twin boundary. The phenomenon of faster growth along the twin boundary plane is typical of chemically induced twins and was observed in many natural minerals and synthesised materials (Rečnik et al., 2001). For example, chemically stabilised TBs were observed in iron-cross interpenetration twins of pyrite (Rečnik et al., 2016). High-resolution TEM analyses have revealed the presence of two types of crystallographic contacts; the first type is symmetric {110} TBs that are stabilised with one atomic layer of Cu, similar to impurity-induced twin boundaries, whereas the second type is asymmetric contacts along {100} planes, which are devoid of Cu. The formation of two crystallographically distinct types of interfaces with varying growth rates leads to asymmetric development of the interpenetration twins of pyrite, which contrasts with symmetrically developed twins of loparite. Unlike in pyrite, conditions for the formation of crystallographic contacts between the twin domains were not met in the analysed loparite.
While the development of a symmetrical twin can be reasonably explained based on the local structure and composition of the TB contacts, the question remains – what is the twin nucleus and what triggers its formation? The fundamental characteristic of spinel-type twins in cubic phases is mirrored orientation (180° rotation) of the BO6 octahedra across the (111) TB that produces local hexagonal stacking of the oxygen sublattice. Since this twinning in natural perovskites is only observed in loparite, the reasons must be related to the physicochemical conditions during the loparite nucleation stage. Our analyses did not reveal a nucleus in the centre of the loparite; therefore, we can only discuss possible theories for the formation of loparite interpenetration twins. These include attachment of nanosized crystallites at the beginning of crystallisation, the presence of face-shared octahedra as twin nuclei, or epitaxial growth on a structurally related secondary phase.
The formation of growth twins is typically ascribed to accidental attachment of small crystallites in twin orientation during the initial (nucleation) stage of crystal growth, especially under supersaturation conditions (Buerger, 1945; Aoki, 1979). A common explanation for the formation of spinel-type interpenetration twins in cubic minerals like diamond and galena is the attachment of octahedral nuclei in mirror (twin) orientation, followed by a change in crystal morphology to cubic, which results in the development of interpenetrating cubes (Aoki, 1979). Based on the presence of a ridge of octahedral faces around the equatorial (111) twin, this theory was recently applied to the formation of interpenetration twins of diamond (Pavlushin, 2025). In the case of the studied loparite twin, we observed that the TBs originate in the cubic sector, which seems to be the initial crystal form. Therefore, the attachment of nanosized crystallites along the (111) facets is unlikely. Another possibility is the presence of face-shared (mirrored) octahedra at the unit cell level as nuclei for the twin domains. This hypothesis was introduced for the formation of hydrothermally synthesised interpenetration twins of BaTiO3 prepared from starting TiO2 powders that contained pairs of face-sharing Ti–O octahedra, which acted as nuclei for the evolution of twinned BaTiO3 crystallites (Qin et al., 2010). The conditions for the formation of loparite and BaTiO3 differ significantly; therefore, this explanation cannot be directly transferred to loparite. Since loparite is the only natural perovskite in which interpenetration twins occur, conditions for twin nucleation must be related to a unique combination of physicochemical conditions, including complex chemistry, high crystallisation temperature, and a slow crystallisation rate. The exact formation of face-shared nuclei for the formation of loparite interpenetration twins, however, remains unclear. Nucleation twins can also form by epitaxial growth in twin orientation on a structurally related phase. It has been shown indirectly that contact and cyclic twins in cassiterite ceramics nucleate at a very early stage of crystal growth, by nucleation upon nanosized particles of phases with a corundum-type structure, which dissolve into cassiterite at higher temperatures and are no longer present in the twin core (Daneu et al., 2022). At this point of research, it is not possible to state which of the described (or other) hypotheses for the nucleation of loparite twins is correct. The exclusive occurrence of this twin type in loparite, however, suggests that its origin is not accidental.
After loparite twin nucleation, we infer that further growth of the studied crystal was rather slow, as indicated by flat facets, clearly developed growth sectors, and the presence of very few overgrown inclusions. Crystallisation at low growth rates is supposed to relate to low-supersaturation conditions (Mikhailova et al., 2023). During slow growth, cations are selectively incorporated into the (100) and (111) crystal facets with different surface characteristics (Dowty, 1976; Watson and Liang, 1995). Sector zoning in loparite was thoroughly discussed with Mont Saint Hilaire loparite (Chakhmouradian et al., 2007), where a similar partitioning of elements to the cubic and octahedral sectors was observed. These authors also observed that the crystallisation of sector-zoned loparite started with cubic morphology, and the octahedral sectors developed later. One of the most interesting observations of our study is the different structural ordering in the cubic and octahedral sectors, associated with only small differences in chemical composition. In the octahedral sector, which shows a slightly higher Na : LREE ratio, these elements order to subsequent basal lattice planes forming the domain structure, where nanosized domains are separated by disordered regions or antiphase boundaries (APBs). A high density of APBs was observed in loparite and other nonstoichiometric perovskites by HRTEM (Hu et al., 1992). The presence of sectors with almost entirely disordered and partially ordered cation arrangements in a single crystal, however, has not been observed previously. Since the whole crystal with growth sectors was subjected to identical thermodynamic conditions, the only possible explanation for the origin of different types of ordering is a combination of the small difference in the composition and cooling rate. It is known that tetragonal ordering occurs in functional perovskites that contain A-site cations with significantly different sizes, for example, the LiLaTiO3 (LLTO) family (Inaguma et al., 1993). These compounds contain different fractions of Li, La, and vacancies on the A sites, and the structure of LLTO, solidified from high temperatures, depends on the exact composition and even more on the cooling regime. During slow cooling, a tetragonal modification with alternating La-rich and La-poor basal planes along the c axis is formed, whereas during quenching, the cubic modification with random arrangement of the A-site cations is stabilised (Robertson et al., 1995). A similar process is likely responsible for ordering in the {111} sector of loparite, where the cooling rate was probably much slower. These results suggest that the crystal structure of loparite depends not only on the composition but also on the thermal regime to which the crystals were subjected. This can explain the diversity in reported structures for different natural loparites (Table 1). It is likely that similar structural differences occur in other compositionally zoned loparites, which are very common, implying that bulk diffraction techniques might not be the most reliable for crystal structure determination of loparite, especially when crystals are zoned.
We have studied a sector-zoned spinel-type interpenetration twin of loparite from Mt Khibiny using a combination of microscale and nanoscale characterisation, imaging, and spectroscopy techniques for a deeper insight into the formation of this particular type of twinning in loparite and interpenetration twin in general. The most important findings are the following:
-
The twin orientation relationship between the two interpenetrating loparite domains was established in the initial (nucleation) stage of crystallisation (nucleation twinning), when the crystal form was cubic.
-
The conditions for further building of a crystallographic (111) twin boundary interface were not met during subsequent crystal growth; therefore the growth of twin domains continued independently but synchronously due to their predetermined symmetric orientation relationship by the nucleus. As a result, the contacts between the twin domains developed along the lowest-energy interfaces, which are the (111) and {112} twin boundaries.
-
During independent crystallisation of twin domains from the melt, an equilibrium amount of the liquid phase was incorporated along the twin boundary interfaces. The liquid phase contains mainly Si and Al along with trace amounts of elements that are insoluble in loparite or were present in amounts above the solubility limit.
-
The investigated loparite twin was sector-zoned and contained rare aegirine inclusions, both of which signify a slow crystallisation rate. According to new data from EPMA and LA-ICP-TOFMS, the octahedral sectors have a higher Na : LREE ratio, which results in the development of nanodomains in which Na and LREE are ordered to subsequent basal planes during slow cooling. Ordering did not occur in the cubic sector with a lower Na : LREE ratio, and this sector exhibits a disordered orthorhombic crystal structure.
-
The crystal structure of complex perovskites seems to reflect a delicate balance between geochemical and physicochemical conditions during crystallisation. Even small compositional differences might significantly influence the crystal structure; therefore, the results of structural characterisation of compositionally zoned phases with bulk diffraction techniques should be interpreted with caution, and the application of techniques that allow for local structural characterisation at the atomic scale is regarded as essential.
Datasets related to the results reported in this article are original results obtained by the authors and are presented in the included tables, figures, and the Supplement.
The supplement related to this article is available online at https://doi.org/10.5194/ejm-38-53-2026-supplement.
AR initiated the study of twinning in loparite. ND coordinated the experimental work; performed the STEM analyses, image simulations, and quantitative HAADF-STEM analyses; and wrote the first draft of the manuscript. JAPN performed the EBSD analyses. GH and RA were responsible for the microprobe (EPMA) analyses. MŠ and KR carried out the LA-ICP-TOFMS analyses. GD contributed to STEM/EELS analyses and advised on image simulations. PB contributed to the development of structural models for image simulations. All authors provided comments and assisted in writing the final version of the paper.
The contact author has declared that none of the authors has any competing interests.
Publisher's note: Copernicus Publications remains neutral with regard to jurisdictional claims made in the text, published maps, institutional affiliations, or any other geographical representation in this paper. The authors bear the ultimate responsibility for providing appropriate place names. Views expressed in the text are those of the authors and do not necessarily reflect the views of the publisher.
We thank Bojan Ambrožič and Tina Radoševič for the preparation of FIB lamellae.
The work was financially supported by the Slovenian Research and Innovation Agency (ARIS) within the research project J1−3025. MŠ acknowledges financial support within the research programme P1-0034.
The article processing charges for this open-access publication were covered by the CSIC Open Access Publication Support Initiative through its Unit of Information Resources for Research (URICI).
This paper was edited by Cristiano Ferraris and reviewed by Ferraris Giovanni and one anonymous referee.
Alsalman, M., Alghofaili, Y. A., Baloch, A. A. B., Alsadah, H., Alsaui, A. A., Alqahtani, S. M., Muqaibel, A. H., and Alharbi, F. H.: Outliers in Shannon's effective ionic radii table and the table extension by machine learning, Comput. Mater. Sci., 228, 112350, https://doi.org/10.1016/j.commatsci.2023.112350, 2023.
Aoki, Y.: Morphology of crystals grown from highly supersaturated solution, Mem. Fac. Sci., Kyushu Univ., Ser. D, Geol., 24, 75–108, https://doi.org/10.5109/1544208, 1979.
Bachmann, F., Hielscher, R., Jupp, P. E., Pantleon, W., Schaeben, H., and Wegert, E.: Inferential statistics of electron backscatter diffraction data from within individual crystalline grains, J. Appl. Crystallogr., 43, 1338–1355, https://doi.org/10.1107/S002188981003027X, 2010.
Baloch, A. A. B., Alqahtani, S. M., Mumtaz, F., Muqaibel, A. H., Rashkeev, S. N., and Alharbi, F. H.: Extending Shannon's ionic radii database using machine learning, Phys. Rev. Mater., 5, 043804, https://doi.org/10.1103/PhysRevMaterials.5.043804, 2021.
Buerger, M. J.: The genesis of twin crystals, Am. Mineral., 30, 469–482, 1945.
Chakhmouradian, A. R., Mitchell, R. H., Pankov, A. V., and Chukanov, N. V.: Loparite and `metaloparite' from the Burpala alkaline complex, Baikal Alkaline Province (Russia), Mineral. Mag., 63, 519–534, https://doi.org/10.1180/002646199548691, 1999.
Chakhmouradian, A. R., Halden, N. M., Mitchell, R. H., and Horváth, L.: Rb-Cs-rich rasvumite and sector-zoned “loparite-(Ce)” from Mont Saint-Hilaire (Quebec, Canada) and their petrologic significance, Eur. J. Mineral., 19, 533–546, https://doi.org/10.1127/0935-1221/2007/0019-1739, 2007.
Daneu, N., Rečnik, A., Yamazaki, T., and Dolenec, T.: Structure and chemistry of (111) twin boundaries in MgAl2O4 spinel crystals from Mogok, Phys. Chem. Miner., 34, 233–247, https://doi.org/10.1007/s00269-007-0142-1, 2007a.
Daneu, N., Schmid, H., Rečnik, A., and Mader, W.: Atomic structure and formation mechanism of (301) rutile twins from Diamantina (Brazil), Am. Mineral., 92, 1789–1799, https://doi.org/10.2138/am.2007.2634, 2007b.
Daneu, N., Rečnik, A., and Mader, W.: Atomic structure and formation mechanism of (101) rutile twins from Diamantina (Brazil), Am. Mineral., 99, 612–624, https://doi.org/10.2138/am.2014.4672, 2014.
Daneu, N., Dražič, G., Mazaj, M., Barou, F., and Padrón-Navarta, J. A.: Formation of contact and multiple cyclic cassiterite twins in SnO2-based ceramics co-doped with cobalt and niobium oxides, Acta Crystallogr. B, 78, 695–709, https://doi.org/10.1107/S2052520622006758, 2022.
Downs, T. R. and Hall-Wallace, M.: The American Mineralogist crystal structure database, re3data [data set], https://doi.org/10.17616/R32S57, 2003.
Dowty, E.: Crystal structure and crystal growth: II. Sector zoning in minerals, Am. Mineral., 61, 460–469, 1976.
Drev, S., Rečnik, A., and Daneu, N.: Twinning and epitaxial growth of taaffeite-type modulated structures in BeO-doped MgAl2O4, CrystEngComm, 15, 2640–2647, https://doi.org/10.1039/c3ce26997c, 2013.
Feng, D., Shivaramaiah, R., and Navrotsky, A.: Rare-earth perovskites along the CaTiO3-Na0.5La0.5TiO3 join: Phase transitions, formation enthalpies, and implications for loparite minerals, Am. Mineral., 101, 2051–2056, https://doi.org/10.2138/am-2016-5740, 2016.
Glazer, A. M.: The classification of tilted octahedra in perovskites, Acta Crystallogr. B, 28, 3384–3392, https://doi.org/10.1107/S0567740872007976, 1972.
Haggerty, S. E. and Mariano, A. N.: Strontian-loparite and strontio-chevkinite: Two new minerals in rheomorphic fenites from the Paraná Basin carbonatites, South America, Contrib. Mineral. Petrol., 84, 365–381, https://doi.org/10.1007/BF01160288, 1983.
Hahn, Th. and Klapper, H.: Twinning of crystals, in: Int. Tables Crystallogr., vol. D: Physical Properties of Crystals, edited by: Authier, A., International Union of Crystallography, 393–448, https://doi.org/10.1107/97809553602060000113, 2006.
Hielscher, R. and Schaeben, H.: A novel pole figure inversion method: Specification of the MTEX algorithm, J. Appl. Crystallogr., 41, 1024–1037, https://doi.org/10.1107/S0021889808030112, 2008.
Hu, M., Wenk, H.-R., and Sinitsyna, D.: Microstructures in natural perovskites, Am. Mineral., 77, 359–373, 1992.
Ikuhara, Y.: Grain boundary and interface structures in ceramics, J. Ceram. Soc. Jpn., 109, S110–S120, https://doi.org/10.2109/jcersj.109.1271_S110, 2001.
Inaguma, Y., Liquan, C., Itoh, M., Nakamura, T., Uchida, T., Ikuta, H., and Wakihara, M.: High ionic conductivity in lithium lanthanum titanate, Solid State Commun., 86, 689–693, https://doi.org/10.1016/0038-1098(93)90841-A, 1993.
Jiang, S., Hu, T., Gild, J., Zhou, N., Nie, J., Qin, M., Harrington, T., Vecchio, K., and Luo, J.: A new class of high-entropy perovskite oxides, Scr. Mater., 142, 116–120, https://doi.org/10.1016/j.scriptamat.2017.08.040, 2018.
Klapper, H.: X-ray topography of twinned crystals, Prog. Cryst. Growth Charact. Mater., 14, 367–401, 1987.
Koch, C.: Determination of core structure periodicity and point defect density along dislocations, PhD Thesis, Arizona State University, 2002.
Kogarko, L. N.: Peculiarities of the formation of loparite ores: the Lovozero rare metal deposit, east Fennoscandia, Dokl. Earth Sci., 505, 524–526, https://doi.org/10.1134/S1028334X22080098, 2022.
LeBeau, J. M., Findlay, S. D., Allen, L. J., and Stemmer, S.: Quantitative HAADF-STEM and EELS, Microsc. Microanal., 14, 1352–1353, https://doi.org/10.1017/S1431927608082263, 2008.
Lu, T., Ke, J., and Qiu, Z.: Surface dissolution features and contact twinning in natural diamonds, Neues Jahrb. Mineral. Abh., 195, 145–153, https://doi.org/10.1127/njma/2018/0108, 2018.
Luo, J., Wang, H., and Chiang, Y. M.: Origin of solid-state activated sintering in Bi2O3-doped ZnO, J. Am. Ceram. Soc., 82, 916–920, https://doi.org/10.1111/j.1151-2916.1999.tb01853.x, 1999.
Ma, S., Cantwell, P. R., Pennycook, T. J., Zhou, N., Oxley, M. P., Leonard, D. N., Pennycook, S. J., Luo, J., and Harmer, M. P.: Grain boundary complexion transitions in WO3- and CuO-doped TiO2 bicrystals, Acta Mater., 61, 1691–1704, https://doi.org/10.1016/j.actamat.2012.11.044, 2013.
Mikhailova, J. A., Pakhomovsky, Y. A., Selivanova, E. A., and Kompanchenko, A. A.: Polymineralic inclusions in loparite-(Ce) from the Lovozero alkaline massif (Kola peninsula, Russia): Hydrothermal Association in Miniature, Minerals, 13, 715, https://doi.org/10.3390/min13060715, 2023.
Mitchell, R. H. and Chakhmouradian, A. R.: A structural study of the perovskite series NaLaTh2xTiO3, J. Solid State Chem., 138, 307–312, https://doi.org/10.1006/jssc.1998.7789, 1998.
Mitchell, R. H. and Chakhmouradian, A. R.: A New Series of Complex Perovskites La1−xSrxCr1−xTixO3: Structural Characterization, J. Solid State Chem., 144, 81–85, https://doi.org/10.1006/jssc.1998.8121, 1999.
Mitchell, R. H. and Liferovich, R. P.: A structural study of the perovskite series Na0.75Ln0.25Ti0.5Nb0.5O3, J. Solid State Chem., 178, 2586–2593, https://doi.org/10.1016/j.jssc.2005.05.016, 2005.
Mitchell, R. H., Burns, P. C., and Chakhmouradian, A. R.: The crystal structures of loparite-(Ce), Can. Mineral., 38, 145–152, https://doi.org/10.2113/gscanmin.38.1.145, 2000a.
Mitchell, R. H., Chakhmouradian, A. R., and Woodward, P. M.: Crystal chemistry of perovskite-type compounds in the tausonite-loparite series, (Sr1−2xNaxLax)TiO3, Phys. Chem. Miner., 27, 583–589, https://doi.org/10.1007/s002690000103, 2000b.
Mitchell, R. H., Welch, M. D., and Chakhmouradian, A. R.: Nomenclature of the perovskite supergroup: A hierarchical system of classification based on crystal structure and composition, Mineral. Mag., 81, 411–461, https://doi.org/10.1180/minmag.2016.080.156, 2017.
Momma, K. and Izumi, F.: VESTA 3 for three-dimensional visualization of crystal, volumetric and morphology data, J. Appl. Crystallogr., 44, 1272–1276, https://doi.org/10.1107/S0021889811038970, 2011.
Padrón-Navarta, J. A., Barou, F., and Daneu, N.: Twinning in SnO2-based ceramics doped with CoO- and Nb2O5: Morphology of multiple twins revealed by electron backscatter diffraction, Acta Crystallogr. B, 76, 875–883, https://doi.org/10.1107/S2052520620010264, 2020.
Pavlushin, A. D.: Morphological features and genesis of the interpenetration twins of cubic diamond crystals, Geochem. Int., 63, 172–182, https://doi.org/10.1134/S0016702924700897, 2025.
Popova, E. A., Lushnikov, S. G., Yakovenchuk, V. N., and Krivovichev, S. V.: The crystal structure of loparite: a new acentric variety, Mineral. Petrol., 111, 827–832, https://doi.org/10.1007/s00710-017-0498-y, 2017.
Qin, S., Liu, D., Zheng, F., Zuo, Z., Liu, H., and Xu, X. (2010). (111) twinned BaTiO3 microcrystallites, CrystEngComm, 12, 3003–3007, https://doi.org/10.1039/b925863a, 2010.
Rakovan, J.: Sectoral zoning, Rocks & Minerals, 84, 171–176, https://doi.org/10.3200/RMIN.84.2.171-176, 2009.
Ranjan, R., Agrawal, A., Senyshyn, A., and Boysen, H.: Phases in the system NaNdTiO3-SrTiO3: A powder neutron diffraction study, J. Phys. Condens. Matter, 18, 9679–9690, https://doi.org/10.1088/0953-8984/18/42/014, 2006.
Rečnik, A. and Kolar, D.: Exaggerated growth of hexagonal barium titanate under reducing sintering conditions, J. Am. Ceram. Soc., 79, 1015–1018, https://doi.org/10.1111/j.1151-2916.1996.tb08541.x, 1996.
Rečnik, A., Čeh, M., and Kolar, D.: Polytype induced exaggerated grain growth in ceramics, J. Eur. Ceram. Soc., 21, 2117–2121, https://doi.org/10.1016/S0955-2219(01)00184-4, 2001.
Rečnik, A., Stanković, N., and Daneu, N.: Topotaxial reactions during the genesis of oriented rutile/hematite intergrowths from Mwinilunga (Zambia), Contrib. Mineral. Petrol., 169, 19, https://doi.org/10.1007/s00410-015-1107-x, 2015.
Rečnik, A., Zavašnik, J., Jin, L., Čobić, A., and Daneu, N.: On the origin of “iron-cross” twins of pyrite from Mt. Katarina, Slovenia, Mineral. Mag., 80, 937–948, https://doi.org/10.1180/minmag.2016.080.073, 2016.
Robertson, A. D., Martin, S. G., Coats, A., and West, A. R.: Phase diagrams and crystal chemistry in the Li+ ion conducting perovskites, Li0.5−3xRE0.5+xTiO3: RE = La, Nd. J. Mater. Chem., 5, 1405–1412, https://doi.org/10.1039/JM9950501405, 1995.
Senechal, M.: The mechanism of formation of certain growth twins of the penetration type, Neues Jahrb. Mineral., 11, 518–524, 1976.
Senechal, M.: The genesis of growth twins, Sov. Phys. Crystallogr., 25, 520–524, 1980.
Shannon, R. D.: Revised effective ionic radii and systematic studies of interatomic distances in halides and chalcogenides, Acta Crystallogr. A, 32, 751–767, https://doi.org/10.1107/S0567739476001551, 1976.
Suk, N. I. and Kotel'nikov, A. R.: Experimental study of loparite formation in complex fluid-magmatic systems, Dokl. Earth Sci., 419, 463–466, https://doi.org/10.1134/S1028334X08030252, 2008.
Suk, N. I., Kotel'nikov, A. R., and Viryus, A. A.: Crystallization of loparite in alkaline fluid-magmatic systems (from experimental and mineralogical data), Russ. Geol. Geophys., 54, 436–453, https://doi.org/10.1016/j.rgg.2013.03.006, 2013.
Sun, P. H., Nakamura, T., Shan, Y. J., Inaguma, Y., and Itoh, M.: High temperature quantum paraelectricity in perovskite-type titanates LnNaTiO3 (Ln = La, Pr, Nd, Sm, Eu, Gd and Tb), Ferroelectrics, 200, 93–107, https://doi.org/10.1080/00150199708008599, 1997.
Tanaka, I., Neebe, H.-J., Cinibuk, M. K., Bruley, J., Clarke, D. R., and Ruhle, M.: Calcium concentration dependence of the intergranular film thickness in silicon nitride, J. Am. Ceram. Soc., 77, 911–914, https://doi.org/10.1111/j.1151-2916.1994.tb07246.x, 1994.
Van Elteren, J. T., Šelih, V. S., and Šala, M.: Insights into the selection of 2D LA-ICP-MS (multi)elemental mapping conditions, J. Anal. At. Spectrom., 34, 1919–1931, https://doi.org/10.1039/c9ja00166b, 2019.
Watson, E. B. and Liang, Y.: A simple model for sector zoning in slowly grown crystals: implications for growth rate and lattice diffusion, with emphasis on accessory minerals in crustal rocks, Am. Mineral., 80, 1179–1187, https://doi.org/10.2138/am-1995-11-1209, 1995.
Zubkova, N. V., Arakcheeva, A. V., Pushcharovskii, D. Yu., Semenov, E. I., and Atencio, D.: Crystal structure of loparite, Crystallogr. Rep., 45, 210–214, https://doi.org/10.1134/1.171165, 2000.