the Creative Commons Attribution 4.0 License.
the Creative Commons Attribution 4.0 License.
 | 07 Feb 2025
Fingerprinting of ruby and sapphire gemstones through Fourier-transform infrared (FTIR) methodologies
António Soares de Sousa
Elsa Maria Carvalho Gomes
Laura Bayés-García
Alessandra Di Mariano
Maite Garcia-Valles
Gemstones have significant economic, cultural, and artistic value. Advances in the treatment and production of synthetic gemstones create the need for more precise identification methods to distinguish natural stones from their synthetic and treated counterparts. Fourier-transform infrared (FTIR) spectroscopy, a non-destructive technique, is widely employed in advanced gemological analysis. In this study, 25 rubies and sapphires (natural, synthetic, and treated) from the Gemology School of the University of Barcelona were analysed using standard gemological instruments and FTIR spectroscopy. Distinct spectral fingerprints were identified for different categories and treatments. Untreated natural stones showed a band at 3230 cm−1 (with an additional peak at 3310 cm−1 in sapphires), whereas Verneuil specimens showed peaks at 3185, 2230, and 3310 cm−1 (with this last peak being more intense the one at 3310 cm−1 in sapphires), and flux specimens showed a 3310 cm−1 band. Regarding treated gemstones, diffusion-treated samples showed a faint band centred at 3310 cm−1; the glass-filled ones exhibited characteristic bands at 2250, 2600, and 3300 cm−1; and the treated Verneuil ruby showed a band centred at 3310 cm−1. These spectral fingerprints can be used to distinguish between natural, synthetic, and treated rubies and sapphires and contribute to existing databases, allowing for simpler and faster gemological analysis in future studies.
- Article
(3401 KB) - Full-text XML
- BibTeX
- EndNote


The interest generated by gemstones is well known, not only from a commercial perspective but also from a cultural and artistic point of view (Hughes, 1990). One of the most significant gemstones is corundum, which consists of crystallised alumina (Al2O3). As an allochromatic mineral, corundum is completely colourless in its pure state, with its colour resulting from minor impurities. The term ruby is used to refer to its vibrant-red to purplish-red colour variety, related to Cr impurities in its structure. All the other colours belong to the sapphire variety, in which the blue colour is due to the presence of Fe and Ti (Dubinsky et al., 2020; Hughes, 1997).
To meet the current growing market demand, improvements in techniques and technologies have led to an increase in the production capacity of synthetic gemological material in the laboratory (Pellicer, 2001; Shigley, 2000). As described by Nassau (1980), the most well-known growth techniques used are those from a melt (e.g. Verneuil) and from a solution (e.g. flux). In addition to these syntheses, the modification of certain physicochemical properties of lower-quality gemstones is common, to both improve certain characteristics valued in natural gemstones and create substitutes (Roselló, 2004). Heat treatment, irradiation, impregnation, dyeing, and coating are some of these treatments, which are described well by Nassau (1984). In many cases, the information on the treatment and synthesis methods used is not disseminated, and, although they often display distinctive gemological characteristics, some treated and synthetic gem materials can be difficult to identify (Shigley, 2000). In this context, based on a constantly evolving industry, it has become an essential and necessary task for gemological laboratories to develop a methodology that allows the establishment of protocols for the precise identification of these materials, the differentiation between natural and synthetic counterparts, and the detection of specific treatments.
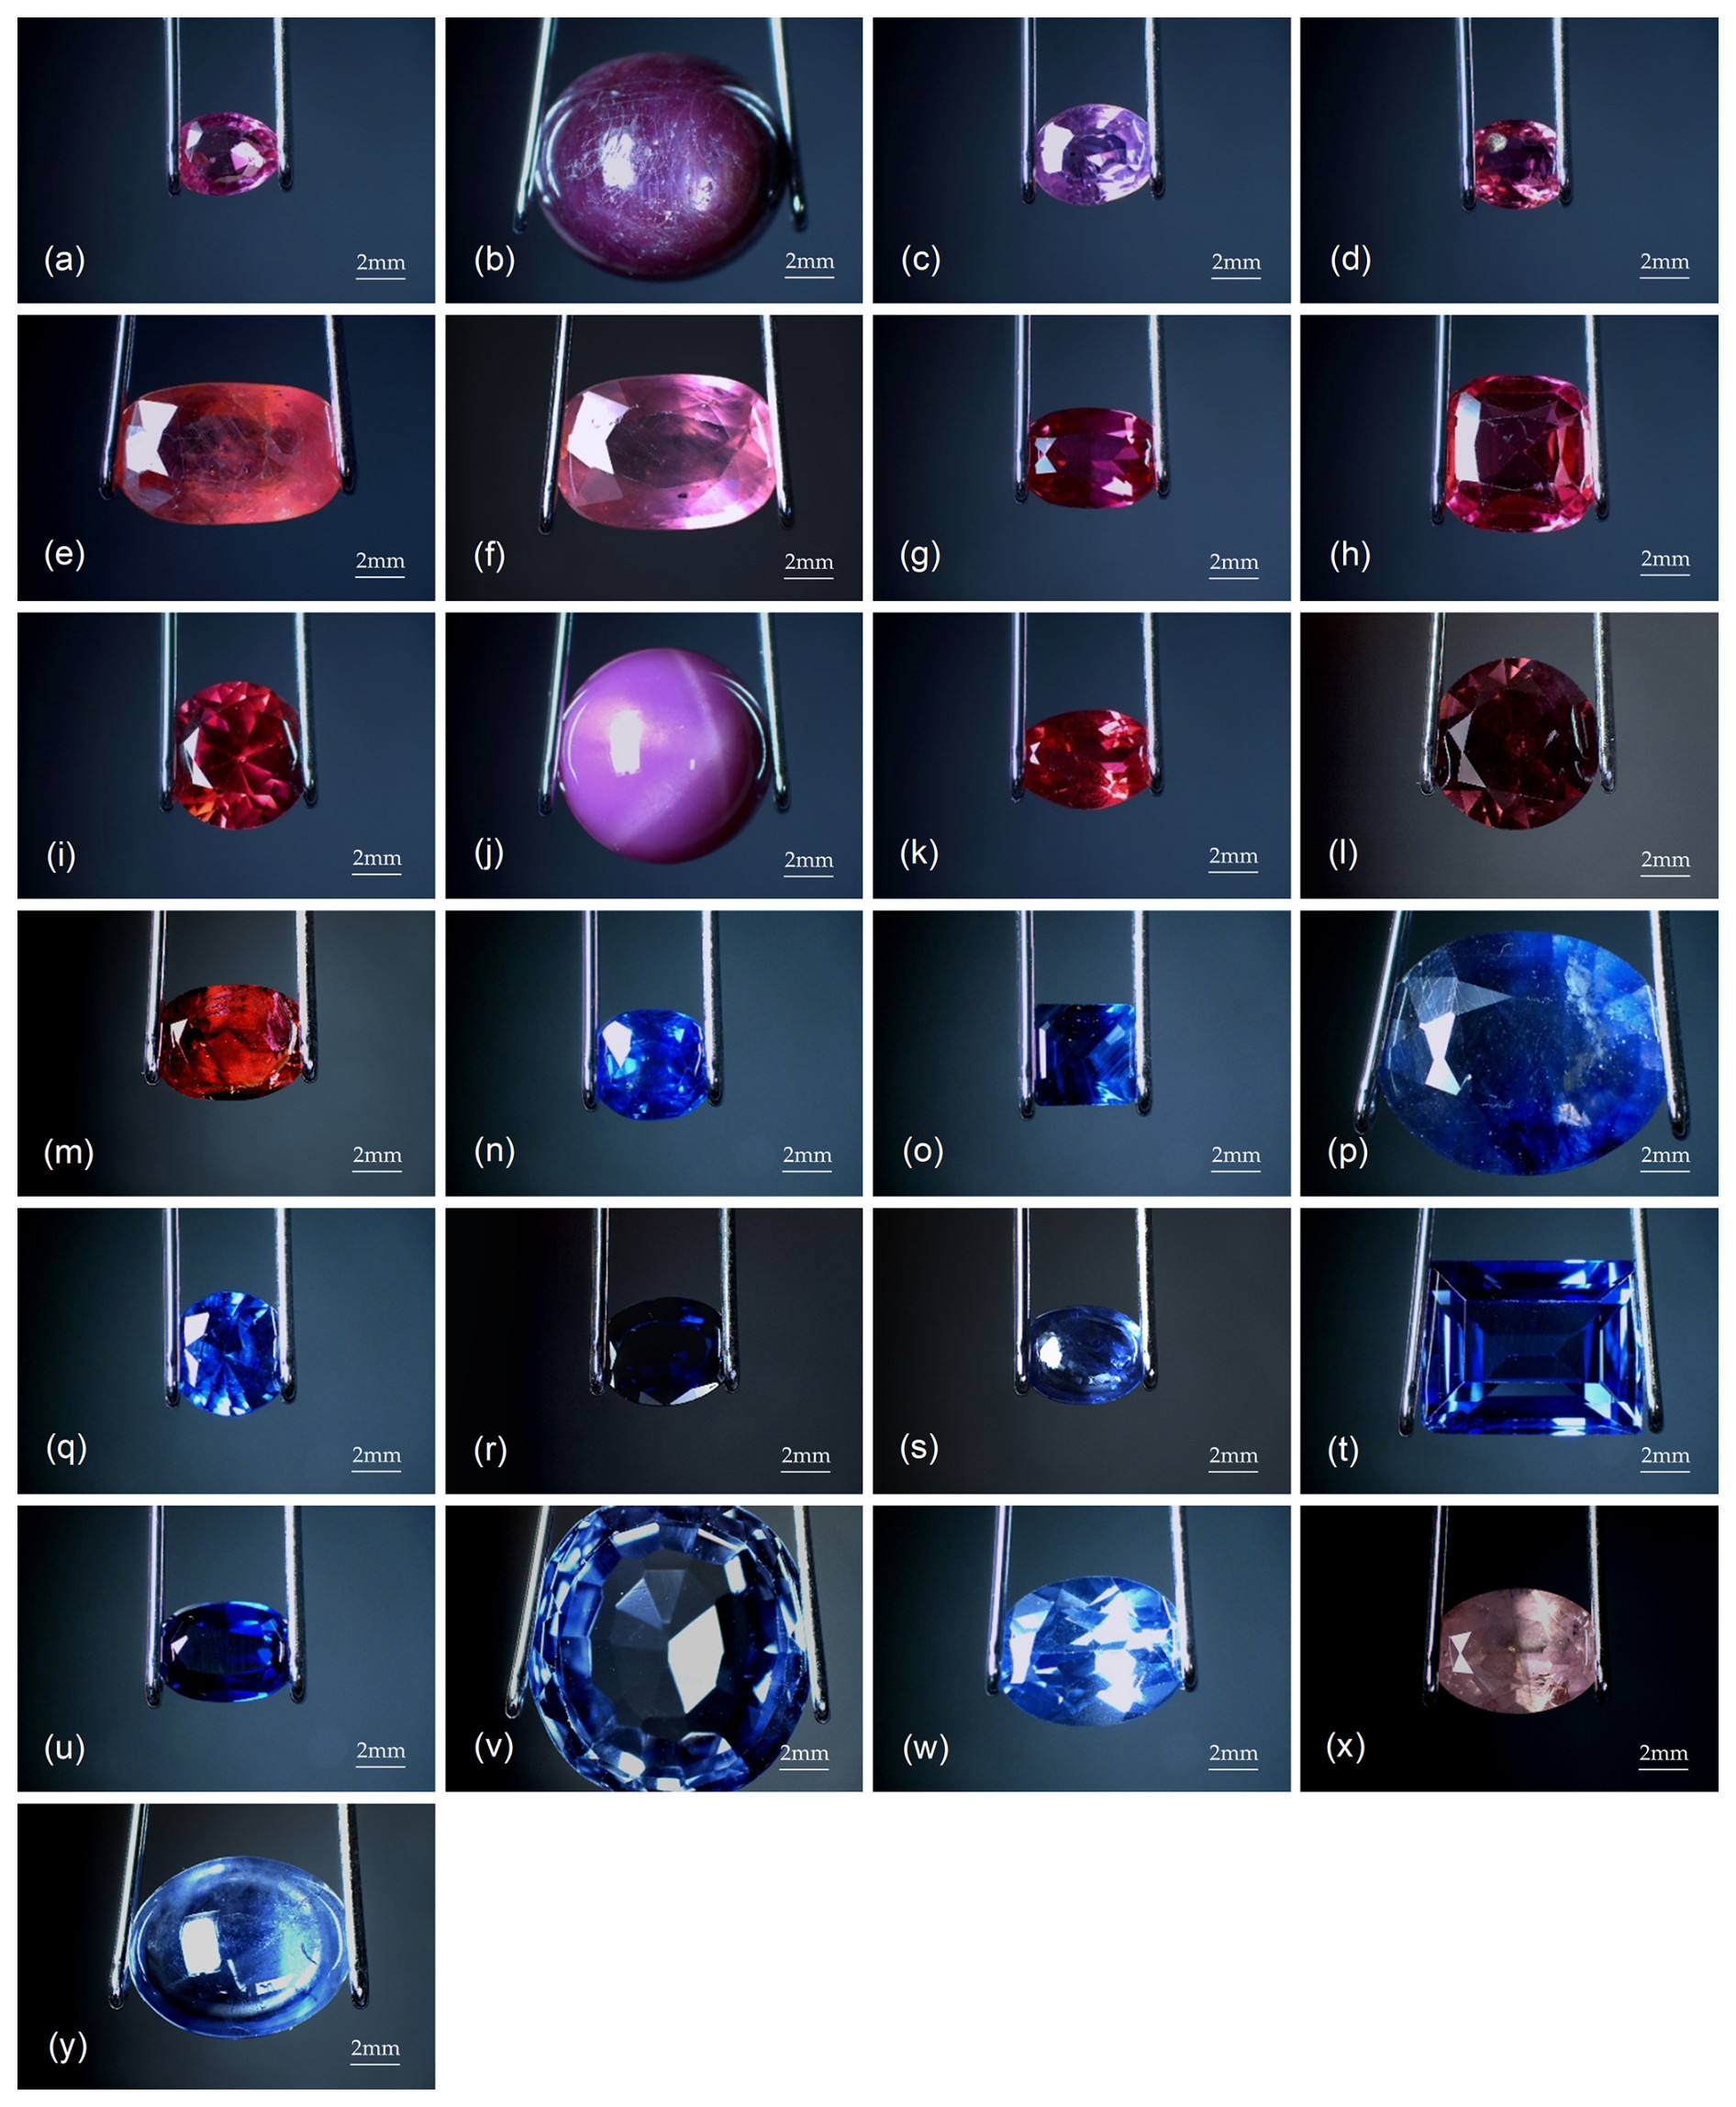
Figure 1(a) Natural ruby RN1, (b) natural ruby RN2, (c) natural ruby RN3, (d) natural ruby RN4, (e) natural ruby (glass-filled) RNT1, (f) natural ruby (glass-filled) RNT2, (g) synthetic ruby (Verneuil) RS1, (h) synthetic ruby (Verneuil) RS2, (i) synthetic ruby (Verneuil) RS3, (j) synthetic ruby (Verneuil) RS4, (k) synthetic ruby (flux) RS5, (l) synthetic ruby (flux) RS6, (m) synthetic ruby (flux) RS7, (n) natural sapphire SN1, (o) natural sapphire SN2, (p) natural sapphire (glass-filled) SNT1, (q) natural sapphire (diffusion-treated) SNT2, (r) natural sapphire (diffusion-treated) SNT3, (s) natural sapphire (diffusion-treated) SNT4, (t) synthetic sapphire (Verneuil) SS1, (u) synthetic sapphire (Verneuil) SS2, (v) synthetic sapphire (Verneuil) SS3, (w) synthetic sapphire (flux) SS4, (x) synthetic sapphire (flux) SS5, and (y) synthetic sapphire (flux) SS6. Overhead illumination, 3.75×.
Table 1Gemological properties of the characterised stones.
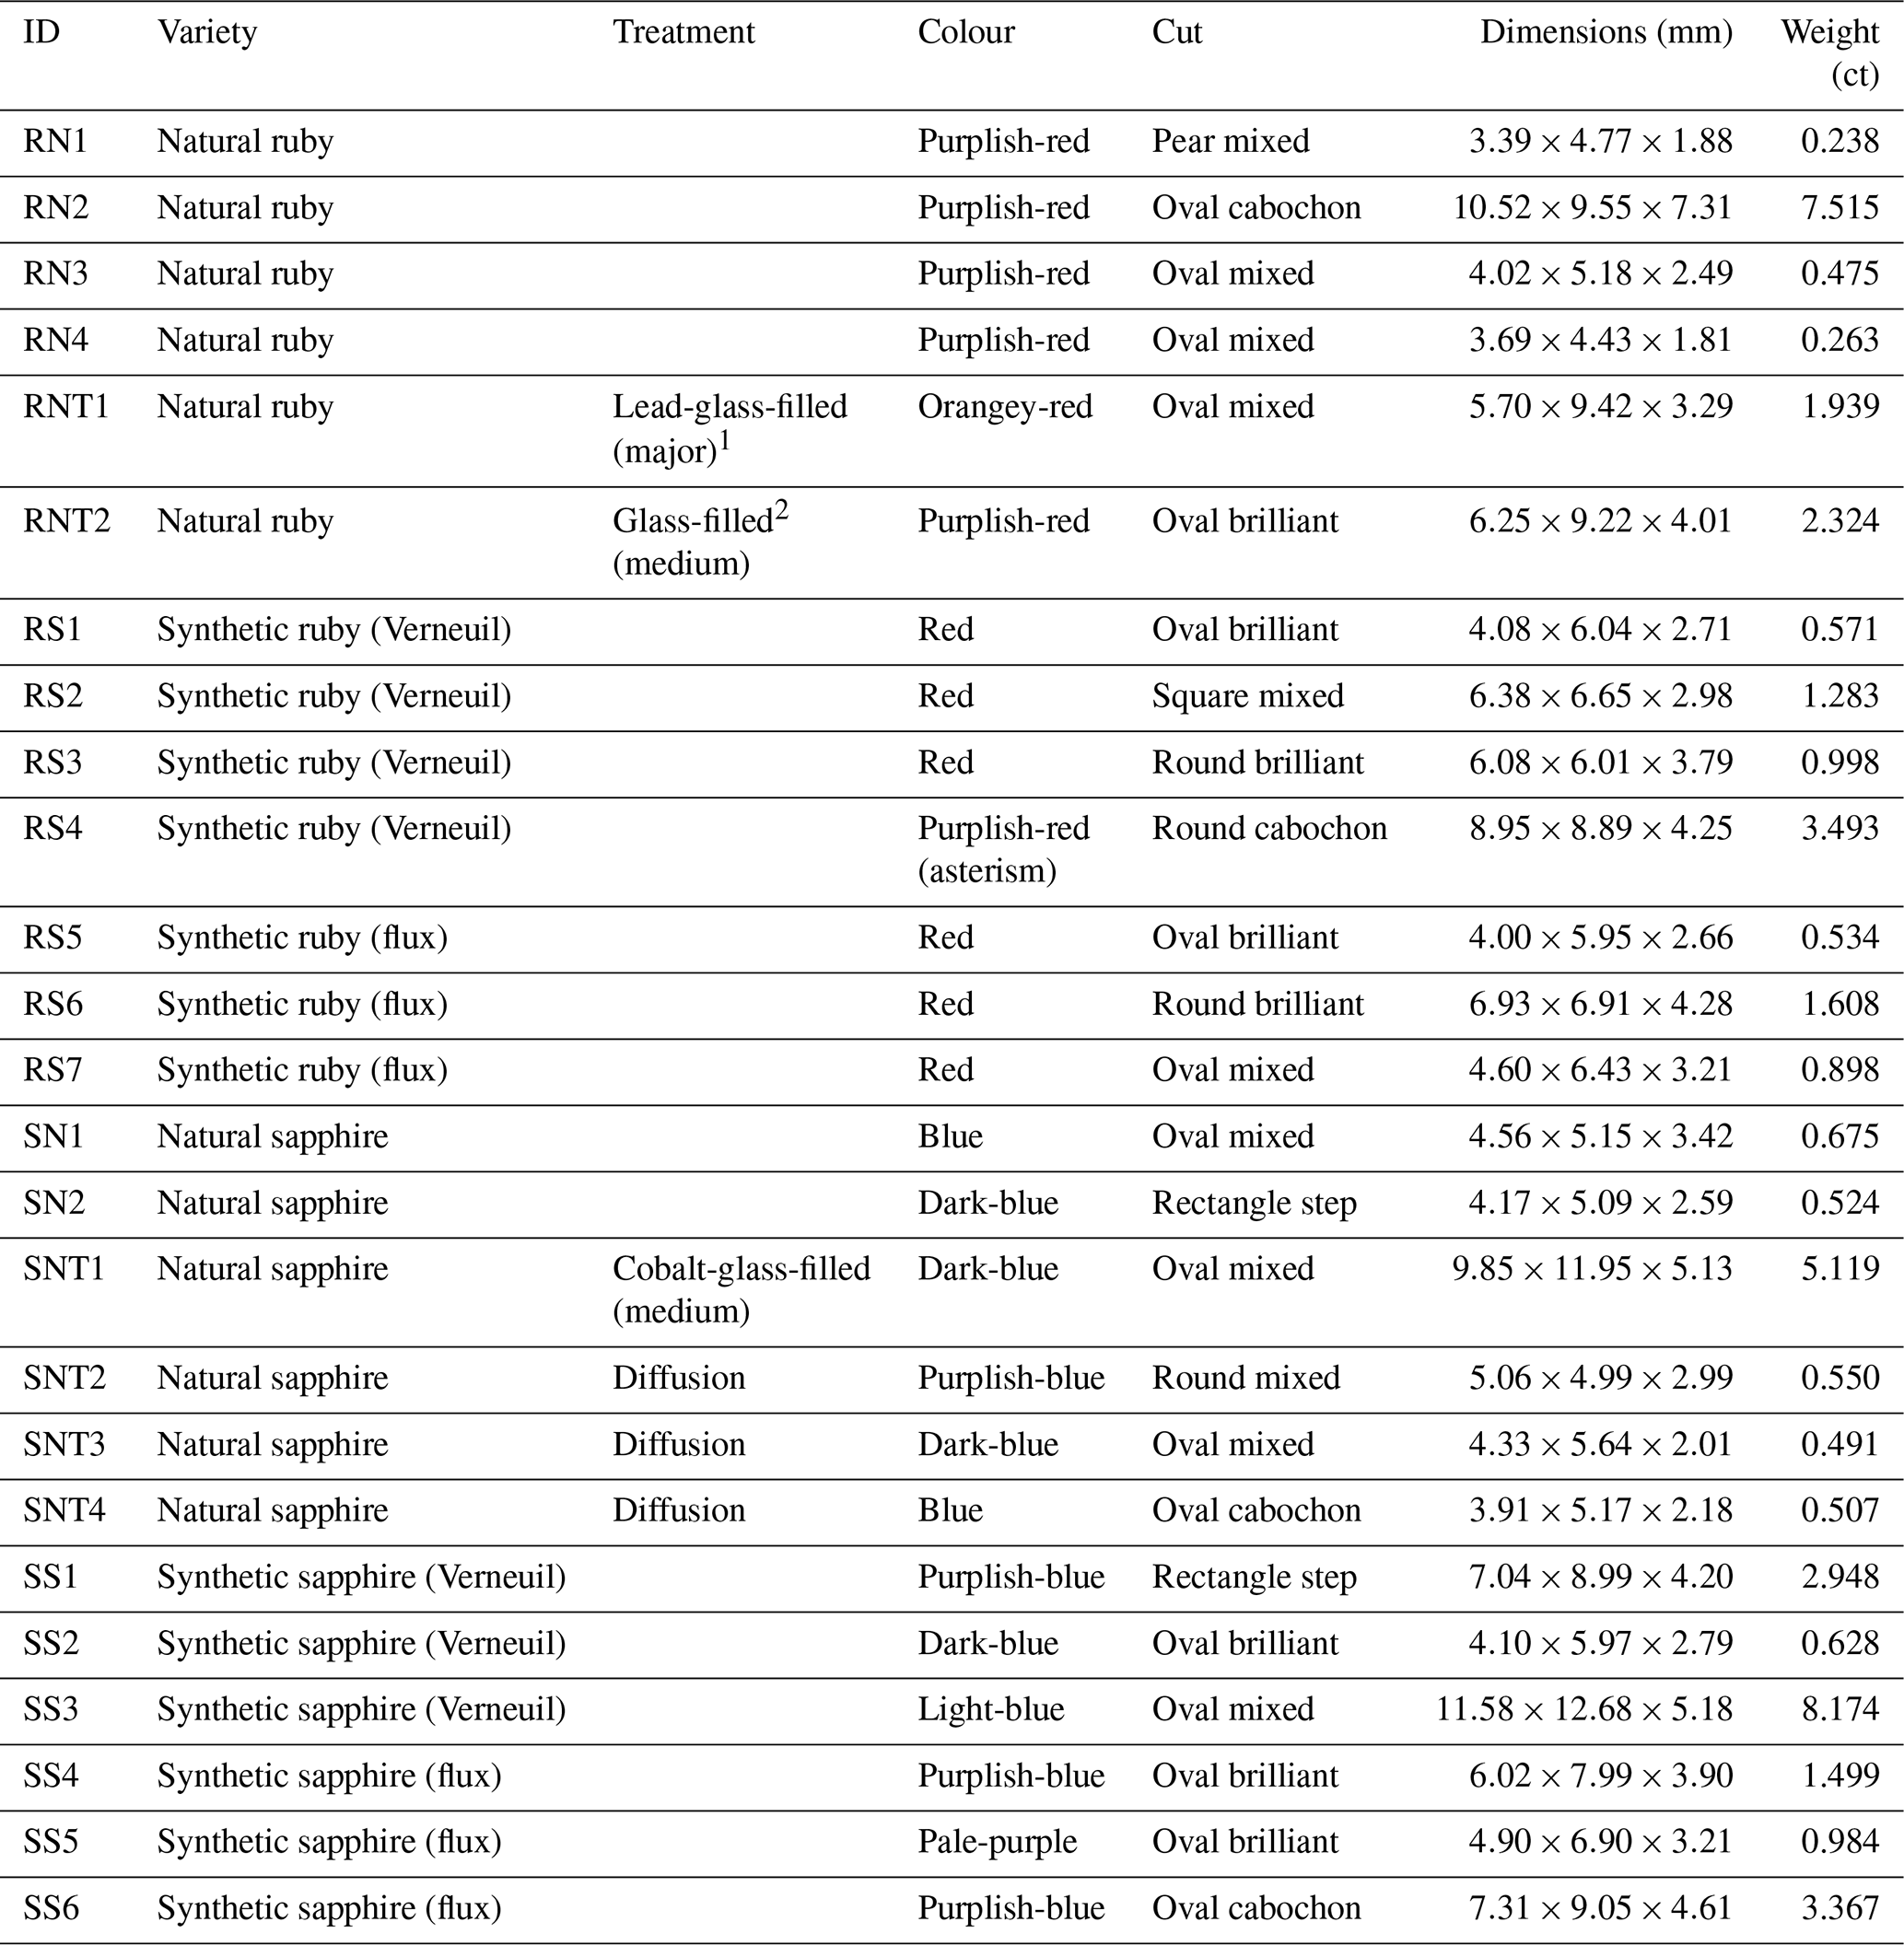
1 The terms “major” and “medium” are related to the quantity of glass present in the stone, judging by visual inspection. 2 It was not possible to determine the type of glass used to treat this stone.
While classical methods of gemological characterisation and study have certain limitations in this task, Fourier-transform infrared (FTIR) spectroscopy, a non-destructive method based on the detection of molecular vibrations, has proven to be a technique with great potential. Traditionally used on other materials for a variety of purposes, this technique represents a very significant advance in the study of gemological materials, including corundum, allowing the identification of the minerals and their impurities (Hainschwang and Notari, 2008). As a nominally anhydrous mineral, corundum can incorporate a certain amount of hydrogen in the form of structural OH groups, which can be observed using infrared spectroscopy. This allows us to obtain very valuable information about a gemstone in a short time (Balan, 2020). FTIR spectral fingerprints can also be used as a reference for future analyses, making it possible to compare the spectral information of different stones (Fritsch and Stockton, 1987).
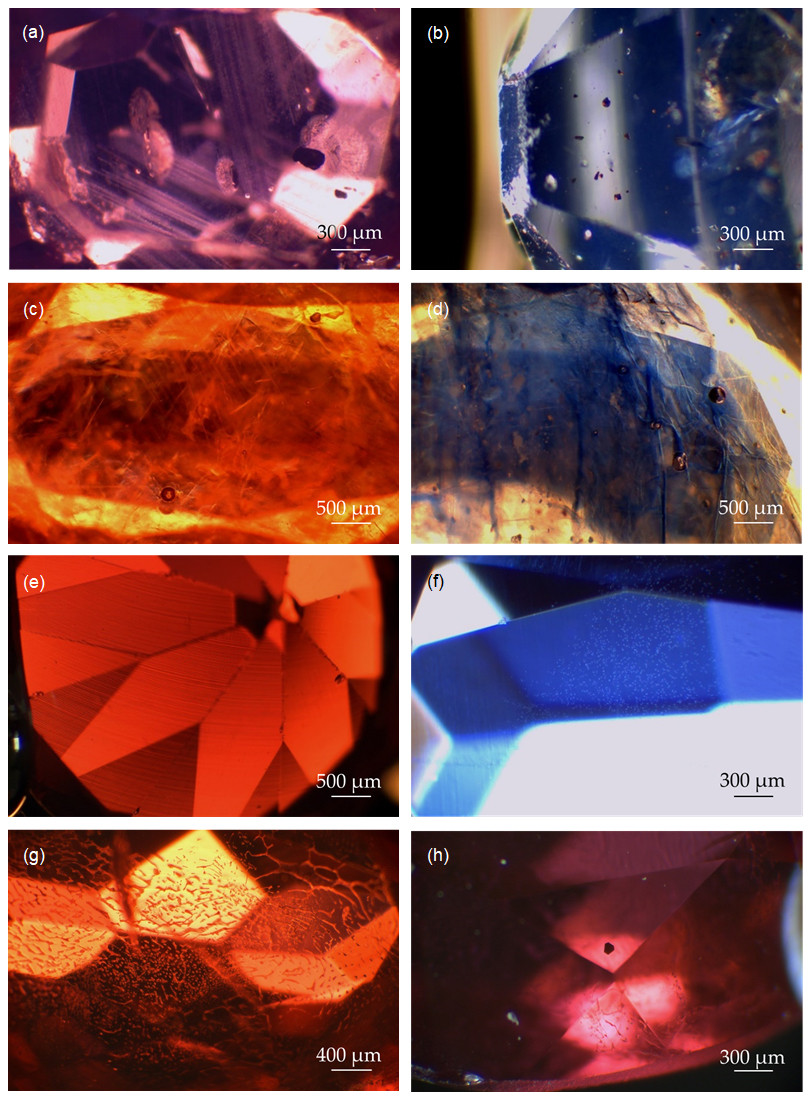
Figure 2(a) Bands of rutile particles and partially healed fissures in natural ruby RN3 (dark-field illumination, 25×). (b) Red crystals in natural sapphire SN1 (possibly pyrochlore) (dark-field illumination, 25×). (c) Internal fissures with a cloudy appearance and gas bubbles in glass-filled ruby RNT1 (dark-field illumination, 15×). (d) Internal fissures with colour concentration and gas bubbles in glass-filled sapphire SNT1 (dark-field illumination, 15×). (e) Curved growth marks in Verneuil ruby RS3 (dark-field illumination, 15×). (f) Gas bubbles visible in Verneuil sapphire SS2 (dark-field illumination, 25×). (g) Flux residue in flux-grown ruby RS5 (dark-field illumination, 20×). (h) Hexagonal opaque inclusion in flux-grown ruby RS5 (possibly platinum)(overhead illumination, 25×).
In order to contribute to a simpler and faster approach to the identification of gem-quality corundum, in this study, the spectral fingerprints of a group of 25 natural, synthetic, and treated rubies and sapphires belonging to the Gemology School of the University of Barcelona are established using FTIR spectroscopy. The analysis was complemented by a standard gemological characterisation.
A total of 25 rubies and sapphires belonging to the Gemology School of the University of Barcelona were selected for this study, whose related microscopy images are shown in Fig. 1. Sample IDs were defined by specifying the stone variety (R for ruby, S for sapphire) followed by their origin (N for natural, S for synthetic). Additionally, T was used to refer to treated gemstones. This set consisted of six natural rubies, seven synthetic rubies, six natural sapphires, and six synthetic sapphires.
Standard gemological instruments were used to measure stone properties. A combination of long- (365 nm) and short-wave (254 nm) Raytech ultraviolet (UV) lamps were used for fluorescence observations. Microscopic observation was performed using a Motic GM-171 microscope, with a magnification capacity of 3.75× to 25×, equipped with a dark-field, bright-field, and overhead illumination system and a Moticam S6 camera.
FTIR spectroscopy was performed using a PerkinElmer Frontier FTIR spectrometer equipped with an optical potassium bromide (KBr) beam splitter and a triglycine sulfate (TGS) detector, adapted with a diffuse reflectance accessory. The spectra between 400 and 4000 cm−1 were obtained through 32 scans, and the resolution was set at 4 cm−1, with 1.928 cm−1 data spacing. Before each measurement, the spectrometer was calibrated with KBr. Spectra were collected using the PerkinElmer Spectrum software.
It is well known that spectra are closely related to the way the incident radiation passes through each stone. Then, factors such as position, cut, size, transparency, fractures, and inclusions can largely affect the spectral output (Thongnopkun and Ekgasit, 2005). To ensure high-quality results and to assess the influence of sample positioning on spectral data consistency, variables such as the gemstone orientation and placement on the spectrometer were tested. The optimal position was adjusted according to the specific characteristics of each sample, and the x positions of the absorption peaks were analysed to verify consistency.
3.1 Gemological properties
The analysed stones presented masses ranging from 0.238 to 8.174 ct. The cuts were mostly mixed. Some stones varied between brilliant, step, or cabochon cuts. The colours of the rubies ranged from red to purplish red, while the sapphires ranged from pale purple to blue (see Table 1). Most of the stones were transparent, except for stones RN2 and RS4, which were opaque, and RNT1, RNT2, and SNT1, which were translucent due to the glass-filled fissures.
Refractive indexes were those typical of corundum, with a slight increase in stone SNT1 due to the presence of cobalt glass (1.765–1.773) (Leelawatanasuk et al., 2013). Stones RNT1 (filled with lead glass), RNT2, and SNT1 (filled with cobalt glass) had a higher specific gravity (4.02, 4.18, and 4.08).
Regarding the response of gemstones to UV radiation, natural rubies exhibited a weak to very strong red colour under long-wave radiation (365 nm). The weak red shown by ruby RNT1 was caused by the presence of lead glass (Pardieu, 2010). Synthetic rubies showed a very strong red, and sapphires were all inert except for stone SNT1, which was filled with cobalt glass. This stone exhibited a weak orange-red colour, also observed by Leelawatanasuk et al. (2013), characteristic of cobalt-glass-filled sapphires. All the stones were inert under short-wave UV radiation (254 nm).
As for pleochroism, all rubies showed purple to red dichroism, and natural and synthetic sapphires showed significant differences in this respect. Natural sapphires exhibited blue to violet-blue dichroism, while a violet-blue to greenish-blue dichroism was observed in synthetic sapphires. Stones RNT1 and SNT1 showed weaker dichroism, which Leelawatanasuk et al. (2013, 2015) attributed to the isotropy of the glass. Absorption spectra showed the expected characteristics for the different varieties of corundum, except for stone SNT1. This cobalt-glass-filled sapphire showed absorption bands between 500 and 565, 580 and 600, and 630 and 660 nm, typical of cobalt glass (de Miranda Pinto et al., 2011), and a weak line at 450 nm, corresponding to the presence of iron in the sapphire.
The microscopic images of selected rubies and sapphires are shown in Fig. 2. Microscopic observation revealed the presence of rutile inclusions as the main characteristic of the untreated natural specimens. These were present in the form of needles, particles, and angular bands forming along growth features. Partially healed fissures and tension halos were also detected. In addition, these stones contained a variety of unidentified mineral inclusions (Fig. 2a). Apparent pyrochlore crystals were observed in stone SN1, suggesting a natural basaltic origin (Soonthorntantikul et al., 2019) (see Fig. 2b).
Glass-filled stones showed a cloudy appearance and zones of colour concentration with an iridescent effect on the internal fissures as their main characteristics. Several typical trapped gas bubbles were also detected in the filled fissures (Fig. 2c, d). The surfaces of these stones showed differences in relief and lustre (Kane, 1984).
Diffusion-treated natural sapphire showed very fine rutile particles. The size of the rutile crystals and the absence of other inclusions were indicative of the high temperatures to which the sample was subjected (Emmett et al., 2003).
Apart from the cabochon-cut stones, all Verneuil specimens exhibited curved growth marks (Fig. 2e), with gas bubbles visible in some samples (Fig. 2f).
The most distinctive aspect of the flux-grown synthetic specimens was the presence of flux residue (Fig. 2g). Additionally, stone RS5 showed a hexagonal opaque inclusion, most likely platinum originating from the growth crucible, which is typical of specimens from this synthesis (Fig. 2h) (Gubelin and Koivula, 2004; Pellicer, 2001).
Table 2Main absorption peaks and bands in the FTIR spectrum (in cm−1) of the stones and their causes.

* Balan (2020), Beran and Rossman (2006), Bidny et al. (2010), Cartier (2009), Chen et al. (2021), Efimov et al. (2003), Karantoni et al. (2021), Kumar and Boerger (2014), Leelawatanasuk et al. (2013), Monarumit et al. (2014), Phlayrahan et al. (2018), Saengbuangamlam and Bupparenoo (2022), Scholze (1991), Serov (2012), Soonthorntantikul et al. (2019), and Volynets et al. (1972).
Table 3Characteristic absorption peaks and bands of the different varieties and treatments for ruby and sapphire.
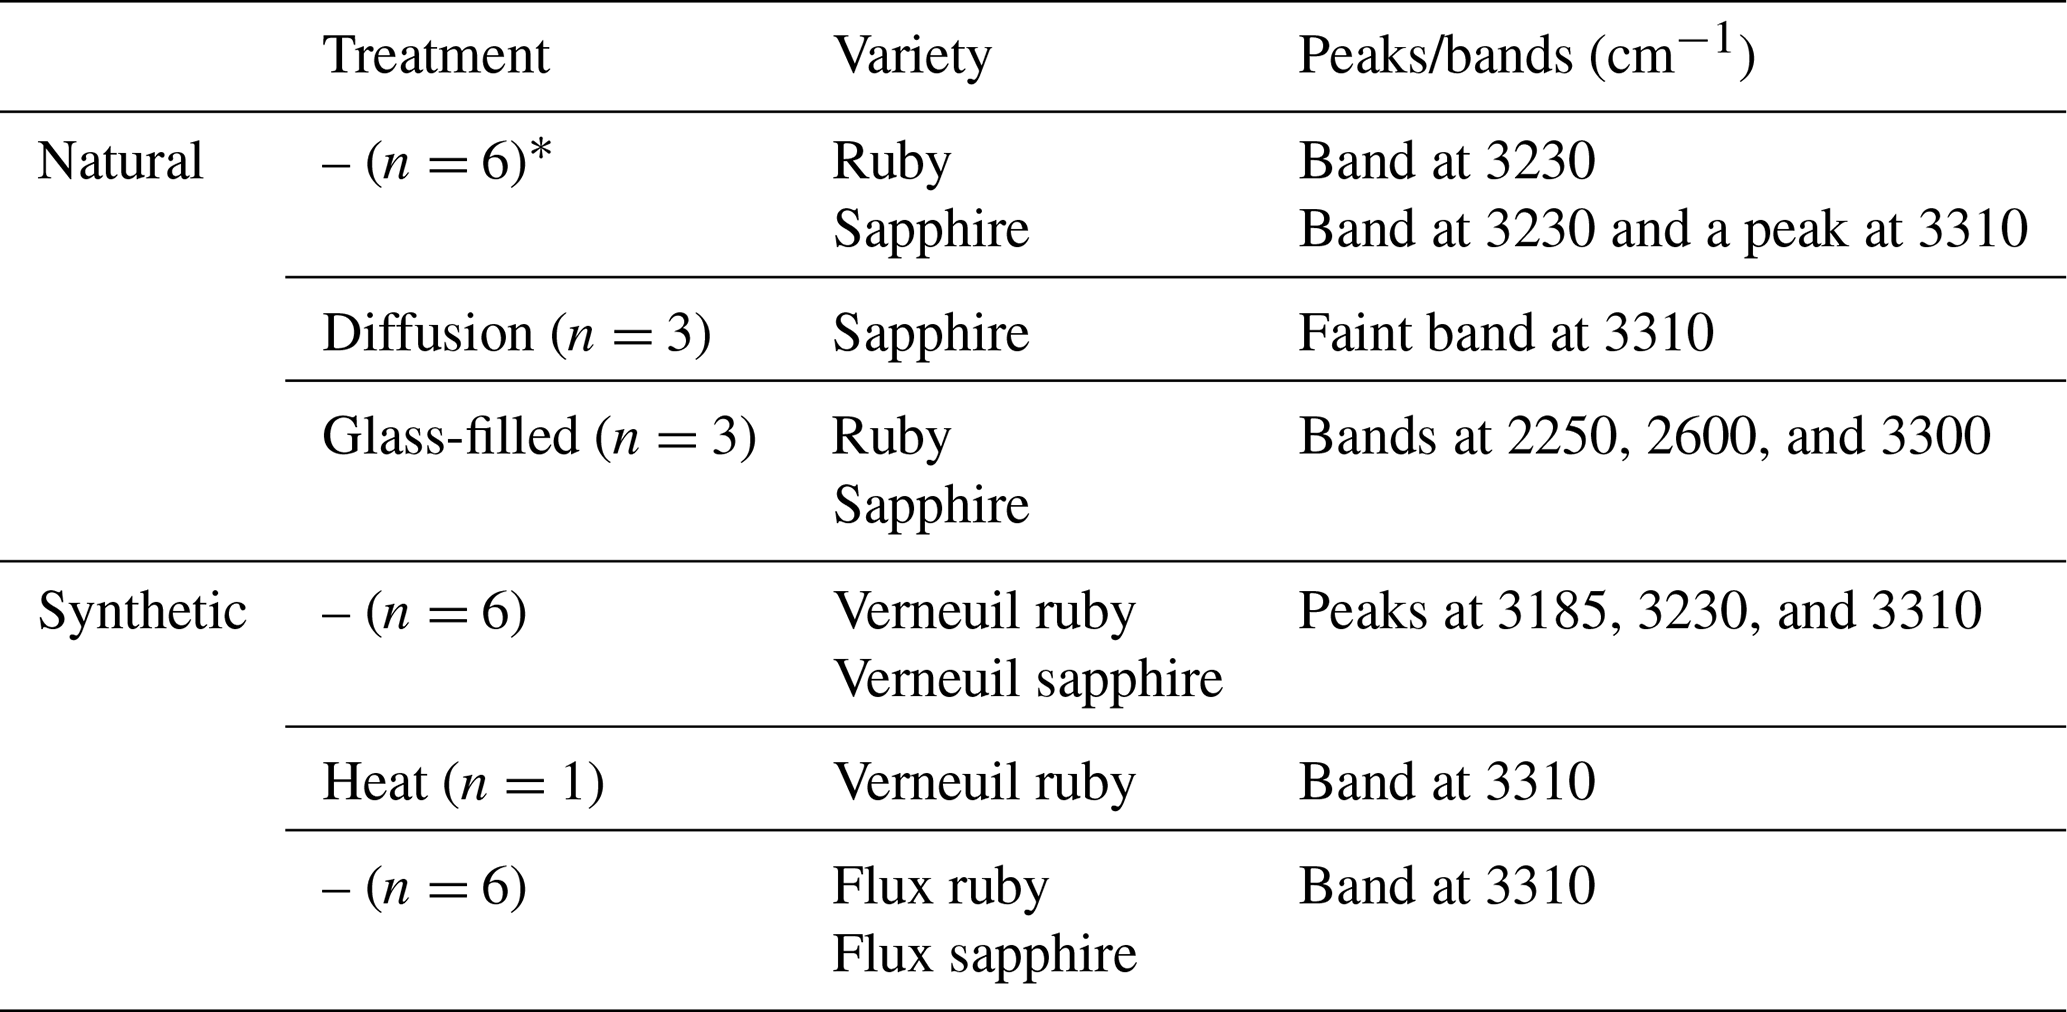
*n means the number of samples analysed.
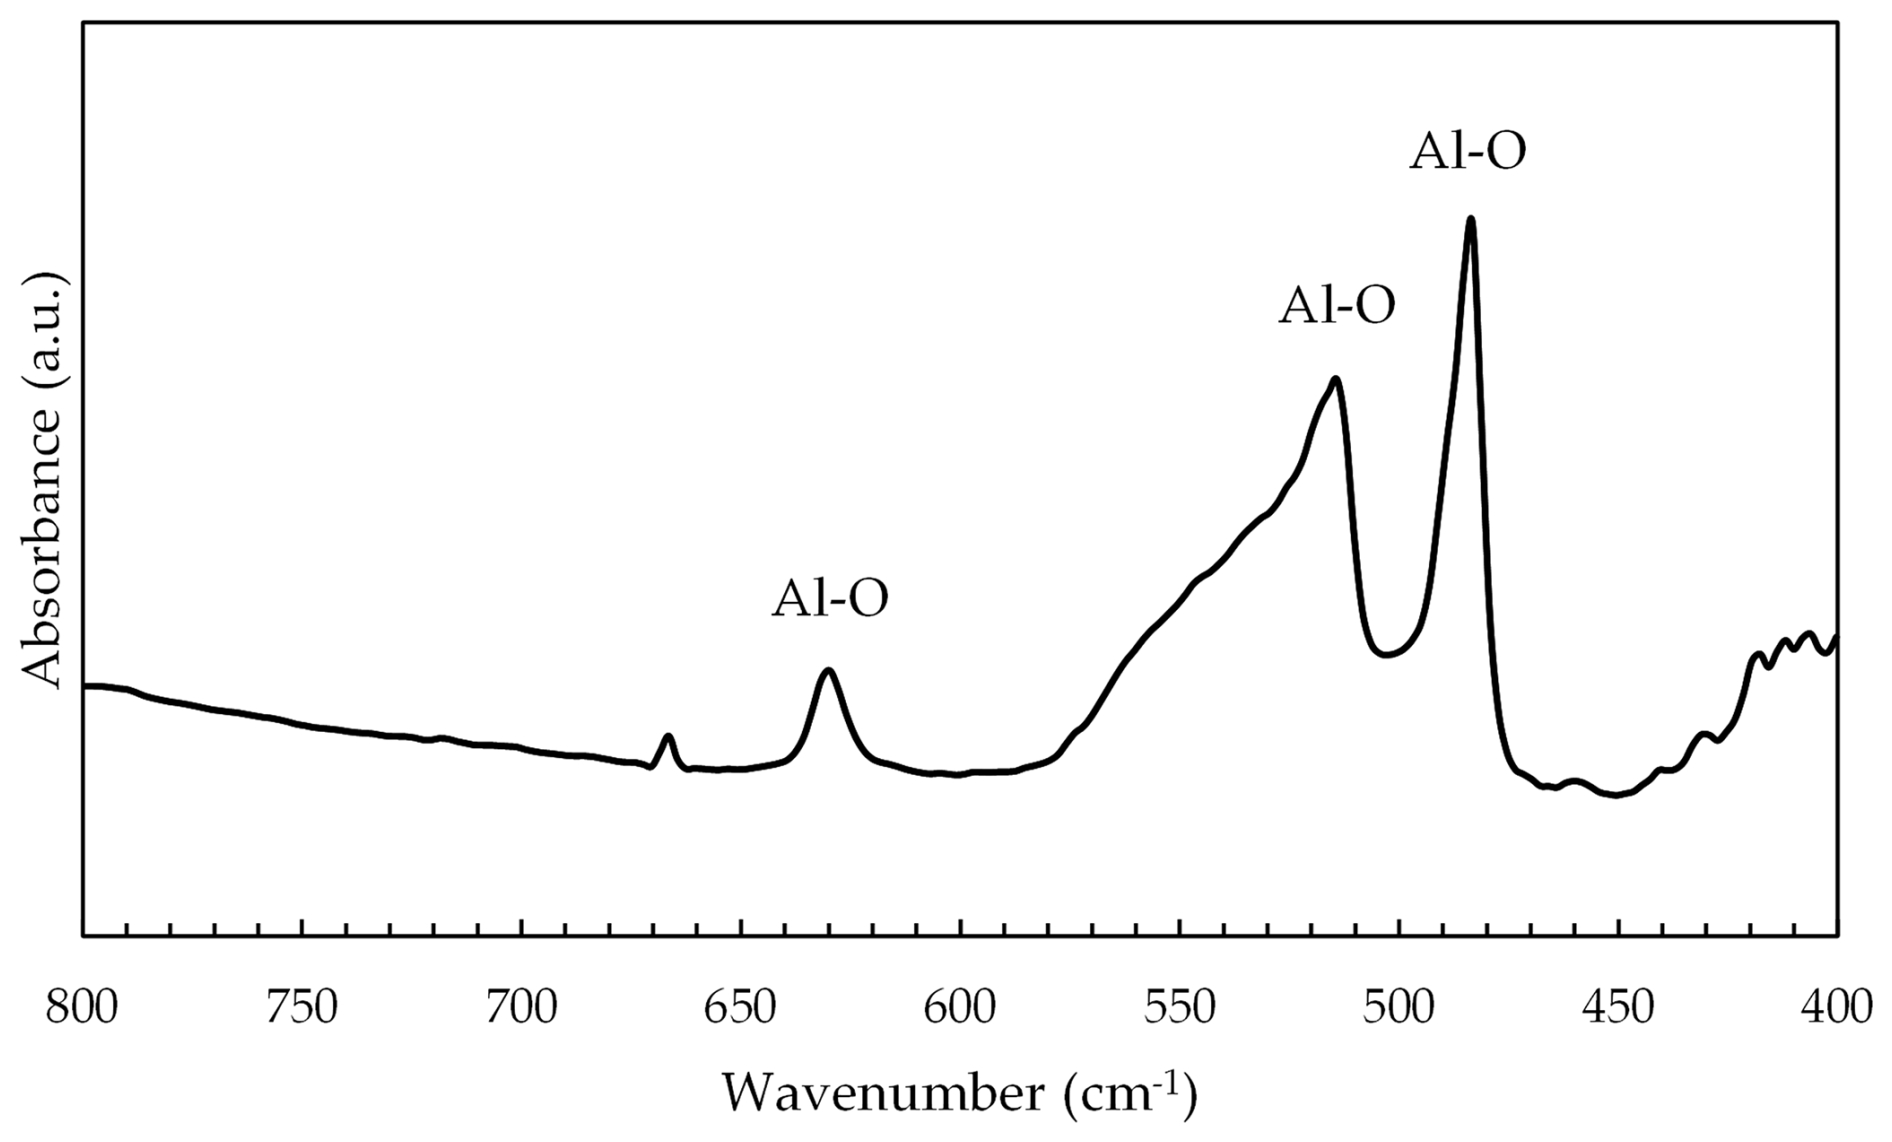
Figure 3Al2O3 peaks observed in the FTIR spectrum of the sapphire SN1 in the 900–400 cm−1 region.
3.2 FTIR
In Table 2, the main absorption FTIR peaks and bands observed for each stone are summarised.
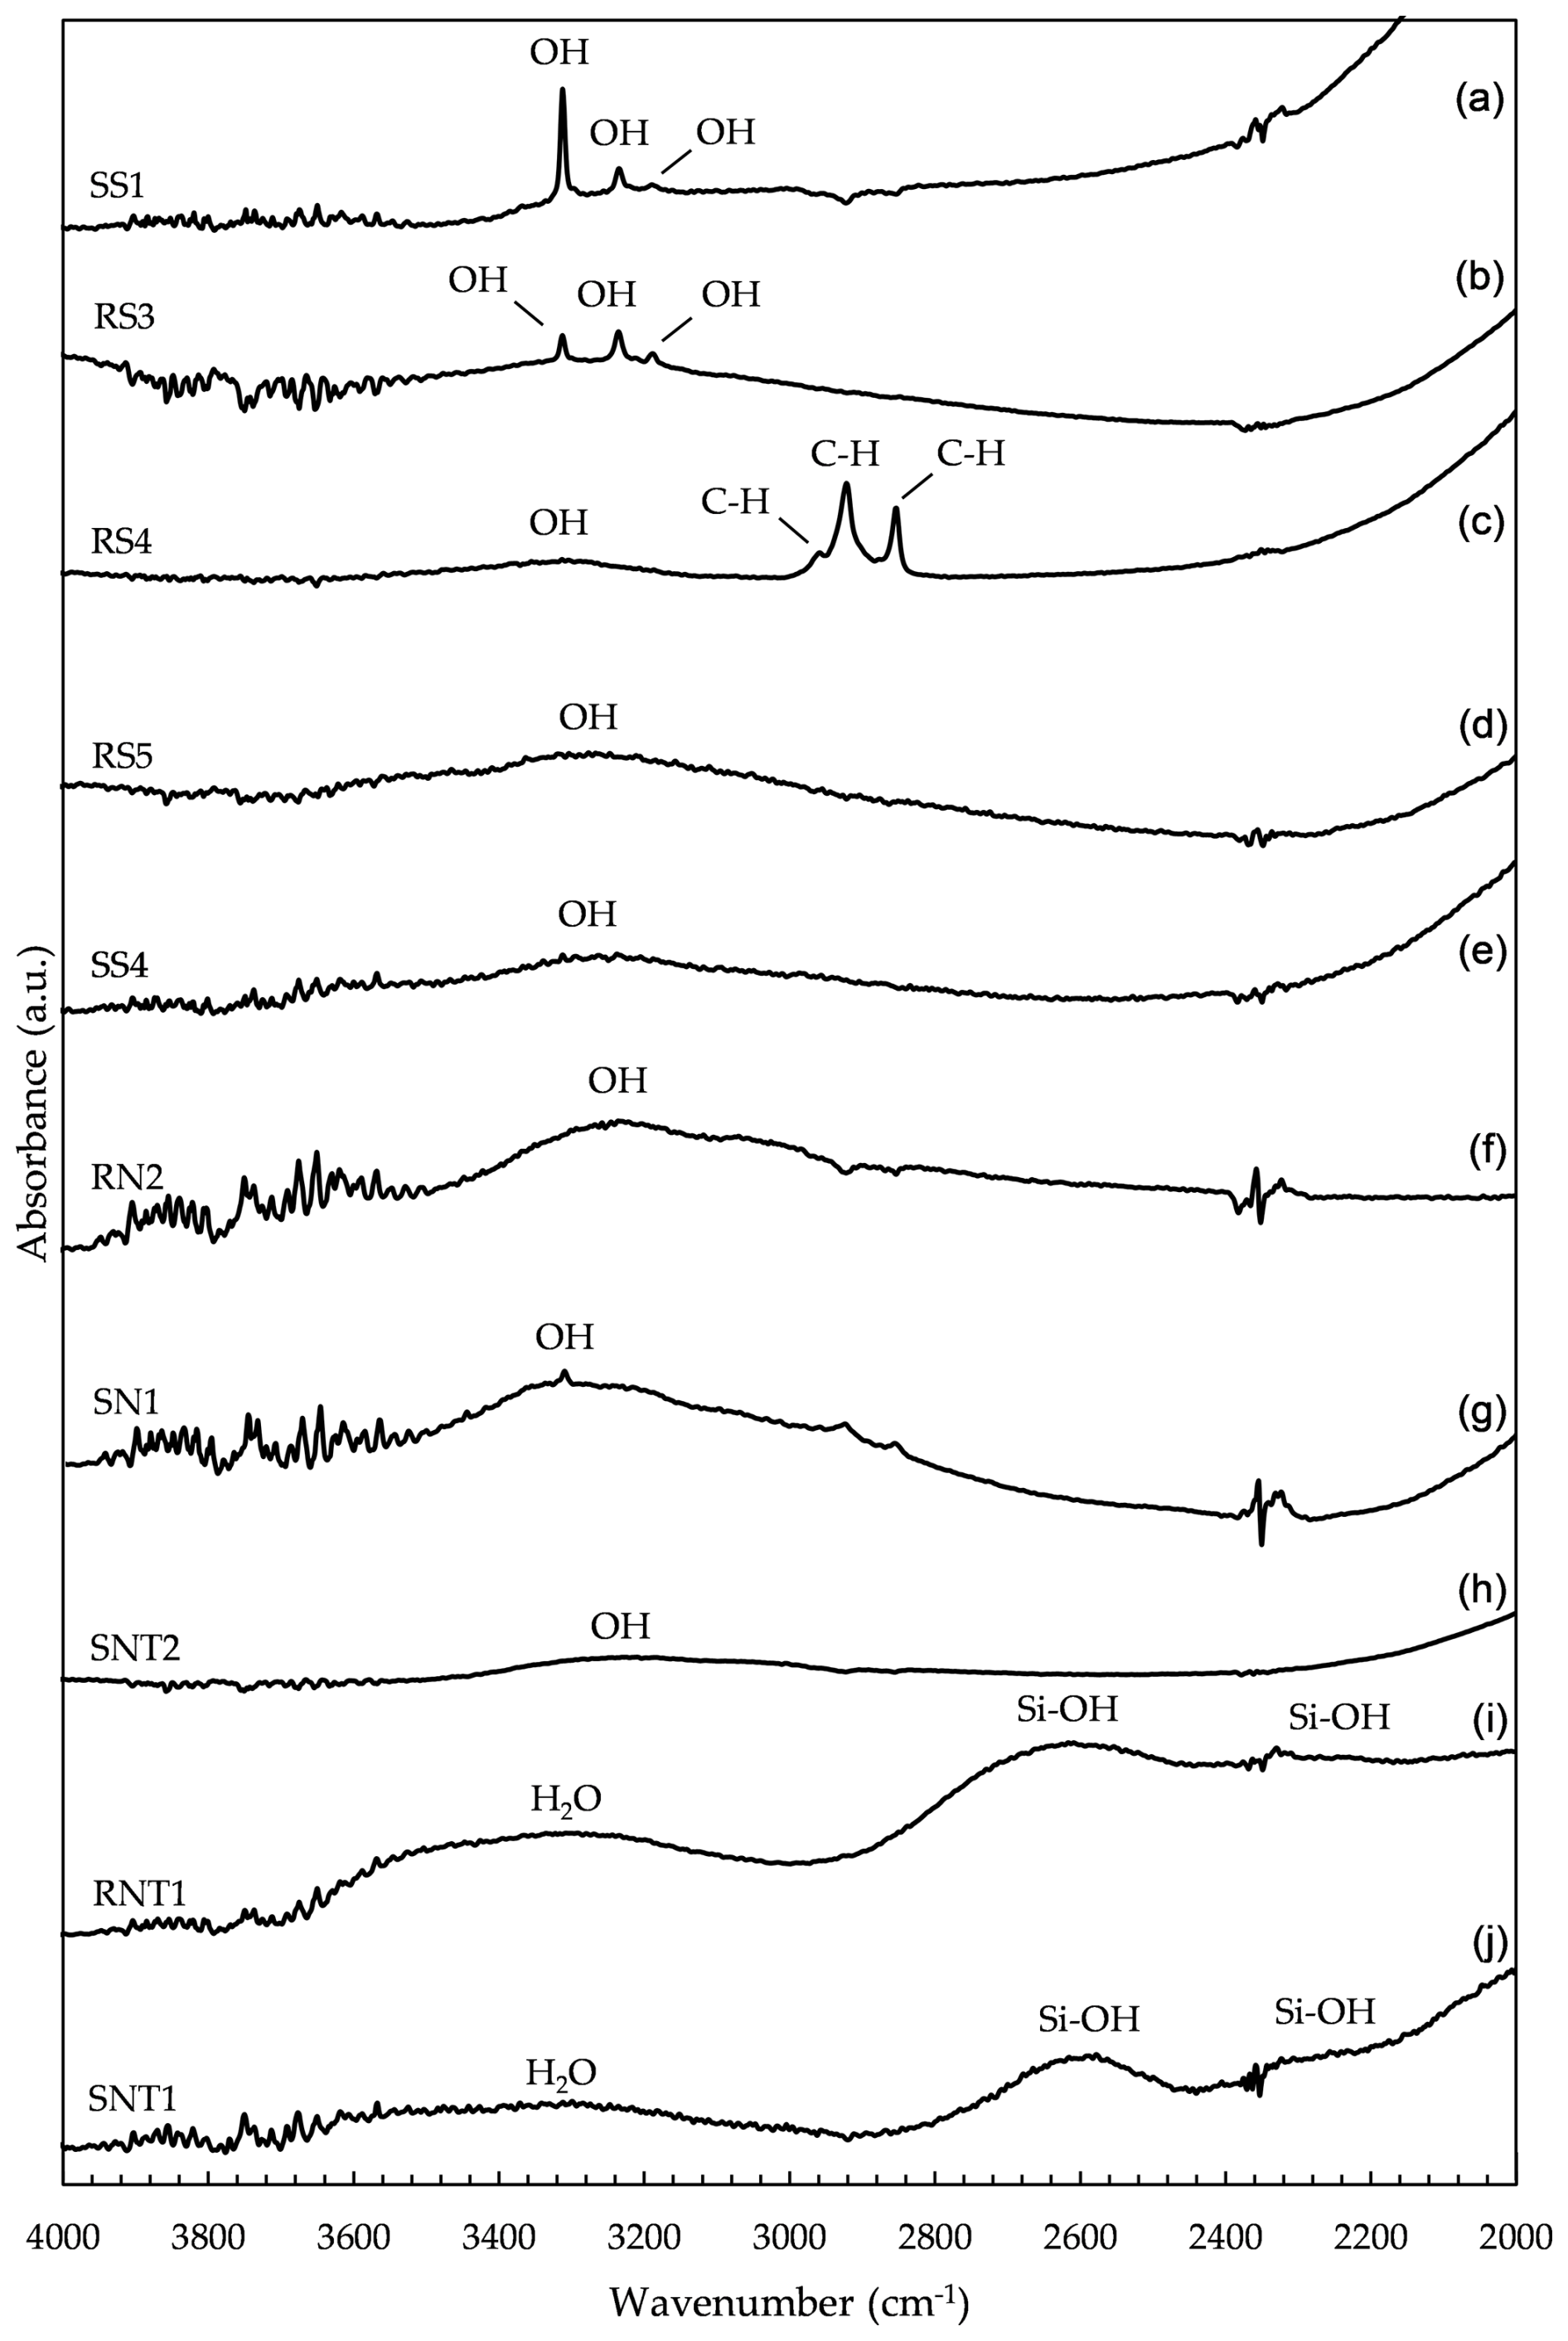
Figure 4FTIR spectra of Verneuil sapphire SS1 (a), Verneuil ruby RS3 (b), Verneuil ruby RS4 (c), flux ruby RS5 (d), flux sapphire SS4 (e), untreated natural ruby RN2 (f), untreated natural sapphire SN1 (g), diffusion-treated natural sapphire SNT2 (h), glass-filled ruby RNT1 (i), and glass-filled sapphire SNT1 (j) in the 4000–2000 cm−1 region.
All the stones showed the characteristic peaks of Al2O3. These peaks were located at 485, 515, and 630 cm−1 and were attributed to the structural vibrations of Al–O (Chen et al., 2021). Figure 3 shows these peaks clearly visible in the sapphire SN1 spectrum.
A series of peaks around 2350 cm−1 were also exhibited by all gemstones, which may be associated with CO2 from fluid inclusions and/or atmospheric CO2, unrelated to the stone (Karantoni et al., 2021).
Figure 4 shows characteristic FTIR spectra for gemstones analysed in this work within the region from 4000 to 2000 cm−1.
Verneuil specimens showed absorption peaks at 3185, 3230, and 3310 cm−1 (see Fig. 4a, b). According to Beran and Rossman (2006), these may be associated with OH bonds in the stone's structure. The 3310 cm−1 peak became more intense in sapphires (Fig. 4a). Phlayrahan et al. (2018) related this peak to the presence of TiO2 in corundum, attributing it to the stretching of the Ti–OH bonds. Although not a determining factor in the identification of a Verneuil specimen, the presence of these three peaks may be a good indicator of a synthetic material, as it is less common in untreated natural specimens (Beran and Rossman, 2006).
In addition to those mentioned above, Verneuil ruby RS2 showed additional peaks at 3160 and 3280 cm−1. Volynets et al. (1972) also reported these peaks in Verneuil synthetic corundum, relating them to structural OH.
Verneuil ruby RS4 only showed a weak absorption band centred at 3310 cm−1. Monarumit et al. (2014) described the disappearance of the 3184, 3237, and 3309 cm−1 peaks in Verneuil specimens after high-temperature treatment (1650 °C). This was attributed to the breaking of metal–OH bonds. The spectra of these specimens also exhibited two strong additional peaks at 2850 and 2918 cm−1 and another less intense one at 2955 cm−1, which were assigned to C–H stretching vibrations. Given the high intensity of the peaks, they could have been caused by the presence of artificial resin. Krzemnicki (2018) reported similar peaks in a ruby filled with artificial resin (Fig. 4c).
The flux specimens (RS5 and SS4) showed an absorption band centred at 3310 cm−1 (Fig. 4d, e). The lack of characteristic peaks in the OH region (3100–3600 cm−1) (Beran and Rossman, 2006) helped to confirm their synthesis. Flux specimens are synthesised from pure Al2O3, with the addition of some metallic elements, and are free of OH or H2O in their composition (Bidny et al., 2010; Kane, 1982).
All untreated natural stones exhibited a broad absorption band, with a maximum at 3230 cm−1 associated with structural OH (Fig. 4f, g). In sapphires, these bands showed a peak at 3310 cm−1 (Fig. 4g). As with Verneuil sapphires, the difference between the two varieties may be caused by TiO2.
Diffusion-treated natural sapphires showed an almost undetectable band centred at around 3310 cm−1 (Fig. 4h). The high temperatures to which the stones are subjected by this treatment may cause the removal of hydrogen in the stone and, consequently, a decrease in the absorption related to OH bonds (Emmett et al., 2003).
Typical absorption bands at 2250, 2600, and 3300 cm−1 for glass-filled corundum (Leelawatanasuk et al., 2013; Pardieu, 2010) were discerned in natural rubies (RNT1 and RNT2) and sapphire (SNT1) that were subjected to this treatment (Fig. 4i, j). Among these signals, Scholze (1991) attributed the band at 3300 cm−1 to the absorption of water molecules. The bands at 2250 and 2600 cm−1 were related to Si–OH vibrations (Efimov et al., 2003). They were more intense in sample RNT1, which is consistent with the amount of glass present in the stone, as judged by visual inspection. According to Serov (2012), the amplitude of the bands reflects the amount of glass present in the gemstone.
Table 3 summarises all the characteristic absorption bands for the different types of ruby and sapphire analysed.
As shown, all untreated gemstones presented a band at 3230 cm−1, with an additional peak in sapphires at 3310 cm−1. Natural diffusion-treated sapphires showed an almost undetectable band at 3310 cm−1, whereas typical broad bands for those that were glass-filled occurred at 2250, 2600, and 3300 cm−1. Regarding Verneuil samples, a series of peaks at 3185, 3230, and 3310 cm−1 were observed, with the peak at 3310 cm−1 being more intense in sapphires. Among them, a Verneuil ruby with evidence of heating treatment (RS4) exhibited a band centred at 3310 cm−1. Finally, synthetic-flux gemstones showed a band at 3310 cm−1.
We examined a set of 25 rubies and sapphires, both natural and synthetic, using FTIR spectroscopy to establish a reliable methodology for distinguishing natural from synthetic stones, as well as identifying diverse treatments.
Gemological analysis and FTIR spectroscopy revealed distinct characteristics in the specimens of different varieties and treatments, with the samples showing specific characteristic bands and peaks.
The results obtained permitted us to distinguish natural rubies and sapphires from their synthetic counterparts or from those that have undergone some kind of treatment. These spectral fingerprints may contribute to existing databases and be applied to future studies of ruby and sapphire identification and to the determination of fraud. In addition, they also provide a simpler and faster approach to FTIR spectroscopy analysis.
All data derived from this research are presented in Figs. 1, 2, 3, and 4 and Tables 1, 2, and 3.
MGV and EMCG conceptualised the project. Experiments, data acquisition, and analyses were carried out by ASdS, with the supervision of LBG and ADM. The original draft of the paper was prepared by ASdS, and it was revised by MGV and LBG. Funding acquisition was done by MGV. All authors discussed and interpreted the results.
The contact author has declared that none of the authors has any competing interests.
Publisher’s note: Copernicus Publications remains neutral with regard to jurisdictional claims made in the text, published maps, institutional affiliations, or any other geographical representation in this paper. While Copernicus Publications makes every effort to include appropriate place names, the final responsibility lies with the authors.
The authors acknowledge the Gemology School of the University of Barcelona. This research has been supported by the Generalitat de Catalunya (grant no. 2021 SGR 00262) and Erasmus+ P COIMBRA01.
This paper was edited by Giuseppe Cruciani and reviewed by two anonymous referees.
Balan, E.: Theoretical infrared spectra of OH defects in corundum (α-Al2O3), Eur. J. Mineral., 32, 457–467, https://doi.org/10.5194/ejm-32-457-2020, 2020.
Beran, A. and Rossman, G. R.: OH in naturally occurring corundum, Eur. J. Mineral., 18, 441–447, https://doi.org/10.1127/0935-1221/2006/0018-0441, 2006.
Bidny, A. S., Dolgova, O. S., Baksheev, I. A., and Ekimenkova, I. A.: New data for distinguishing between hydrothermal synthetic, flux synthetic and natural corundum, J. Gemmol., 32, 7–13, 2010.
Cartier, L. E.: Ruby and sapphire from Marosely, Madagascar, J. Gemmol., 31, 171–179, 2009.
Chen, S., Tan, H., Zhang, C., Teng, Y., and Zu, E.: Study on gemological characteristics of blue sapphires from Baw-Mar mine, Mogok, Myanmar, Crystals, 11, 1275, https://doi.org/10.3390/cryst11111275, 2021.
de Miranda Pinto, L. C. B., Righi, A., Lameiras, F. S., Araujo, F. G. S., and Krambrock, K.: Origin of the color in cobalt-doped quartz, Phys. Chem. Miner., 38, 623–629, https://doi.org/10.1007/s00269-011-0434-3, 2011.
Dubinsky, E. V., Stone-Sundberg, J., and Emmett, J. L.: A quantitative description of the causes of color in corundum, Gems Gemol., 56, 1–27, https://doi.org/10.5741/GEMS.56.1.2, 2020.
Efimov, A., Pogareva, V., and Shashkin, A.: Water-related bands in the IR absorption spectra of silicate glasses, J. Non-Cryst. Solids, 332, 93–114, https://doi.org/10.1016/j.jnoncrysol.2003.09.020, 2003.
Emmett, J. L., Scarratt, K., McClure, S. F., Moses, T, Douthit, T. R., Hughes, R. W., Novak, S. W., Shigley, J. E., Wang, W., Bordelon, O., and Kane, R. E.: Beryllium Diffusion of Ruby and Sapphire, Gems Gemol., 39, 84–135, 2003.
Fritsch, E. and Stockton, C. M.: Infrared Spectroscopy in Gem Identification, Gems Gemol., 23, 18–26, https://doi.org/10.5741/gems.23.1.18, 1987.
Gubelin, E. J. and Koivula, J. I.: Photoatlas of Inclusions in Gemstones, 4th ed., Gemological Institute of America, Zurich, Switzerland, ISBN 978-385-504-095-7, 2004.
Hainschwang, T. and Notari, F.: Specular reflectance infrared spectroscopy – a review and update of a little exploited method for gem identification, J. Gemmol., 31, 23–29, 2008.
Hughes, R. W.: Corundum, 1st. ed., Butterworth-Heinemann, Northants, UK, ISBN 978-075-061-007-0, 1990.
Hughes, R. W.: Ruby & Sapphire, 1st. ed., RWH Publishing, Boulder, CO, USA, ISBN 978-096-450-976-4, 1997.
Kane, R. E.: Natural Rubies with Glass-Filled Cavities, Gems Gemol., 20, 187–199, ISSN 0016-626X, 1984.
Kane, R. E.: The gemological properties of Chatham flux-grown synthetic orange sapphire and synthetic blue sapphire, Gems Gemol., 18, 140–153, 1982.
Karantoni, V., Karampelas, S., Voudouris, P., Melfos, V., Papadopoulou, L., Soldatos, T., and Mavrogonatos, C.: Spectroscopy and Microscopy of Corundum from Primary Deposits Found in Greece, Minerals, 11, 750, https://doi.org/10.3390/min11070750, 2021.
Krzemnicki, M. S.: Trade alert: Artificial resin in rubies, Facette, 24, 14–15, 2018.
Kumar, A. and Boerger, M.: Identifying Natural Gems from Synthetic and Treated Counterparts Using the Agilent Cary 660, Agilent Technologies, 1–6, 5991-3976ENE, 2014.
Leelawatanasuk, T., Atitchat, W., Pisutha-Arnond, V., Wattanakul, P., Ounorn, P., Manorotkul, W., and Hughes, R. W.: Cobalt-doped glass-filled sapphires: An update, Aust. Gemmol., 25, 14–20, 2013.
Leelawatanasuk, T., Susawee, N., Promwongnan, S., and Atsawatanapirom, N.: Green Lead-Glass-Filled Sapphires, J. Gemmol., 34, 420–427, 2015.
Monarumit, N., Lhuaamporn, T., Satitkune, S., Wongkokua, W., and Wathanakul, P.: Applications of mid- and near infrared spectroscopy to indicate conditions of heat treatment in synthetic ruby samples, in: The 4th international gem and jewelry conference, Holiday Inn, Chiangmai, Thailand, 8–9 December 2014, 82–86, 2014.
Nassau, K.: Gems Made by Man, 1st. ed., Chilton Book Company, Radnor, Pennsylvania, USA, ISBN 0-8019-6773-2, 1980.
Nassau, K.: Gemstone Enhancement, 1st. ed., Butterworths, London, UK, ISBN 0-408-01447-4, 1984.
Pardieu, V.: Lead glass filled star rubies reportedly from Madagascar. A preliminary examination and a comparison with star rubies from other deposits, Report of an ongoing research project, Gemological Institute of America, Bangkok, https://www.gia.edu/ongoing-research/lead-glass-filled-star-rubies-reportedly-from-madagascar (last access: 14 November 2024), 2010.
Pellicer, M. A.: Las otras piedras preciosas, 1st. ed., Spain, ISBN 84-607-1826-3, 2001.
Phlayrahan, A., Monarumit, N., Boonmee, C., Satitkune, S., and Wathanakul, P.: Fe oxidation state in heat-treated basaltic blue sapphire samples and its implication to the 3309 cm-1-series peaks in infrared absorption spectra, J. Phys. Conf. Ser., 1144, 012057, https://doi.org/10.1088/1742-6596/1144/1/012057, 2018.
Roselló, C. S.: Ficha técnica para la diferenciación de rubíes naturales, sintéticos y tratados mediante métodos gemológicos convencionales, G+, 38–62, 2004.
Saengbuangamlam, S. and Bupparenoo, P.: Star Sapphire Doublets, in: The 7th International Gem & Jewelry Conference (GIT2021), Maneechan Resort, Chanthaburi, Thailand, 2–3 February 2022, 149–156, 2022.
Scholze, H.: Nature and Structure of Glass, in: Glass, Springer, New York, NY, USA, https://doi.org/10.1007/978-1-4613-9069-5_2, 1991.
Serov, R.: FTIR spectroscopy of glass-filled rubies, in: The 3rd International Gem and Jewelry Conference, Bangkok, Thailand, 12–13 December 2012.
Shigley, J. E.: Treated and Synthetic Gem Materials, Curr. Sci., 79, 11, 1566–1571, 2000.
Soonthorntantikul, W., Khowpong, C., Atikarnsakul, U., Saeseaw, S. Sangsawong, S., Vertriest, W., and Palke, A.: Observations on the heat treatment of basalt-related blue sapphires, Report of an ongoing research project, Gemological Institute of America, https://www.gia.edu/gia-news-research/observations-heat-treatment-of-basalt-related-blue-sapphires (last access: 14 November 2024), 2019.
Thongnopkun, P. and Ekgasit, S.: FTIR Spectra of faceted diamonds and diamond simulants, Diam. Relat. Mater., 14, 1592–1599, https://doi.org/10.1016/j.diamond.2005.03.011, 2005.
Volynets, F. K., Sidorova, E. A., and Stsepuro, N. A.: OH groups in corundum crystals grown with the Verneille technique, Zhurnal Prikladnoi Spektroskopii, 17, 1088–1091, 1972.