the Creative Commons Attribution 4.0 License.
the Creative Commons Attribution 4.0 License.
 | 04 Jul 2025
Vesiculation dynamics – Part 2: Decompression-induced H2O vesicle growth, onset, and progression of coalescence
Patricia Louisa Marks
Marcus Nowak
Supersaturation of H2O during magma ascent can drive efficient degassing through the formation of fluid vesicles within phonolitic melt, with high vesicle number densities (VNDs) ranging from a logVND of 4 to 6 mm−3. Rapid vesicle formation and growth reduces magma density and may significantly influence eruption style. However, the behavior of vesicle-bearing melt under continued decompression remains poorly understood. This study aims to investigate vesicle growth as well as the onset and progression of vesicle coalescence during decompression in the well-characterized phonolitic Lower Laacher See melt.
Synthetic phonolite melts were hydrated in an internally heated gas pressure vessel at 200 MPa with 5.7 wt % or 5.0 wt % H2O, establishing conditions of saturation and slight undersaturation prior to decompression. The hydrated melts were continuously decompressed at a superliquidus temperature of 1323 K with rates ranging from 0.064 to 1.7 MPa s−1, reaching final pressures between 70 and 30 MPa before being rapidly quenched to vesiculated glass.
As expected, our results indicate that the pressure range for uniform vesicle formation differs between initially H2O saturated and undersaturated melts, with coalescence starting at higher pressures in saturated melts. The onset of coalescence is also influenced by the decompression rate, occurring at higher pressures with slower decompression rates. The coalescence process transforms the quenched opaque samples with maximum VND, characterized by nebula of small vesicles sized between 2 and 16 µm into transparent samples with larger vesicles ranging from 37 µm up to ∼500 µm and VNDs reduced by orders of magnitude, depending on decompression rate, final pressure, and initial H2O concentration. The sizes of these coalesced vesicles are inversely related to the decompression rate, with larger vesicle sizes occurring at slower decompression rates.
While the maximum logVNDs of initially formed vesicle volumes remain constant across different decompression rates, with high values of 5.1 to 5.7, compatible with the theory of spinodal decomposition, the logVNDs of sample volumes with coalesced vesicles drop markedly by 1.2 to 4.1 log units. The lowest logVNDs, between 0.5 and 0.8, occur at the slowest decompression rate of 0.064 MPa s−1, while the highest logVNDs, between 3.1 and 3.7, are observed at the fastest decompression rate of 1.7 MPa s−1. This coalescence driven pattern mimics the expected decompression rate dependence of initial VND in cases of vesicle nucleation.
These experimental results suggest that significant vesicle coalescence can occur in phonolitic magmas even at relatively fast ascent rates, influencing eruption dynamics. In the case of open-system outgassing, vesicle coalescence creates channel structures with high permeability, allowing fluid to percolate and escape at the top of the magma column. In contrast, in a closed system, vesicles can accumulate as foam with closed porosity at the top of the magma chamber, forming large, gas-pressurized pockets. This buildup may lead to significant disruptions and violent, explosive eruptions. During volcanic activity, transitions between these two systems may occur.
- Article
(7433 KB) - Full-text XML
- Companion paper
-
Supplement
(106368 KB) - BibTeX
- EndNote


Explosive volcanic eruptions are mainly driven by the rapid vesiculation of supersaturated hydrous melts, primarily releasing H2O from the melt into fluid vesicles before and during the magma fragmentation process (e.g., Gonnermann and Manga, 2007). As magma ascends, the solubility of volatiles, such as H2O, decreases with the reduction in pressure. The formation and growth of vesicles in the silicate melt, caused by decompression-induced supersaturation, are crucial for determining the eruption style (e.g., Sparks, 1978; Hurwitz and Navon, 1994; Mourtada-Bonnefoi and Laporte, 2004; Iacono-Marziano et al., 2007; Hamada et al., 2010; Gardner and Ketcham, 2011; Preuss et al., 2016; Shea, 2017; Hajimirza et al., 2019). The vesicle number density (VND), which is the number of vesicles per unit volume of vesicle free melt, determines the distance between vesicles and affects the efficiency of melt degassing (e.g., Cashman and Mangan, 1994; Gardner et al., 1999; Toramaru, 2006; Gonnermann and Manga, 2007; Iacono-Marziano et al., 2007; Allabar and Nowak, 2018). As magma vesiculates and ascends, its total density decreases rapidly, which facilitates sudden volatile expansion and fragmentation (e.g., Kueppers et al., 2006; Genareau et al., 2012).
Despite the potential for high melt porosity at ambient pressure, several volcanic products exhibit lower porosities than expected by the pre-eruptive volatile content, indicating that significant outgassing from the magma is facilitated by vesicle coalescence and percolation (Jaupart and Allègre, 1991; Gardner et al., 1996; Giachetti et al., 2019). The coalescence process is essential for the development of the permeability of vesiculated melts and the dynamics of volcanic eruptions. In a simplistic view, it determines whether eruptions are explosive, when volatiles are retained in the magma, or effusive, when volatiles escape during ascent (Eichelberger et al., 1986; Jaupart, 1998). As vesiculation within the magma continues to increase, the growing network of interconnected vesicles may reach a percolation threshold that enables permeability, allowing fluid to flow through the porous structure (Klug and Cashman, 1996; Sahimi, 1994; Saar and Manga, 1999). The relationship between porosity and permeability, essential for understanding magma degassing and eruption dynamics, depends on the VND, as well as sizes, shapes, and connectivity of vesicles (Saar and Manga, 1999; Blower et al., 2001; Gardner et al., 2006; Gonnermann and Manga, 2007).
Understanding how vesicle numbers and size distributions evolve in silicate melts is of critical importance in understanding eruption behavior and in interpreting pumice and lava textures (Mangan et al., 1993; Cashman et al., 1994; Cashman and Mangan, 1994; Klug and Cashman, 1994, 1996). After vesicle formation and initial growth, Ostwald ripening and vesicle coalescence become the key processes that significantly influence vesicle size distributions in silicate melts. Ostwald ripening involves the diffusive exchange of volatiles between vesicles of different sizes, driven by differences in internal pressure (DeVries, 1958; Sahagian et al., 1989; Proussevitch et al., 1993; Cashman and Mangan, 1994). Vesicle coalescence occurs when the melt film between two adjacent vesicles thins to a critical thickness, leading to rupture and relaxation (Cashman and Mangan, 1994; Klug and Cashman, 1996; Navon and Lyakhovsky, 1998). These processes have been estimated and studied in various melt compositions like basaltic, rhyolitic and phonolitic melts (Sahagian et al., 1989; Proussevitch et al., 1993; Klug and Cashman, 1996; Larsen et al., 2004). Vesicle coalescence rates are influenced by factors such as the approach of neighboring vesicles (Fortelny et al., 1999), the thinning of the melt film to a critical thickness that separates vesicles, the subsequent rupture of this film, and vesicle shape relaxation processes (Cashman and Mangan, 1994; Klug and Cashman, 1996; Navon and Lyakhovsky, 1998). Previous studies have investigated the determination of the critical film thickness in various silicate melts (Proussevitch et al., 1993; Klug and Cashman, 1996) and attempted to estimate the timescales required for film rupture once this critical thickness is attained (Toramaru, 1988; Sahagian et al., 1989; Proussevitch et al., 1993; Klug and Cashman, 1996; Herd and Pinkerton, 1997; Navon and Lyakhovsky, 1998). These estimates typically range from 1 to 104 s, contingent upon factors such as melt viscosity, vesicle dimensions, and the critical film thickness (Klug and Cashman, 1996). Coalescence behavior differs depending on whether the vesicle emulsion or foam is “static”, maintaining constant external pressure, or “expanding”, where vesicles grow during decompression of the melt (Candela, 1991; Navon and Lyakhovsky, 1998). Vesicle coalescence rates can vary significantly between these two scenarios (Barclay et al., 1995; Navon and Lyakhovsky, 1998).
The purpose of this study is to investigate the vesicle coalescence behavior of a phonolite melt during continuous decompression. The phonolite melt is representative of the composition of the Lower Laacher See (Harms et al., 2004). This study complements an existing dataset on vesicle formation in the same phonolite composition under identical decompression rates and experimental conditions (companion paper Part 1; Marks and Nowak, 2025). Therefore, both papers are closely related and provide fundamental data on vesicle formation processes and subsequent coalescence behavior.
2.1 Starting material
Synthesized Lower Laacher See Tephra (LLST) glasses were used from a previous synthesis from the study of Marks and Nowak (2025). For the decompression experiments, glass cylinders of 5 mm in diameter and 5.8–7.4 mm in length were placed into Au80Pd20 capsules, with an outer diameter of 5.4 mm and an inner diameter of 5.0 mm. We ensured that the capsule volume was sufficiently large to accommodate the melt with equilibrium porosity (Φeq) without rupturing during decompression to low final pressures (Pf). To determine the expected Φeq at each Pf, the porosity equation from Gardner et al. (1999) was employed. Calculations considered the glass cylinder lengths, H2O solubility from Marks and Nowak (2025), the hydrous melt density calculations from Ochs and Lange (1999), and the H2O equation of state (EOS) from Duan and Zhang (2006). These calculations were then used to determine the necessary capsule lengths. Two experimental series were performed, with initial conditions being either saturated or slightly undersaturated, achieved by adding 5.7 wt % or 5.0 wt % H2O () to the capsule, respectively. The top of each capsule was crimped into a trident star and sealed by welding while being cooled with liquid nitrogen to prevent H2O loss through vaporization. To check for leakage, the capsules were heated in a compartment dryer at 383 K for at least 1 h, pressurized to 200 MPa at ambient temperature in a cold-seal pressure vessel, and reheated to 383 K, with weighing after each step to confirm their integrity.
2.2 Decompression experiments
Combined hydration and decompression experiments were performed using an internally heated argon pressure vessel (IHPV) (Marks and Nowak, 2025). The melts were hydrated at 200 MPa and 1523 K for 96 h. After hydration, the temperature was isobarically reduced at a rate of 10 K min−1 to 1323 K, where the samples were thermally equilibrated for 30 min. The hydrous melts were then isothermally decompressed at rates of 1.7, 0.17, and 0.064 MPa s−1 to Pf values of 70, 60, 50, 40, and 30 MPa. Upon reaching Pf, the samples were directly quenched isobarically at rates of 150 K s−1 (Berndt et al., 2002) or 97 K s−1 (Marks and Nowak, 2025) to room temperature. The minimum recorded pressure (Pmin) is also listed alongside the desired Pf (Table 1). One additional sample (LLST_41D) was isothermally held at Pf for about 20 s and was then quenched at 16 K s−1 by turning off the furnace (Allabar et al., 2020b).
The quenched capsules were reweighed to confirm they remained sealed. For subsequent sample analysis, the capsules were prepared as described in Marks and Nowak (2025).
2.3 Analytical methods
The samples were analyzed for residual H2O concentration in glass () using Fourier transform infrared (FTIR) spectroscopy, while vesicle parameters, including vesicle number and size, were quantified through quantitative image analysis (CSDcorrections) and transmission light microscopy (TLM). All measurements were conducted under the same conditions as described in Marks and Nowak (2025).
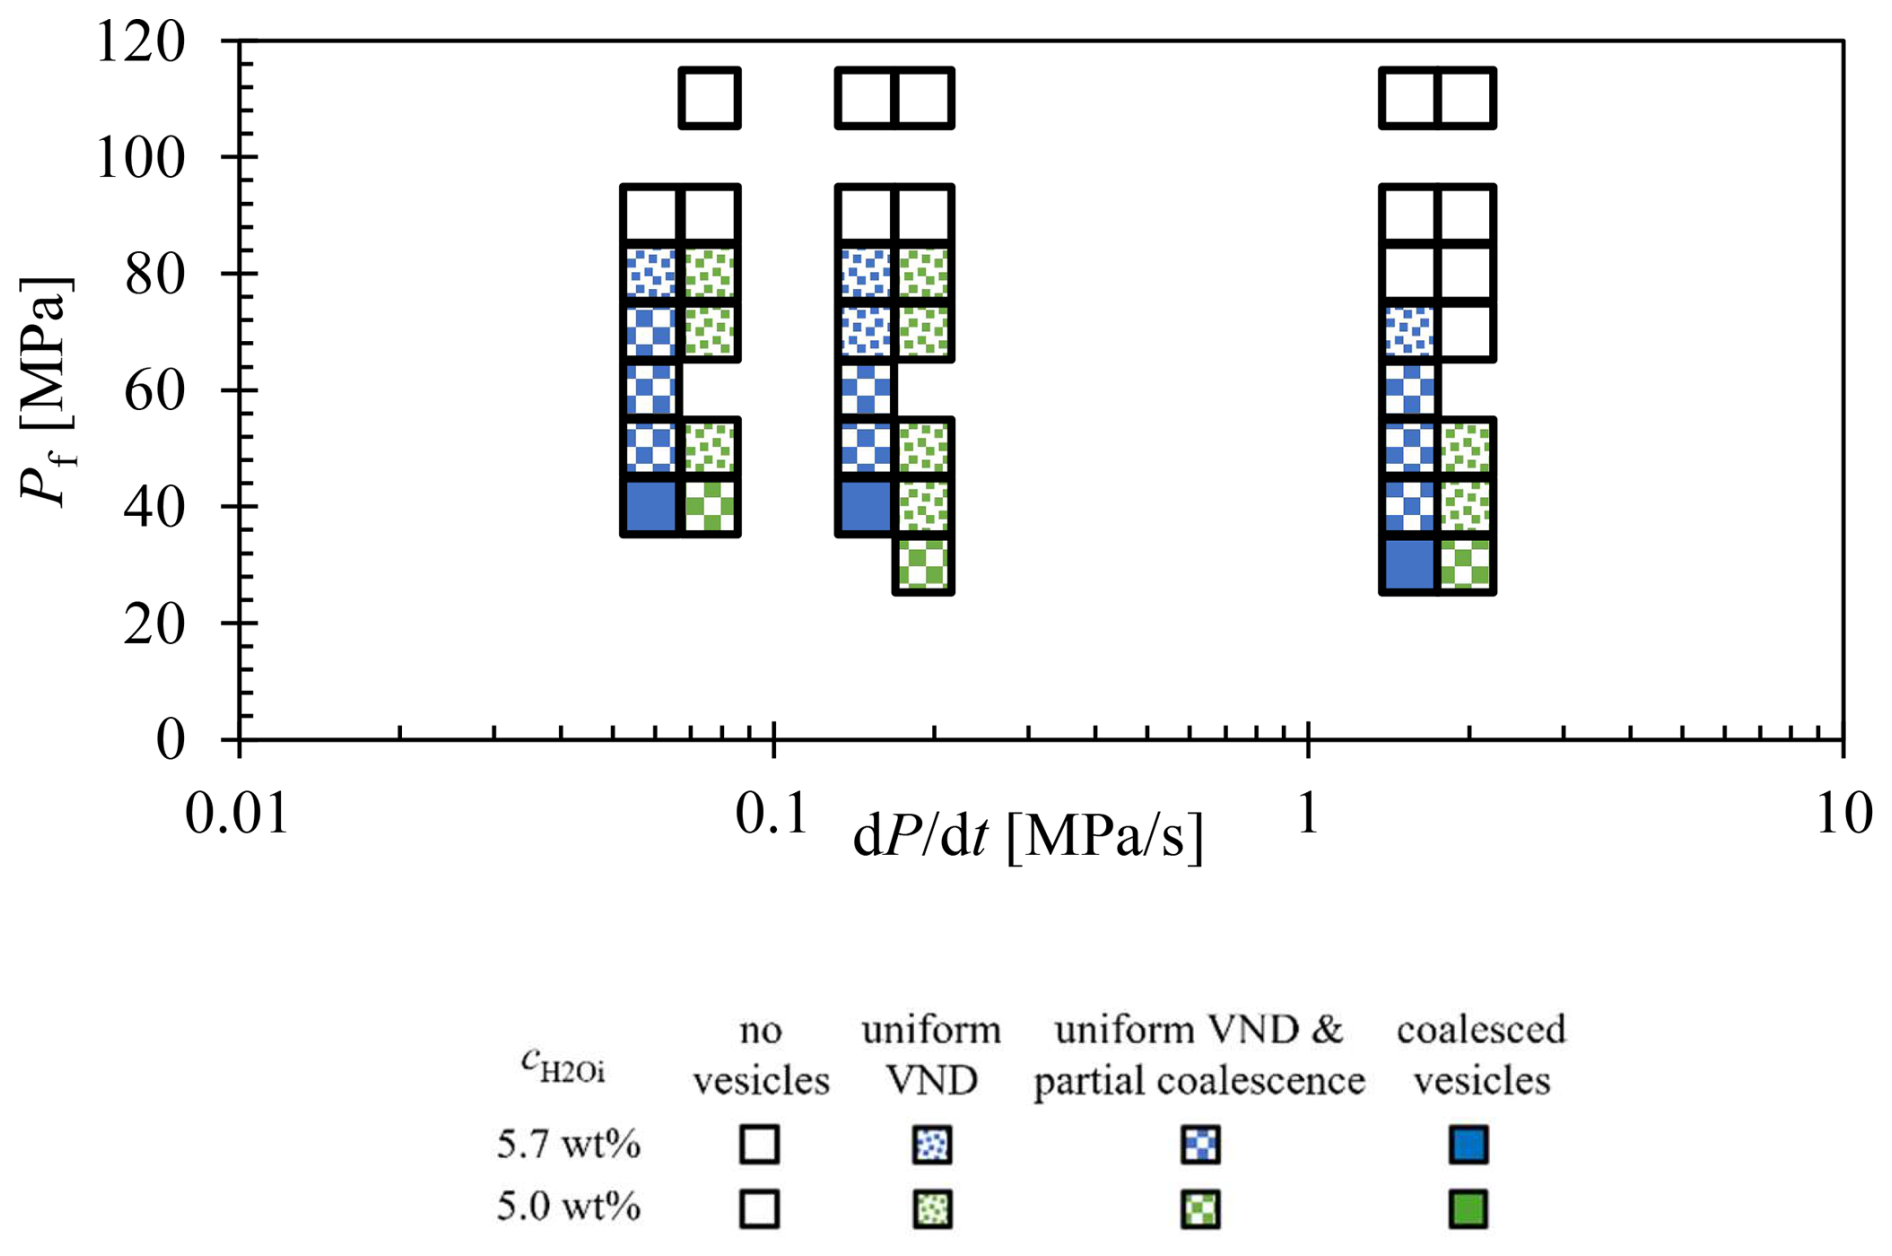
Figure 1Onset of uniform vesicle observation, partial coalescence, and complete coalescence in decompression samples (data from Marks and Nowak, 2025, are included). Coalescence depends on c, Pf, and on the decompression rate. Open symbols represent samples where no vesicles formed during decompression. Dotted symbols show samples with homogeneous vesicle formation at Pf, while filled square symbols represent samples with both coalesced volumes and pristine vesiculated volumes. Filled symbols indicate samples containing only coalesced vesicles.
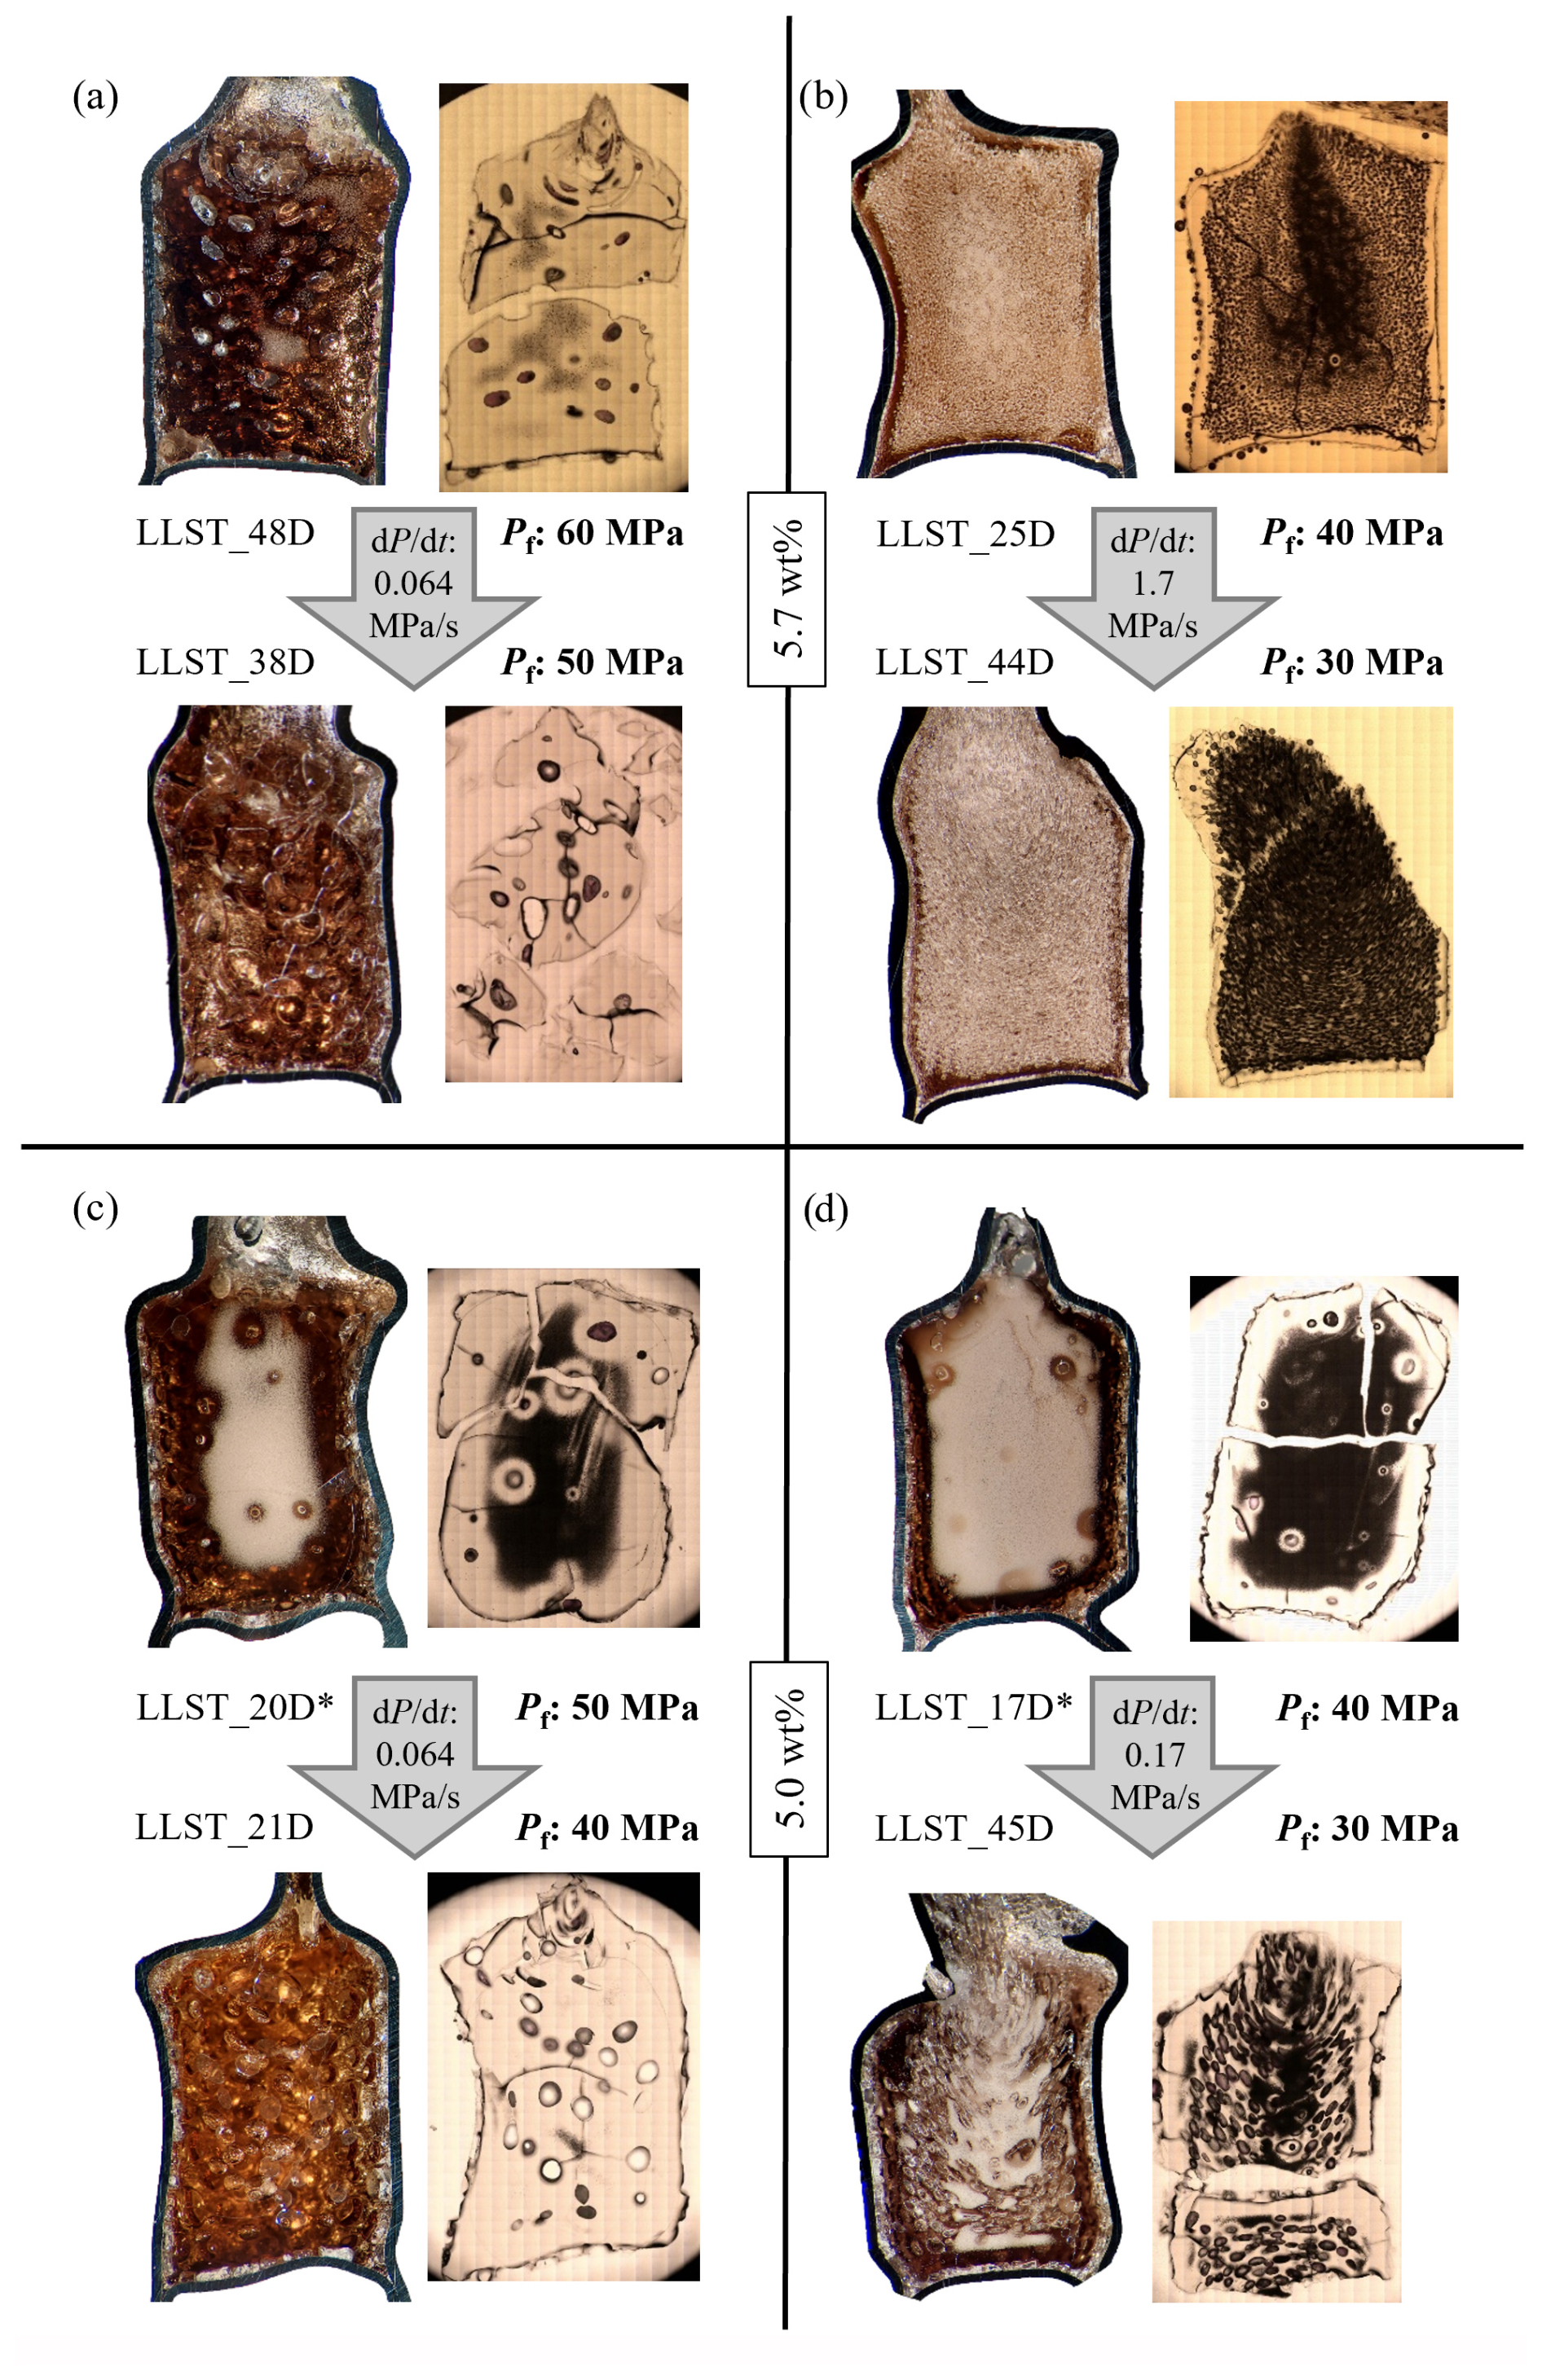
Figure 2Coalescence behavior of the phonolitic melt during decompression. Hydrous melts with initially ∼5.7 wt % or 5.0 wt % H2O were decompressed from 200 MPa with 0.064, 0.17, or 1.7 MPa s−1 to Pf of 60, 50, 40, and 30 MPa. Left image of each sample shows the in epoxy embedded sample half, and the right image shows the thin section of ∼200 µm thickness. Each sample had an original diameter of 5 mm. Samples from Marks and Nowak (2025) are marked with *.
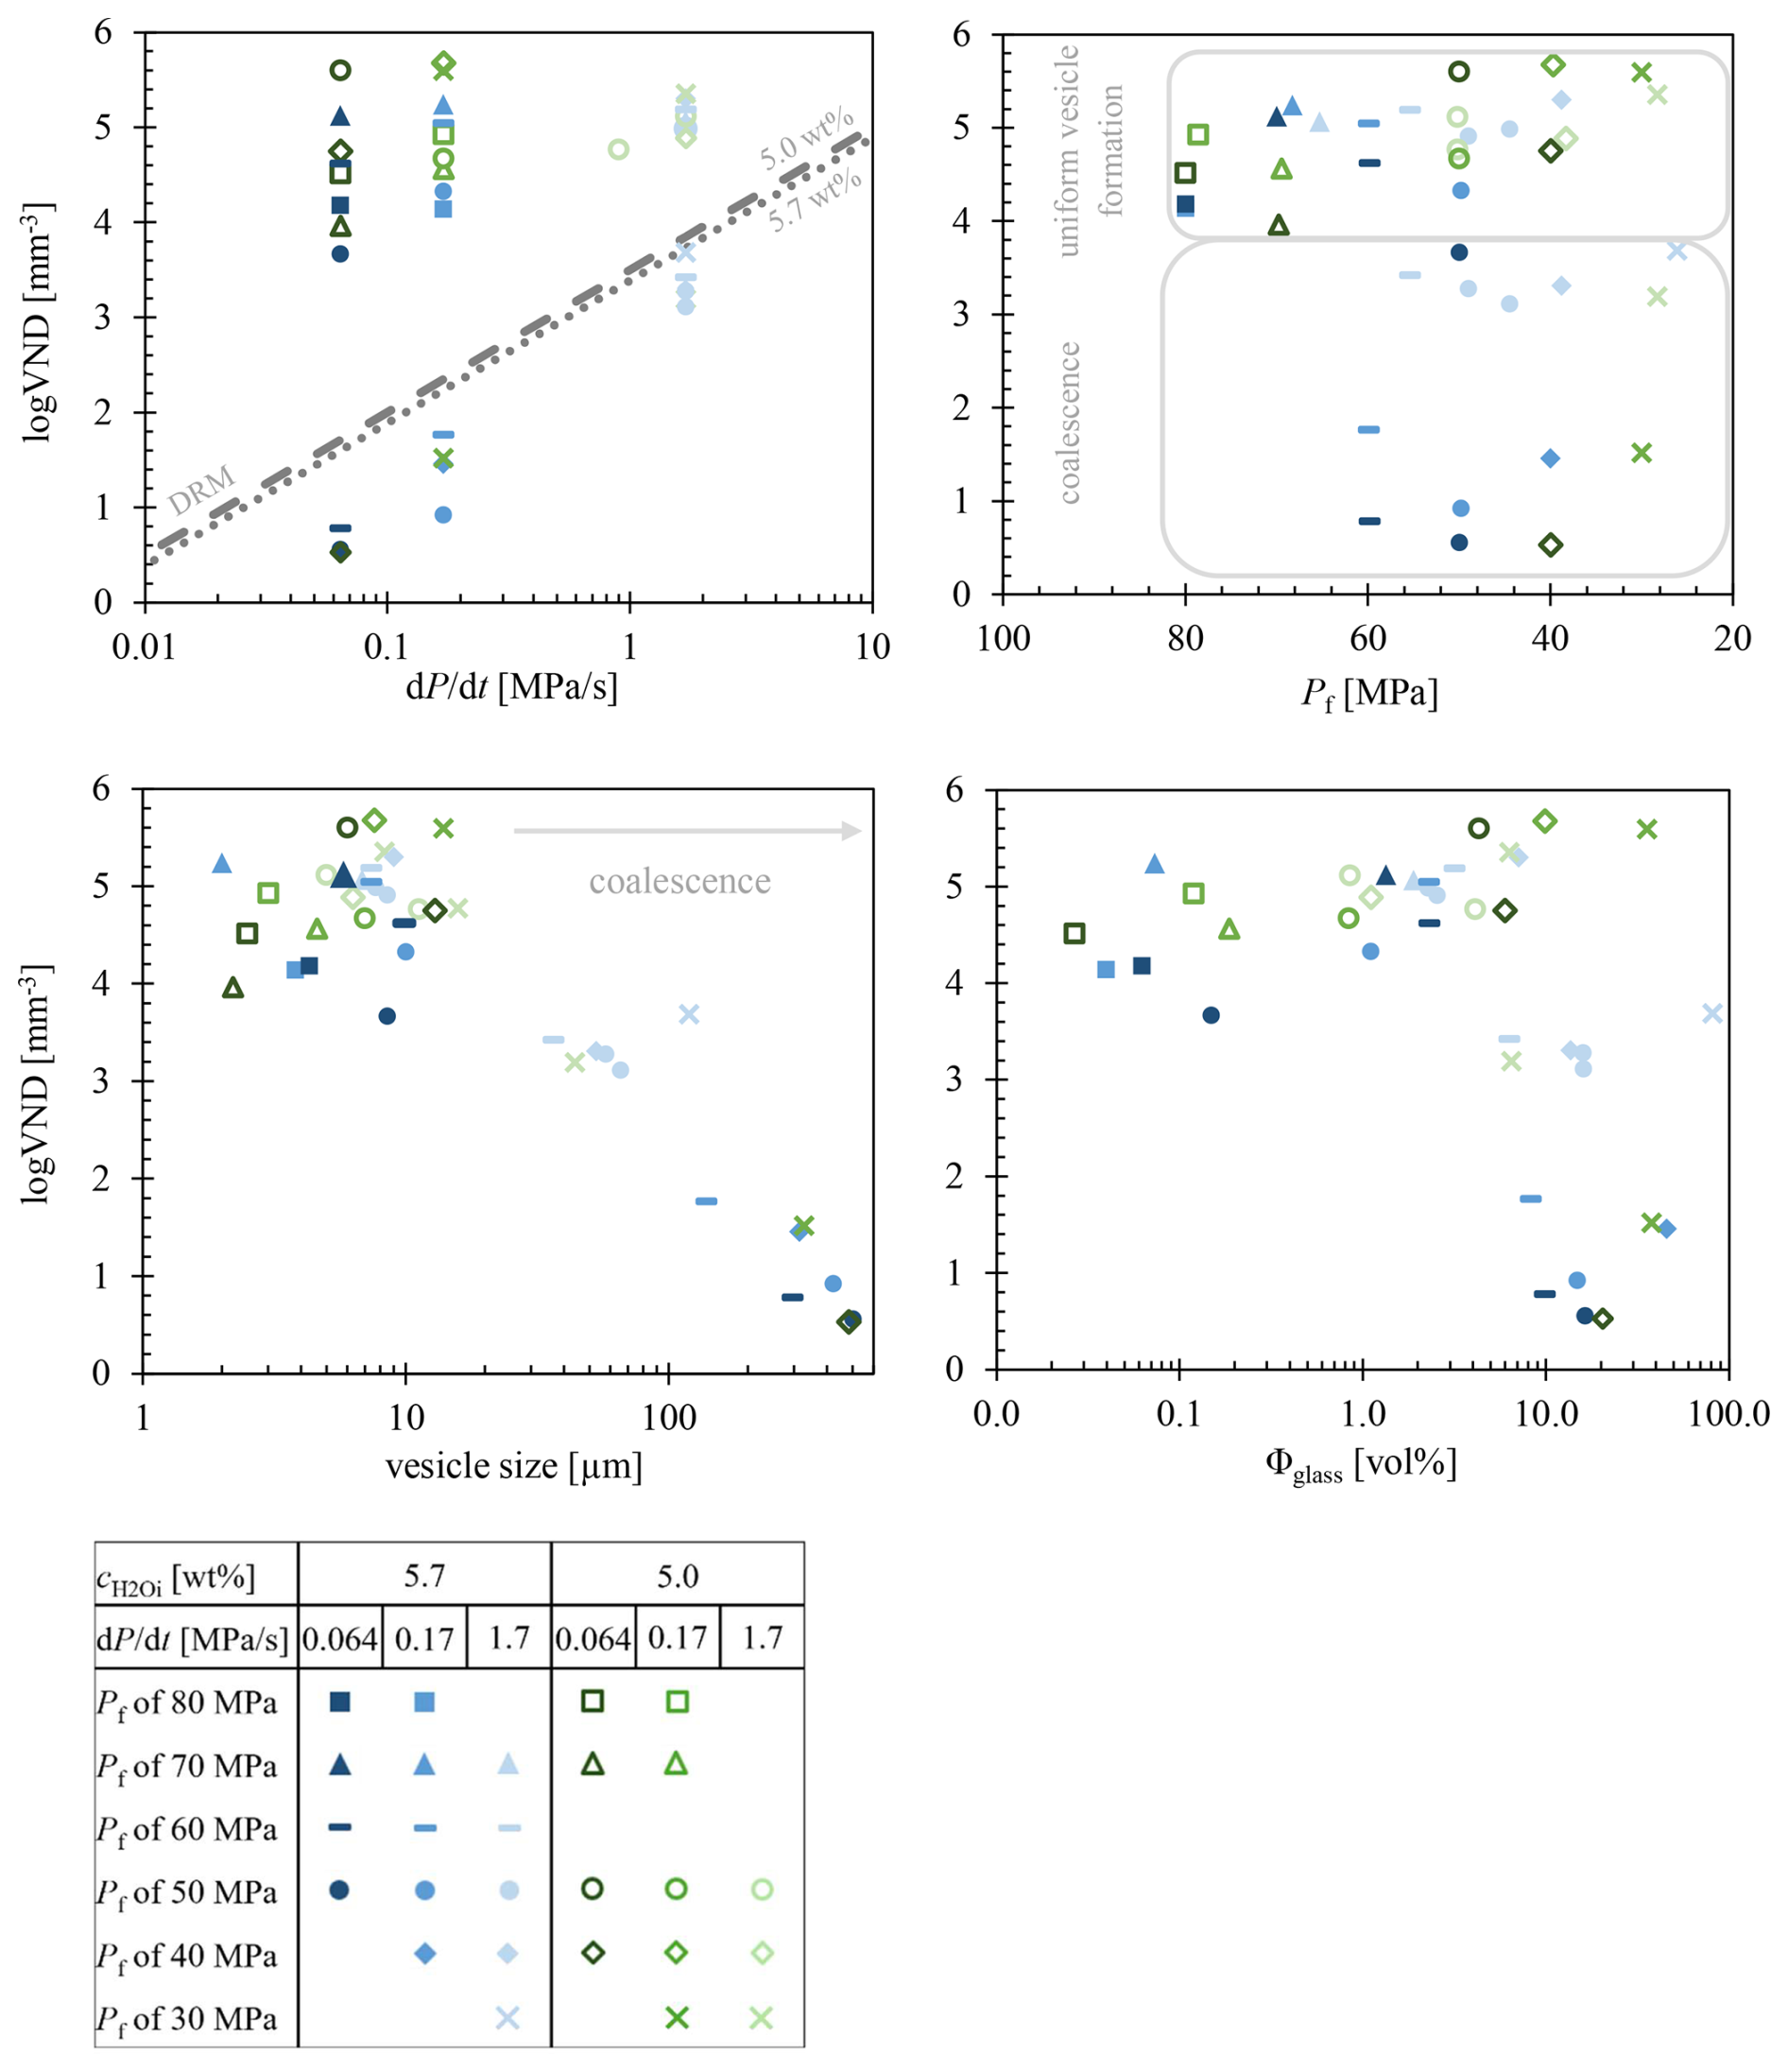
Figure 3Combined logVND data plots of decompressed and quenched samples (Marks and Nowak, 2025). Data points of the same label correspond to both uniformly distributed vesicles and, if present, coalesced vesicles. The DRM corresponds to the calculated decompression rate meter of Toramaru (2006) (see Sect. 4.4).
3.1 Vesicle textures
This study examines the transition from initial vesicle formation to subsequent vesicle growth and the onset of vesicle coalescence during decompression. Textural features and their corresponding conditions are presented in Figs. 1, 2, and 3, incorporating part of the data on initial vesicle formation from Marks and Nowak (2025) to provide a comprehensive overview of both studies. An all-encompassing set of sample images is provided in the Supplement.
The supersaturation pressure (PSS) required for the formation of uniform vesicles depends on and on the decompression rate (Fig. 1; Marks and Nowak, 2025). In the decompression series (Fig. 2), vesicles are observed within each sample, with Pf ranging from 70 to 30 MPa. The stage of maximal vesiculation in the samples is characterized by a high VND with uniform vesicles sizes, appearing as a milky white opacity in reflection mode under the optical microscope for the embedded sample halves, and as opaque dark areas in thin sections imaged in transmission mode. Decompression samples with Pf lower than that of the maximum vesiculation stage appear transparent with a brownish color in optical microscope images and are characterized by a significantly lower VND. The red colored vesicles in the thin sections are large vesicles that were cut during the preparation process and subsequently filled with glue and epoxy resin (Fig. 2, e.g., 48D, 38D; Fig. S1). As Pf decreases, the proportion of strongly vesiculated volumes declines, while vesicle coalescence progresses. Coalesced vesicles are generally characterized by an increased vesicle size and significantly decreased logVNDs. A logVND range of 4 to 5.7 indicates homogeneously distributed small vesicles formed during the initial homogeneous vesicle formation process, while at lower Pf values logVNDs between 3.7 and 0.5 indicate coalesced vesicles (Fig. 3). The logVND values correlate with measured vesicle sizes. High logVNDs correspond to small vesicles sizes, ranging from 2 to 16 µm, depending on the decompression rate, Pf, and . The onset of coalescence is indicated by increased vesicle sizes, starting at 37 µm and increasing up to ∼500 µm (Fig. 3, Table 1). The glass porosities correlate with the increasing logVND and vesicle sizes. The glass porosities in Fig. 3 are plotted separately, presenting individual values for both initial uniform vesicles and coalesced vesicles within the same sample. The glass porosity increases with continuing coalescence and Pf.
3.2 Decompression rates
To further analyze the coalescence behavior, the experimental results of the different decompression series are presented individually. Coalescence behavior varies among the three decompression rates, while showing similar behavior at of 5.7 wt % and 5.0 wt %. A complete overview of all samples from the decompression series, including the samples from Marks and Nowak (2025), is included in the Supplement (Figs. S1 and S2).
3.2.1 of 0.064 MPa s−1
Samples decompressed at the slow rate of 0.064 MPa s−1 are characterized by the appearance of large vesicles within the initially homogeneously vesiculated volumes during progressing decompression. In the series with 5.7 wt % , coalescence starts at a Pf of 70 MPa (Fig. 1). The capsule deformed during quenching. This deformation affected all coalesced vesicles, rendering their sizes unanalyzable. However, samples at lower Pf remained nearly undeformed, with vesicle sizes of ∼300 µm at a Pf of 60 MPa and ∼500 µm at a Pf of 50 MPa. Despite the presence of large coalesced vesicles, sample volumes with small homogeneous vesicles of 9 µm in diameter are still present in the glass interstices (Fig. 2a). At the lowest Pf of 40 MPa in this series (LLST_39D), homogeneously formed small vesicles are no longer observable, and the vesicle size of the coalesced vesicles can no longer be measured. Due to the large vesicle sizes and partial sample damage during preparation, the sample volume can no longer be evaluated, as the vesicles are no longer individually separated.
In the decompression series with a of 5.0 wt % (Fig. S2), the sudden appearance of large vesicles also occurs within initially homogeneously formed vesicle volumes. However, in this lower H2O concentration series, coalescence starts at a lower Pf of 40 MPa. Volumes containing homogeneously formed vesicles with diameters of 13 µm are still present between the large coalesced vesicles, which measure ∼480 µm. A consistent feature across all coalesced samples is the VND, with low logVND values ranging from 0.83 and 0.56 for the 5.7 wt % series at Pf of 50 and 40 MPa, respectively, and a logVND of 0.53 at Pf of 40 MPa in the 5.0 wt % series.
3.2.2 of 0.17 MPa s−1
A different vesicle coalescence behavior is observed in the 0.17 MPa s−1 decompression series. Across all coalesced samples at this decompression rate, logVNDs ranging from 1.8 to 0.92 were determined. In the series with 5.7 wt % , coalescence starts at a Pf between 70 and 60 MPa, with large vesicles measuring 140 µm in diameter and smaller homogeneous vesicles of 7 µm in diameter still preserved between the larger vesicles (Fig. 2a). Decompression to a lower Pf of 50 MPa results in increased vesicle sizes of 422 µm for the coalesced vesicles and 10 µm for the preserved homogeneously formed small vesicles (LLST_4D). Upon further decompression to a Pf of 40 MPa, initially homogeneously formed vesicles are erased by coalescence (LLST_26D). However, due to the large size of the coalesced vesicles and their deformation during cooling, accurate diameter measurements could not be obtained. The vesicle size of 314 µm determined using CSDcorrections (Higgins, 2000) is likely incorrect, as the vesicles appear significantly larger at a Pf of 40 MPa compared to 50 MPa based on macroscopic observations. This discrepancy affects the VND, which should not exceed the previous logVND of 0.92 at higher Pf. This discrepancy might relate to the cut number of 61 vesicles in sample LLST_26D which is insufficient for CSDcorrections to generate statistically significant values. Marxer et al. (2015) determined that a minimum of 200 cut vesicles is required in CSDcorrections analysis to achieve reliable reproducibility. Consequently, the current CSDcorrections data should be handled with caution and regarded only as a preliminary approximation based on the actual vesicle number and size.
In the decompression series with a of 5.0 wt % (Fig. 2d), the extending coalescence dependence cannot be determined, as coalescence only occurs at the lowest Pf of 30 MPa (LLST_45D). However, an interesting feature of this sample is the preservation of the initial homogeneous vesicle formation stage in the innermost sample center, with a maximum logVND of 5.6, while the outer areas exhibit coalesced vesicles with a logVND of 1.52 and large diameters of ∼330 µm. Additionally, volumes with small homogeneously formed vesicles are still preserved between the large coalesced vesicles, not only in the innermost part.
3.2.3 of 1.7 MPa s−1
The third series, with the fastest decompression rate of 1.7 MPa s−1, reveals a different coalescence behavior. In the 5.7 wt % series, coalescence starts at a Pf of 60 MPa (Fig. 1). In contrast to the other samples, vesicles start to coalesce from the outer part of the sample towards the sample center. The sample centers at Pf of 60, 50, and 40 MPa exhibit uniform and finely vesiculated volumes with consistently high logVNDs of 5.2 to 5.4 and vesicle sizes ranging between 7 and 9 µm in diameter, indicating the preservation of the initial vesicle formation stage (Table 1, Fig. 2b). However, the coalesced volumes expand inward towards the sample center as Pf decreases. At Pf of 60 MPa (LLST_50D), coalesced vesicles have a diameter of 37 µm and a logVND of 3.42. This coalesced volume spans a horizontal width of ∼600 µm. As Pf decreases, this width extends to an average of about 1000 µm at Pf of 50 MPa and ∼1200 µm at Pf of 40 MPa (LLST_13D and LLST_25D, respectively). Determining the width at lower Pf is challenging due to slight sample inclination related to preparation, as seen in LLST_13D, and capsule deformation during quenching, as seen in LLST_25D. Nonetheless, an increase in coalescence width is observed with decreasing Pf, showing coalesced vesicle diameters of 53 to 66 µm and logVNDs of 3.31 to 3.11. The final sample in the 5.7 wt % series exhibits coalescence of the complete sample volume at a Pf of 30 MPa (LLST_44D, Fig. 2b). Only vesicles with diameters of 120 µm remain, but with a relatively high logVND of 3.68.
Similarly, in the 5.0 wt % decompression series at 1.7 MPa s−1, coalescence starts from the outer shell at a Pf of 30 MPa (Fig. S2, LLST_42D). In this sample, the coalescence width extends to ∼400 µm towards the sample center, with vesicle diameters of 44 µm and a logVND of 3.19, while the inner part of the sample still shows a high logVND of 5.35 with initially homogeneously formed vesicles measuring 8 µm.
3.3 Onset of coalescence
Comparing the vesicle textures across the three series at the onset or completion of coalescence reveals distinct differences in coalescence behavior. In initially H2O saturated melts, coalescence starts at a higher pressure than in undersaturated melts (Fig. 1). This pressure difference correlates with the difference in H2O saturation pressures (Psat, from Marks and Nowak, 2025) of 198 and 156 MPa for 5.7 wt % and 5.0 wt %, respectively. Additionally, the onset of coalescence partially depends on the decompression rate, occurring at higher Pf with decreasing rates. The first coalesced vesicles appear in the samples of the 5.7 wt % series at a Pf of 70 MPa at the slowest rate of 0.064 MPa s−1 and at a Pf of 60 MPa for the 0.17 and 1.7 MPa s−1 rates (Fig. 1). In contrast, coalescence in the samples of the 5.0 wt % series occurs at a Pf of 40 MPa for the 0.064 MPa s−1 decompression rate and at a Pf of 30 MPa for the faster rates of 0.17 and 1.7 MPa s−1.
Samples quenched at the onset of coalescence exhibit both pristine homogeneous vesiculated sample volumes and the first coalesced vesicles, represented by two data points in Fig. 3: one for the homogeneous vesiculated volumes with maximum logVNDs of 5.1–5.7 and another for the volumes with coalesced vesicles with significantly lower logVND values between 3.7 and 0.5. It is important to note that the logVND of the pristine homogeneously formed vesicles decreases with the onset of coalescence at the slow decompression rates of 0.064 and 0.17 MPa s−1.
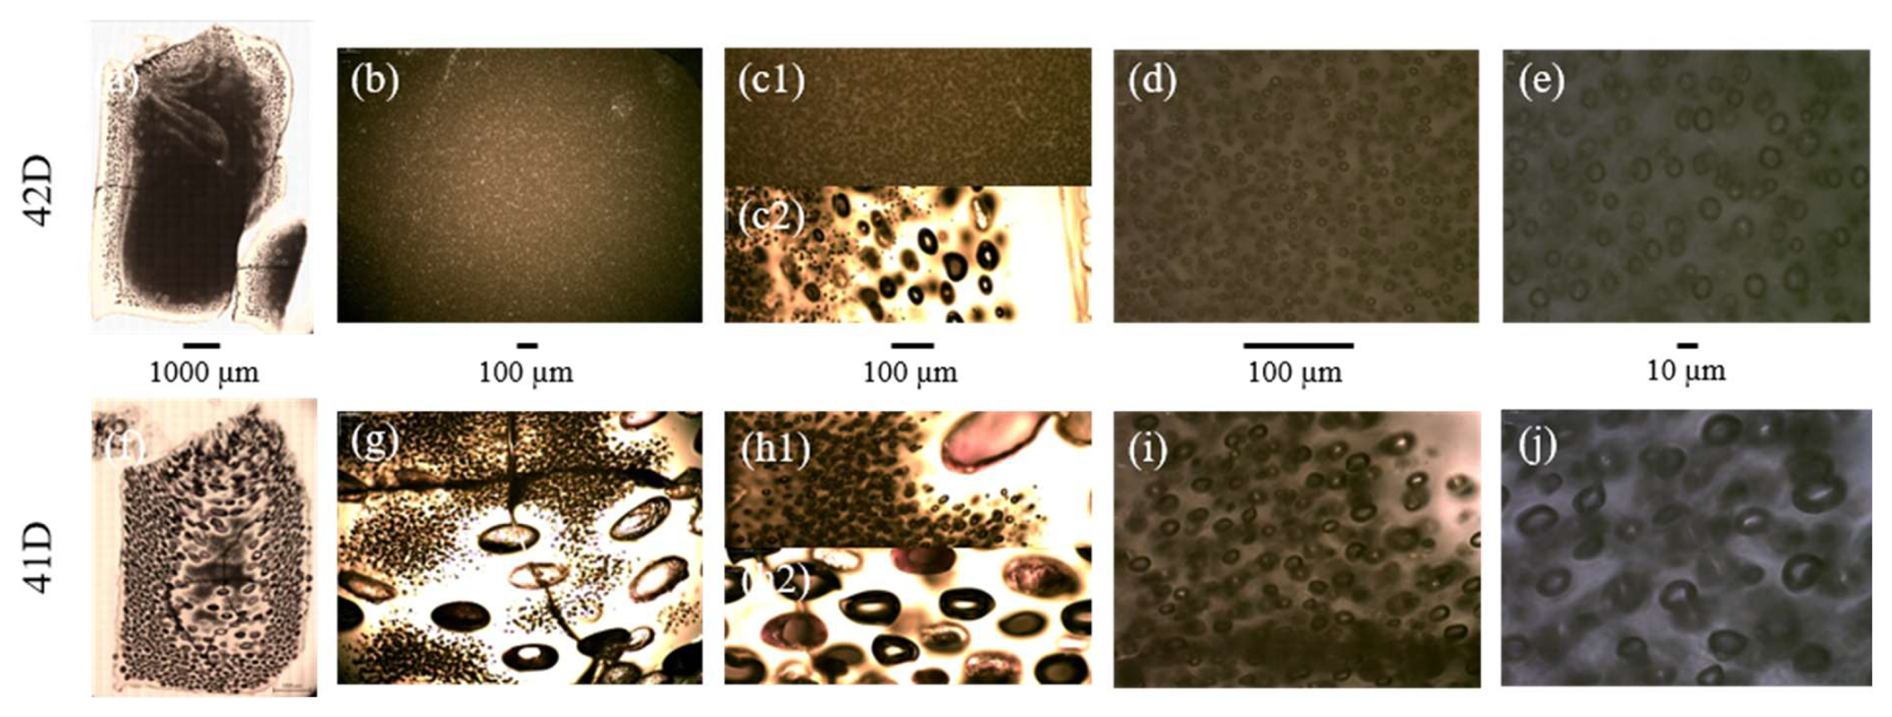
Figure 4TLM images of samples LLST_42D and LLST_41D. Both samples were decompressed at 1.7 MPa s−1 to a Pf of 30 MPa. Sample 42D was quenched immediately upon reaching Pf and shows a homogeneous vesicle appearance throughout the glass (a–e). In contrast, sample 41D was held at Pf for 20 s prior to quenching, exhibiting coalescence structures throughout the sample volume with only a few fine homogeneous vesicles remaining in the center (f–j). The images were captured from the inner part of the samples, except for (c2) and (h2), which show the outer and coalesced areas. Scale bars are valid for vertically aligned images.
3.4 Special case: equilibration at Pf
A special case regarding the coalescence behavior can be observed when comparing sample LLST_42D and LLST_41D (Fig. 4). Both samples had a of 5.0 wt % and were decompressed at 1.7 MPa s−1 to Pf of 30 MPa. Sample 42D was quenched immediately upon reaching Pf, whereas sample 41D was held at run temperature and Pf for 20 s before quenching. This resulted in different vesicle textures of the two samples. The center of sample 42D is completely filled with small, uniformly distributed vesicles, with sizes ∼8 µm and a logVND of 5.35, formed during initial vesiculation (Fig. 4). Coalescence is observed only in the intermediate zone between capsule wall and sample center, where vesicle diameters increase to 44 µm and the logVND decreases to 3.19. This represents the regular degassing behavior with the beginning of coalescence during continuous decompression. In contrast, sample 41D shows small, uniformly distributed vesicles only in the innermost sample center, with a reduced logVND of 4.77 and larger vesicle sizes of 16 µm. Between these vesicles, as well as in the outer parts of the sample, coalesced vesicles with large diameters of ∼100 µm and a low logVND of 2.39 are present. Therefore, as expected, the 20 s equilibration time at Pf of sample LLST_41D led to an increased stage of vesicle coalescence and consequently to a decrease in VND.
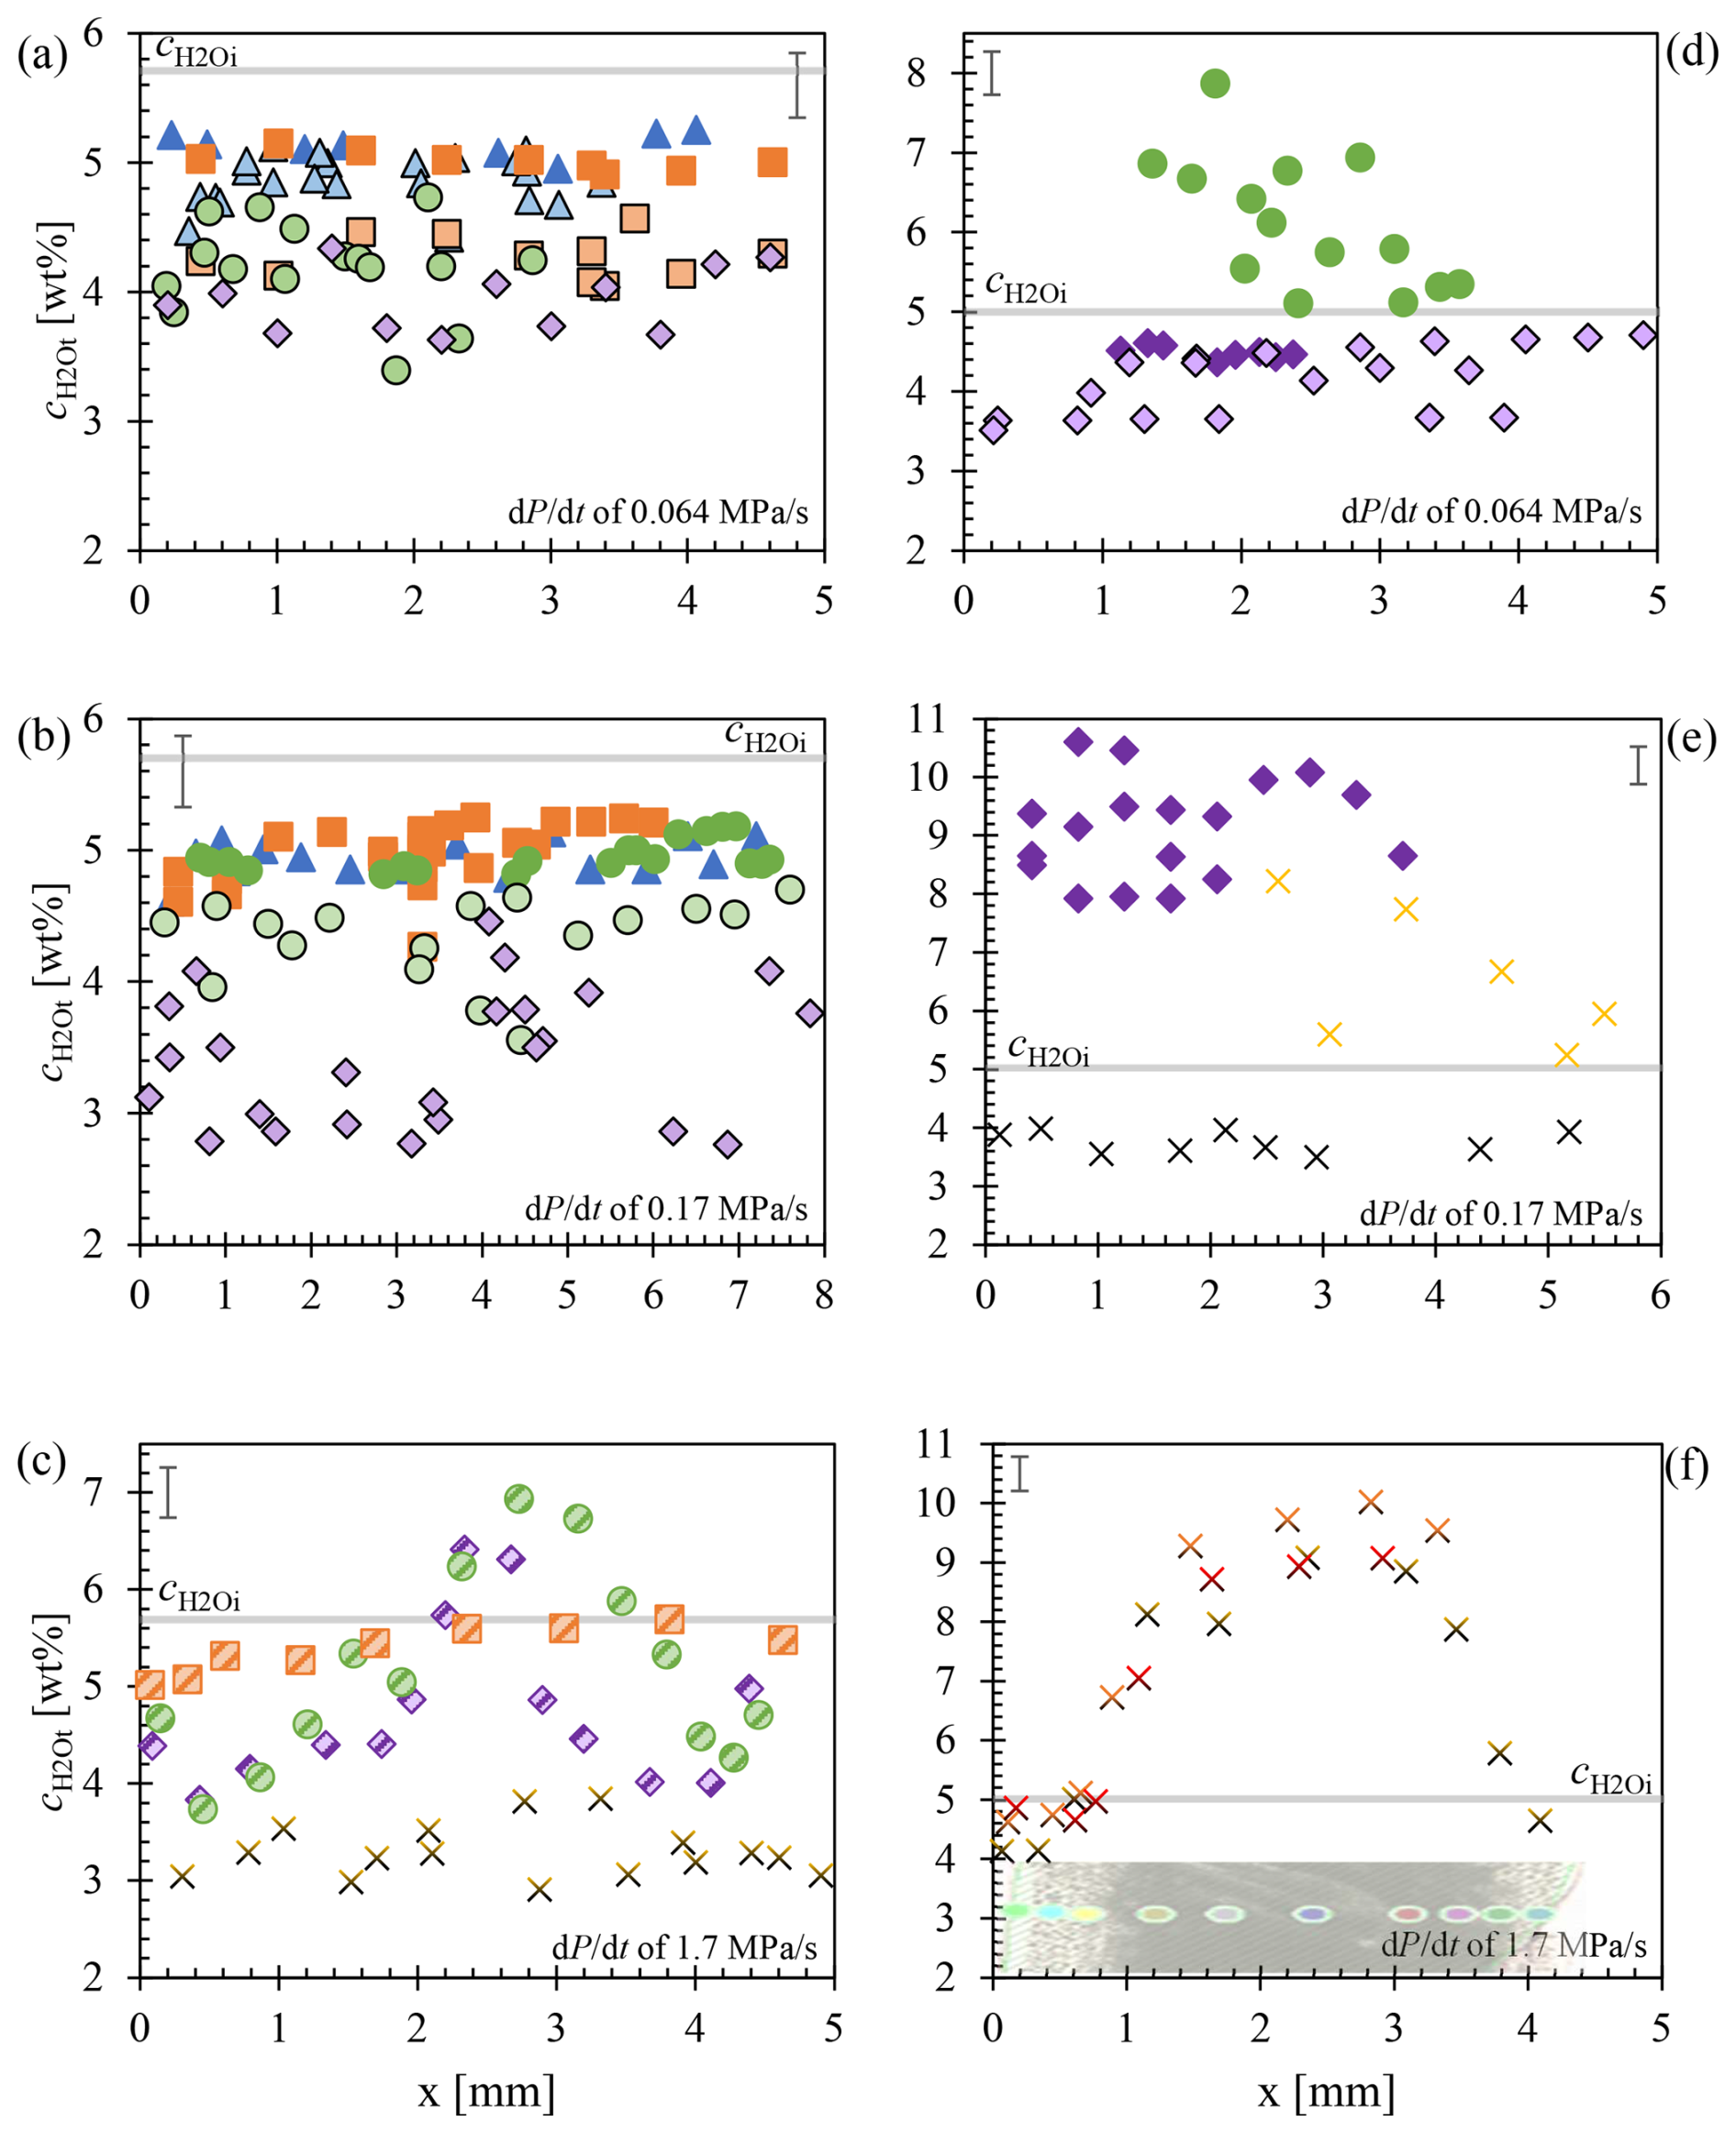
Figure 5 profiles of decompression samples, supplemented by data from Marks and Nowak (2025): (a) of 5.7 wt % and of 0.064 MPa s−1, (b) 5.7 wt % and 0.17 MPa s−1, (c) 5.7 wt % and 1.7 MPa s−1, (d) 5.0 wt % and 0.064 MPa s−1, (e) 5.0 wt % and 0.17 MPa s−1, and (f) 5.0 wt % and 1.7 MPa s−1. Solid colored symbols represent through homogeneous vesicles, while pale-colored symbols with black edges represent in glass between already coalesced vesicles. The two-colored data points in (c) and the data in (f) correspond to horizontal measurements taken from the left capsule rim, passing through regions with partially coalesced vesicles, homogeneous vesicle areas, and again through coalesced vesicle areas near the right capsule rim. The image in (f) represents sample LLST_42D from Fig. 4, with data points corresponding to the measurement points in the image. Error bars are provided for each dataset. represents the initial H2O concentration of 5.7 wt % (a–c) and 5.0 wt % (d–f).
3.5
H2O concentrations of decompressed samples are presented in Fig. 5. Data of decompression series are plotted separately based on of 5.7 wt % and 5.0 wt % and the respective decompression rates of 0.064, 0.17, and 1.7 MPa s−1. The data span from the Pf related to the first vesicle observation to the lowest Pf in the series, capturing the onset and full extent of coalescence during continuous decompression applied in this study.
FTIR measurements conducted through pristine, initially vesiculated sample volumes, encompassing both interstitial glass and vesicles in the beam path, show close to the initial H2O concentrations (Fig. 5a, b). In samples with a of 5.7 wt % and of 0.064 and 0.17 MPa s−1, the values through vesiculated sample volumes remain near 5.0 wt % at Pf of 70 and 60 MPa. In contrast, vesicle free interstitial glass measured between coalesced vesicles at Pf of 70–60 MPa shows reductions to 4.9–4.3 wt %, a decrease of 0.4–1 wt % (Fig. 5a). At lower Pf of 50–40 MPa, could only be analyzed between coalesced vesicles, yielding values of 4.4 wt %–3.4 wt % as pristine vesiculation was erased by coalescence. This indicates a continuous decrease in with lower Pf and increased coalescence.
In samples with a of 5.0 wt % and decompression rates of 0.064 and 0.17 MPa s−1, measured through pristine vesiculated sample volumes exceeds , whereas in interstitial glass between coalesced vesicles remains below . At Pf values of 50–40 MPa, through glass with pristine vesicles ranges from 7.9 wt %–4.5 wt %, while glass between coalesced vesicles shows lower values of 4.2 wt %–2.7 wt % (Fig. 5d, e). During continuous decompression to Pf of 30 MPa, measured through pristine vesiculated sample volumes varies with maximum () and minimum () H2O concentrations of 8.2 wt % and 5.2 wt %, respectively, while interstitial glass in zones of coalesced vesicles stabilize at 3.8 wt %.
Samples decompressed at 1.7 MPa s−1 exhibit distinct coalescence behavior, with coalescence starting at the outer regions of the vesiculated melt. Cross-sectional concentration profiles reveal significant H2O variations (Fig. 5c, f). In the 5.0 wt % series (Fig. 5f), the main vesicle formation stage, corresponding to the highest VND, occurs at the lowest Pf of 30 MPa. Three horizontal cross-sections were measured, showing of 4.1 wt %–4.9 wt % between coalesced vesicles in the outer regions, with increasing to a maximum of ∼10 wt % in pristine vesiculated volumes at the sample center.
A similar distribution is observed in samples with a of 5.7 wt % decompressed at 1.7 MPa s−1. Partial coalescence is observed at a Pf of 60 MPa. It was not possible to measure interstitial vesicle free glass volumes even in the regions with coalesced vesicles. Here, slightly increases towards the sample center, reaching of 5.7 wt %, while decreasing to 5.0 wt % in the outer regions (Fig. 5c). At Pf of 50 and 40 MPa, similar trends appear, with high of 4.7 wt % in fringe zones near the capsule walls, followed by a decrease to 3.7 wt %–4.3 wt % between coalesced vesicles in outer sample regions. Measurements through glass with pristine vesicles show a steady increase towards the sample center, reaching a maximum of 6.4 wt %–6.9 wt %. For the sample at Pf of 40 MPa, rises more steeply towards glass with pristine vesicle volumes, peaking at 6.4 wt % in the profile. Additional measurements in vesiculated volumes show maximum values of 7.5 wt % (Table 1). The sample decompressed to the lowest Pf of 30 MPa exhibit only coalesced vesicles, with an average of 3.5 wt % in interstitial glass.
Residual in interstitial glass of decompressed samples are presented in Fig. A1. Additionally, of 5.7 wt % and 5.0 wt % were plotted, along with the expected equilibrium H2O concentration (), calculated based on solubility data (Marks and Nowak, 2025). Measurements of samples containing vesicles within the beam path were excluded; only samples where the NIR beam exclusively passed through interstitial glass were included in the plot. The newly added data for coalesced volumes indicate that, even at a low Pf of 30 MPa, no sample achieved the predicted by the solubility measurements, irrespective of . The data consistently show values approximately 1.5 wt %–2 wt % higher than the calculated using Eq. (5) therein (Fig. A1).
Table 1Conditions and results of decompression experiments. Decompression experiments were hydrated at 200 MPa for 96 h at 1523 K and thermally equilibrated for 30 min at 1323 K prior to decompression.
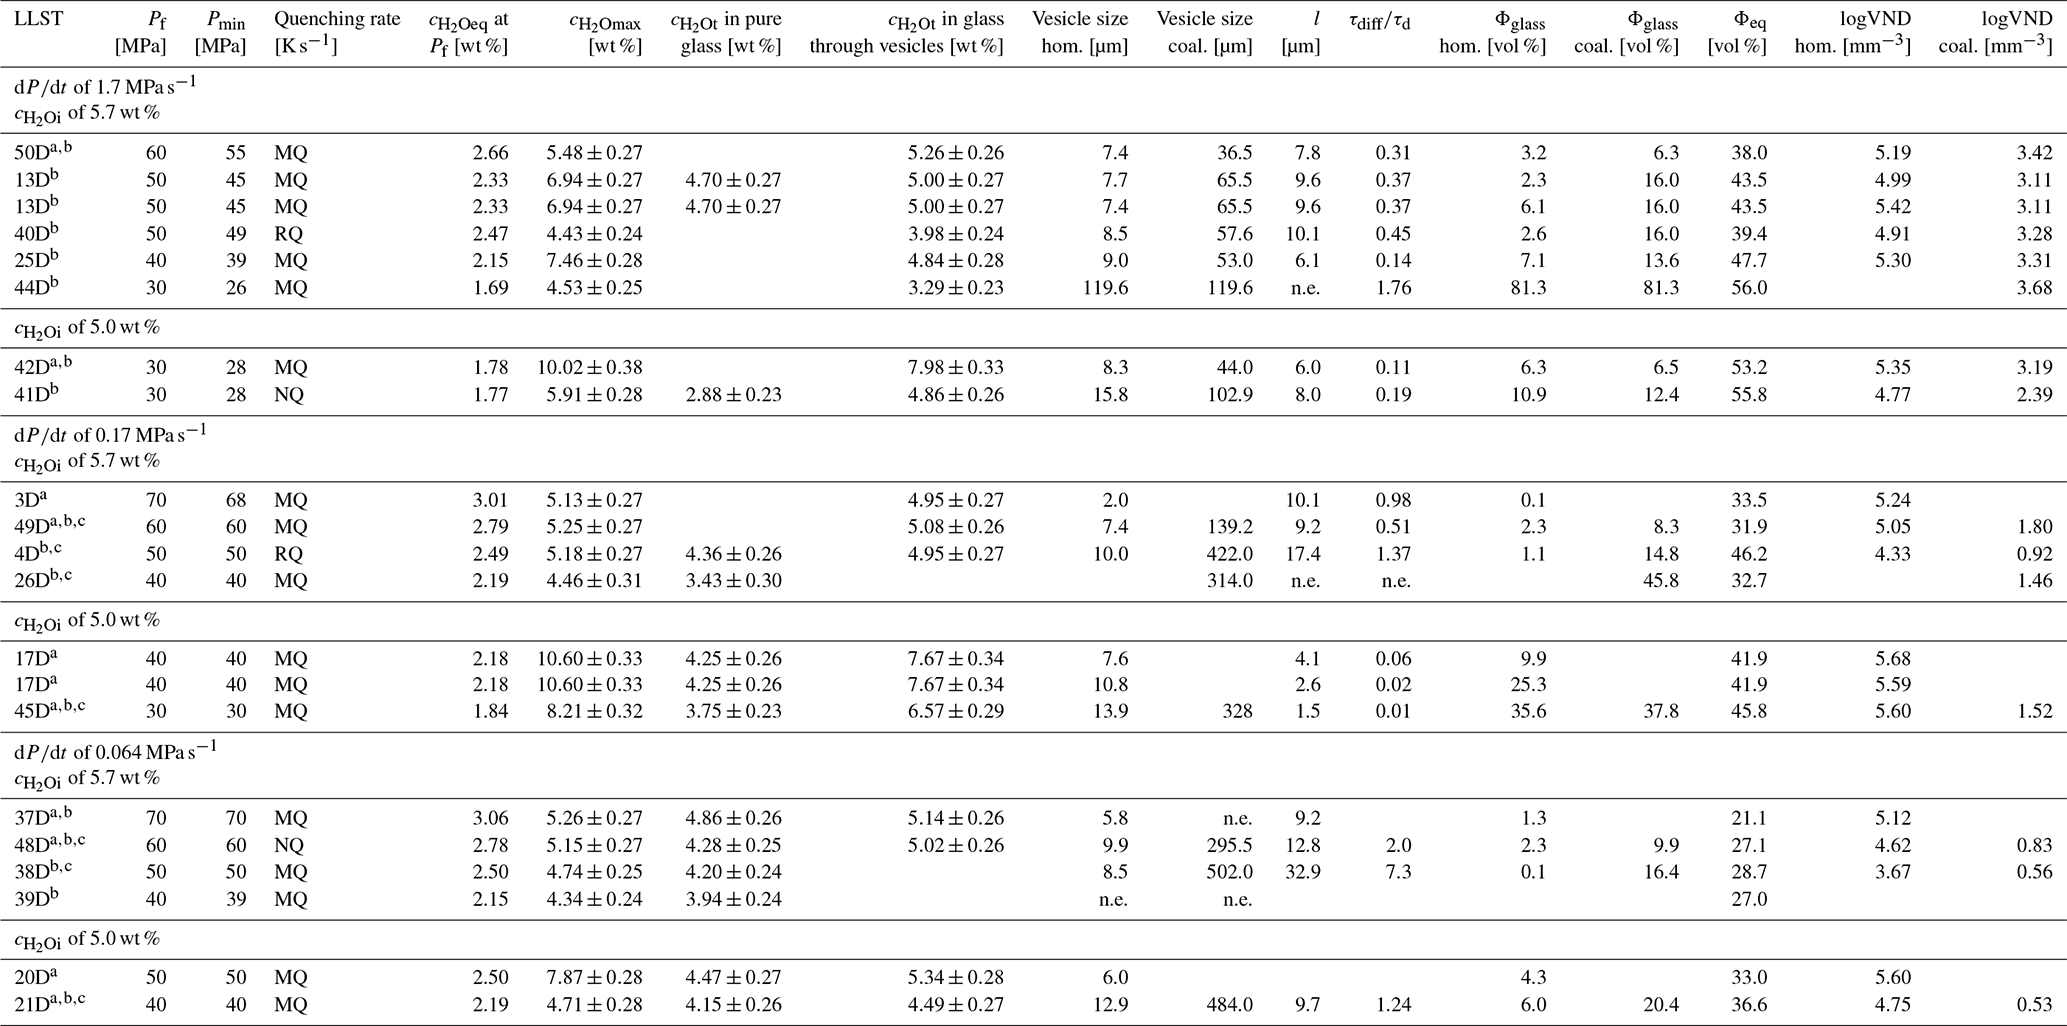
Included are data from Marks and Nowak (2025), marked with a. Samples with b are partially or completely coalesced. c determined by CSD; n.e.: not evaluable. Pf= final pressure; Pmin= recorded minimum pressure during decompression; decompression rate; Quenching rates: RQ K s−1, MQ K s−1, NQ K s−1; initial H2O concentration; equilibrium H2O concentration; measured H2O concentration in glass; l= inter-vesicle distance; τdiff= diffusion timescale; τd= decompression timescale; Φglass= glass porosity; Φeq= equilibrium melt porosity; VND: vesicle number density.
4.1 VND evolution
In all samples prior to coalescence, a constant VND was observed across various decompression rates, with uniform vesicle sizes within each sample. This feature is an indication of spinodal decomposition, where the critical wavelength of H2O concentration fluctuations, enhanced by uphill diffusion, and determines the uniform and spontaneous formation of vesicles throughout the melt during decompression (Allabar and Nowak, 2018; Sahagian and Carley, 2020). As a result, spinodal decomposition produces a high, decompression-rate-independent VND along with consistently uniform vesicle sizes (Allabar and Nowak, 2018; Allabar et al., 2020b; Sahagian and Carley, 2020; Gardner et al., 2023).
While the process appears consistent across all samples, a deeper analysis has uncovered specific trends that are now being examined in detail. The evolution of VND with Pf for the decompressed and quenched samples demonstrates at sufficient H2O supersaturation an apparent initial increase in logVND from ∼4 to maximum values of 5.1 to 5.7 related to homogeneous vesicle formation, followed by a rapid decrease by orders of magnitude related to progressing coalescence, irrespective of the decompression rate and H2O content (Fig. 6a, b). Notably, all series start with logVND values of ∼4 when the first µm-sized vesicles are observable in the quenched glasses, primarily in samples with Pf values of 80 and 70 MPa. The reduced initial VND is suggested to be attributed to quenching of the vesiculated melt, where not all vesicles formed during decompression survived due to minimal size variations (Marks and Nowak, 2025). Quenching of the melt causes shrinkage of the vesicles, possibly to a scale below the optical resolution or complete disappearance related to the reduction in the molar volume of H2O (Marxer et al., 2015) and the resorption of H2O from the fluid vesicles into the melt (McIntosh et al., 2014; Allabar et al., 2020a), driven by the increasing solubility of H2O in phonolite melt with decreasing temperature (Schmidt and Behrens, 2008). However, their presence cannot be entirely ruled out, as they may persist beyond the limits of the applied imaging technique. This step is indicated by number 1 in Fig. 6.
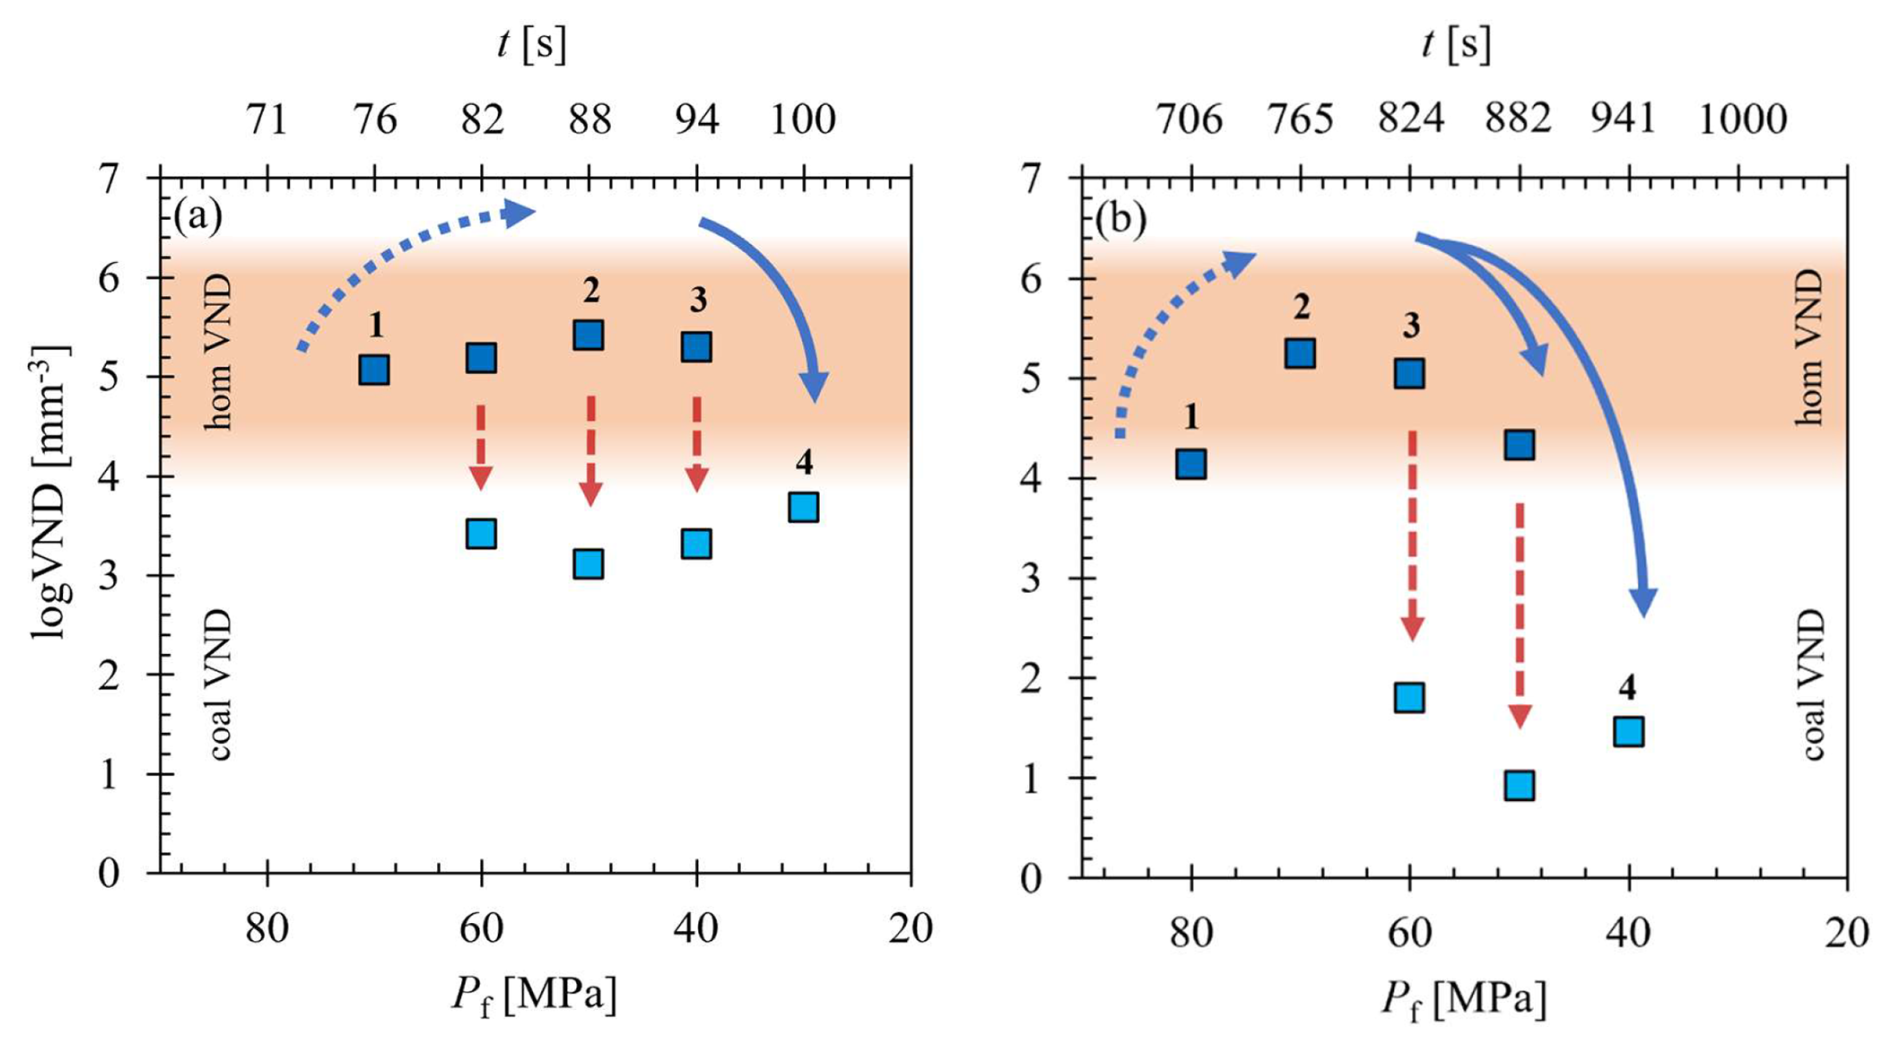
Figure 6The logVND evolution vs. Pf related to decompression time (t in s). (a) Experimental series with 5.7 wt % and a decompression rate of 1.7 MPa s−1; (b) experimental series with of 5.7 wt % decompressed with 0.17 MPa s−1. Numbers represent the stages of vesicle textures: (1) first vesicle formation observed in quenched glasses influenced by vesicle shrinkage and resorption; (2) samples with vesiculated volumes indicating the highest initial VNDs; (3) Decrease in VND due to the onset and progression of coalescence in sample volumes with pristine vesicles and sample volumes with coalesced vesicles; and (4) complete coalescence stage where volumes with homogeneously formed pristine vesicles are erased. The blue arrows indicate the evolution of the initial VND, while the red arrows highlight the difference within a single sample between the VNDs in the homogeneous and coalesced VND fields.
The subsequent increase of logVNDs to maximum values of 5.1–5.7 (Table 1) with decreasing Pf represents the true initial VND of homogeneously formed vesicles due to a sufficient size, allowing them to persist despite the rapid cooling process (number 2 in Fig. 6). The propagating decrease in VND with decompression (number 3 in Fig. 6) is related to the onset and progression of coalescence, showing both volumes of pristine, small and uniform vesicles with high VND as well as volumes with larger coalesced vesicles until the stage of complete coalescence is reached (number 4 in Fig. 6). With the onset of coalescence, the logVND drops drastically by 1.2–4.1 log units to low values depending on the decompression rate (Table 1, Fig. 6).
We emphasize that, particularly in the 1.7 MPa s−1 series (Fig. 6a), the transition from the initial appearance of observable vesicles in the glass to the onset of coalescence is achieved within ∼6 s in the 10 MPa Pf interval. The bimodal stage, characterized by persistent initial VND alongside progressive coalescence, spans a pressure interval of 30 MPa. Complete coalescence is reached at a Pf of 30 MPa, with the logVND decreasing to ∼2. A more pronounced reduction in logVND, coinciding with the onset of coalescence, is observed in the samples of the 0.17 MPa s−1 series (Fig. 6b). With the onset of coalescence, the logVND decreases from 5.1 to a value of 4.3, while the logVND of the coalesced volumes ranges from ∼1 to 2. The coalesced vesicle volumes exhibit significantly lower logVND values than those observed in the faster-decompressed samples, indicating a more advanced stage of coalescence. At the slowest decompression rate of 0.064 MPa s−1, this process is further intensified, resulting in the lowest logVND values, as low as 0.5. These observations suggest that the logVND of coalesced vesicle volumes is influenced by Pf and the rate and duration of decompression.
4.2 Onset of coalescence: melt porosity
As displayed in Fig. 1, the onset of coalescence is partially dependent on the decompression rate. Within the 10 MPa pressure intervals, it starts at a pressure that is 10 MPa higher at the slowest decompression rate compared to faster rates in both series. In the 5.7 wt % series, H2O supersaturation starts almost immediately after decompression begins, as the saturation pressure (Psat=198 MPa) is nearly identical to the starting pressure of 200 MPa. In contrast, samples of the 5.0 wt % series require a pressure drop of ∼40 MPa before supersaturation initiates (Psat=156 MPa, Marks and Nowak, 2025). This accounts for the observed 30 MPa delay in the onset of coalescence in the 5.0 wt % series compared to the 5.7 wt % series (Fig. 1). Due to the lower Psat in the 5.0 wt % series, only partial coalescence is achieved at the lowest Pf, whereas samples of the 5.7 wt % series undergo full coalescence, reaching a constant VND without residual pristine vesiculated volumes.
At the onset of coalescence, a mean vesicle diameter of 6.7±1 µm and glass porosity (Φglass) of 2.3±1 vol % for the 5.7 wt % series were measured (Table 1). In contrast, samples of the 5.0 wt % series show higher and more variable values, with vesicle diameters ranging from 8.3–13.9 µm and Φglass of 6–35.6 vol %. It is important to note that Φglass does not represent melt porosity prior to quenching, as vesicle shrinkage occurs during cooling related to the decreasing molar volume of H2O, as well as due to H2O resorption (McIntosh et al., 2014; Marxer et al., 2015; Allabar and Nowak, 2018; Allabar et al., 2020b). Equilibrium melt porosities (Φeq) at Pf were calculated using Eq. (1) (Gardner et al., 1999), incorporating melt density (ρmelt) from Ochs and Lange (1999) and the molar volume of H2O fluid () from Duan and Zhang (2006):
Significantly higher porosities were calculated, with a mean Φeq of 30.3 vol % for the 5.7 wt % series and a mean Φeq of 46.1 vol % for the 5.0 wt % series (Table 1). Only completely coalesced samples of the 5.7 wt % series exhibit Φglass values exceeding the predicted Φeq. This suggests that in the final coalesced stage at low Pf, the CSDcorrections-predicted Φglass will be close to Φeq, as the influence of shrinkage due to back diffusion of H2O into the melt is less pronounced at low VND due to increased vesicle distances.
Vesicle shrinkage can be calculated if the conditions prior and during quenching are known. Resorption shrinkage requires adjusting the H2O concentration () in the melt prior to cooling (Ryan et al., 2015). Otherwise, if the cooling-induced increase in H2O solubility does not exceed the level of H2O supersaturation, no driving force exists for H2O resorption from the fluid phase back into the melt. As a first approximation, for maximum logVNDs ranging from 5.1 to 5.7 (Table 1, Fig. 3), a mean center of vesicle distance (vd) of ∼7 to 9 µm was calculated using Hertz (1908) () for a random vesicle distribution. This inter-vesicle distance is sufficiently small to enable and Φeq within seconds via H2O diffusion from the melt into the vesicles during further decompression, as estimated using the H2O diffusivity for phonolite melt (Schmidt et al., 2013). To determine the contribution of each vesicle shrinkage mechanism, we first calculate the shrinkage solely due to the Equation of State (EOS, Duan and Zhang, 2006) assuming a constant number of H2O molecules in the vesicle.
Vesicle deformation is particularly evident in larger vesicles, making the evaluation of coalesced vesicle sizes in sample LLST_37D impossible (Fig. 2). Larger vesicles are more influenced by deformation due to their greater diameter, whereas smaller vesicles tend to maintain their spherical shape during quenching (Fig. 2). The relaxation time for deformed vesicles to return to a spherical shape depends on the vesicle radius (Toramaru, 1988), as well as the melt viscosity, and surface tension. Allabar et al. (2020b) determined this relaxation time to be more than 10 times longer for vesicles with radii of several hundred micrometers compared to vesicles with only a few micrometers in diameter. Assuming the amount of exsolved H2O in the vesicle remains constant, the decrease in results in a vesicle volume reduction by a shrinkage factor (BS), corresponding to the ratio of before and after rapid quenching (Marxer et al., 2015):
Teq represents the experimental temperature during decompression. Based on calculations by Allabar et al. (2020b) for Vesuvius AD 79 phonolite, the fictive temperature (Tf), at which vesicle shrinkage ceases is up to 200 K above the glass transition temperature (Tg) at a cooling rate of 44 K s−1. Marks and Nowak (2025) applied these parameters to their dataset, and determined a Tf of K, covering all samples.
The at Pmin and Teq or Tf was calculated using the EOS of H2O (Duan and Zhang, 2006). We calculated BS for samples with a of 5.7 wt % to range from 2.26 to 1.73 and for samples with a of 5.0 wt % to range from 2.01 to 1.65. With decreasing Pf and residual , BS decreases. This factor can be incorporated into Eq. (3) to calculate melt porosity (ΦEOS) at Tf when shrinkage starts from Φeq (Marxer et al., 2015):
The resulting ΦEOS values are between the measured Φglass and the calculated Φeq. The calculated ΦEOS ranges from 9 vol % to 43 vol %, with increasing values as Pf decreases. The ΦEOS remains consistently ∼10 vol %–15 vol % below Φeq but aligns closely (∼5 vol %) with CSD-corrected Φglass in strongly coalesced samples (Table 1).
Allabar et al. (2020b) combined shrinkage by EOS and H2O resorption, which resulted in a ∼10 vol % decrease in ΦEOS at a of 5.3 wt % and a quenching rate of 44 K s−1. It was found that the value of the measured Φglass is within this determined range. Due to the similar composition and similar , we assume that a range of ∼10 vol % with the maximum at ΦEOS is also possible for the samples in this study. The actual melt porosities are therefore between the measured Φglass and ΦEOS, while the calculation of Φeq significantly overestimates the porosities.
Returning to melt porosity at the onset of coalescence, the required porosity decreases with decreasing decompression rate but increases with decreasing . For a of 5.7 wt %, the ΦEOS values are 23 vol % at a decompression rate of 1.7 MPa s−1 and Pmin of 55 MPa, 17 vol % at 0.17 MPa s−1 and Pmin of 60 MPa, and 11 vol % at 0.064 MPa s−1 and Pmin of 60 MPa. In the of 5.0 wt % series, the porosity values increase as Pmin decreases: ΦEOS values are 43 vol % at a decompression rate of 1.7 MPa s−1 and Pmin of 28 MPa, 34 vol % at 0.17 MPa s−1 and Pmin of 30 MPa, and 25 vol % at 0.064 MPa s−1 and Pmin of 40 MPa (Table 2).
Table 2Samples with volumes showing maximum VND at the onset of coalescence. Data are given for pristine homogeneously vesiculated volumes.
4.3 Onset of coalescence in the intermediate zone at of 1.7 MPa s−1
The observed onset of coalescence in the intermediate zone of the samples, close to the capsule wall, in the 1.7 MPa s−1 series might be related to slight gradients (Fig. 2). The H2O solubilities () were calculated in Marks and Nowak (2025). We experimentally determined H2O solubilities and derived an empirical formula to predict between pressures of 200 and 30 MPa at 1323 K. Additionally, we determined at the hydration temperature of 1523 K and 200 MPa, which was found to be 5.45±0.26 wt %. At 1323 K, increased by ∼0.4 wt % to 5.83±0.26 wt %. This is consistent with the increased H2O solubility at lower temperatures observed in phonolite melts (Schmidt and Behrens, 2008). The increase in with decreasing temperature is relevant during the 30 min temperature equilibration time after hydration at 1523 K for 96 h. The outer melt volumes are expected to build up a slightly higher H2O content during the 30 min dwell time compared to the central part of the melt prior to decompression. It is assumed that the excess H2O of 0.25 wt % at of 5.7 wt % is evenly distributed between the capsule wall and melt during the hydration at 1523 K. The excess amount of H2O dissolves in the outer melt volumes during the dwell time at 1323 K. An estimation of related to 5.45 wt % H2O during the 30 min at 1323 K and 200 MPa, without considering the initial onset diffusion during the cooling phase from 1523 to 1323 K, resulted in 651 µm diffusion length by applying the diffusion equation provided by Schmidt et al. (2013). This distance exceeds the width of the coalesced volume at Pf of 60 MPa, which is ∼600 µm. Therefore, it cannot qualitatively account for the coalescence observed beginning in the outer regions.
At a of 5.0 wt %, the complete amount of H2O is homogeneously dissolved throughout the melt already at 1523 K. In this case, the enrichment of H2O in the outer melt shell fails to explain the onset of coalescence at the sample rim in sample LLST_42D at Pf of 30 MPa. Therefore, we cannot fully explain this unique vesicle coalescence behavior, which warrants further investigation.
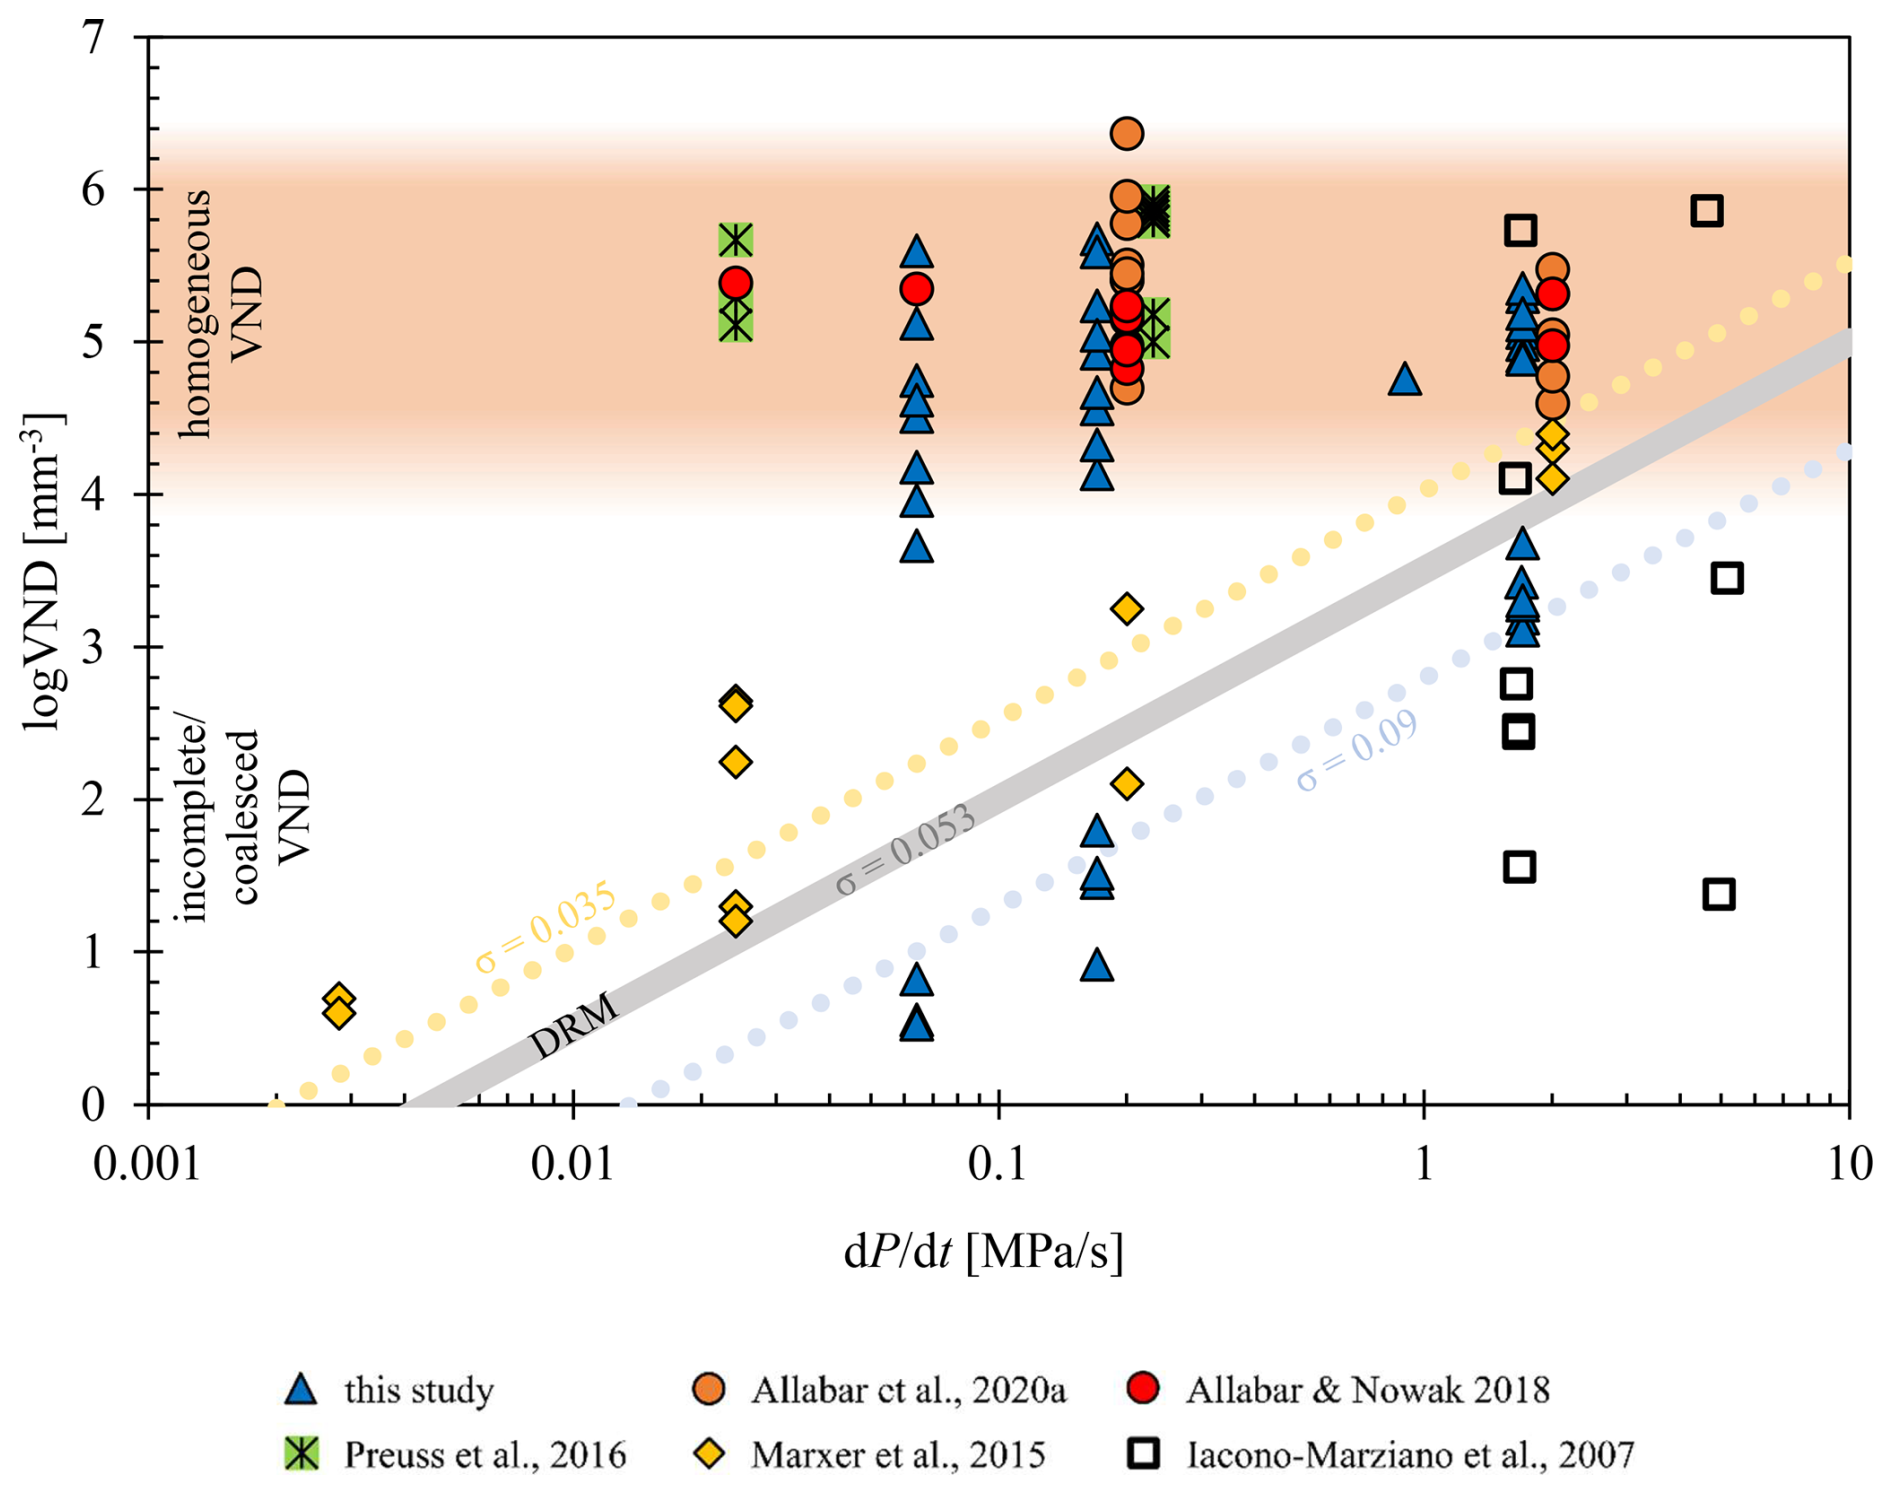
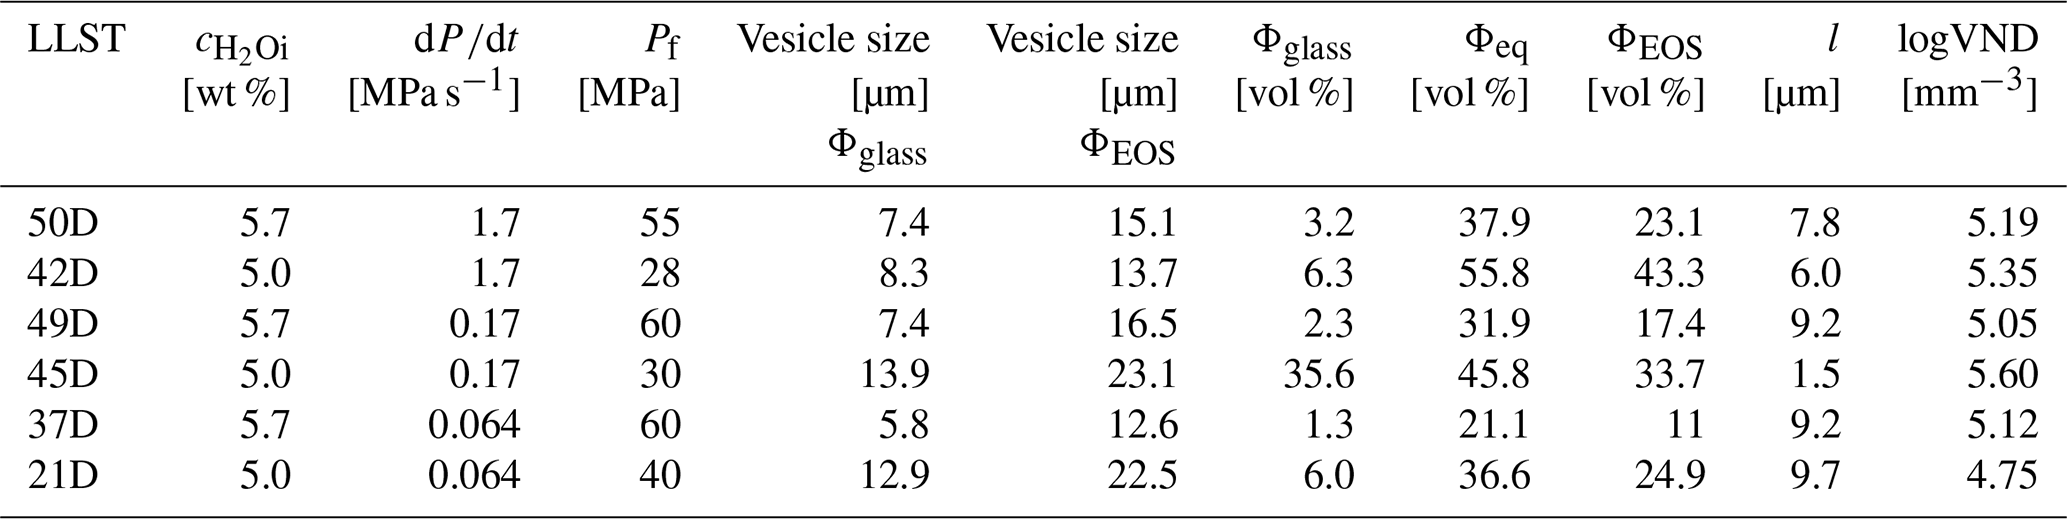
Figure 7VND vs. decompression rate plot of decompressed samples using hydrous phonolitic or trachytic melt. The samples are presented as follows: this study (including data from Marks and Nowak, 2025) is represented by blue triangles, Allabar and Nowak (2018) by red circles, Allabar et al. (2020b) by orange circles, Preuss et al. (2016) by crossed green squares, Marxer et al. (2015) by yellow diamonds, and Iacono-Marziano et al. (2007) by open squares. For a better overview, data from other authors were slightly shifted in by 0.03 at 0.17 MPa s−1 and 0.3 at 1.7 MPa s−1 to mitigate overlapping. The DRM line is calculated for the LLST composition using the surface tension σ=0.053 N m−1 calculated by Shea (2017) according to Toramaru (2006). Successful decompression experiments are plotted in the area of homogeneous VND, indicating degassing by spinodal decomposition. Data following the DRM line are influenced by coalescence, due to pre-existing bubbles, or due to an unsuitable capsule design.
4.4 VND adjusted by coalescence follows the decompression rate meter of Toramaru (2006)
The general trend of the VND development with decreasing Pf is consistent across all samples analyzed in this study (Fig. 3). However, the VND of the initially formed (logVND of 5.1–5.7) and partially extinct (logVND of 4.5–5.0) homogeneous vesicles remains constant across all decompression rates, consistently exhibiting uniform vesicle sizes within each sample, suggesting that their initial formation occurs via spinodal decomposition (Allabar and Nowak, 2018; Allabar et al., 2020a; Sahagian and Carley, 2020; Gardner et al., 2023; Marks and Nowak, 2025). This observation supports an alternative degassing mechanism to classical nucleation theory, in which VND depends on the decompression rate, and vesicle formation is limited to the extent necessary to reduce supersaturation. As a result, a range of vesicle sizes is present within a single sample, as new vesicles form only when existing ones are insufficient (Navon and Lyakhovsky, 1998). Upon the onset of coalescence, the VND decreases significantly by several orders of magnitude, 1–2 log units below the predicted VND using the DRM (decompression rate meter) line (Figs. 3, 7), calculated by Eq. (4) according to Toramaru (2006). The DRM is based on nucleation theory, which predicts an increasing nucleation rate with an increasing decompression rate leading to a decompression-rate-dependent VND of homogeneously nucleated vesicles. This method can be used to derive the magma ascent velocity using VNDs of volcanic ejecta.
C: initial total H2O concentration (number of molecules per cubic meters [m−3]); σ: surface tension of the vesicle–melt interface [N m−1]; k: Boltzmann constant ( [J K−1]); T: temperature [K]; Psat: H2O saturation pressure [Pa]; D: H2O diffusivity in the silicate melt [m2 s−1]; Vm: volume of an H2O molecule in the melt ( m3) (Burnham and Davis, 1971); : decompression rate [Pa s−1]
The model assumes that each H2O molecule is a potential vesicle nucleation site and that nucleation ceases during decompression when the VND reaches a level where vesicle distances are sufficiently small for a diffusion-controlled decrease in H2O supersaturation below the threshold necessary for further vesicle nucleation (Toramaru, 2006). Assuming nucleation as the formation process of vesicles, the DRM can be used to calculate the VND as a function of by considering the surface tension (σ), H2O content, and diffusivity defined by the H2O saturation pressure (Marks and Nowak, 2025). The surface tension was calculated by Eq. (5) according to Shea (2017) and was predicted to be 0.052 N m−1 for 5.7 wt % H2O and 0.053 N m−1 for 5.0 wt %. For the parameters σref, Tref, Pref, and SiO2ref (surface tension, temperature, pressure, and SiO2 content), values of a reference melt are chosen and taken to be σref=0.06 N m−1, Tref=900 °C, Pref=200 MPa, and SiO2ref=66.5 wt %. The required H2O diffusivity (logD) (in m2 s−1) was given in Eq. (6) by Schmidt et al. (2013) with (in wt %) and T (in K).
While the maximum logVND of the homogeneous vesicle volumes show independence from different decompression rates with consistently high values of 5.1–5.7 (Table 1), the logVNDs of coalesced sample volumes tend to follow the DRM, with the lowest logVNDs of 0.5–0.8 at the lowest decompression rate of 0.064 MPa s−1 and the highest logVNDs of 3.1–3.7 at the highest decompression rate of 1.7 MPa s−1. In each series, the onset of coalescence was observed, but complete coalescence – defined in this study as the advanced degassing stage where no pristine homogeneous vesicles remain – was only observed in the series with 5.7 wt % H2O. This occurred at a Pf of 40 MPa for rates of 0.064 and 0.17 MPa s−1 and at a Pf of 30 MPa for the 1.7 MPa s−1 rate.
Therefore, coalescence is a progressive process that results in decreasing VND with Pf. Several decompression experiments with phonolitic and trachytic melts have already been carried out, which both confirm and partially refute the behavior observed here by encompassing both decompression-rate-independent and decompression-rate-dependent VND. However, the decompression-rate-dependent VNDs observed in melts with compositions identical to those exhibiting decompression-rate-independent behavior were produced using an alternative experimental design (Allabar and Nowak, 2018; Allabar et al., 2020a; Preuss et al., 2016; Marxer et al., 2015; Iacono-Marziano et al., 2007).
For example, VAD79 experiments by Iacono-Marziano et al. (2007) and Marxer et al. (2015) revealed that small capsule diameters (2.4–2.5 mm) inhibited uniform vesicle formation due to H2O diffusional loss towards fringe vesicles at the capsule walls, compounded by coalescence at low Pf. Only the highest decompression rate of 1.7 MPa s−1, presented in the study of Marxer et al. (2015), produced uniformly distributed small vesicles (logVND of ∼4.3) due to shorter diffusion times. In contrast, Preuss et al. (2016) used larger glass cylinders (5 mm) of Campi Flegrei trachytic and VAD79 phonolitic melts, achieving high logVNDs of ∼5.6 with decompression-rate-independent VNDs. However, using powdered starting material at the same experimental conditions reduced VNDs significantly due to pre-existing H2O–N2 vesicles and degassing by diffusive growth of these pre-existing vesicles. The samples in which powder was used as starting material are therefore not included in Fig. 7. Allabar and Nowak (2018) and Allabar et al. (2020a, b) also observed decompression-rate-independent behavior in hydrous VAD79 melts, with high logVNDs (4.6–6.4) consistent with spinodal decomposition and deviating from the DRM trend (Fig. 7). This underscores that sample geometry, initial starting material, and experimental conditions can critically influence VNDs. Specifically, VNDs can be lower by orders of magnitude if the sample size is too small, if powder is used as the starting material, or if the decompression rate is too slow. A detailed description of the experiments referenced in Fig. 7 is included in Appendix B.
Fitting the DRM to the VNDs related to coalesced samples of this study and to samples of Marxer et al. (2015) result in σ values of 0.09 and 0.035 N m−1, respectively. According to Eq. (4), the slope of the DRM remains constant at , reflecting its dependency on the diffusion coefficient of H2O. This relationship allows Eq. (4) to be simplified to Eq. (7):
where y represents the intercept on the logVND y axis (Fig. 7). This y-axis intercept is influenced by the surface tension, which in turn depends on both the H2O concentration and the composition of the melt, leading to a vertical shift of the DRM line.
The question remains why the vesicle coalescence behavior adheres to the DRM line. Vesicle coalescence occurs in three primary stages: (1) the approach of vesicles, facilitated by external and/or internal forces such as vesicle growth (e.g., Maruishi and Toramaru, 2022); (2) the drainage of the melt film between vesicles to a critical thickness until it ruptures; and (3) the relaxation to a spherical shape driven by surface tension (e.g., Eri and Okumura, 2010). Various forces contribute to film drainage in magmas, including gravitational forces (Proussevitch et al., 1993), capillary forces (Nguyen et al., 2013; Proussevitch et al., 1993), vesicle growth (Castro et al., 2012), and shear deformation in conduit flow (e.g., Caricchi et al., 2011).
In our samples, we observed only the initial and final stages of vesicle coalescence. Only spherical and separated vesicles are observed in the homogeneous vesiculated areas that grew during ongoing decompression (Maruishi and Toramaru, 2022) as well as the final stage of the complete relaxation to spherical shapes in coalesced vesicles (Eri and Okumura, 2010). While evaluating the vesicle shapes in quenched glass, it is important to consider the effects of shrinkage. Most large coalesced vesicles exhibit nearly perfect spherical shapes. Although the VND decreased during coalescence, convergence of vesicles was not observed in the quenched samples.
A recent study by Ohashi et al. (2022) suggests that variations in VND during decompression can be explained by the capillary number (Ca ), which depends on the liquid viscosity (η), the vesicle growth rate (R⋅), and the surface tension (σ). The capillary number represents the interplay between the viscous force arising from vesicle growth and the capillary force. At Ca ≪1, two adjacent vesicles retain their spherical shapes until the film between them ruptures, a process governed by capillary forces. Conversely, at Ca ≫ 1, vesicles flatten with a constant film thickness, and vesicle growth drives film drainage. This distinction categorizes the coalescence process into capillary-dominated and growth-dominated regimes. An increase in vesicle growth rate and liquid viscosity prolongs the drainage timescale, consequently affecting the percolation threshold, which is defined as the porosity at which the vesiculated magma becomes permeable.
Ohashi et al. (2022) stated that Ca varies significantly with the eruption style of volcanoes. As the viscosity of magma increases due to the exsolution of dissolved H2O and as vesicle growth accelerates towards the fragmentation depth, Ca varies considerably, spanning multiple orders of magnitude. In high-viscosity melts, a high Ca leads to the development of larger vesicles, which increases the resistance to coalescence. This can elevate the percolation threshold and explain why such magma erupts explosively without significant outgassing. According to Castro et al. (2012), an increase in the ratio of vesicle size also increases the inter-vesicle pressure gradient, resulting in the formation of a dimpled structure. This distinctive geometry may be notable for Ca ≪ 1, where the Laplace pressure determines the pressure within vesicles.
Ohashi et al. (2022) found a correlation between VND and Ca at the final pressure, where Ca decreases with decreasing VND. The range of Ca where VND changes drastically () coincides with the range where the non-dimensional drainage timescale varies steeply. However, they were unable to apply the scaling of Ca to calculate the temporal change of VND. They plan to address this calculation in future studies. Furthermore, their concept does not provide a tool to explain our observed behavior of the VND tendency in the coalesced stage according to the DRM of Toramaru (2006). Based on their investigations, it is evident that variations in viscosity and surface tension during the vesicle growth significantly influence coalescence behavior in the melt.
Numerous models exist to calculate or simulate vesicle growth during decompression or equilibration at specific pressures (e.g., Gardner, 2007; Castro et al., 2012; Huber et al., 2014; Mancini et al., 2016; Giachetti et al., 2019; Coumans et al., 2020; Ohashi et al., 2022). However, no current equations or models can predict a specific VND at which vesicle coalescence will commence. For instance, Mancini et al. (2016) developed a growth-coalescence model based on the coalescence model by Castro et al. (2012). This kinetic model statistically describes vesicle growth due to decompression, volatile exsolution, and coalescence of a polydisperse vesicle population. However, their model assumes steady-state vesiculation processes and does not account for changes in viscosity and H2O diffusivity during decompression and exsolution of H2O.
The volatile content in magma significantly influences its bulk density (e.g., Wilson et al., 1980) and bulk viscosity (e.g., Mader et al., 2013). Additionally, H2O diffusivity and viscosity strongly affect vesicle formation, growth, and coalescence. H2O diffusivity controls the diffusive growth of vesicles, while the expansion of vesicles due to pressure–volume–temperature (PVT) changes is influenced by melt viscosity (Sparks et al., 1994), which itself is affected by the concentration of dissolved H2O (e.g., Giordano et al., 2008). Furthermore, significantly impacts the surface tension of vesicles (Shea, 2017), a critical factor in determining the work required for critically sized vesicle formation in the DRM model proposed by Toramaru (2006). However, the DRM model utilizes only a single value for σ to predict VND across various decompression rates.
To explain and predict the measured VND during ongoing decompression and its dependency on decompression rate, a model that accounts for dynamically evolving parameters such as H2O content, surface tension, viscosity, vesicle size, and growth rate is required. Specifically, understanding how surface tension changes when vesicles begin to coalesce is crucial. We assert that a substantial amount of experimental work, involving varying melt compositions, decompression rates, and H2O contents, is essential for developing a comprehensive prediction model for coalescence. This work can contribute to understanding why coalescence is evidently decompression rate-dependent, while the initial number of vesicles is decompression rate-independent.
4.5 The behavior of H2O during decompression
The evaluation of the absorption spectra of degassed samples reveals further effects of resorption. The H2O concentrations measured in the glass do not correspond to the in the melt state. Even if the actual in the residual melt is unknown, according to Hajimirza et al. (2019) the relative importance of H2O diffusion during decompression can be determined by the ratio of the diffusion timescale (τdiff) to the timescale of decompression (τd). If the diffusion timescale is shorter than the decompression timescale (), near-equilibrium degassing is facilitated, and degassing is controlled by the decompression rate. For experiments where , H2O diffusion into vesicles will be too slow to significantly affect saturation within the bulk of the sample. The high logVNDs during the homogeneous vesicle stages are expected to represent near-equilibrium melt degassing due to the rapid reduction of H2O supersaturation during further decompression from the melt into surrounding vesicles (Marks and Nowak, 2025). In the decompression experiments, vesicles are observed in the glass at Pf ranging from 80 to 50 MPa, depending on the decompression rate and , so τd can be asserted to the time between the pressure at which phase separation occurs and Pf. The τdiff (Eq. 8) is dependent on the characteristic diffusion length l (in mm) and the total H2O diffusivity () in (mm2 s−1) (Eq. 6), calculated according to Schmidt et al. (2013) (in m2 s−1). The l factor is defined by the inter-vesicle distance calculated according to Eq. (9) (Hajimirza et al., 2019).
For a consistent calculation, we use ΦEOS as porosity. A conservative estimate of , and thus of τdiff, is realized using at the Pf of each experiment (Table 1), resulting in the slowest possible H2O diffusivity. For the onset of vesiculation, we used 80 MPa for both at rates of 1.7 and 0.17 MPa s−1, 70 MPa for of 5.7 wt % and 0.064 MPa s−1, and 50 MPa for of 5.0 wt % and 0.064 MPa s−1. These starting pressures provide a conservative estimate of , as it is likely that vesiculation started earlier at higher P and vesicles were completely resorbed in the high Pf experiments (Allabar et al., 2020b; Marks and Nowak, 2025). The calculated mean l values of ∼7.2 µm in Table 2 fit very well to the estimated inter-vesicle distances vd of 7–9 µm according to Hertz (1908). The obtained values, with ratios of <1, indicate equilibrium degassing in the homogeneously vesiculated melt volumes with high logVNDs >4.7 and ΔP>20 MPa for the 1.7 MPa s−1 decompression series. In contrast, an increased ΔP of 30 MPa is necessary for the slower decompression rates.
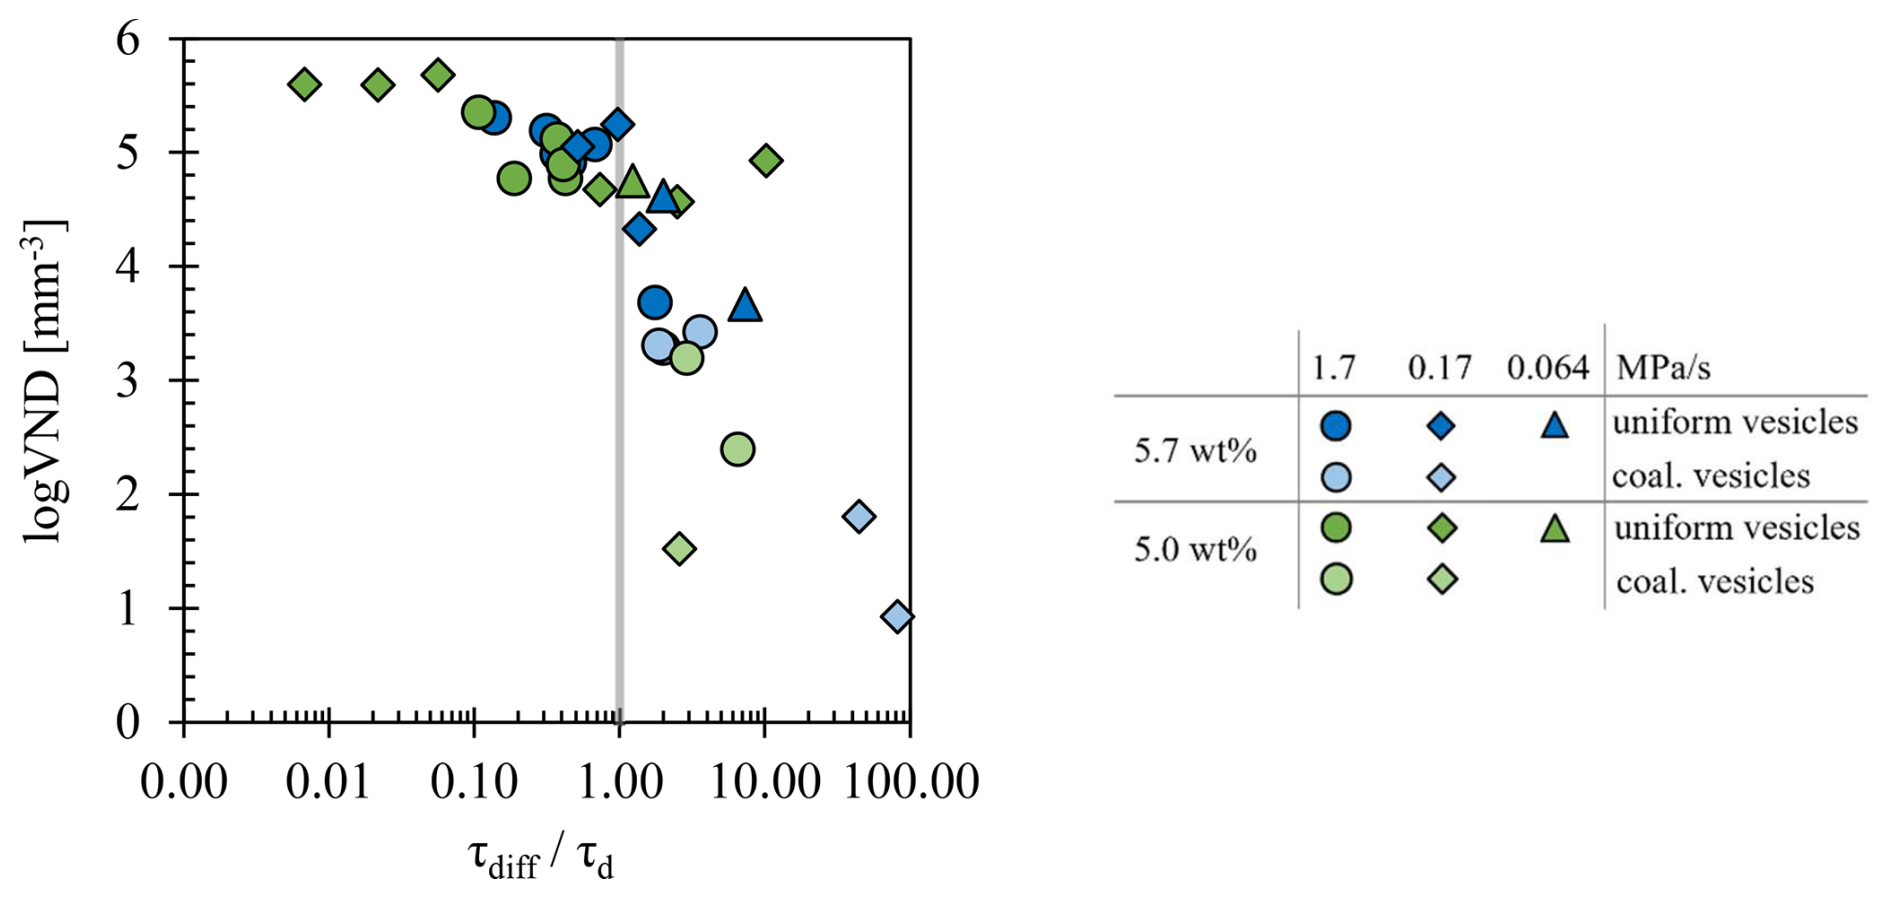
Figure 8Ratio of diffusion timescale to decompression timescale () as a function of VND. Blue symbols indicate a of 5.7 wt %, while green symbols show experiments with of 5.0 wt %. Decompression rates are represented by circles for 1.7 MPa s−1, diamonds for 0.17 MPa s−1, and triangles for 0.064 MPa s−1. Bright symbols show coalesced volumes, whereas dark symbols represent pristine uniformly vesiculated volumes.
Data from the coalesced volumes have ratios ≫1 (Fig. 8, Table 1), falling within the field of disequilibrium degassing. This is related to an increase in l due to an ongoing decrease in logVND and , correlated with the dependence on in the melt (Schmidt et al., 2013). As coalescence continues, the supersaturation between the existing vesicles increases, potentially leading to a second degassing process in the residual melt (Allabar et al., 2020a). The H2O diffusion from the interstitial melt into the large vesicles will not be fast enough to effectively reduce the H2O supersaturation that builds up during further continuous decompression. This may result in a secondary homogeneous vesicle formation event at and lower Pf compared to the initial vesicle population, resulting in lower Φequ and lower Φglass. However, no evidence of a secondary vesicle formation event was observed in the samples of this study. Therefore, if we had decompressed these samples further to lower Pf, a second vesicle formation event would be expected between the large coalesced vesicles, as the diffusion of H2O would no longer be fast enough in the H2O-depleted melt. However, most of the capsules are already significantly expanded, so further decompression lower than 30 MPa would not have been feasible as the capsule would burst (Figs. S1 and S2).
In addition to the resorption of H2O from fluid vesicles back into the melt during quenching, the increasing l with progressing coalescence and decreasing VND contributes to the high values measured in glasses between coalesced vesicles (Fig. 5). The measurements in the residual glass are substantially higher than , exceeding it by 1 wt %–2 wt %. Measurements through homogeneous vesiculated areas with vesicles in the beam path yielded values as high as 10 wt % H2O, which surpass the solubility of the LLST melt by more than 8 wt % (Fig. 5, Table 1). The supercritical H2O fluid in the vesicles is quenched to water and gas phase at room temperature (Allabar et al., 2020b). Therefore, absorption spectra collected through highly vesiculated volumes should be evaluated using the appropriate absorption coefficients, glass density, and the presence of H2O-filled vesicles. Absorption coefficients for liquid H2O are in the range of 5 and 10 L mol−1 cm−1 in the near-infrared region (Bertie and Lan, 1996), whereas the molar absorption coefficients of LLST glass were determined to and L mol−1 cm−1 (Marks and Nowak, 2025). Further adjustments to the evaluation of the NIR spectra would be necessary to eliminate the effect of liquid H2O in the vesicles. For this reason, only measurements in vesicle-free glass volumes should be evaluated.
The samples in Fig. 5 that show almost were also measured through H2O vesicles. However, due to the low porosity and small vesicle size, the effect of liquid H2O captured in vesicles is negligible here. Samples of Fig. 5d, e, and f demonstrate how strongly the measured H2O content of the samples depends on VND, porosity, and vesicle size. As the proportion of H2O vesicles in the beam path increases, the measured H2O content also increases. This case illustrates the importance of accurately analyzing the sample volume to ensure pure glass conditions when assessing the residual melt conditions.
The rapid transformation of initial VND from decompression rate independence with high logVNDs of ∼5.5 towards the stage of coalescence, with orders of magnitude lower VNDs that became decompression rate dependent, aligns with the VND prediction according to DRM (Toramaru, 2006). This shift has important implications for understanding magma dynamics during ascent in volcanic conduits. In general, when a homogeneous magma becomes supersaturated in volatiles, vesicle formation occurs through the rapid exsolution of H2O. High VNDs result in a rapid reduction of the H2O supersaturation, with vesicle growth proceeding through diffusional H2O uptake during decompression.
In this study, in the first vesiculation stage high logVNDs of 5.1–5.7 were observed, which align with previous findings of log VNDs of 4–6 in both experimental and natural phonolitic and trachytic samples from Vesuvius and Campi Flegrei (Marxer et al., 2015; Allabar et al., 2018; Gurioli et al., 2005; Mastrolorenzo et al., 2001). At these high VND levels, near-equilibrium degassing from the melt into the vesicles is anticipated. Further vesicle expansion during magma ascent is driven by continued H2O diffusion into vesicles, facilitated by the reduced solubility of H2O in the silicate melt and the expansion of the fluid phase under decompression. As vesiculation progresses, decompression rates may increase, driven by buoyancy forces acting on the melt, and decreasing density as vesicles expand (e.g., Wilson et al., 1980). Additionally, vesicles may rise relative to the magma, according to their size and the magma's viscosity, thereby undergoing coalescence and decompressive expansion (Proussevitch et al., 1993).
In open systems, vesicle coalescence can result in high permeability, allowing H2O to escape at the top of the magma column. Recent experimental studies indicate that the presence of crystals, such as phenocrysts and microlites, promotes vesicle coalescence and reduces the percolation threshold (Cáceres et al., 2022; DeGraffenried et al., 2019). In contrast, in closed systems, vesicles may accumulate as foam at the top of the magma chamber, forming large gas-pressurized pockets that may lead to a final disruption and eruption of the magma. Foams with higher melt viscosity are less likely to disrupt quickly, leading to less frequent but more energetic eruptions compared to lower-viscosity foams, as is typically observed (Proussevitch et al., 1993).
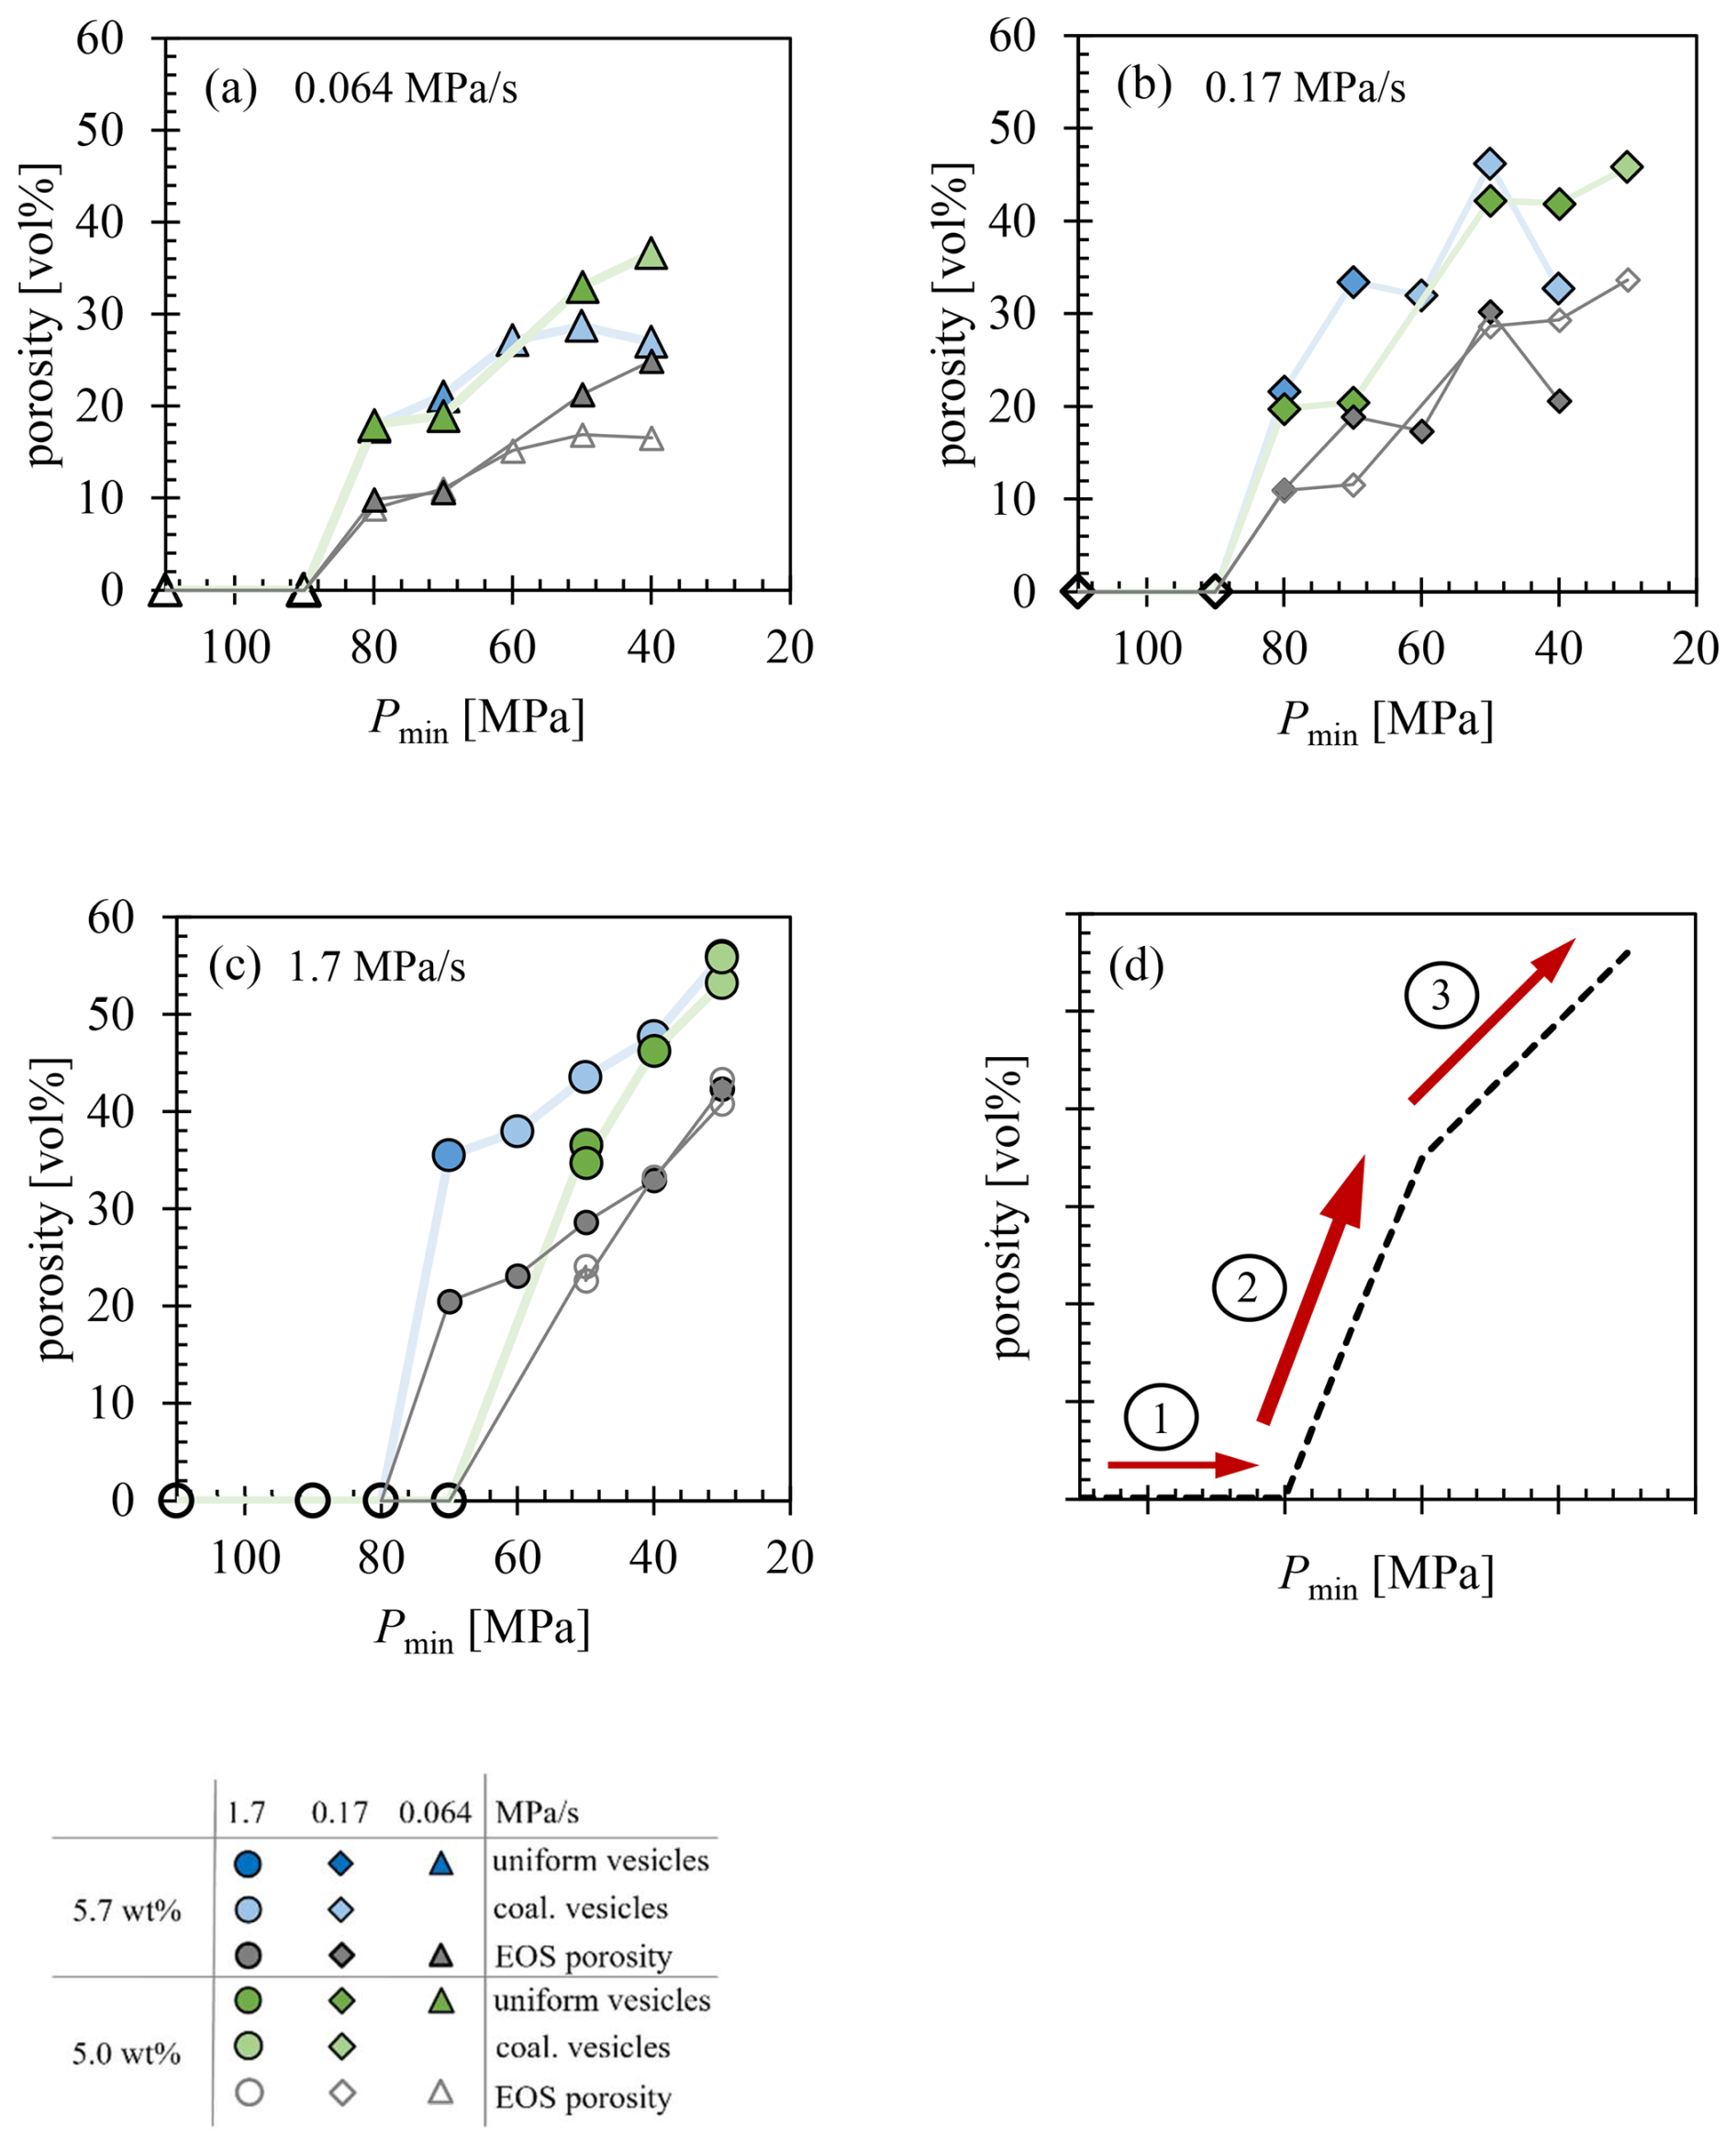
Figure 9Porosity increases with decreasing final pressure at decompression rates of (a) 0.064 MPa s−1, (b) 0.17 MPa s−1, and (c) 1.7 MPa s−1. The equilibrium melt porosity, calculated according to Eq. (1), is shown in blue for a of 5.7 wt % and in green for a of 5.0 wt %. The EOS porosity, calculated according to Eq. (3), is depicted with filled gray symbols for 5.7 wt % and unfilled gray symbols for 5.0 wt %. Panel (d) illustrates the general trend of increasing porosity with decreasing final pressure. The numbers indicate: (1) supersaturation of the melt without degassing, where supersaturation continues to increase; (2) onset of degassing, characterized by a rapid increase in porosity and the attainment of maximal VNDs within short timescales; (3) vesicle coalescence, during which porosity increases at a more gradual rate.
With increasing decompression rates, the time available for vesicle coalescence is reduced, potentially allowing the initially high VND to be preserved up to the surface. Figure 9 illustrates the increase in ϕeq as final pressure decreases. The porosity values reflect the evolution of the ascending melt. During ascent, the melt becomes supersaturated, without vesicle formation and no reduction in supersaturation (Fig. 9d1). Upon reaching sufficiently low pressures necessary for vesicle formation, the porosity undergoes a rapid increase due to the exsolution of H2O from the melt over a very brief time interval. This interval decreases with higher decompression rates (Fig. 9d2).
At the highest decompression rate of 1.7 MPa s−1 applied in this study (Fig. 9c), porosity increases from 0 vol % to ∼35 vol % over a pressure decrease of 10–20 MPa (depending on ), which corresponds to a time span of roughly 6 to 12 s. Although these values are derived from experimental conditions, it is expected that such an extreme increase in porosity, along with the associated buoyant forces, would limit the time available for coalescence and hinder the reduction of magma chamber overpressure. Despite this, if the coalescence stage is reached, ϕeq increases at a more gradual rate (Fig. 9d3). However, the viscosity of silica-rich melts increases by orders of magnitude as H2O exsolves (Proussevitch et al., 1993; Sparks, 1978), reducing the ascent rate of vesicles. This observation corresponds with findings by Gardner (2007), where a VND dependence on melt viscosity was noted: in high-viscosity melts, such as rhyolites, the initial high VND tends to be preserved, whereas in lower-viscosity melts like phonolite, coalescence significantly decreases the original VND by one to two orders of magnitude.
Our study supports this VND overprint in low-viscosity phonolitic melt, as similar VND values were observed at various decompression rates during the initial phase of phase separation, followed by significant decrease at the onset of coalescence. Consequently, VND values in natural pumice may not directly correlate with decompression rates, given that VND can vary substantially during magma ascent. Thus, the bulk composition of the melt exerts a substantial influence on the vesiculation process under decompression, and thereby, on ascent dynamics within volcanic conduits.
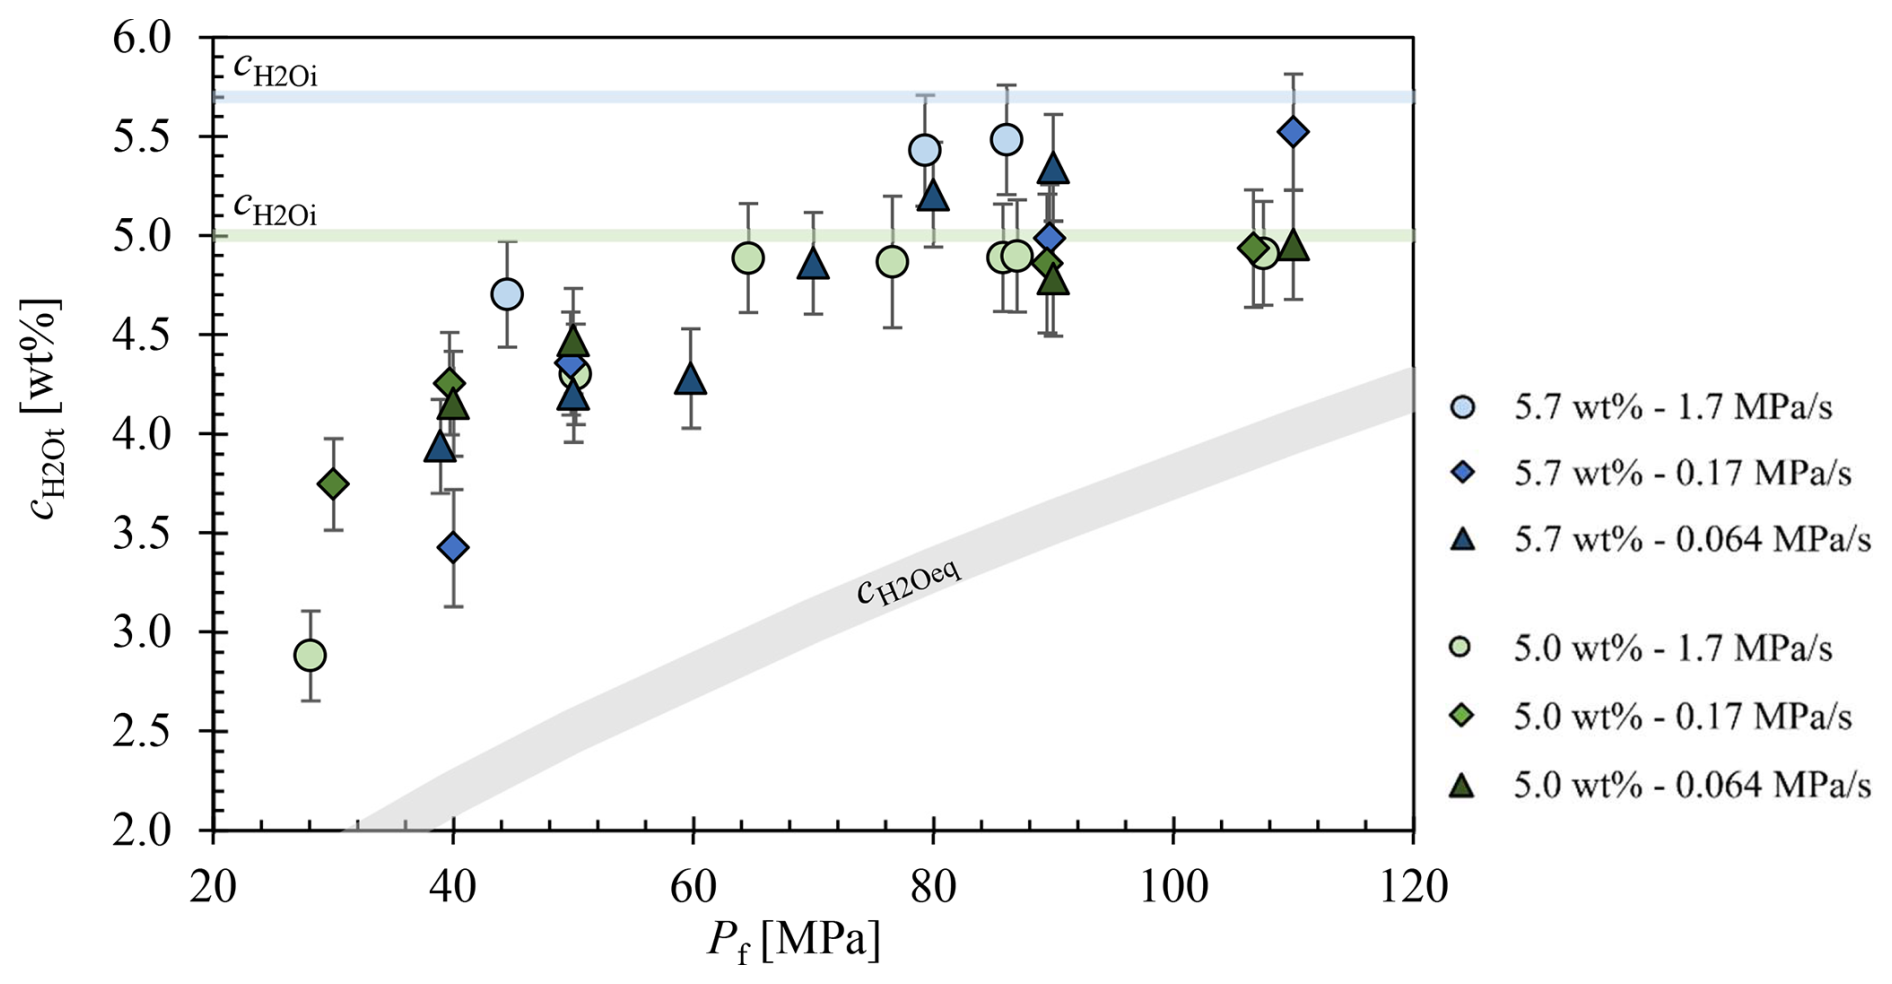
Figure A1Extended diagram of Marks and Nowak (2025). The residual c in the glass is plotted against the final pressure (Pf) of the decompressed samples. Only samples that were able to be measured undisturbed by vesicles in the beam path are shown. The equilibrium H2O content () curve was calculated according to Eq. (5) therein.
The first superliquidus decompression experiments using Vesuvius white pumice phonolite (VAD79) were conducted by Iacono-Marziano et al. (2007). Utilizing a similar experimental setup, which employed vertically operating TZM (titanium–zirconium–molybdenum alloy) cold-seal pressure vessels, the initial glass cylinders were subjected to decompression under superliquidus conditions at 1323 K within a pressure range of 200–10 MPa. Although four different decompression rates were tested, only the fastest two rates of 0.17 and 4.8 MPa s−1 were applied via continuous decompression and are thus represented in Fig. 7. Their study demonstrated that the experimental investigation of hydrous melt phase separation at low decompression rates (0.0028 and 0.024 MPa s−1) was limited by the capsule size. The small capsule diameter of 2.4 mm inhibited the formation of homogeneously formed vesicles in the sample center due to the diffusional loss of H2O towards heterogeneously nucleated fringe vesicles at the capsule wall, nucleated at low supersaturation during decompression. However, in samples subjected to rapid decompression, a high logVND of ∼5.8 mm−3 was observed at a ΔP of 125 to 130 MPa, with no clear dependence of VND on decompression rates ranging from 1.7 to 4.6 MPa s−1. Experiments conducted to lower Pf indicated that vesicles expanded rapidly at a ΔP of about 150 MPa, reaching the process of coalescence at ΔP≥180 MPa. This coalescence led to a significant reduction in VND, with values dependent on Pf, resulting in very low VNDs.
While the data from Iacono-Marziano et al. (2007) exhibit a variable VND distribution due to increasing coalescence, the data from Marxer et al. (2015) show a trend similar to the predicted DRM. This trend can be attributed to the capsule design. Marxer et al. (2015) examined the same phonolitic VAD79 composition at the same superliquidus temperature of 1323 K in an IHPV. Capsules with diameters of 2.5 mm and 5.0 mm were used, which were filled with glass cylinders and H2O to achieve slightly supersaturated and slightly undersaturated melt conditions, respectively. The hydrous melts were decompressed from 200 to 75 MPa at rates ranging from 0.0028 to 1.7 MPa s−1. Only the continuous decompression experiments were included in Fig. 7, as the single-step and multi-step methods do not represent a true decompression pathway (Marxer et al., 2015).
Analysis of the experimental results showed that the 2.5 mm capsules were too small in diameter. Early degassing of the sample due to heterogeneous vesicle nucleation and growth at the capsule-melt interface can prevent homogeneous formation in the sample center if the nominal decompression rate is sufficiently low (Mangan and Sisson, 2000; Iacono-Marziano et al., 2007). H2O diffusion into heterogeneously nucleated vesicles leads to a depletion of H2O in the sample center, thereby preventing homogeneous vesicle formation. The samples achieved homogeneous vesicle formation in the central melt volume only at the fastest rate of 1.7 MPa s−1, with logVNDs of ∼4.3, due to the shorter diffusion time. Therefore, it is essential to clearly distinguish the VND between homogeneous vesicle formation observed at a decompression rate of 1.7 MPa s−1 and heterogeneous nucleation at the capsule melt interface observed at decompression rates of 0.0028, 0.024, and 0.17 MPa s−1, which are too slow for the used capsule diameter. In this case, the VNDs follow the DRM.
Preuss et al. (2016) utilized slightly H2O-undersaturated trachytic Campi Flegrei and phonolitic VAD79 melts. Decompression experiments in the IHPV with either glass cylinders of 5 mm in diameter or glass powder used as starting material were decompressed at a superliquidus temperature of 1323 K from 200 MPa to Pf of 100, 75, and 60 MPa using continuous decompression rates of 0.024 and 0.17 MPa s−1. Decompression of all samples with glass cylinders as starting material led to homogeneous vesicle formation with high logVNDs of ∼5.6. The supersaturation pressures for homogeneous vesicle formation were estimated to be <76 MPa for the trachytic and <70 MPa for the phonolitic melt. The decompressed samples with powder as starting material resulted in reduced logVNDs by several orders of magnitude due to initially entrapped air in the powder pore space. This led to the formation of tiny H2O-N2 vesicles throughout the melts prior to decompression. Degassing of these samples was facilitated by diffusive growth of these pre-existing vesicles. Thus, an H2O supersaturation of the melt was not achieved. The samples with glass powder used as starting material are therefore not included in Fig. 7. The VNDs observed in samples with glass cylinders as the starting material exhibit degassing behavior similar to the results of this study that is independent of the decompression rate.
Similar observations were made by Allabar and Nowak (2018) and Allabar et al. (2020a). They conducted decompression experiments with hydrous phonolitic melts of VAD79 composition at undersaturated, saturated, and slightly supersaturated H2O conditions at superliquidus temperatures of 1323 and 1373 K. Samples with glass cylinders with diameters of 5 mm used as starting material were decompressed at rates ranging from 0.024 to 1.7 MPa s−1. They reported high logVNDs, covering a range of 4.6 to 6.4 mm−3, resulting in a mean logVND of ∼5.3 across the entire dataset. Consequently, the data plotted consistently in the field of homogeneous vesicle formation (Fig. 7) and exhibited a decompression-rate-independent VND, consistent with the concept of spinodal decomposition, deviating significantly from the DRM trend.
All data derived from this research are presented in the enclosed tables, figures, and the Supplement.
The supplement related to this article is available online at https://doi.org/10.5194/ejm-37-413-2025-supplement.
PLM: conceptualization, sample preparation, experiments, analysis and evaluation, software, visualization, writing of the original draft, organization; MN: conceptualization, supervision, manuscript revision.
The contact author has declared that neither of the authors has any competing interests.
Publisher's note: Copernicus Publications remains neutral with regard to jurisdictional claims made in the text, published maps, institutional affiliations, or any other geographical representation in this paper. While Copernicus Publications makes every effort to include appropriate place names, the final responsibility lies with the authors.
This article is part of the special issue “Probing the Earth: experiments on and for our planet”. It is a result of the EMPG 2023 conference, Milan, Italy, 12–15 June 2023.
We thank Barbara Maier and Annette Flicker for technical support, Simone Schafflick for the high-quality sample preparation and Dennis Eul for support in the laboratory.
This research has been supported by the Deutsche Forschungsgemeinschaft (grant no. NO378/15-1).
This open-access publication was funded by the Open Access Publication Fund of the University of Tübingen.
This paper was edited by Francois Holtz and reviewed by Mathieu Colombier and Caroline Martel.
Allabar, A. and Nowak, M.: Message in a bottle: Spontaneous phase separation of hydrous Vesuvius melt even at low decompression rates, Earth Planet. Sc. Lett., 501, 192–201, https://doi.org/10.1016/j.epsl.2018.08.047, 2018.
Allabar, A., Dobson, K. J., Bauer, C. C., and Nowak, M.: Vesicle shrinkage in hydrous phonolitic melt during cooling, Contrib. Miner. Petr., 175, 21, https://doi.org/10.1007/s00410-020-1658-3, 2020a.
Allabar, A., Salis Gross, E., and Nowak, M.: The effect of initial H2O concentration on decompression-induced phase separation and degassing of hydrous phonolitic melt, Contrib. Miner. Petr., 175, 22, https://doi.org/10.1007/s00410-020-1659-2, 2020b.
Barclay, J., Riley, R. S., and Sparks, R. S. J.: Analytical models for bubble growth during decompression of high viscosity magmas, Bull. Volcanol., 57, 422–431, https://doi.org/10.1007/BF00300986, 1995.
Berndt, J., Liebske, C., Holtz, F., Freise, M., Nowak, M., Ziegenbein, D., Hurkuck, W., and Koepke, J.: A combined rapid-quench and H2-membrane setup for internally heated pressure vessels: Description and application for water solubility in basaltic melts, Am. Mineral., 87, 1717–1726, https://doi.org/10.2138/am-2002-11-1222, 2002.
Bertie, J. E. and Lan, Z.: Infrared Intensities of Liquids XX: The Intensity of the OH Stretching Band of Liquid Water Revisited, and the Best Current Values of the Optical Constants of H2O(I) at 25 °C between 15,000 and 1 cm−1, Appl. Spectrosc., 50, 1047–1057, https://doi.org/10.1366/0003702963905385, 1996.
Blower, J., Keating, J. P., Mader, H. M., and Phillips, J. C.: Inferring Volcanic Degassing Processes From Vesicle Size Distributions, Geophys. Res. Lett., 28, 347–350, https://doi.org/10.1029/2000GL012188, 2001.
Burnham, C. W. and Davis, N. F.: The role of H2O in silicate melts, 1: P−V −T relations in the system NaAlSi3O8–H2O to 10 kilobars and 1000 °C, Am. J. Sci., 270, 54–79, https://doi.org/10.2475/ajs.270.1.54, 1971.
Cáceres, F., Scheu, B., Colombier, M., Hess, K. U., Feisel, Y., Ruthensteiner, B., and Dingwell, D. B.: The roles of microlites and phenocrysts during degassing of silicic magma, Earth Planet. Sc. Lett., 577, 117264, https://doi.org/10.1016/j.epsl.2021.117264, 2022.
Candela, P. A.: Physics of aqueous phase evolution in plutonic environments, Am. Mineral., 76, 1081–1091, 0003-004X/91/0708−1081, 1991.
Caricchi, L., Pommier, A., Pistone, M., Castro, J., Burgisser, A., and Perugini, D.: Strain-induced magma degassing: Insights from simple-shear experiments on bubble bearing melts, Bull. Volcanol., 73, 1245–1257, https://doi.org/10.1007/s00445-011-0471-2, 2011.
Cashman, K. and Mangan, M.: Physical Aspects of Magmatic degassing II. Constraints on vesiculation processes from textural studies of eruption products, Rev. Mineral., 30, 477–478, https://doi.org/10.1515/9781501509674-018, 1994.
Cashman, K. V., Mangan, M. T., and Newman, S.: S. Surface degassing and modifications to vesicle size distributions in active basalt flows, J. Volcanol. Geoth. Res., 61, 45–68, https://doi.org/10.1016/0377-0273(94)00015-8, 1994.
Castro, J. M., Burgisser, A., Schipper, C. I., and Mancini, S.: Mechanisms of bubble coalescence in silicic magmas, Bull. Volcanol., 74, 10, 2339–2352, https://doi.org/10.1007/s00445-012-0666-1, 2012.
Coumans, J. P., Llewellin, E. W., Wadsworth, F. B., Humphreys, M. C. S., Mathias, S. A., Yelverton, B. M., and Gardner, J. E.: An experimentally validated numerical model for bubble growth in magma, J. Volcanol. Geoth. Res., 402, 107002, https://doi.org/10.1016/j.jvolgeores.2020.107002, 2020.
DeGraffenried, R. L., Larsen, J. F., Graham, N. A., and Cashman, K. V.: The influence of phenocrysts on degassing in crystal-bearing magmas with rhyolitic groundmass melts, Geophys. Res. Lett., 46, 5127–5136, https://doi.org/10.1029/2018GL081822, 2019.
DeVries, A. J.: Foam stability: Part II. Gas diffusion in foams, Delft, the Netherlands, 77, 209–223, https://doi.org/10.1002/recl.19580770302, 1958.
Duan, Z. H. and Zhang, Z. G.: Equation of state of the H2O, CO2, and H2O- CO2 systems up to 10 GPa and 2573.15 K: Molecular dynamics simulations with ab initio potential surface, Geochim. Cosmochim. Ac., 70, 2311–2324, https://doi.org/10.1016/j.gca.2006.02.009, 2006.
Eichelberger, J. C., Carrigan, C. R., Westrich, H. R., and Price, R. H.: Non-explosive silicic volcanism, Nature, 323, 598–602, https://doi.org/10.1038/323598a0, 1986.
Eri, A. and Okumura, K.: Bursting of a thin film in a confined geometry: Rimless and constant-velocity dewetting, Phys. Rev. E, 8, 1–4, https://doi.org/10.1103/PhysRevE.82.030601, 2010.
Fortelny, I., Ziviny, A., and Juza, J.: Coarsening of the phase structure in immiscible polymer blends: Coalescence or Ostwald ripening?, J. Polymer Sci. B: Polymer Phys., 37, 181–187, https://doi.org/10.1002/(SICI)1099-0488(19990201)37:3<181::AID-POLB1>3.0.CO;2-I, 1999.
Gardner, J. E.: Bubble coalescence in rhyolitic melts during decompression from high pressure, J. Volcanol. Geoth. Res., 166, 161–176, https://doi.org/10.1016/j.jvolgeores.2007.07.006, 2007.
Gardner, J. E. and Ketcham, R. A.: Bubble nucleation in rhyolite and dacite melts: temperature dependence of surface tension, Contrib. Miner. Petrol., 162, 929–943, https://doi.org/10.1007/s00410-011-0632-5, 2011.
Gardner, J., Thomas, R. M. E., Jaupart, C., and Tait, S.: Fragmentation of magma during Plinian volcanic eruptions, Bull. Volcanol., 58, 144–162, https://doi.org/10.1007/s004450050132, 1996.
Gardner, J. E., Hilton, M., and Carroll, M. R.: Experimental constraints on degassing of magma: isothermal bubble growth during continuous decompression from high pressure, Earth Planet. Sc. Lett., 168, 201–218, https://doi.org/10.1016/S0012-821X(99)00051-5, 1999.
Gardner, J. E., Burgisser, A., Hort, M., and Rutherford, M.: Experimental and model constraints on degassing of magma during ascent and eruption, Geol. Soc. Am. Bull. Spec. Pap., 402, 99–114, https://doi.org/10.1130/2006.2402(04), 2006.
Gardner, J. E., Wadsworth, F. B., Carley, T. L., Llewellin, E. W., Kusumaatmaja, H., and Sahagian, D.: Bubble Formation in Magma, Ann. Rev. Earth Planet. Sci., 51, 131–154, https://doi.org/10.1146/annurev-earth-031621-080308, 2023.
Genareau, K., Proussevitch, A. A., Durant, A. J., Mulukutla, G., and Sahagian, D. L.: Sizing up the bubbles that produce very fine ash during explosive volcanic eruptions, Geophys. Res. Lett., 39, L15306, https://doi.org/10.1029/2012GL052471, 2012.
Giachetti, T., Gonnermann, H. M., Gardner, J. E., Burgisser, A., Hajimirza, S., Earley, T. C., Truong, N., and Toledo, P.: Bubble coalescence and percolation threshold in expanding rhyolitic magma, Geochem. Geophys. Geosyst., 20, 1054–1074, https://doi.org/10.1029/2018GC008006, 2019.
Giordano, D., Potuzak, M., Romano, C., Dingwell, D. B., and Nowak, M.: Viscosity and glass transition temperature of hydrous melts in the system CaAl2Si2O8-CaMgSi2O6, Chem. Geol., 256, 203–215, https://doi.org/10.1016/j.chemgeo.2008.06.027, 2008.
Gonnermann, H. M. and Manga, M.: The Fluid Mechanics Inside a Volcano, Annu. Rev. Fluid Mech., 39, 321–356, https://doi.org/10.1146/annurev.fluid.39.050905.110207, 2007.
Gurioli, L., Houghton, B. F., Cashman, K. V., and Cioni, R.: Complex changes in eruption dynamics during the 79 AD eruption of Vesuvius, Bull. Volcanol. 67, 144–159, https://doi.org/10.1007/s00445-004-0368-4, 2005.
Hajimirza, S., Gonnermann, H. M., Gardner, J. E., and Giachetti, T.: Predicting homogeneous bubble nucleation in rhyolite, J. Geophys. Res.-Sol. Ea., 124, 2395–2416, https://doi.org/10.1029/2018JB015891, 2019.
Hamada, M., Laporte, D., Cluzel, N., and Koga, K. T.: Kawamoto T.: Simulating bubble number density of rhyolitic pumices from Plinian eruptions: constraints from fast decompression experiments, Bull. Volcanol., 72, 735–46, https://doi.org/10.1007/s00445-010-0353-z, 2010.
Harms, E., Gardner, J. E., and Schmincke, H. U.: Phase equilibria of the Lower Laacher See Tephra (East Eifel, Germany): constraints on pre-eruptive storage conditions of a phonolitic magma reservoir, J. Volcanol. Geoth. Res., 134, 135–148, https://doi.org/10.1016/j.jvolgeores.2004.01.009, 2004.
Herd, R. and Pinkerton, H.: Bubble coalescence in basaltic lava: Its impact on the evolution of bubble populations, J. Volcanol. Geoth. Res., 75, 137–157, https://doi.org/10.1016/s0377-0273(96)00039-x, 1997.
Hertz, P.: Über den gegenseitigen durchschnittlichen Abstand von Punkten, die mit bekannter mittlerer Dichte im Raume angeordnet sind, Math. Ann., 67, 387–398, https://doi.org/10.1007/BF01450410, 1908.
Higgins, M. D.: Measurement of crystal size distributions, Am. Mineral., 85, 1105–1116, https://doi.org/10.2138/am-2000-8-901, 2000.
Huber, C., Su, Y., Nguyen, C. T., Parmigiani, A., Gonnermann, H. M., and Dufek, J.: A new bubble dynamics model to study bubble growth, deformation, and coalescence, J. Geophys. Res.-Sol. Ea., 119, 216–239, https://doi.org/10.1002/2013JB010419, 2014.
Hurwitz, S. and Navon, O.: Bubble nucleation in rhyolitic melts: experiments at high pressure, temperature, and water content, Earth Planet. Sc. Lett., 122, 267–280, https://doi.org/10.1016/0012-821X(94)90001-9, 1994.
Iacono-Marziano, G., Schmidt, B. C., and Dolfi, D.: Equilibrium and disequilibrium degassing of a phonolitic melt (Vesuvius AD 79 “white pumice”) simulated by decompression experiments, J. Volcanol. Geoth. Res., 161, 151–164, https://doi.org/10.1016/j.jvolgeores.2006.12.001, 2007.
Jaupart, C.: Gas loss from magmas through conduit walls during eruption. The physics of explosive volcanic eruptions, Geol. Soc. Lond. Spec. Pub., 145, 73–90, https://doi.org/10.1144/GSL.SP.1996.145.01.05, 1998.
Jaupart, C. and Allègre, C. J.: Gas content, eruption rate and instabilities of eruption regime in silicic volcanoes, Earth Planet. Sc. Lett., 102, 413–429, https://doi.org/10.1016/0012-821X(91)90032-D, 1991.
Klug, K. and Cashmam, K. V.: Vesiculation of May 18, 1980 Mount St. Helens magma, Geology, 22, 468–472, https://doi.org/10.1130/0091-7613(1994)022<0468:VOMMSH>2.3.CO;2, 1994.
Klug, C. and Cashman, K. V.: Permeability development in vesiculating magmas: Implications for fragmentation, Bull. Volcanol., 58, 87–100, https://doi.org/10.1007/s004450050128, 1996.
Kueppers, U., Scheu, B., Spieler, O., and Dingwell, D.B.: Fragmentation efficiency of explosive volcanic eruptions: a study of experimentally generated pyroclasts, J. Volcanol. Geoth. Res., 153, 125–135, https://doi.org/10.1016/j.jvolgeores.2005.08.006, 2006.
Larsen, J. F., Denis, M. H., and Gardner, J. E.: Experimental study of bubble coalescence in rhyolitic and phonolitic melts, Geochim. Cosmochim. Ac., 68, 333–344, https://doi.org/10.1016/S0016-7037(03)00412-5, 2004.
Mader, H. M., Llewellin, E. W., and Mueller, S. P.: The rheology of two-phase magmas: A review and analysis, J. Volcanol. Geoth. Res., 257, 135–158, https://doi.org/10.1016/j.jvolgeores.2013.02.014, 2013.
Mancini, S., Forestier-Coste, L., Burgisser, A., James, F., and Castro, J.: An expansion-coalescence model to track gas bubble populations in magmas, J. Volcanol. Geoth. Res., 313, 44–58, https://doi.org/10.1016/j.jvolgeores.2016.01.016, 2016.
Mangan, M. and Sisson, T.: Delayed, disequilibrium degassing in rhyolite magma: decompression experiments and implications for explosive volcanism, Earth Planet. Sc. Lett., 183, 441–55, https://doi.org/10.1016/S0012-821X(00)00299-5, 2000.
Mangan, M. T., Cashman, K. V., and Newman, S.: Vesiculation of basaltic magma during eruption, Geology, 21, 157–160, https://doi.org/10.1130/0091-7613(1993)021<0157:VOBMDE>2.3.CO;2, 1993.
Marks, P. L. and Nowak, M.: Vesiculation dynamics – Part 1: Decompression-induced H2O vesicle formation in the Lower Laacher See phonolitic melt, Eur. J. Mineral., 37, 385–412, https://doi.org/10.5194/ejm-37-385-2025, 2025.
Maruishi, T. and Toramaru, A.: Effect of bubble deformation on the coalescence of two ascending bubbles in a viscous liquid, Phys. Fluids, 34, 043302, https://doi.org/10.1063/5.0082506, 2022.
Marxer, H., Bellucci, P., and Nowak, M.: Degassing of H2O in a phonolitic melt: A closer look at decompression experiments, J. Volcanol. Geoth. Res., 297, 109–124, https://doi.org/10.1016/j.jvolgeores.2014.11.017, 2015.
Mastrolorenzo, G., Brachi, L., and Canzanella, A.: Vesicularity of various types of pyroclastic deposits of Campi Flegrei volcanic field: Evidence of analogies in magma rise and vesiculation mechanisms, J. Volcanol. Geoth. Res., 109, 41–53, https://doi.org/10.1016/S0377-0273(00)00303-6, 2001.
McIntosh, I. M., Llewellin, E. W., Humphreys, M. C. S., Nichols,A. R. L., Burgisser, A., Schipper, C. I., and Larsen, J. F.: Distribution of dissolved water in magmatic glass records growth and resorption of bubbles, Earth Planet. Sc. Lett., 401, 1–11, https://doi.org/10.1016/j.epsl.2014.05.037, 2014.
Mourtada-Bonnefoi, C. and Laporte, D.: Kinetics of bubble nucleation in a rhyolitic melt: an experimental study of the effect of ascent rate, Earth Planet. Sc. Lett., 218, 521–537, https://doi.org/10.1016/S0012-821X(03)00684-8, 2004.
Navon, O. and Lyakhovsky, V.: Vesiculation processes in silicic magmas, in: The Physics of Explosive Volcanic Eruptions, edited by: Gilbert, J. S. and Sparks, R. S. J., Geological Society, London, Special Publications, 145, 27–50, ISBN 1-86239-020-7, 1998.
Nguyen, C. T., Gonnermann, H. M., Chen, Y., Huber, C., Maiorano, A. A., Gouldstone, A., and Dufek, J.: Film drainage and the lifetime of bubbles, Geochem. Geophys. Geosyst., 14, 3616–3631, https://doi.org/10.1002/ggge.20198, 2013.
Ochs, F. A. and Lange, A. R.: The density of hydrous magmatic liquids, Science, 283, 1314–1317, https://doi.org/10.1126/science.283.5406.1314, 1999.
Ohashi, M., Maruishi, T., and Toramaru, A.: Coalescence of growing bubbles in highly viscous liquids, Geochem. Geophys. Geosyst., 23, e2022GC010618, https://doi.org/10.1029/2022GC010618, 2022.
Preuss, O., Marxer, H., Ulmer, S., Wolf, J., and Nowak, M.: Degassing of hydrous trachytic Campi Flegrei and phonolitic Vesuvius melts: Experimental limitations and chances to study homogeneous bubble nucleation, Am. Mineral., 101, 859–875, https://doi.org/10.2138/am-2016-5480, 2016.
Proussevitch, A. A., Sahagian, D. L., and Kutolin, V. A.: Stability of foams in silicate melts, J. Volcanol. Geoth. Res., 59, 161–178, https://doi.org/10.1016/0377-0273(93)90084-5, 1993.
Ryan, A. G., Russel, J. K., Nichols, A. R. L., Hess, K. U., and Porritt, L. A.: Experiments and models on H2O retrograde solubility in volcanic systems, Am. Mineral., 100, 774–786, https://doi.org/10.2138/am-2015-5030, 2015.
Saar, M. and Manga, M.: Permeability-porosity relationship in vesicular basalts, Geophys. Res. Lett., 26, 111–114, https://doi.org/10.1029/1998GL900256, 1999.
Sahagian, D. and Carley, T. L.: Explosive volcanic eruptions and spinodal decomposition: a different approach to deciphering the tiny bubble paradox, Geochem. Geophys. Geosyst., 21, e2019GC008898, https://doi.org/10.1029/2019GC008898, 2020.
Sahagian, D. L., Anderson, A. T., and Ward, B.: Bubble coalescence in basalt flows; comparison of a numerical model with natural examples, Bull. Volcanol., 52, 49–56, https://doi.org/10.1007/BF00641386, 1989.
Sahimi, M.: Applications of percolation theory, London Taylor and Francis, ISBN 0-203-22153-2, https://doi.org/10.1201/9781482272444, 1994.
Schmidt, B. C. and Behrens, H.: Water solubility in phonolite melts: Influence of melt composition and temperature, Chem. Geol., 256, 259–268, https://doi.org/10.1016/j.chemgeo.2008.06.043, 2008.
Schmidt, B. C., Blum-Oeste, N., and Flagmeier, J.: Water diffusion in phonolite melts, Geochim. Cosmochim. Ac., 107, 220–230, https://doi.org/10.1016/j.gca.2012.12.044, 2013.
Shea, T.: Bubble nucleation in magmas: a dominantly heterogeneous process?, J. Volcanol. Geotherm. Res., 343, 155–170, https://doi.org/10.1016/j.jvolgeores.2017.06.025, 2017.
Sparks, R. S. J.: The dynamics of bubble formation and growth in magmas, J. Volcanol. Geoth. Res., 3, 1–37, https://doi.org/10.1016/0377-0273(78)90002-1, 1978.
Sparks, R. S. J., Barclay, J., Jaupart, C., Mader, H. M., and Phillips, J. C.: Chapter 11a. PHYSICAL ASPECTS OF MAGMA DEGASSING I. Experimental and theoretical constraints on vesiculation,Volatiles in Magmas, De Gruyter, Holloway, Berlin, Boston, 1994, 413–446. https://doi.org/10.1515/9781501509674-017, 1994.
Toramaru, A.: Formation of propagation pattern in two-phase flow systems with application to volcanic eruptions, Geophys. J., 95, 613–623, https://doi.org/10.1111/j.1365-246X.1988.tb06707.x, 1988.
Toramaru, A.: BND (bubble number density) decompression rate meter for explosive volcanic eruptions, J. Volcanol. Geoth. Res., 154, 303–316, https://doi.org/10.1016/j.jvolgeores.2006.03.027, 2006.
Wilson, L., Sparks, R. S. J., and Walker, G. P. L.: Explosive volcanic eruptions – IV. The control of magma properties and conduit geometry on eruption column behaviour, Geophys. J. Int., 63, 117–148, https://doi.org/10.1111/j.1365-246x.1980.tb02613.x, 1980.
- Abstract
- Introduction
- Experimental and analytical techniques
- Results
- Discussion
- Implications for volcanic eruptions
- Appendix A
- Appendix B: Description of the experiments in Fig. 7
- Data availability
- Author contributions
- Competing interests
- Disclaimer
- Special issue statement
- Acknowledgements
- Financial support
- Review statement
- References
- Supplement