the Creative Commons Attribution 4.0 License.
the Creative Commons Attribution 4.0 License.
 | 20 May 2025
H and D ∕ H analysis in olivine and wadsleyite with a multi-analytical approach combining Raman spectroscopy and ion and nuclear probes
Adrien Gautier
Nathalie Bolfan-Casanova
Bertrand Moine
Hélène Bureau
Hicham Khodja
Anthony C. Withers
Laurette Piani
The most abundant mineral in the upper mantle, olivine, is described as nominally anhydrous, while its high-pressure polymorph, wadsleyite, can contain up to 3 % H2O by weight. Here we focus on the quantification of total H2O content, dissolved as hydroxyl (OH), as well as hydrogen isotopic composition, i.e. ratios, in olivine and wadsleyite using a multi-instrument approach. Our aim is to establish a calibration procedure that allows accurate quantification of the hydrogen content and ratios of D-doped experimental samples using Raman spectroscopy, as confirmed by secondary-ion mass spectrometry (SIMS). Olivine and wadsleyite samples were synthesized under hydrothermal conditions at high pressure and doped with deuterium. Olivine and wadsleyite reference materials that were previously characterized by both Fourier-transform infrared (FTIR) spectroscopy and elastic recoil detection analysis (ERDA) were used to calibrate the measurement of water concentrations in the samples using both Raman spectroscopy and SIMS. D-doped olivine reference materials were characterized by ERDA (which is a point beam technique with the advantage of being an absolute quantification method) to find their ratio and used to determine the instrument mass fractionation of H isotopes with the ion probe. Then we compared the ratios determined by SIMS to the intensity ratio determined by Raman spectroscopy for three wadsleyite samples, finding a conversion factor of 0.85 (error of ∼2 %). After correction of the instrument response, we find that the Raman scattering cross-section (K) of OH is slightly lower than that of OD; still is in agreement with previous studies. ratios in doped samples can therefore be determined using Raman spectroscopy, which is a more accessible technique than SIMS, with a detection limit of 90±10 ppm wt for both D2O and H2O.
- Article
(3932 KB) - Full-text XML
- BibTeX
- EndNote


Olivine, (Mg,Fe)2SiO4, is the most abundant phase in the upper mantle and is known to contain hydrogen in trace amounts (Bell and Rossman, 1992; Demouchy and Bolfan-Casanova, 2016). The mineralogical transformation of olivine into its high-pressure phase, wadsleyite, at 410 km in depth marks the beginning of the transition zone, which could be an important reservoir of water in the mantle (Bercovici and Karato, 2003; Andrault and Bolfan-Casanova, 2022). The high-pressure polymorphs of olivine, wadsleyite and ringwoodite, have significant H2O storage capacity (Inoue et al., 1995; Ohtani et al., 2001; Demouchy et al., 2005; Pearson et al., 2014). Indeed, wadsleyite can store up to 3.2 % by weight of H2O in its structure (note that H is expressed as the equivalent of H2O in weight percent or in parts per million by weight independently of its speciation). Such water has been shown to be incorporated into the structure of nominally anhydrous minerals (NAMs) of the mantle, mainly as OH (Bell and Rossman, 1992; Demouchy and Bolfan-Casanova, 2016; Keppler and Smyth, 2006), even if some molecular hydrogen, H2, has been observed recently (Yang, 2016; Moine et al., 2020). Fourier transform infrared (FTIR) spectroscopy has traditionally been used to quantify OH in minerals (Libowitzky and Rossman, 1996), and more recently, Raman spectroscopy has been adapted to quantify the OH contents of olivine and wadsleyite (Bolfan-Casanova et al., 2014; Martinek and Bolfan-Casanova, 2021; Bolfan-Casanova et al., 2023). On the other hand, secondary-ion mass spectrometry (SIMS) (Aubaud et al., 2004; Mosenfelder et al., 2011; Piani et al., 2020) and elastic recoil detection analysis (ERDA) (Raepsaet et al., 2008; Bureau et al., 2009; Withers et al., 2012; Bolfan-Casanova et al., 2018) are complementary methods that allow quantification of the bulk H2O concentrations, i.e. total hydrogen contents in minerals.
So far, the deuterium–hydrogen isotopic fractionation between olivine and wadsleyite has never been measured. However, Bell and Ihinger (2000) predicted significant fractionation, nearly 30 ‰, between these two minerals under relatively low-temperature conditions by comparing ratios in nominally anhydrous mantle minerals and in hydrous melt or fluids as a function of their OH stretching vibration, as determined by infrared spectroscopy (Dobson et al., 1989). If we want to quantify the D–H fractionation between olivine and wadsleyite coexisting in isotopic equilibrium, we first need to synthesize such samples because natural samples of wadsleyite are not available. Then, we need to be able to measure the ratio in each of these two phases. While secondary-ion mass spectrometry is a very sensitive method for the measurement of the isotopic composition of bulk hydrogen in minerals in situ, it is not widely accessible. On the other hand, Raman spectroscopy is a relatively widespread and non-destructive technique with a high spatial resolution, and, in addition, it is site-specific and allows measurement of the speciation of hydrogen in NAMs.
Concerning spectroscopic techniques, it is worthwhile to compare their advantages and disadvantages in a few words. (i) FTIR spectroscopy is generally used in transmission mode, and the Beer–Lambert law can be used to quantify the species of interest. For polymineralic samples, it is especially problematic when phases overlap in the sample volume analysed, leading to pollution of the spectra of individual phases. It follows that the size of grains and the thickness of the thin section are correlated. Raman spectroscopy can also be used in transmission mode, but here, we use it in reflectance mode and, combined with a 1 µm beam, it is a good alternative to obtain spectra of very small grains without having artefacts from the neighbouring phases. (ii) One advantage of transmission FTIR spectroscopy is that we know the volume of the sample that is analysed when we measure doubly polished thin sections of known thicknesses, while with Raman spectroscopy, the volume of sample analysed is not determined. Still, it is possible to analyse water-rich minerals such as wadsleyite with Raman spectroscopy without having to produce very thin doubly polished sections as is required for FTIR, which often puts the sample in danger: for highly absorbent material, the laser power of the Raman spectrometer just needs to be lowered. (iii) Another advantage of FTIR spectroscopy is that the intensity of the bands only depends on the thickness and on the absorptivity of the band, the extinction coefficient of the material of interest, according to the Beer–Lambert law. In contrast, the Raman scattering cross-sections are seldom known and depend a lot on the analytical setup. Determining these cross-sections is the aim of this study.
The sensitivity of Raman spectroscopy is lower than that of SIMS and does not enable us to measure natural isotope proportions because the natural abundance of 2H vs. 1H is too low (). Thus, the synthetic samples need to be doped with deuterium during high-pressure hydrothermal annealing. Finally, to be able to quantify the isotopic composition of hydrogen in NAMs with Raman spectroscopy, we first need to validate this method using an established technique such as SIMS.
We present a protocol aimed at validating measured ratios in doped synthetic samples using Raman spectroscopy and SIMS. These samples were doped with D2O (heavy water or deuterium oxide) to enhance the intensity of the Raman signal for the otherwise-less-abundant OD groups. Quantification of H and D concentrations in the minerals of interest is made possible by calibration of the intensity or counts using reference materials for H and D. The samples and reference materials selected in this study were synthesized under high pressure. Indeed, since the matrix matching the reference material required for Raman quantification of OD did not exist, we first had to synthesize and characterize it. For this purpose, we used a third technique, ERDA, which is an absolute method enabling us to quantify the ratios of our reference materials, here (Mg,Fe)2SiO4, olivine.
Table 1Reference olivine and wadsleyite materials used for the Raman spectroscopy and SIMS calibrations. The errors in the tables and the error bars in the figures are 1σ. The reference materials were synthesized using a multi-anvil press.
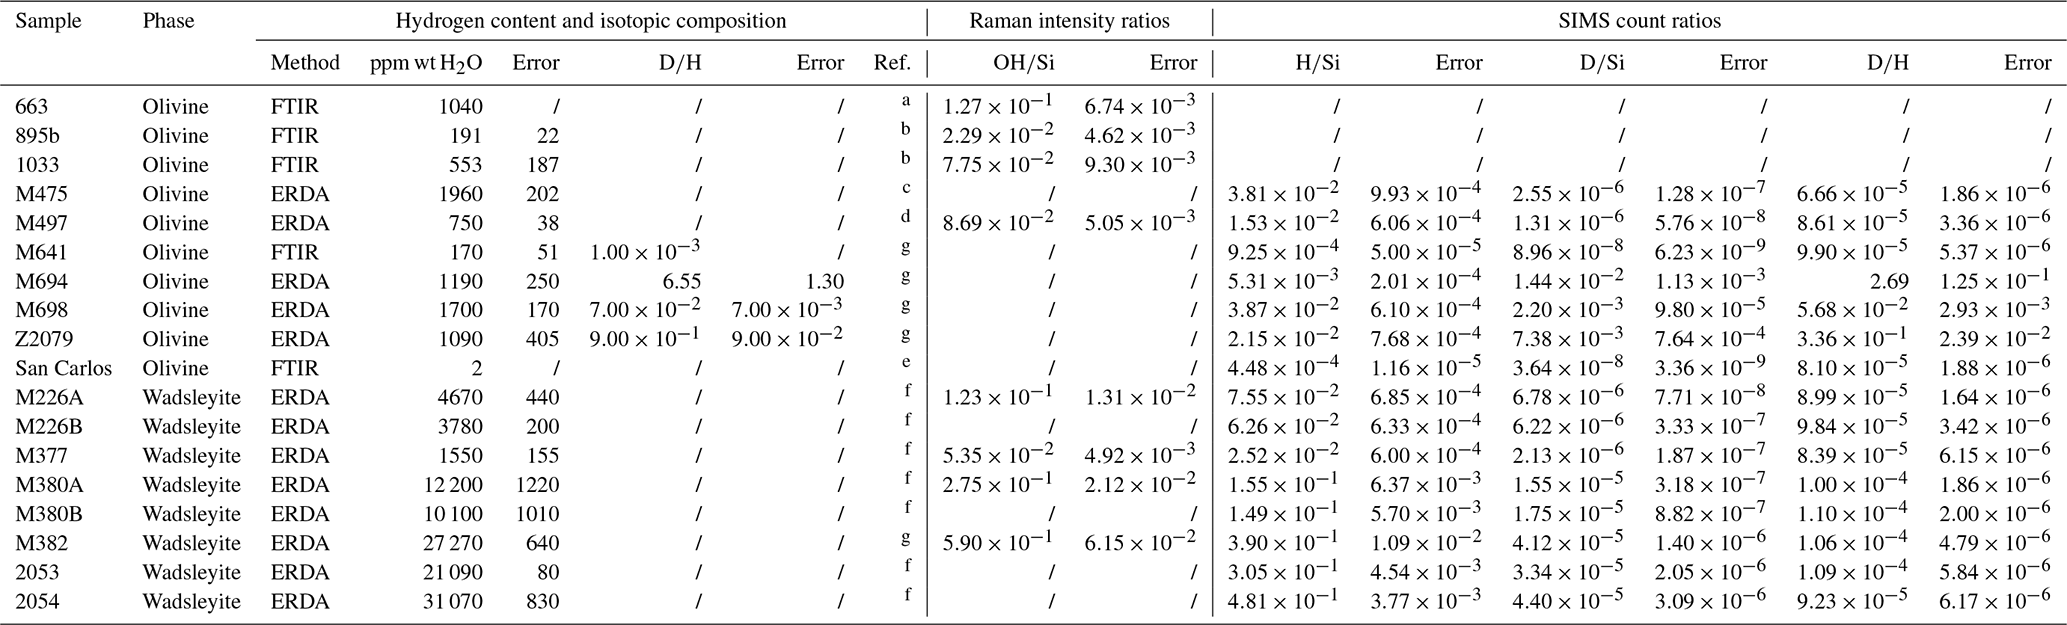
The references are a Bali et al. (2008), b Férot and Bolfan-Casanova (2012), c Withers et al. (2012), d Martinek and Bolfan-Casanova (2021), e IAEA database, f Bolfan-Casanova et al. (2018), and g determined or redetermined in this study.
2.1 Sample set
The olivine and wadsleyite reference materials selected for the Raman spectroscopy and SIMS working curves or calibrations were synthesized at high pressure and high temperature under fluid-saturated conditions in a multi-anvil press. These conditions are required to dissolve substantial amounts of hydroxyl in olivine and to stabilize wadsleyite. The reference materials for O1H and O2H, or OD, quantification are reported in Table 1. The olivines were synthesized at pressures of 5 to 14 GPa and temperatures of 1000–1400 °C (Bali et al., 2008; Férot and Bolfan-Casanova, 2012; Martinek and Bolfan-Casanova, 2021; Withers et al., 2012), and their hydroxyl contents (reported as water contents) were measured using FTIR spectroscopy using the extinction coefficient of Withers et al. (2012). The olivines used as reference materials for the measurement of ratios were synthesized at 12 GPa and 1000 to 1200 °C using D2O as the source of the fluid and varying the ratio in the fluid to vary the ratio of the reference olivines. These reference materials were characterized for their bulk H2O content and, for the first time, for their ratio using ERDA. The wadsleyites were synthesized at 15–21 GPa and 1100–1700 °C, and their water contents were characterized using ERDA because they are too rich in H2O to be measured with FTIR spectroscopy (Bolfan-Casanova et al., 2018).
Table 2Reference glass materials used for the SIMS measurements. The errors are 1σ.

The references are from a Bindeman et al. (2012) and Métrich and Deloule (1994) (Table 2 in their supplement) and b Bouvier et al. (2010).
For the SIMS measurements, we used the reference materials above as well as the reference glasses of the SIMS facility (see Table 2). These are the basaltic glasses M98-47963 and M98-Etna-0, whose water contents were estimated by elemental analyser isotope ratio mass spectrometry (EA-IRMS) (Bindeman et al., 2012) and by Karl Fisher titration (KFT) (Métrich and Deloule, 2014; see Table 2 in their supplement; Bouvier et al., 2010).
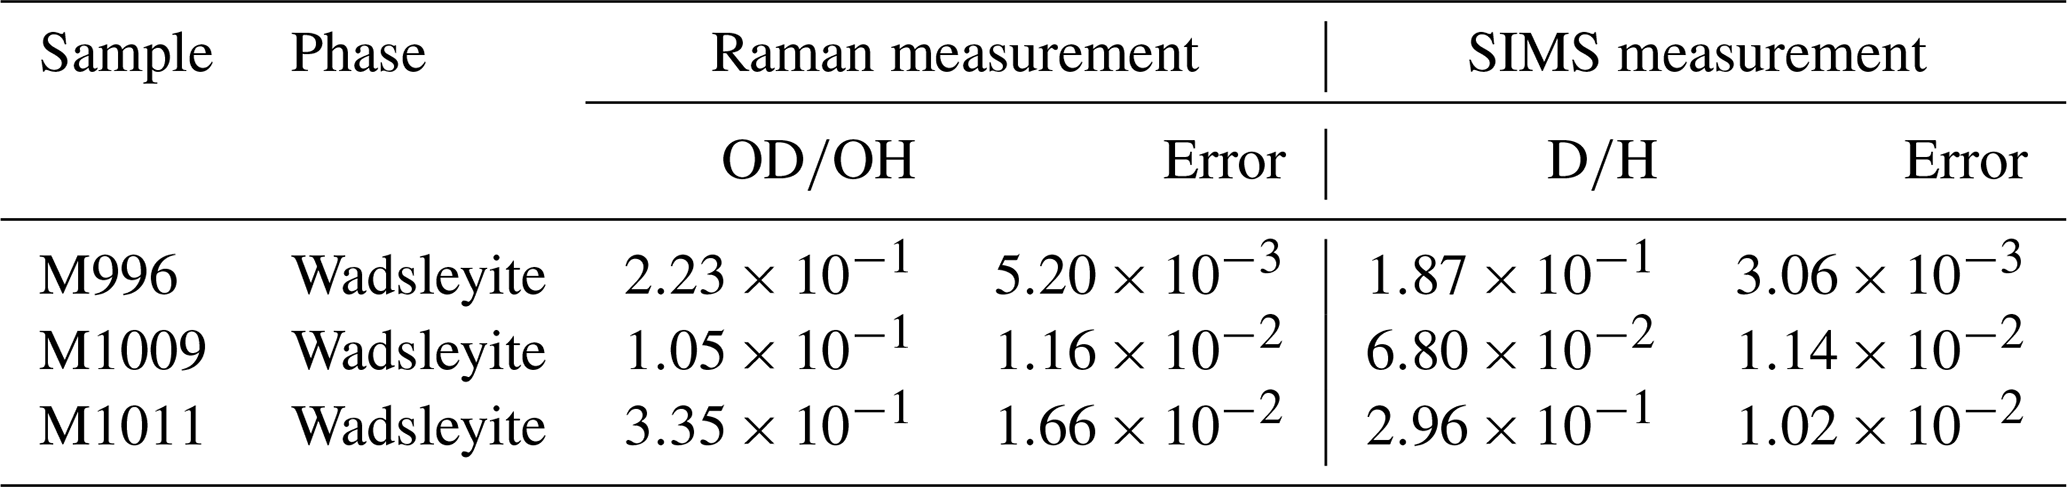
Table 3Wadsleyite samples used for comparison of Raman spectroscopy and SIMS analyses. The errors are 1σ.
The quantification method for OH and OD using both SIMS and Raman spectroscopy was then tested on a set of wadsleyites (Table 3) synthesized at 14 GPa and 780–1060 °C using a fluid doped with D2O. The starting material consisted of Kilbourne Hole olivine (Fo90) and enstatite (En90) powder. After recovery, the samples were checked for fluid saturation and mirror polished, embedded in indium to ensure a low-hydrogen blank in SIMS, and then metallized with carbon in the case of ERDA analyses or gold in the case of SIMS analyses (10–30 nm layer for ERDA and 70 nm for SIMS).
2.2 Raman spectroscopy
The Raman spectroscopy analyses were performed on a Renishaw inVia confocal Raman micro-spectrometer at Laboratoire Magmas et Volcans in Clermont-Ferrand (France). It is equipped with a 532 nm diode-pumped solid-state (DPSS) laser, giving an output power of 200 mW and a 1024×256 pixel charge-coupled device (CCD) detector (cooled by a Peltier module) with a slit aperture of 65 µm (in standard confocality), and it is coupled to a Leica DM 2500M optical microscope. A 1200 grooves mm−1 grating was used for the analyses. The spectral resolution ranges from 1.3 cm−1 (at 100 cm−1) to 0.73 cm−1 (at 3700 cm−1). All spectra were acquired in polarized light without an analyser, using the ×100 objective (numerical aperture 0.85) of the microscope and under standard confocality. Before each analysis session, calibration of the spectrometer was performed based on the Si peak located at 520.5 cm−1. In addition, the measurement of the laser power enables the intensity data to be normalized to 1 mW. The quantification of OH content is based on the integrated intensity of the OH bands normalized to the integrated intensity of the silicate bands (Bolfan-Casanova et al., 2014; Martinek and Bolfan-Casanova, 2021). Two different analysis windows were used to observe the silicate, or Si, and OH vibrations centred at 620 and 3370 cm−1, respectively (Fig. 1). A third scan window centred at 2900 cm−1 was used to measure the OD Raman peaks.
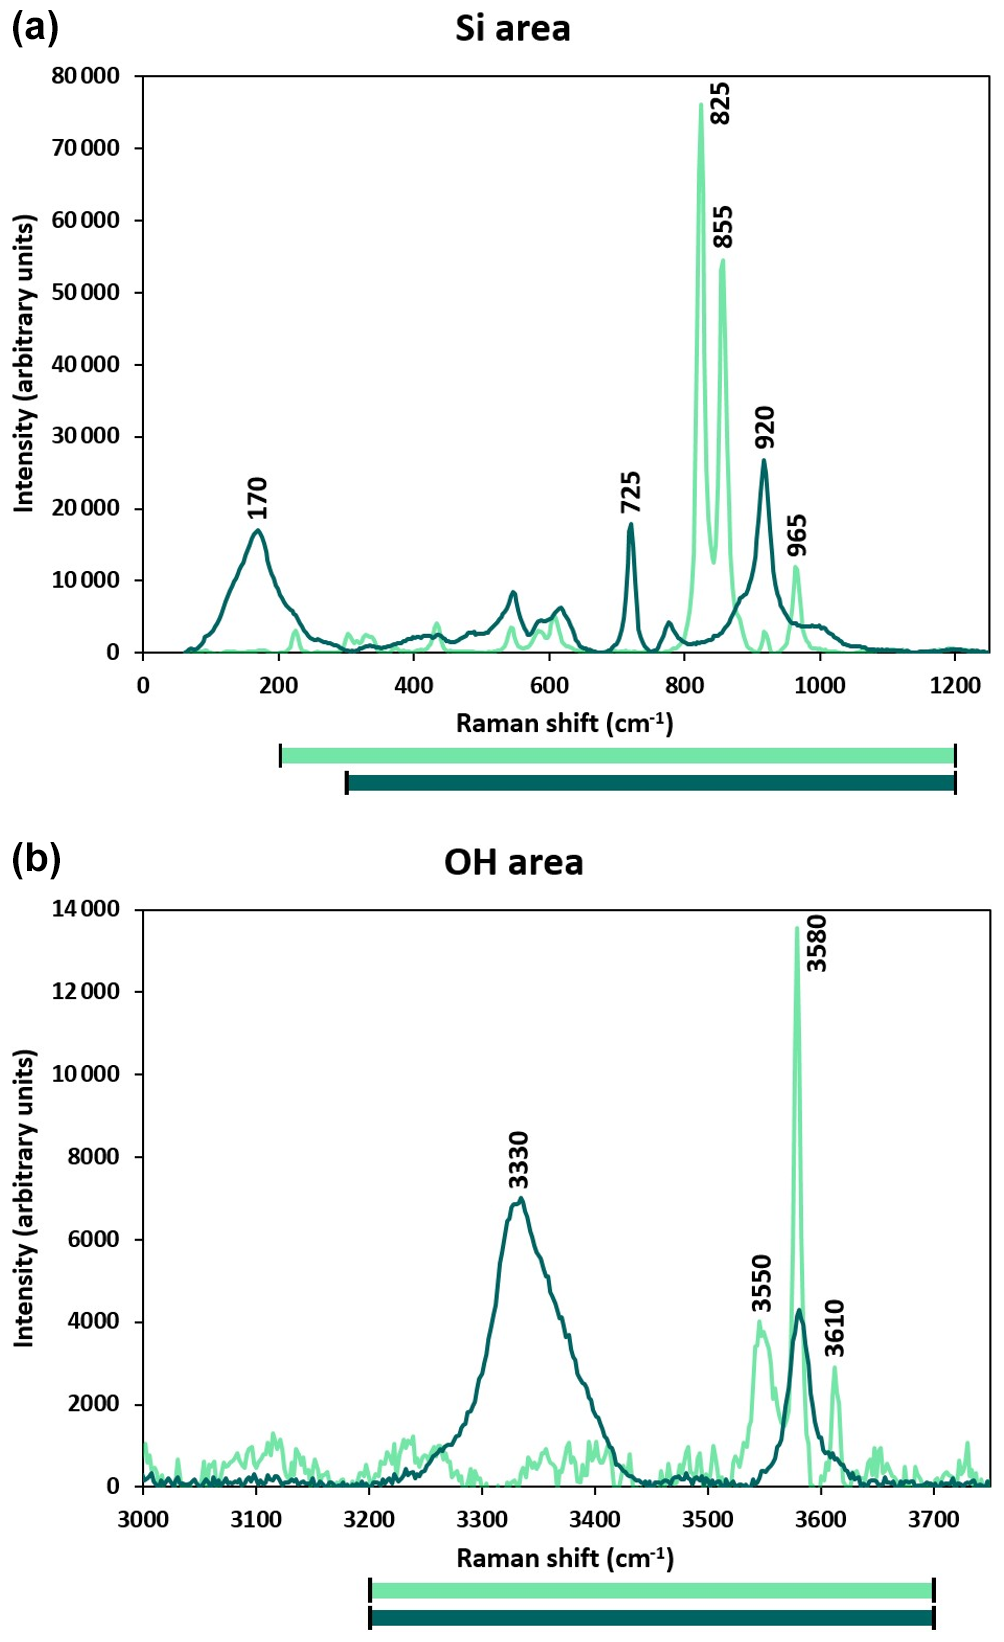
Figure 1Average Raman spectra of olivine M663 (green) and wadsleyite M377 (dark blue) (a) in the silicate, Si, area and (b) in the OH area (for the reference materials for this study, see Table 1). The integration windows for these two areas are shown below each of the graphs, in green for olivine and in dark blue for wadsleyite. The spectra shown are corrected for the baseline following a poly-linear treatment for the Si area of olivine and wadsleyite. For the OH area spectra, the baseline is a cubic polynomial for both minerals.
The Raman spectra of olivine and wadsleyite in the silicate area are shown in Fig. 1a. Two separate peaks at 725 and 920 cm−1 are characteristic of the wadsleyite structure. A doublet located at 825 and 855 cm−1 is characteristic of olivine. The range for integration of the intensity is 200–1200 cm−1 for olivine and 300–1200 cm−1 for wadsleyite. A strong peak at about 170 cm−1 is present in wadsleyite containing FeO in its structure. This band, which is related to the FeO content of the mineral, is not included in the integration of the Si Raman area (Fig. 1a). The presence of an H2O component in the form of OH in olivine and wadsleyite is shown by a set of peaks in the range of 3200–3700 cm−1 (Fig. 1b), with two characteristic OH peaks located at 3330 and 3580 cm−1 in the case of wadsleyite. A major group of bands is located at 3550 and 3580 and occasionally at 3610 cm−1 in the case of olivine. The wavenumber ranges used for integration of the intensities of the OD and OH band were 2330–2740 and 3200–3700 cm−1, respectively, and were the same for both minerals.
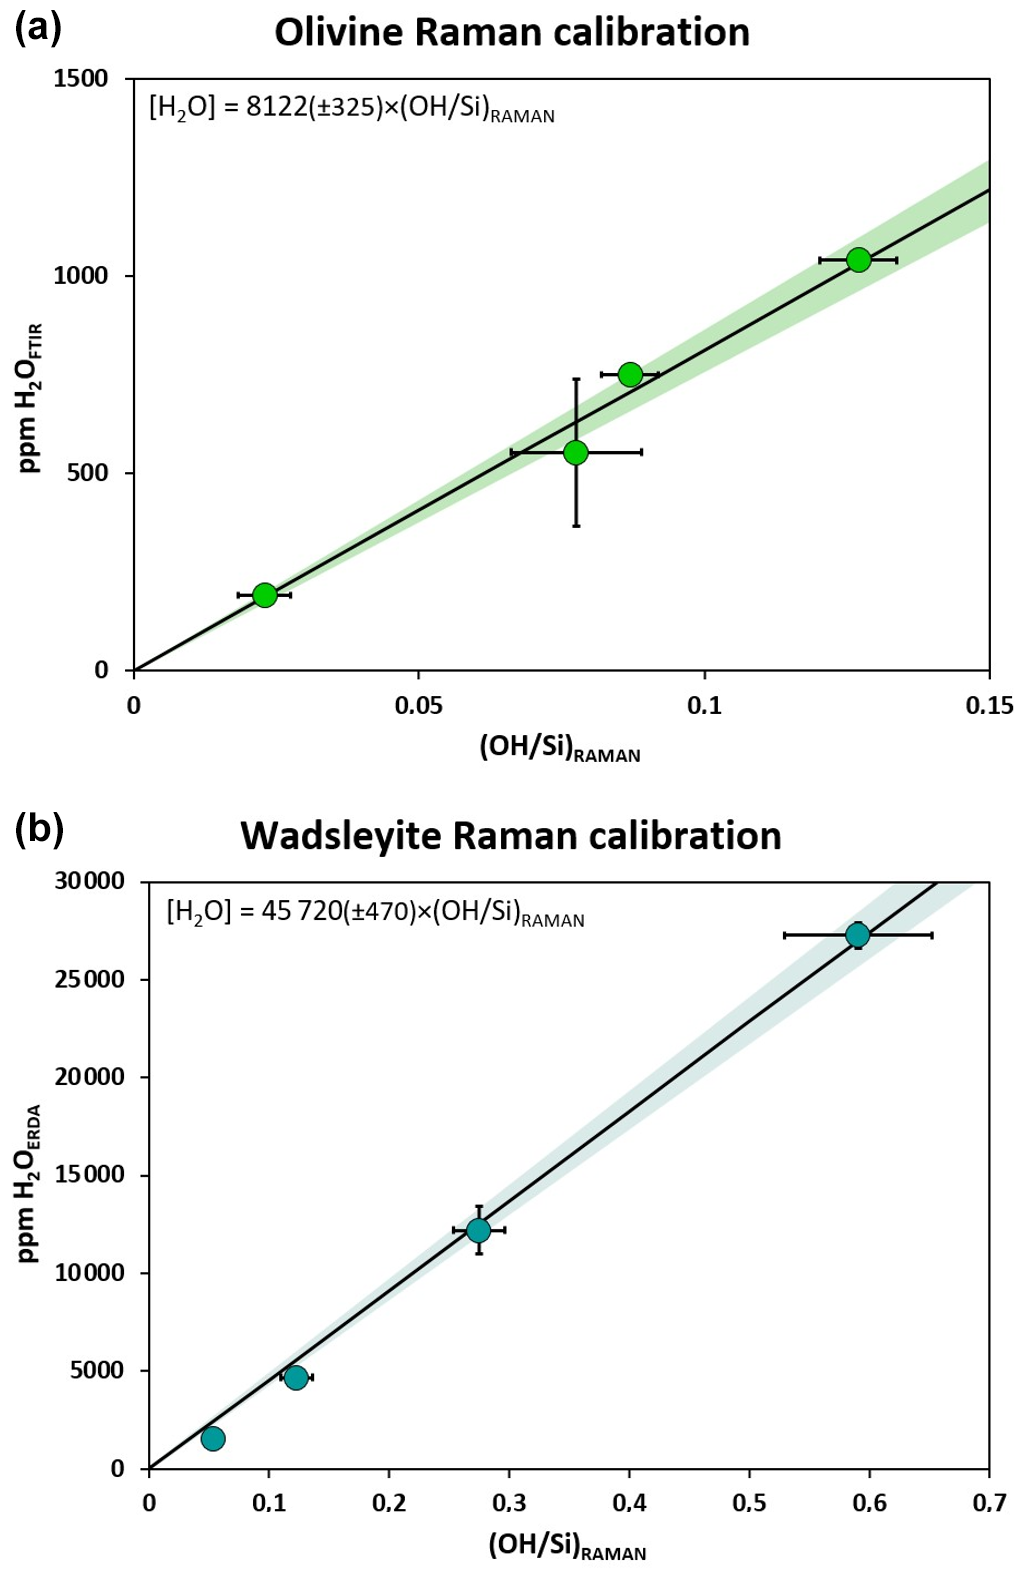
Figure 2Calibration lines for the water ([H2O] in ppm wt) quantification by Raman spectroscopy for olivine (a) and iron-bearing wadsleyite (b) established on reference materials measured by FTIR and ERDA, respectively. The error applied to each sample corresponds to 1 sigma (1σ) and is calculated as the standard deviation of all measurements performed on that sample, which often represents anisotropy when the technique applied is a spectroscopic method. The coloured areas represent the confidence intervals of the calibration lines.
For analysis of olivine and wadsleyite, the laser beam power used was 10 %. The acquisition time was 5×10 s for the Si window and was 20 s repeated five times for the windows centred on OD and OH. A daily monitoring of the laser power was performed on hydrated basaltic glass (0.5 wt % H2O; Schiavi et al., 2018) at the beginning and end of the session. The laser power and consequent intensity drifts were therefore corrected in each analysis session (see Eq. 1), where the daily intensity ratio of the glass was normalized to the average intensity ratio of the glass from all analysis sessions, . This daily normalization of the intensity ratio of the hydrated glass was applied to the average intensity ratio of the sample measured during the same session, :
Once normalized, the intensity ratio of the reference material was used to establish a correlation with the H2O content, hereafter referred to as the Raman calibration (see Fig. 2). In order to obtain reproducible statistics, at least eight grains of a given phase were analysed. Moreover, as the minerals analysed are anisotropic, the intensity of scattered light depends on the orientation of the mineral, and therefore each analysis point on the olivine samples was carried out using three different orientations (0, 45, and 90°) by rotating the sample in the plane perpendicular to the incoming beam. Because the spectra of wadsleyite display less anisotropy (see Martinek and Bolfan-Casanova, 2021), we analysed only two orientations per grain, 0 and 90°. The grains in the samples analysed are usually less than 100 µm in diameter. It was therefore impractical to orient them. Therefore, we average the Si and OH spectra recorded on each grain, and then we average these over all the randomly oriented grains to sample the absolute intensities of Si and OH. Figure A1 shows the Raman spectra in the Si and OH areas as measured for three orientations of the same grain of olivine, as well as the averaged spectrum.
2.3 Elastic recoil detection analysis (ERDA)
ERDA analysis was performed using the nuclear microprobe of the Laboratoire d'Etude des Eléments Légers, CEA, Saclay, France (Khodja et al., 2001; Raepsaet et al., 2008). The analytical setup is described in detail in Bureau et al. (2009). This technique has been successfully used in several recent studies to determine the H content of NAMs (Withers et al., 2012; Novella et al., 2014; Bolfan-Casanova et al., 2018). A 2.8 MeV 4He+ beam was produced by a single-stage Van de Graaff accelerator and focused on a 3 µm × 3 µm or 2 µm × 2 µm surface using quadrupole magnetic lenses. The analysis then utilizes three detectors: an X-ray detector to record particle-induced X-rays, an annular detector to record Rutherford backscattered (RBS) particles, and an ERDA detector to record the H atoms ejected from the sample through elastic collisions with the alpha particles. The samples and reference materials may be tilted such that the polished surface is oriented either perpendicular to the beam in the standard Rutherford backscattering analysis geometry or at a grazing angle of 15° from the incident beam for the ERDA configuration, as the dedicated detector is located at a 30° angle relative to the incident beam direction. The beam size on the sample surface was 12 µm × 3 µm in the ERDA configuration, and the beam was passed over the sample surface to produce compositional maps. Forward-scattered He particles were prevented from reaching the ERDA detector by placing a 15 µm Al foil in front of the detector. At the beginning of each session, a set of reference materials were analysed to determine the RBS and ERDA solid angles (ΩRBS and ΩERDA). Standards such as Al2O3, FeS2, SiO2, CaCO3, Kapton, and STR10 (which is a silicate glass containing 4750 ppm wt H2O as measured by FTIR) are used to calibrate the RBS and ERDA solid angles. The SIMNRA programme (Mayer, 1999) was used to model the RBS and ERDA energy spectra. The average solid angle (ΩRBS) thus determined was 0.050 mSr. The ERDA solid angle was ΩERDA=0.014 mSr. In the ERDA geometry, the RBS spectra were used to monitor charge.
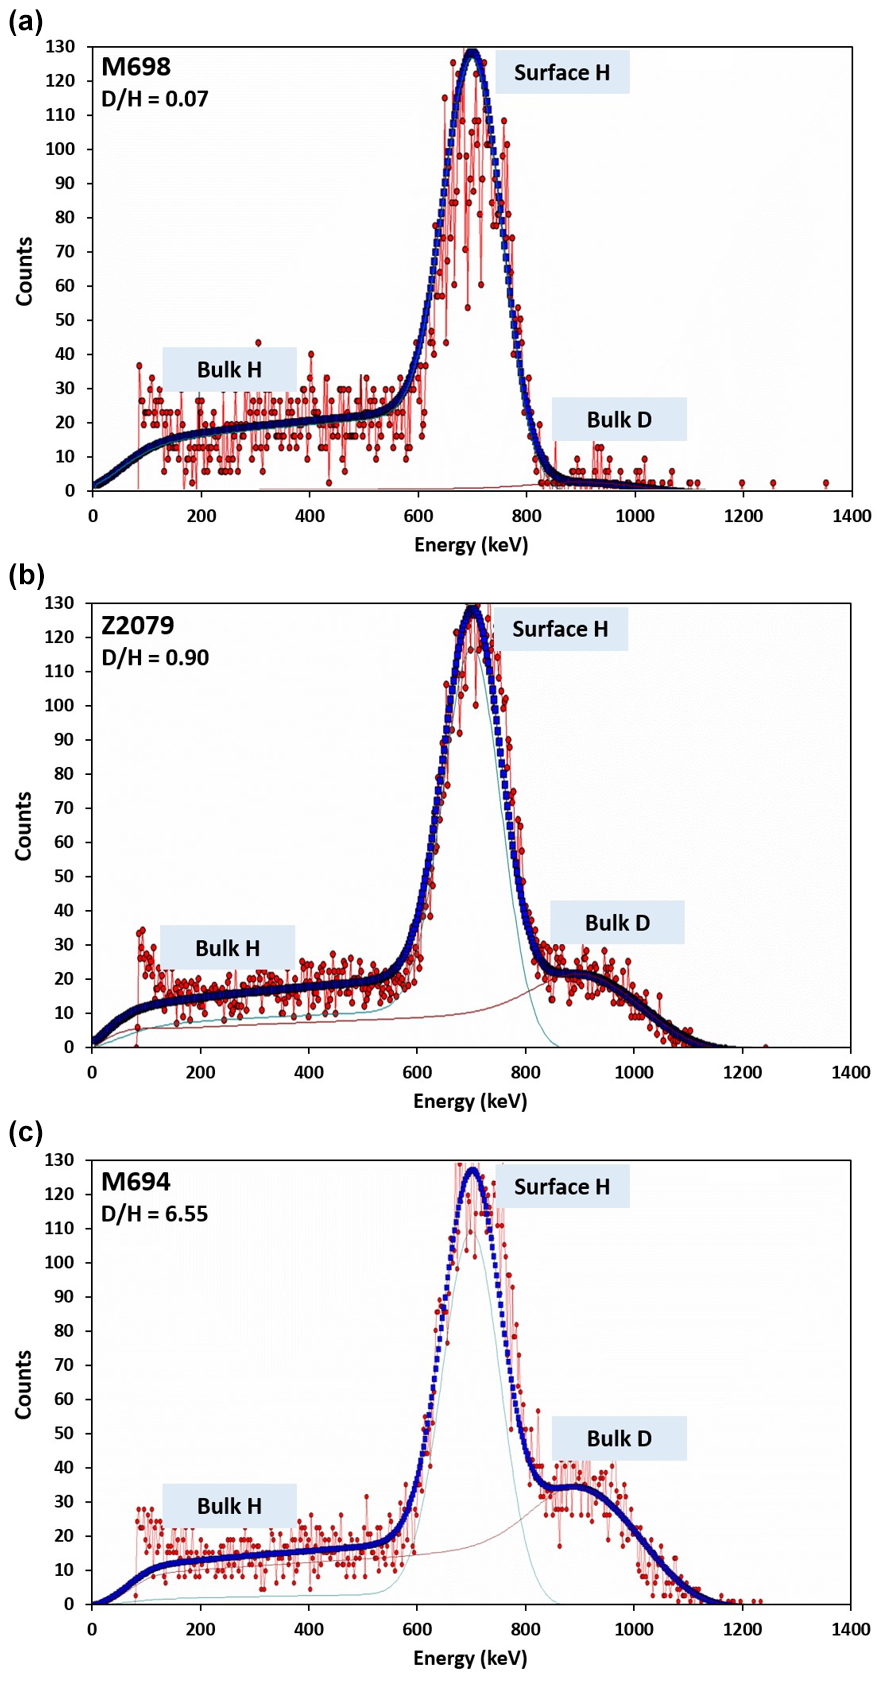
Figure 3ERDA spectra of three deuterium-doped olivine samples with different ratios: (a) M698 with , (b) Z2079 with , and (c) M694 with . The large peak between 550 and 850 keV evidences the surface hydrogen. The thin blue and red lines show the calculated or fitted surface H and bulk D, respectively. The dotted thick blue line represents the simulation of the total hydrogen content including bulk D, surface H, and bulk H. values are then obtained using the ratio of bulk deuterium at high energy and bulk hydrogen at low energy.
The samples were analysed in the ERDA configuration with analysis times of 2 h. A typical 100 µm × 100 µm surface of the sample was scanned with the beam. Using the RISMIN software (Daudin et al., 2003), areas can be selected within the analysed map to avoid cracks, grain boundaries, or secondary phases. The H content of the samples was calculated by simulation of the ERDA spectra using the SIMNRA programme. The ERDA energy spectra are shown in Fig. 3. Usually, the intense signal at intermediate energy is related to H atoms from surface-adsorbed moisture, which do not experience energy loss within the sample. The energy of the incoming alpha particle decreases as the sample is penetrated, so particles that originate from within the sample arrive at the detector with correspondingly lower energy, as represented by the lower energy plateau in the ERDA spectrum. Surface pollution of the sample can therefore be easily differentiated from bulk content, and it is through simulation of the low energy plateau in the ERDA spectrum that the H content of the sample itself is calculated. Owing to the mass difference, the elastic collision of helium transfers more energy to deuterium than to hydrogen. D is therefore identified at higher energy than surface H is. The D signal is representative of the bulk D in the sample because surface D contamination by atmospheric pollution is not expected, given its low natural abundance.
2.4 Secondary ion mass spectrometry (SIMS)
Hydrogen abundance in experimental samples was measured using the Cameca IMS 1280-HR2 ion probe at the Centre de Recherches Pétrographiques et Géochimiques (CRPG) in Nancy (France) during three analytical sessions. An O− primary beam accelerated to 10 kV was used for the measurements. The vacuum in the analytical chamber was always below mbar. Prior to analyses, the samples were pre-sputtered over 5 µm × 5 µm with a 12 nA beam for 3 min to clean the sample surface and remove the adsorbed H. Then the samples were rasterized with a current of 12 nA over a 4 µm × 4 µm area for the analysis. A high-magnification mode (max area 60) and a medium-field aperture (FA 2400) were used to enhance the transmission and reduce the H contamination that would diffuse from the borders of the beam. The area analysed was additionally restricted to a 6 µm × 6 µm region in the centre of the rasterized area using an 80 % electronic gate to avoid contamination by H coming from the borders of the rasterized area. H+, D+, and 30Si+ ions were collected successively by changing the magnetic field and counted using the mono-collection electron multiplier (H+, D+) or the mono-collection Faraday cup equipped with a 1012 Ω resistor (30Si+). The mass-resolving power was set to to avoid 29SiH+ interfering with 30Si+. For each analysis, 20 cycles were collected with 2 s of counting time per cycle for H+ and 30Si+ and 20 s per cycle for D+, totalling 15 min per analysis. The statistical errors in in the D-poor terrestrial reference materials were ≤9 % (2σ standard deviation), and the reproducibility of the reference D-doped reference materials was ≤10 % (2σ). For each sample, the standard error associated with the mean value of the , , and ratios (Err) is estimated using the standard deviation and the number (NB) of points as follows:
The detection limit of water quantification was estimated using the driest material available, i.e. San Carlos olivine (≤1 ppm H2O, IAEA database). We found a blank signal equivalent to 29±2 ppm H2O using the calibration equation based on olivine reference materials (Fig. 4a). Two natural glasses were used as reference materials to set up the SIMS measurement protocol, and they agree very well with the calibration for nominally anhydrous minerals (Table 2 and Fig. 4b). After each analytical session, the samples were slightly polished to remove the gold coating, and the positions of the SIMS spots were checked using a scanning electron microscope to verify that the measurement locations were not performed on a crack or impurity (see Fig. 5).
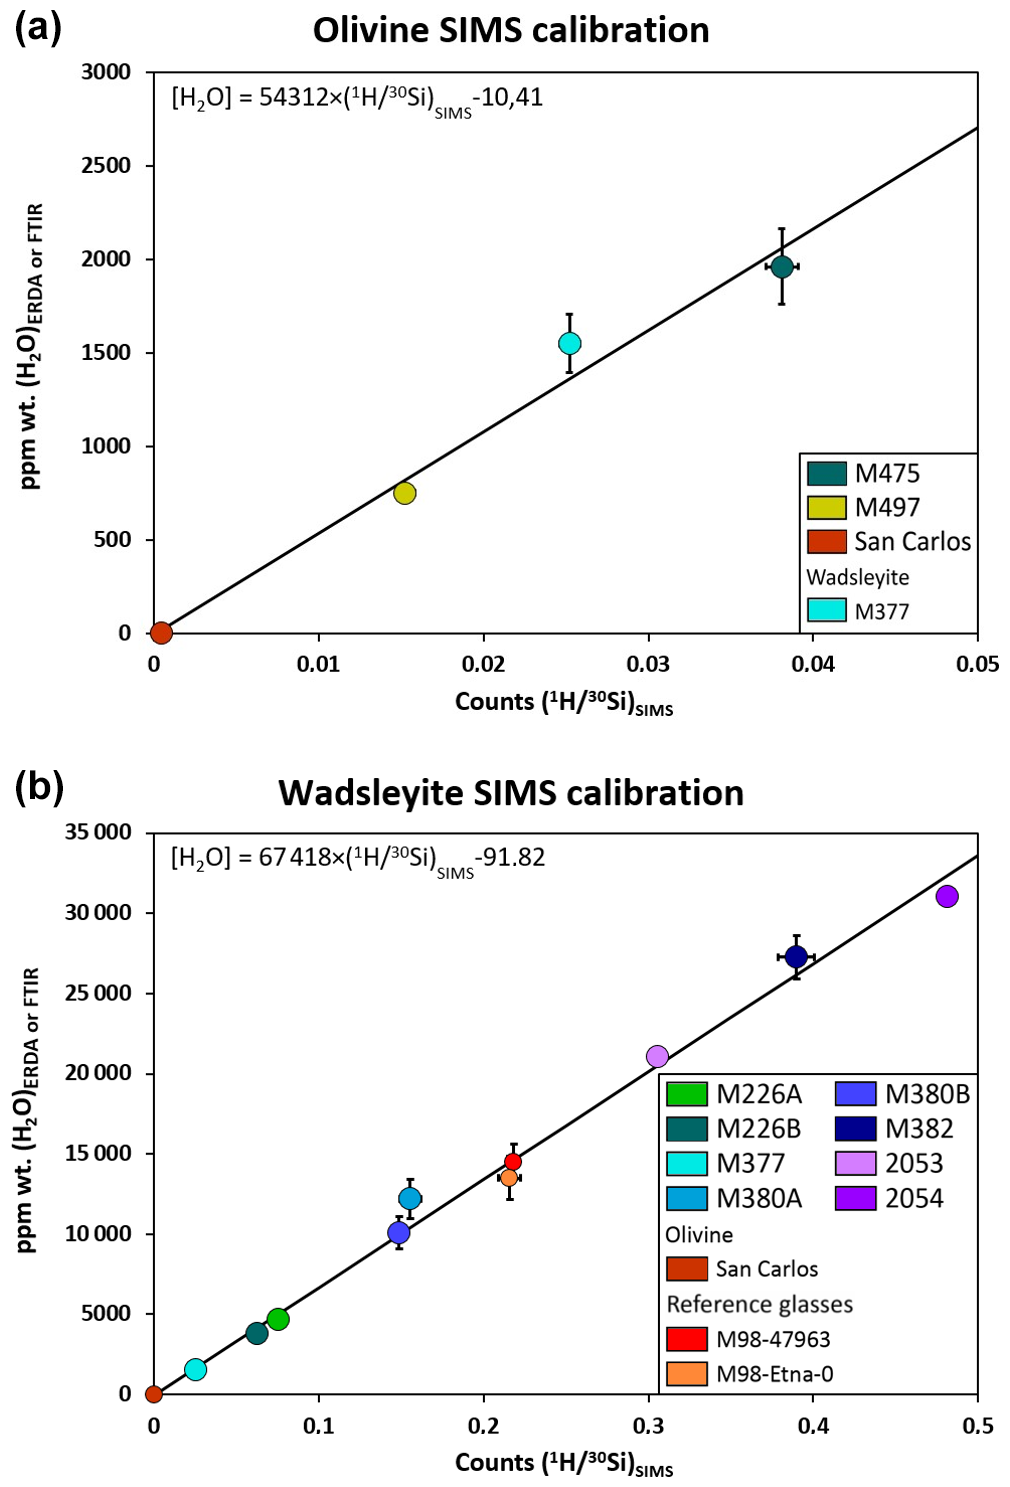
Figure 4SIMS calibration line for the quantification of total hydrogen (as wt % of H2O) in olivine (a) and in wadsleyite (b). The characterization of olivine reference materials was made with FTIR, while that of wadsleyite was performed using ERDA (see Table 1). Water concentrations (wt % of H2O) of M377 are within the concentration range of the olivine reference materials; we therefore used this sample to complete the olivine SIMS calibration.
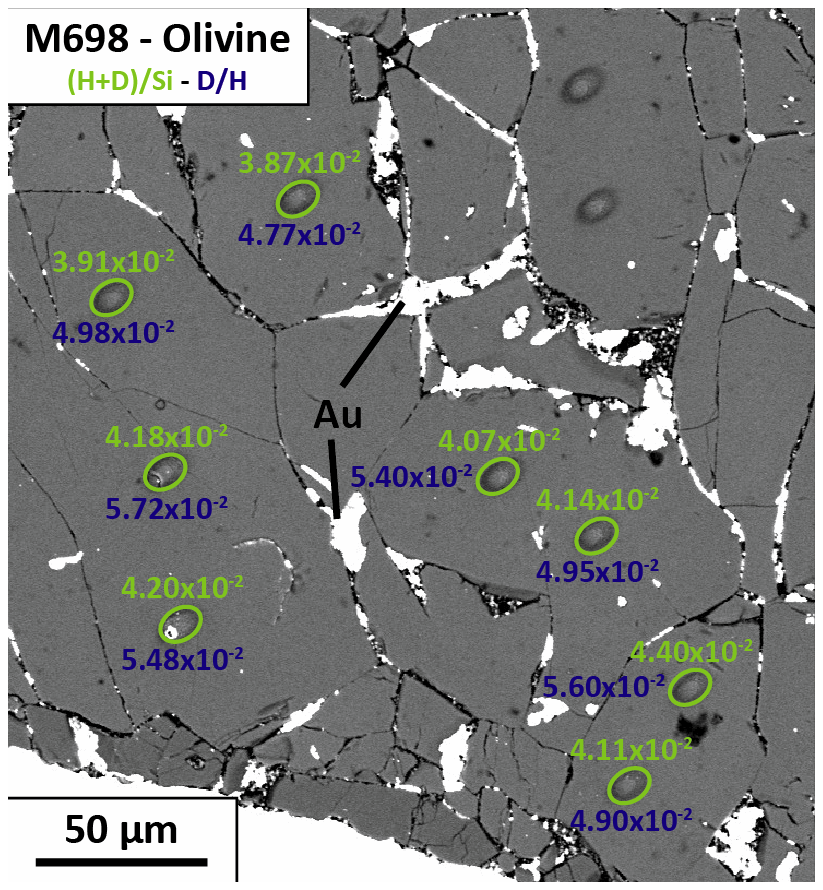
Figure 5Backscattered electron (BSE) image of the olivine reference material M698 taken after the SIMS measurements. The light-green circles show the SIMS analysis points on this olivine reference material. The green values refer to the ratios, while the dark-blue values refer to the ratios, both measured by SIMS. In this way, the correct locations of the analysis points with regard to impurities or cracks can be tested. The two pits not labelled were made during a different session. Au indicates the deposition of gold (the element used for electro-conduction) in the fractures after polishing the sample following the SIMS analysis.
3.1 Raman calibration
The calibrations of the ratio of Raman-spectroscopy-integrated intensities as a function of H2O concentration (ppm H2O) are presented in Fig. 2 for olivine and wadsleyite. The calibration line for olivine (Fig. 2a) indicates a conversion factor F, which relates the ratios to the water content (8122±325). For iron-bearing wadsleyite, the calibration line (Fig. 2b) displays a conversion factor of 45 720±470. The uncertainty is given as 1σ and corresponds to a calibration error of about 4 % for olivine and 1 % for wadsleyite. This correlation factor is not sensu stricto a Raman scattering cross-section as demonstrated below but contains similar information that allows us to convert the intensity into the concentration. Raman intensity of a scattering species, Ii, depends on the intensity of the incoming light, Io; the sample cross-section, Kv; and the concentration of the species, Ci (Long, 2002):
The above equation justifies the fact that the calibrations in Fig. 2 pass through the origin. Note that Kv includes the molar scattering parameter, spectrometer response, and self-absorption of the medium, and it is frequency dependent (Strommen and Nakamoto, 1984). Thus, unlike the extinction coefficient used in transmission infrared spectroscopy, determining Kv for a particular material depends on the measurement setup. Comparing the integrated intensities (or areas) in the OH and Si regions yields the following:
This relationship can be rewritten as
where WOH contains the information about the Raman scattering cross-section of both the OH and silicate regions. W might be used in a similar way to the extinction coefficient used in FTIR spectroscopy; however, W might change if the laser power or objective magnification is changed because these two factors influence the volume of the sample excited.
3.2 SIMS calibrations of water contents and hydrogen isotopic composition
The calibration of total water content measurement using SIMS is shown in Fig. 4 for both olivine and wadsleyite. The raw count rates of 1H are normalized to those of 30Si and are usually indicated as . The standard error in the measurement of the ratios is less than 4 % for the olivine and wadsleyite reference materials, evidencing the good reproducibility of the measurements as well as the homogeneity of the reference materials (see Table 1). The calibrations for the olivine (Fig. 4a) and wadsleyite (Fig. 4b) reference materials display very similar slopes, 54 312 vs. 67 418, indicating that polymorphism has little influence here on the efficiency of extraction of OH and Si. In addition, the compositional dependence of the calibration of water content is minimized by the normalization of the H counts to the Si counts.
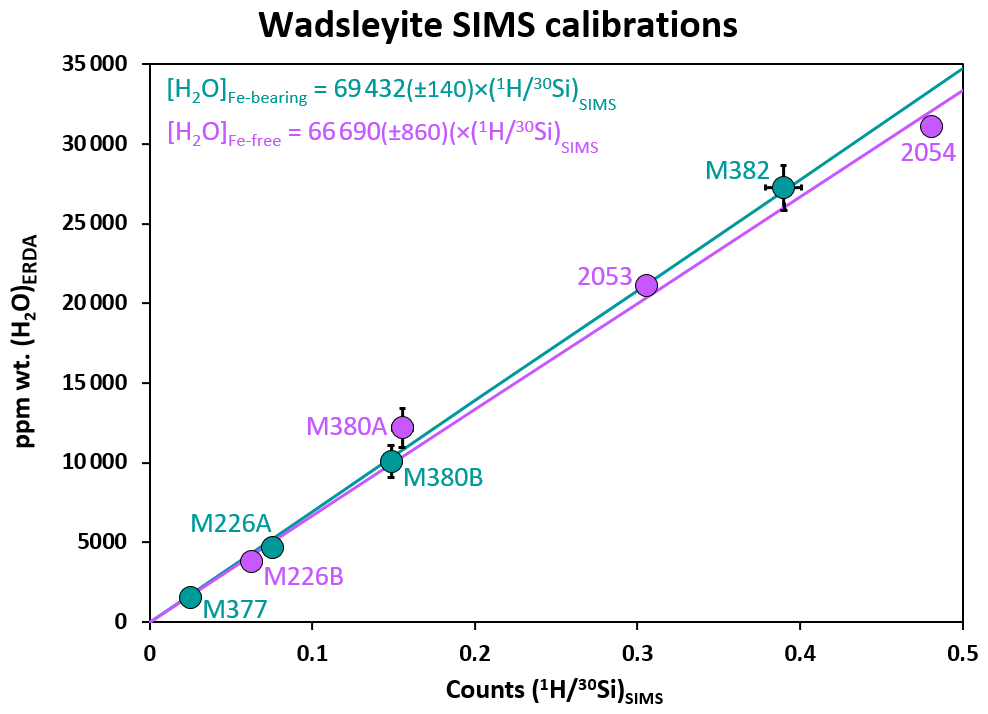
Figure 6SIMS wadsleyite calibration lines for the quantification of total hydrogen as a function of the iron content. The wadsleyite reference materials with iron are M226A, M377, M380B, and M382; those without iron are M226B, M380A, 2053, and 2054 (see Bolfan-Casanova et al., 2018). The goal here is to evaluate whether iron influences the quantification of water content.
It has been shown that the relative yields of H+ and Si+ ions vary systematically with the Fe content of hydrous minerals (e.g. Koga et al., 2003). We have investigated here the effect of iron on the quantification of water content in wadsleyite by measuring four wadsleyite references containing iron (with of 0.08 to 0.10) and four wadsleyite references containing no iron (Fig. 6). The calibration of the iron-bearing wadsleyite reference materials indicates a conversion factor, F, linking the counts to the water concentration (69 432±140 vs. 66 690±860) for the iron-free reference materials. Thus, here, the effect of Fe content on the OH / Si yield is not considered significant, perhaps due to the fact that the iron content here is low (the atomic ratio, , of the wadsleyites varies between 0.083 and 0.104).
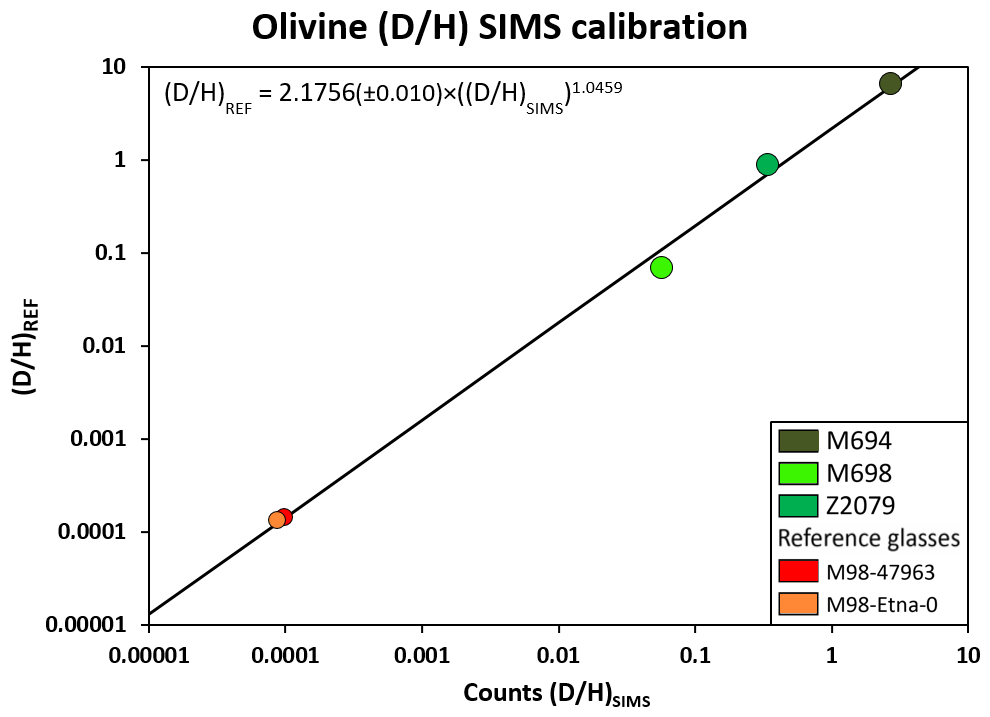
Figure 7SIMS calibration line for the quantification of instrumental mass fractionation for the ratio using olivine and glass reference materials (see Tables 1 and 2). Due to the data range of the reference materials, the measurements are presented using a logarithmic scale. Error bars are smaller than the size of the symbols.
In addition, due to their lower binding energy, light isotopes are preferentially transmitted at the expense of heavy isotopes (Slodzian, 1980). This reflection of the relative ion yield takes into account effects such as the ionization potential of the different elements being measured. This can lead to instrumental mass fractionation that must be corrected using reference materials with known ratios. Therefore, the instrumental mass fractionation (IMF) was determined using the ratio of the D-doped reference materials characterized by ERDA and is shown in Fig. 7. Also shown are two natural glasses, the ratios of which were determined using elemental analyser isotope ratio mass spectrometry (EA-IRMS). Given the very large range of values shown by the natural glasses and the synthetic and D-doped reference materials, we had to use a power law to express the relationship between the of the reference materials and the count ratio provided by SIMS.
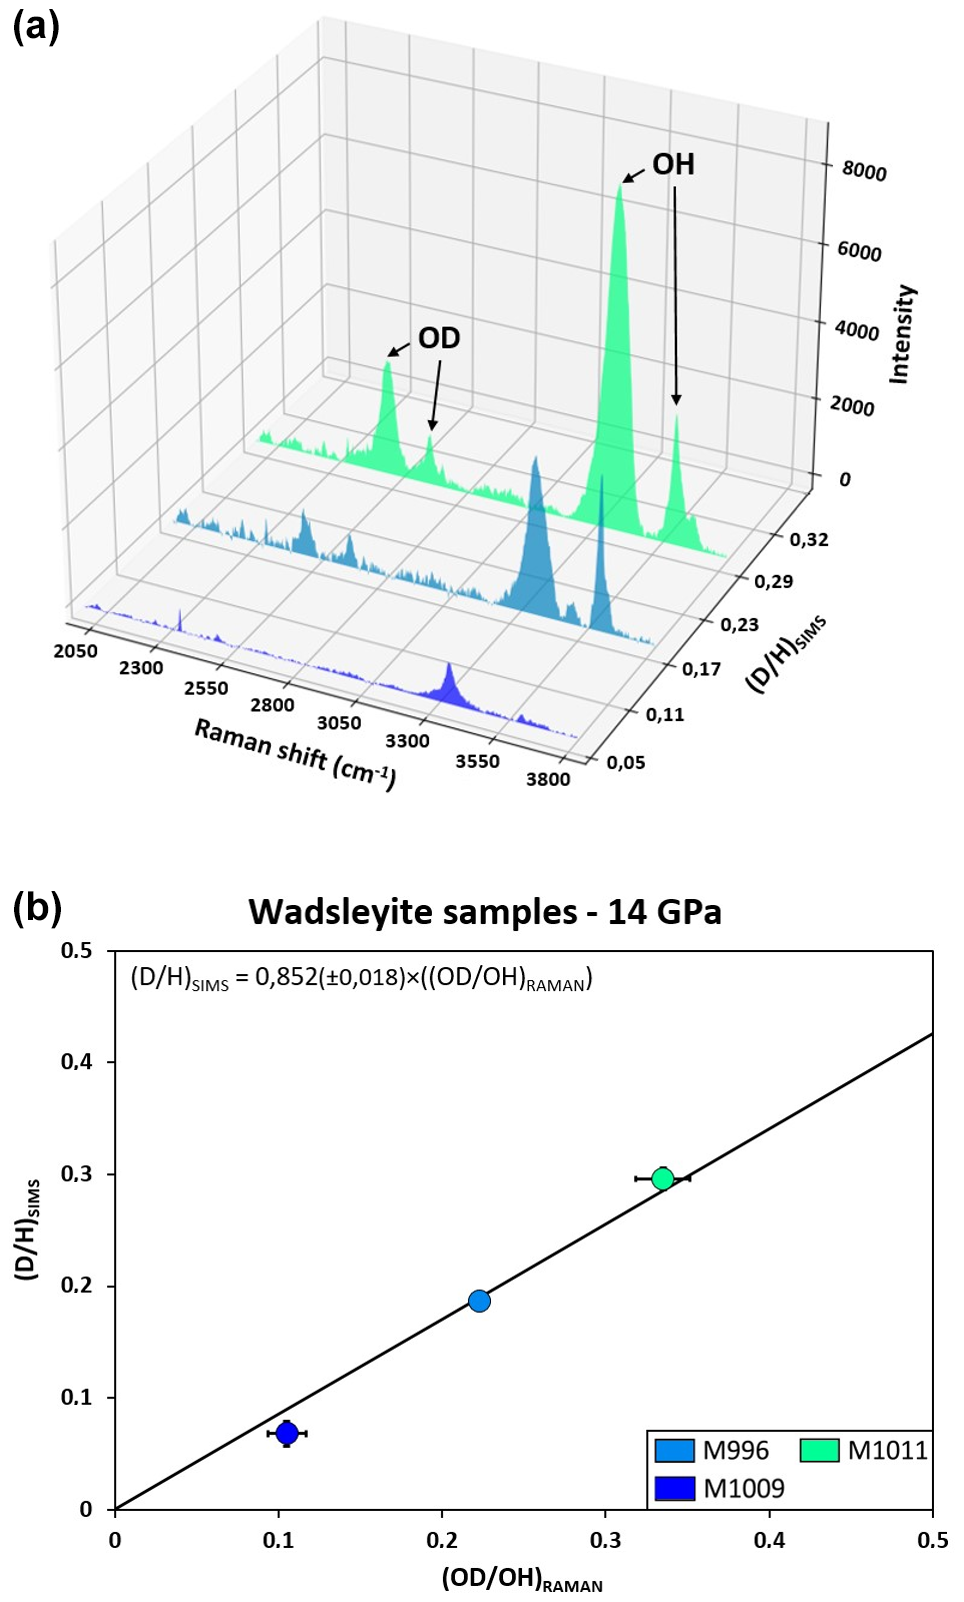
Figure 8(a) Raman spectra showing the OD and OH isotopic substitution in wadsleyite samples. The ratio of the OD and OH integrated band intensities provides the ratio that is compared to that measured by SIMS in (b). In doing so, we assumed that the Raman scattering cross-sections of OH and OD are the same. In this figure, the centring of the window was 2900 cm−1 to observe the OD vibration.
3.3 Comparison between Raman spectroscopy and SIMS measurements
The comparison between the isotopic compositions of hydroxyl in wadsleyite measured by Raman spectroscopy and by SIMS is shown in Fig. 8. According to the definition of vibrational frequency, v, for a harmonic oscillator
where f is the force constant, measuring the strength of the bond, and μ is the reduced mass of the molecule defined as ; the frequency of the OD vibration is found at a lower frequency than that of the OH vibration because deuterium is about twice as heavy as hydrogen (see Reynard and Caracas, 2009). Here, OH bands in wadsleyite are found at 3330 and 3610 cm−1, while OD bands are found at 2482 and 2648 cm−1; thus the Raman frequencies of absorption of the O–D and O–H bonds are separated by a factor varying between 1.33 and 1.36 (see Fig. 8a). In order to quantify the isotopic ratio with Raman spectroscopy, we measured the areas associated with the OD and OH bands after a baseline correction and assuming that the Raman cross-sections of the OD and OH band absorptions are the same (Pilorgé et al., 2017).
The three wadsleyite samples selected for multi-instrument comparison are characterized by a range of values between and (see Table 3). The values of ratios measured by Raman spectroscopy and those measured by SIMS agree very well (see Fig. 8b), as shown by the equation of the regression line: , with a 2 % error. However, it also shows that the band intensity ratio measured by Raman spectroscopy is higher than that predicted by the concentration ratio measured with SIMS. This could be explained by differences in the scattering cross-sections of OD and OH, contrary to what we assumed in the first place. We can rewrite Eq. (3) to
The data in Fig. 8b allow the ratio of scattering cross-sections to be constrained and here , indicating that the scattering cross-section of OH is lower than that of OD. This observation is in agreement with that of Guo et al. (2013), who found a ratio of Raman scattering cross-sections of 0.56 for brucite. However, our observation for wadsleyite differs from that of Zarei et al. (2018), who found that the Raman scattering cross-section of fluid H2O vibrating at 3657 cm−1 is larger than that of D2O vibrating at 2671 cm−1. Such variation could be explained by differences in spectrometer response between the three laboratories.
As discussed by Zarei et al. (2018), according to Raman principles, the Raman intensities should increase with decreasing frequency of vibration (Long, 2002), following
where v0 is the frequency of the incident laser, here 532 nm (note that the calculation is performed using absolute wavenumbers), and vi is the frequency of vibration of the hydrogen species. We can calculate for equal concentrations of H and D following Eqs. (7) and (8). It follows that for the vibrations of hydroxyl in wadsleyite, the theoretical prediction yields a value of the intensity ratio that varies between 0.60 and 0.57 for the bands at 3330 cm−1 for OH vs. 2482 cm−1 for OD and 3610 cm−1 for OH vs. 2648 cm−1 for OD, respectively, or an average of 0.59, while here we measure an average of 0.852. Thus, even if our observation that the scattering cross-section of OH is lower than that of OD agrees well with theory, the observed value is 45 % higher than the predicted value.
Following the above observation, we measured the efficiency (or response) of the spectrometer, CCD detector, and microscope using a calibrated source (Vis-IR fibre lamp from Ocean Optics Light Sources). The response calibration, RC, is defined as the ratio of measured intensity I(ν) vs. the correct intensity I′(ν) provided by the lamp and is shown in Fig. A2. We can graphically determine that the response of the system at the frequency of vibration of OH is ROH=0.73 and that of OD is ROD=0.81. Thus, the correct value of , , can be calculated:
Thus, for equal concentrations of H and D, the ratio of Raman scattering cross-sections of OH and OD should be corrected by a factor of 1.11 and finally . We can conclude that for wadsleyite, the Raman scattering cross-sections of OH and OD are very similar. Although not in agreement with theory, this finding is in agreement with previous D–H diffusion studies using either infrared spectroscopy on garnet (Blanchard and Ingrin, 2004) or Raman spectroscopy on serpentine (Pilorgé et al., 2017), which assume similar cross-sections from OH and OD.
We have performed the analysis of the concentration and isotopic ratio of OH in olivine and wadsleyite using Raman spectroscopy and SIMS analysis based on reference materials whose water contents and/or ratios were previously characterized using independent methods such as FTIR spectroscopy or ERDA. Raman spectroscopy analyses were performed along several orientations to account for the sensitivity of the intensity to the crystallographic orientation of anisotropic minerals in order to minimize the error in water content measurements. The instrument mass fractionation of SIMS was established on olivine reference materials for which the ratios had been characterized using ERDA. After a comparison of the ratios obtained by both the Raman spectroscopy and SIMS methods, we obtain a conversion factor of 0.85 with an error of 2 %, which shows that Raman spectroscopy is an accurate method for analysing the hydrogen isotopic composition of doped NAMs. This allows us to state, after correction of the instrument response, that the Raman scattering cross-sections of OH bands and OD bands for wadsleyite are similar, with a ratio of around 0.95, in agreement with previous studies. The Raman intensity depends on many factors, such as the laser power, the optics attenuation, and spectrometer response, but sample properties are also important. Thus, the relationship obtained here between the water content of the reference materials and the OH vs. Si counts measured with Raman spectroscopy is strictly applicable to one particular machine (Strommen and Nakamoto, 1984).
This study thus shows that Raman spectroscopy can be used to quantify ratios in NAMs accurately, provided that the samples are doped with deuterium. The advantage compared to the ion probe is that Raman spectroscopy is a more accessible and less expensive analytical technique, which also provides information about speciation. Nevertheless, the limits of detection of OD or OH with Raman spectroscopy are quite elevated: 90±10 ppm wt D2O or H2O, as evidenced by the signal just above the noise from sample M1009. Thus, it is a technique applicable to high-pressure synthetic deuterium-doped samples rather than natural NAMs. The detection limit depends on the volume of the sample excited and thus increases with increasing laser power and decreasing objective magnification. However, the laser power on the sample is also limited by the fact that the sample may either dehydrate or back transform upon heating via laser absorption. We found that ∼10–20 mW on wadsleyite is a good compromise to avoid its back transformation and dehydration.
Even if Raman measurements of water content implies a lower precision or higher error arising from the optical anisotropy of non-cubic crystals, this does not necessarily hold true for the measurements of ratios. Indeed, since D and H substitute for each other at the same crystallographic sites, the relative intensity of OH bands compared to those of OD bands remains constant regardless of the orientation of the grain since there is no real difference in the symmetry of the OH and OD vibrational modes and likely no significant difference in the polarizability tensors.
Finally, this study shows that it is possible to obtain accurate values for nominally anhydrous minerals like deep-upper-mantle minerals that can contain substantial hydrogen (wadsleyite and olivine). This study is a prerequisite for the future study of inter-mineral hydrogen isotopic fractionation between the olivine polymorphs. Of course SIMS is very accurate for the determination of H content and isotopic composition; however, speciation can only be determined using spectroscopy.
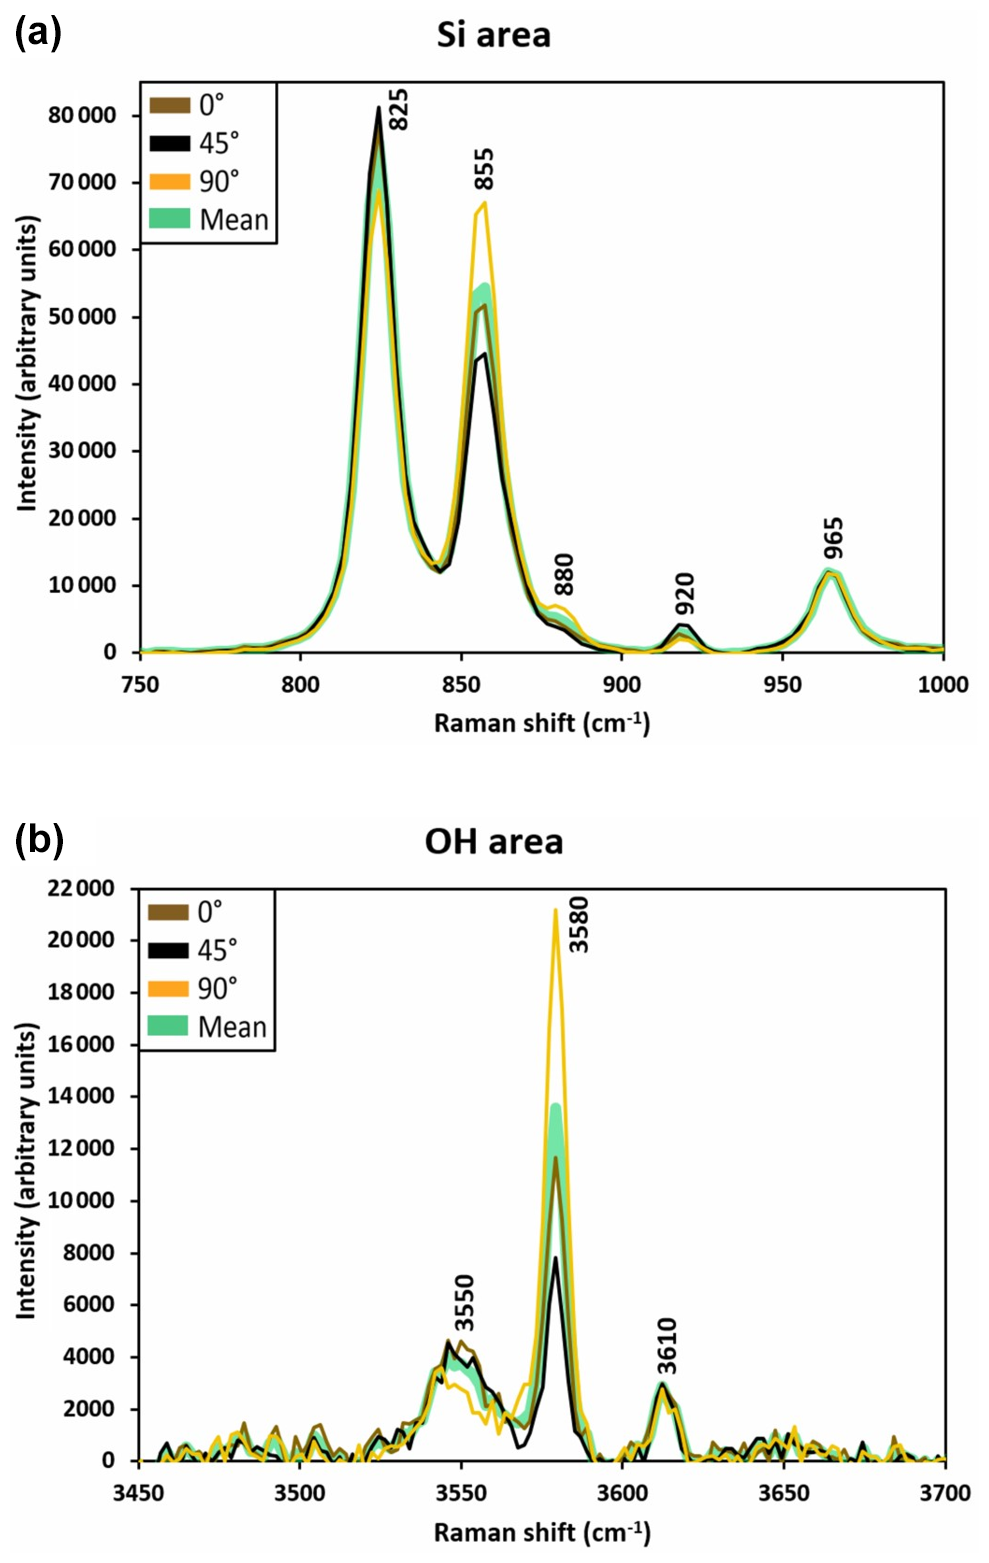
Figure A1Raman spectra (centred about the main peaks of the Si (a) and OH (b) vibration areas) of one analysis point for the olivine M663 reference material and the mean averaged spectrum. The difference in intensity upon rotation of the crystal is evidence of anisotropy. It follows that the values of measured by Raman spectroscopy display a substantial standard deviation for a given specimen in relation to anisotropy.
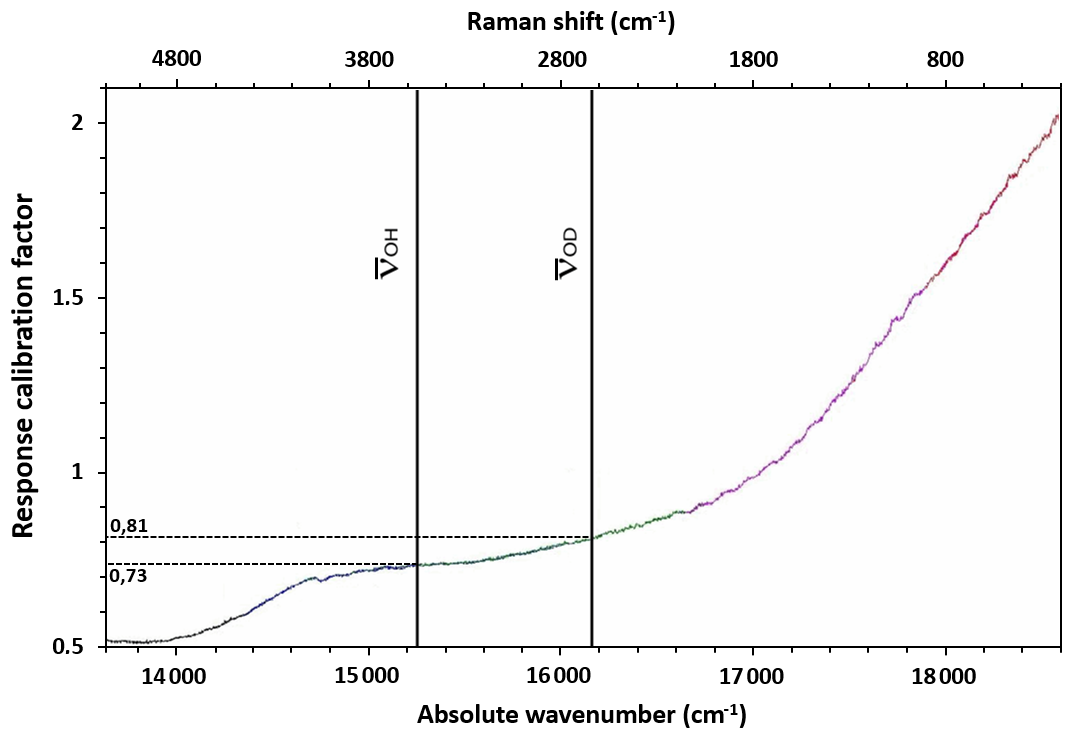
Figure A2The response calibration curve as a function of the absolute wavenumber measured using a calibrated source (Vis-IR fibre lamp from Ocean Optics Light Sources). RC is defined as the ratio of measured intensity I(ν) vs. the correct intensity I′(ν) provided by the lamp. The setup used a 532 nm laser, the 1200 grooves mm−1 grating, the ×100 objective and the static mode with standard confocality. The absolute wavenumbers of the OH and OD stretching vibrations, at 15 217 and 16 157 cm−1, respectively, are also shown.
The data used in this study are provided in the paper (see Tables 1, 2, and 3).
AG designed the experiments (wadsleyite samples), analysed all reference materials and samples by Raman spectroscopy and SIMS, made figures, and wrote the manuscript. NBC designed the project, performed the ERDA measurements, performed the Raman response calibration in Fig. A2 and participated in the writing of the manuscript. BM participated in the writing of the manuscript. HB performed the ERDA measurements together with NBC. HK supervised the ERDA measurements. ACW synthesized one of the deuterated olivines and participated in the writing of the manuscript. LP performed the SIMS measurements together with AG and participated in the writing of the manuscript.
The contact author has declared that none of the authors has any competing interests.
Publisher's note: Copernicus Publications remains neutral with regard to jurisdictional claims made in the text, published maps, institutional affiliations, or any other geographical representation in this paper. While Copernicus Publications makes every effort to include appropriate place names, the final responsibility lies with the authors.
The authors would like to thank Geeth Manthilake for his advice on the multi-anvil press, Federica Schiavi for her precious help with the Raman spectrometer, Nicolas Guignot from the SOLEIL synchrotron for lending us the fibre lamp to measure the response calibration, and Dorian Thomassin and Johan Villeneuve for their advice and knowledge about SIMS analysis. Also, the authors would like to thank the anonymous reviewer and Eugen Libowitzky for improving the quality of our paper with their very good advice. The Magmas and Volcanoes Laboratory (LMV) multi-anvil press and the CRPG LG-SIMS Nancy platform are both INSU national instruments and are part of the Infrastructure of Research RéGEF. This research was funded by the Agence Nationale de la Recherche H-DEEP-ISO, grant no. 21-CE49-0018-01. This is contribution no. 681 to the ClerVolc programme of the International Research Center for Disaster Sciences and Sustainable Development of the University of Clermont-Auvergne, supported by the Agence Nationale de la Recherche.
This research has been supported by the Agence Nationale de la Recherche (grant no. ANR-21-CE49-0018-01H-DEEP-ISO).
This paper was edited by Roland Stalder and reviewed by Eugen Libowitzky and one anonymous referee.
Andrault, D. and Bolfan-Casanova, N.: Mantle rain toward the Earth's surface: A model for the internal cycle of water, Phys. Earth Planet. In., 322, 106815, https://doi.org/10.1016/j.pepi.2021.106815, 2022.
Aubaud, C., Hauri, E., and Hirschmann, M. M.: Hydrogen partition coefficients between nominally anhydrous minerals and basaltic melts, Geophys. Res. Lett., 31, L20611, https://doi.org/10.1029/2004GL021341, 2004.
Bali, E., Bolfan-Casanova, N., and Koga, K. T.: Pressure and temperature dependence of H solubility in forsterite: An implication to water activity in the Earth interior, Earth Planet. Sc. Lett., 268, 354–363, 2008.
Bell, D. R. and Ihinger, P. D.: The isotopic composition of hydrogen in nominally anhydrous mantle minerals, Geochim. Cosmochim. Ac., 64, 2109–2118, 2000.
Bell, D. R. and Rossman, G. R.: Water in Earth's mantle: The role of nominally anhydrous minerals, Science, 255, 1391–1397, 1992.
Bercovici, D. and Karato, S.: Whole mantle convection and transition-zone water filter, Nature, 425, 39–44, 2003.
Bindeman, I. N., Kamenetsky, V. S., Palandri, J., and Vennemann, T.: Hydrogen and oxygen isotope behaviors during variable degrees of upper mantle melting: Example from the basaltic glasses from Macquarie Island, Chem. Geol., 310–311, 126–136, 2012.
Blanchard, M. and Ingrin, J.: Kinetics of deuteration in pyrope, Eur. J. Mineral., 16, 567–576, 2004.
Bolfan-Casanova, N., Montagnac, G., and Reynard, B.: Measurements of water contents in olivine using Raman spectroscopy, Am. Mineral., 99, 149–156, 2014.
Bolfan-Casanova, N., Schiavi, F., Novella, D., Bureau, H., Raepsaet, C., Khodja, H., and Demouchy S.: Examination of Water Quantification and Incorporation in Transition Zone Minerals Wadsleyite, Ringwoodite and Phase D Using ERDA (Elastic Recoil Detection Analysis), Front. Earth Sci., 6, 75, https://doi.org/10.3389/feart.2018.00075, 2018.
Bolfan-Casanova, N., Martinek, L., Manthilake, G., Verdier-Paoletti, M., and Chauvigne, P.: Effect of oxygen fugacity on the storage of water in wadsleyite and olivine in H and H–C fluids and implications for melting atop the transition zone, Eur. J. Mineral., 35, 549–568, https://doi.org/10.5194/ejm-35-549-2023, 2023.
Bouvier, A. S., Deloule, E., and Métrich, N.: Fluid Inputs to Magma Sources of St. Vincent and Grenada (Lesser Antilles): New Insights from Trace Elements in Olivine-hosted Melt Inclusions, J. Petrol., 51, 1597–1615, 2010.
Bureau, H., Raepsaet, C., Khodja, H., Carraro, A., and Aubaud, C.: Determination of hydrogen content in geological samples using elastic recoil detection analysis (ERDA), Geochim. Cosmochim. Ac., 73, 3311–3322, 2009.
Daudin, L., Khodja, H., and Gallien, J. P.: Development of `position-charge-time' tagged spectrometry for ion beam microanalysis, Nuclear Instruments and Methods in Physics Research Section B, 210, 153–158, 2003.
Demouchy, S. and Bolfan-Casanova, N.: Distribution and transport of hydrogen in the lithospheric mantle: A review, Lithos, 240–243, 402–425, 2016.
Demouchy, S., Deloule, E., Frost, D. J., and Keppler, H.: Pressure and temperature-dependence of water solubility in Fe-free wadsleyite, Am. Mineral., 90, 1084–1091, 2005.
Dobson, P. F., Epstein, S., and Stolper, E. M.: Hydrogen isotope fractionation between coexisting vapor and silicate glasses and melts at low pressure, Geochim. Cosmochim. Ac., 53, 2723–2730, 1989.
Férot, A. and Bolfan-Casanova, N.: Water storage capacity in olivine and pyroxene to 14 GPa: Implications for the water content of the Earth's upper mantle and nature of seismic discontinuities, Earth Planet. Sc. Lett., 349–350, 218–230, 2012.
Guo, X. Z., Yoshino, T., Okuchi, T., and Tomioka, N.: H-D interdiffusion in brucite at pressures up to 15 GPa, Am. Mineral., 98, 1919–1929, 2013.
Inoue, T., Yurimoto, H., and Kudoh, Y.: Hydrous modified spinel, Mg1.75SiH0.5O4: a new water reservoir in the mantle transition region, Geophys. Res. Lett., 22, 117–120, 1995.
Keppler, H. and Smyth J. R.: Water in nominally anhydrous minerals, Rev. Mineral. Geochem., 62, 53–66, 2006.
Khodja, H., Berthoumieux, E., Daudin, L., and Gallien, J. P.: The Pierre Süe Laboratory nuclear microprobe as a multi-disciplinary analysis tool, Nuclear Instruments and Methods in Physics Research Section B, 181, 83–86, 2001.
Koga, K., Hauri, E., Hirschmann, M., and Bell, D.: Hydrogen concentration analyses using SIMS and FTIR: Comparison and calibration for nominally anhydrous minerals, Geochem. Geophys. Geosyst., 4, 1019, https://doi.org/10.1029/2002gc000378, 2003.
Libowitzky, E. and Rossman, G. R.: Principles of quantitative absorbance measurements in anisotropic crystals, Phys. Chem. Miner., 23, 319–327, 1996.
Long, D. A.: The Raman Effect: A unified Treatment of the Theory of Raman Scattering by Molecules, John Wiley & Sons, Chichester, https://doi.org/10.1002/0470845767, 2002.
Martinek, L. and Bolfan-Casanova, N.: Water quantification in olivine and wadsleyite by Raman spectroscopy and study of errors and uncertainties, Am. Mineral., 106, 570–580, 2021.
Mayer, M.: SIMNRA, a simulation program for the analysis of NRA, RBS and ERDA, in: AIP conference proceedings, 4–7 November 1998, Denton, Texas (USA), American Institute of Physics, 475, 1, 541–544, 1999.
Métrich, N. and Deloule, E.: Water content, δD and δ 11B tracking in the Vanuatu arc magmas (Aoba Island): Insights from olivine-hosted melt inclusions, Lithos, 206–207, 400–408, 2014.
Moine, B., Bolfan-Casanova, N., Radu, I. B., Ionov, D. A., Costin, G., Korsakov, A. V., Golovin, A. V., Oleinikov, O. B., Deloule, E., and Cottin, J. Y.: Molecular hydrogen in minerals as a clue to interpret ∂D variations in the mantle, Nat. Commun., 11, 3604, https://doi.org/10.1038/s41467-020-17442-8, 2020.
Mosenfelder, J. L., Le Voyer, M., Rossman, G. R., Guan, Y., Bell, D. R., Asimow, P. D., and Eiler, J. M.: Analysis of hydrogen in olivine by SIMS: evaluation of standards and protocol, Am. Mineral., 96, 1725–1741, 2011.
Novella, D., Frost, D. J., Hauri, E. H., Bureau, H., Raepsaet, C., and Roberge, M.: The distribution of H2O between silicate melt and nominally anhydrous peridotite and the onset of hydrous melting in the deep upper mantle, Earth Planet. Sc. Lett., 400, 1–13, 2014.
Ohtani, E., Toma, M., Litasov, K., Kubo, T., and Suzuki, A.: Stability of dense hydrous magnesium silicate phases and water storage capacity in the transition zone and lower mantle, Phys. Earth Planet. In., 124, 105–117, 2001.
Pearson, D. G., Brenker, F. E., Nestola, F., McNeill, J., Nasdala, L., Hutchison, M. T., and Vincze, L.: Hydrous mantle transition zone indicated by ringwoodite included within diamond, Nature, 507, 221–224, 2014.
Piani, L., Marrocchi, Y., Rigaudier, T., Vacher, L. G., Thomassin, D., and Marty, B.: Earth's water may have been inherited from material similar to enstatite chondrite meteorites, Science 369, 1110–1113, 2020.
Pilorgé, H., Reynard, B., Remusat, L., Le Floch, S., Montagnac, G., and Cardon, H.: diffusion in serpentine, Geochim. Cosmochim. Ac., 211, 355–372, 2017.
Raepsaet, C., Bureau, H., Khodja, H., Aubaud, C., and Carraro, A.: μ-ERDA developments in order to improve the water content determination in hydrous and nominally anhydrous mantle phases, Nuclear Instruments and Methods in Physics Research Section B, 266, 1333–1337, 2008.
Reynard, B. and Caracas, R.: isotopic fractionation between brucite Mg(OH)2 and water from first principles vibrational modeling, Chem. Geol., 262, 159–168, 2009.
Schiavi, F., Bolfan-Casanova, N., Withers, A. C., Médard, E., Laumonier, M., Laporte, D., Flaherty, T., and Gómez-Ulla, A.: Water quantification in silicate glasses by Raman spectroscopy: Correcting for the effects of confocality, density and ferric iron, Chem. Geol., 483, 312–331 2018.
Slodzian, G.: Microanalyzers using secondary ion emission: advances in electronics and electron physics, in: Advances in Electronics and Electron Physics, edited by: Septier, A., Academic Press 138, 1–44, 1980.
Strommen, D. and Nakamoto, K.: Laboratory Raman Spectroscopy, John Wiley and Sons, New York, 138 pp., 1984.
Withers, A. C., Bureau, H., Raepsaet, C., and Hirschmann, M. M.: Calibration of infrared spectroscopy by elastic recoil detection analysis of H in synthetic olivine, Chem. Geol., 334, 92–98, 2012.
Yang, X.: Effect of oxygen fugacity on OH dissolution in olivine under peridotite-saturated conditions: An experimental study at 1.5–7 GPa and 1100–1300 °C, Geochim. Cosmochim. Ac., 173, 319–336, 2016.
Zarei, A., Klumbach, S., and Keppler, H.: The relative Raman Scattering Cross Sections of H2O and D2O, with Implications for In-Situ Studies of Isotope Fractionation, ACS Earth and Space Chemistry, 2, 925–934, 2018.