the Creative Commons Attribution 4.0 License.
the Creative Commons Attribution 4.0 License.
 | 19 Oct 2023
Vibrational properties of OH groups associated with divalent cations in corundum (α-Al2O3)
Michael C. Jollands
Shiyun Jin
Martial Curti
Maxime Guillaumet
Keevin Béneut
Paola Giura
Etienne Balan
The infrared spectra of synthetic corundum (α-Al2O3) samples either doped directly with divalent cations (Mg2+) or containing divalent cations formed by reduction of trivalent cations in H2 gas (Co2+, Ni2+) may display broad OH stretching bands at ∼3000 cm−1 due to the structural incorporation of trace amounts of hydrogen. Experimental spectra recorded from some natural sapphires display a similar absorption band associated with a dominant absorption at 3161 cm−1, and some beryllium-diffused corundum crystals show a band at 3060 cm−1. All of these also display smaller and generally narrower bands between 1900 and 2700 cm−1, whose natures are poorly defined. In this work, the atomic-scale structure, relative stability and infrared spectroscopic properties of a series of OH defects in corundum (α-Al2O3) are theoretically investigated at the density-functional-theory level. The investigated defects consist of interstitial H+ ions forming OH groups and compensating for the charge imbalance related to the presence of divalent cations (Be2+, Mg2+, Cr2+, Mn2+, Fe2+, Co2+, Ni2+) substituted for Al3+ at nearby octahedral sites. Bands occurring at ∼3000 cm−1 in experimental spectra are assigned to the OH stretching modes of some of these defects, with bands observed around 1900 and 2700 cm−1 being assigned to overtones of corresponding OH bending modes. The results also support the assignment of the so-called “3161 cm−1 series”, observed in experimental spectra of some rubies and yellow sapphires, to structural OH groups in association with Fe2+ ions, rather than Si4+, as has been previously proposed. These inferences are also supported by analysis of correlations between band areas in experimental infrared spectra extracted from a database of corundum gemstones. A qualitative explanation relating the anomalous intensity and the polarisation properties of the OH bending overtone bands to the electrical anharmonicity of OH groups involved in medium-strength H bonds is proposed.
- Article
(4772 KB) - Full-text XML
-
Supplement
(41202 KB) - BibTeX
- EndNote


The infrared spectra of synthetic or natural corundum (α-Al2O3) samples display a significant variability in the OH stretching region which relates to their growth conditions, trace element contents and thermal history. While some spectra recorded from natural samples suggest the presence of hydrous solid inclusions, such as kaolinite or diaspore, OH stretching bands related to trace concentrations of OH groups incorporated at structural crystal sites are also observed (e.g. Beran and Rossman, 2006). These OH groups result from the bonding of H+ ions to oxygen anions, ensuring an electrostatic charge compensation for Al3+ vacancies or for Al3+ substitution by lower-valency cations.
The presence of OH groups associated with Al vacancies (Moon and Phillips, 1991, 1994; Balan, 2020) leads to well-resolved bands between 3150 and 3400 cm−1, most frequently at 3309, 3232 and 3185 cm−1, with a polarisation almost parallel to the (001) plane. These bands correspond to the so-called “3309 cm−1 series” (e.g. Soonthorntantikul et al., 2019) and can be observed in synthetic samples (e.g. Eigenmann and Günthard, 1971; Volynets et al., 1972; Beran, 1991; Ramírez et al., 2004) or natural samples (e.g. Beran and Rossman, 2006; Soonthorntantikul et al., 2019).
Turning to the presence of OH groups associated with divalent cations, spectra of synthetic samples doped with Co3+ or Ni3+ and then reduced to Co2+ and Ni2+, respectively, through annealing in a H2 atmosphere at >800 ∘C display relatively broad OH stretching bands extending from ∼2700 to ∼3300 cm−1 (Müller and Günthard, 1966; Eigenmann and Günthard, 1971; Blum et al., 1973). These spectra also display several narrower bands between 1900 and 2700 cm−1 (e.g. Müller and Günthard, 1966). Similar infrared spectra are recorded from synthetic corundum samples doped with Mg with a main broad band at ∼3000 cm−1 and weaker and narrower bands at 2030, 2140, 2254, 2416, 2462 and 2628 cm−1 (Fukatsu et al., 2003). The main broad band has a dominant polarisation in the direction perpendicular to the (001) plane (Volynets et al., 1972; Ramírez et al., 1997; Fukatsu et al., 2003) and most of the low-wavenumber bands have similar pleochroism (Fukatsu et al., 2003). Spectra very close to those of the synthetic Mg-bearing samples are observed in some natural untreated sapphires and in some “Punsiri” heat-treated sapphires (Bonnet and Fritsch, 2012; Sangsawong et al., 2016; Hummel, 2019). The spectra of Be-diffused corundum samples can also display a broad band at 3060 cm−1 as well as a band at 2490 cm−1 (Balmer and Krzemnicki, 2015; Jollands and Balan, 2022).
The nature of the bands observed between 1900 and 2700 cm−1 in corundum samples containing divalent cations is undefined. Some of these bands are often weak and may overlap with those associated with CO2 (2250 to 2400 cm−1), which are ubiquitous in routine infrared spectroscopy analyses. There is therefore a possibility that their presence may be underreported in the literature. High-temperature diffusion experiments suggest that they are related to hydrogen-bearing species (e.g. Müller and Günthard, 1966). The low natural abundance of deuterium (D), as well as results from deuterium diffusion experiments (e.g. Müller and Günthard, 1966; Fukatsu et al., 2003), rules out an assignment of these low-frequency bands to OD stretching vibrations. Although their frequency could match the fundamental frequency of relatively covalent X–H bonds, such as Be–H, as proposed by Jollands and Balan (2022) for Be-diffused samples, their occurrence in high-temperature synthetic samples with controlled chemical composition, as well as their presence in natural samples with highly variable compositions, challenges this hypothesis. Alternatively, these bands could correspond to overtones of lower-frequency vibrational modes. Unfortunately, the corresponding fundamental modes cannot be observed in routine gemstone analysis because of the strong absorption of corundum below 2000 cm−1, generally leading to the saturation of spectra. In addition, the overtone transitions are forbidden in the harmonic approximation and their intensities can be several orders of magnitude weaker than those of their fundamental counterparts. For this reason, overtones of OH bending modes of hydrous defects are usually not expected to be observed in standard infrared spectroscopic analysis.
Additionally, the experimental infrared spectra of some natural corundum display a dominant band at 3161–3164 cm−1, a broad feature at ∼3075 cm−1, and two narrow bands at 3242 and 3355 cm−1 (Smith and Van der Bogert, 2006; Schwarz et al., 2008; Choudhary and Vijay, 2018; Hummel 2019). Low-frequency bands have also been reported at 2420 and 2460 cm−1. As the 3161 cm−1 band disappears for samples heated above 900 ∘C in air, presumably associated with out-diffusion of hydrogen (Atikarnsakul and Emmett, 2021), its presence may be indicative of unheated sapphires (Choudhary and Vijay, 2018). Its nature is however unclear. It has been related to the presence of Si4+ in corundum samples (Volynets et al., 1972), to the association of hydrogen with Mg2+ cations (Smith and Van der Bogert, 2006), and to inclusion of other phases such as goethite or epidote (Balmer et al., 2006). Choudhary and Vijay (2018) related this band to the narrow band observed at 3163 cm−1 in experimental spectra recorded from synthetic Verneuil samples, but in this case, the low-frequency bands are lacking.
Approaches based on the density-functional theory (DFT) can be used to establish theoretical relations between the observed infrared spectroscopic signals and atomic-scale models of hydrous defects in minerals (e.g. Jollands et al., 2020, for quartz; Balan, 2020, and Jollands and Balan, 2022, for corundum). Here, the atomic-scale structures of defective corundum models associating H atoms with substituted divalent cations are theoretically determined and their calculated spectroscopic properties are compared to available experimental spectra recorded from both synthetic and natural corundum. These investigations are completed by a statistical analysis of spectra extracted from a database of infrared spectra recorded from corundum gemstones. By coupling theoretical and experimental data, the results support the assignment of the low-frequency bands to overtones of OH bending modes and provide interpretations for major bands observed in the spectra of synthetic or natural corundum samples containing divalent cations.
2.1 Theoretical modelling
The properties of OH defects in corundum were theoretically investigated using the same approach and numerical parameters as in Balan et al. (2020) and Jollands and Balan (2022). Briefly, the defect modelling was performed within the DFT framework using the generalised gradient approximation (GGA) to the exchange–correlation functional as proposed by Perdew, Burke and Ernzerhof (PBE functional; Perdew et al., 1996). The modelling scheme used periodic boundary conditions and a plane-wave basis set as implemented in the PWscf code of the Quantum Espresso package (Giannozzi et al., 2009; http://www.quantum-espresso.org, last access: 6 October 2023). Ionic cores were described using optimised norm-conserving Vanderbilt (SG15 ONCV) pseudopotentials (Hamann, 2013; Schlipf and Gygi, 2015) with a plane-wave energy cutoff of 80 Ry.
Structural properties of OH-bearing defects were determined using corundum supercells (120 atoms) with Brillouin zone sampling restricted to the Γ point. The relaxation of atomic internal coordinates was performed until the residual forces were Ry au−1. Unit-cell parameters of pure corundum optimised at zero pressure ( Å, c=13.08 Å) were used without further relaxation to produce the OH-bearing supercells. For models with paramagnetic cations, spin-polarised calculations have been performed, imposing the spin state of isolated ions onto the supercell and assuming a high-spin state for Cr2+, Mn2+, Fe2+ and Co2+ cations. The vibrational modes at the Brillouin zone centre (Γ point), the Born effective charge tensors and the electronic dielectric tensor were then calculated using the linear response theory (Baroni et al., 2001) as implemented in the PHonon code (Giannozzi et al., 2009; http://www.quantum-espresso.org, last access: 6 October 2023). As the OH bending modes are also relevant for the present study, the partial Hessian technique, which provides accurate results for the OH stretching mode, was not used and full dynamical matrices (leading to 363 modes for each H-bearing model) were calculated.
Table 1Theoretical structural and harmonic vibrational properties of models associating one interstitial H+ with substitutions at nearby octahedral sites. Each substituted model displays four configurations. The table columns are as follows. “Model” gives the substituting cation name and specifies the configuration. Sites 1 to 4 describe site occupancy in the related configuration, as shown in Fig. 1. “Rel. energy” is the energy of each configuration defined relative to the most stable configuration with the same stoichiometry. “d(OH)” is the O–H distance. “ωOH” is the wavenumber of the OH stretching vibration. “Θstretch” and “Θspectro” are the angles of the stretching displacement direction and of the induced polarisation vector, respectively, with respect to the [001] direction. “Kint” is the absorption coefficient for the configuration. “δOH” and “γOH” are the wavenumbers of the δ and γ bending modes, respectively.
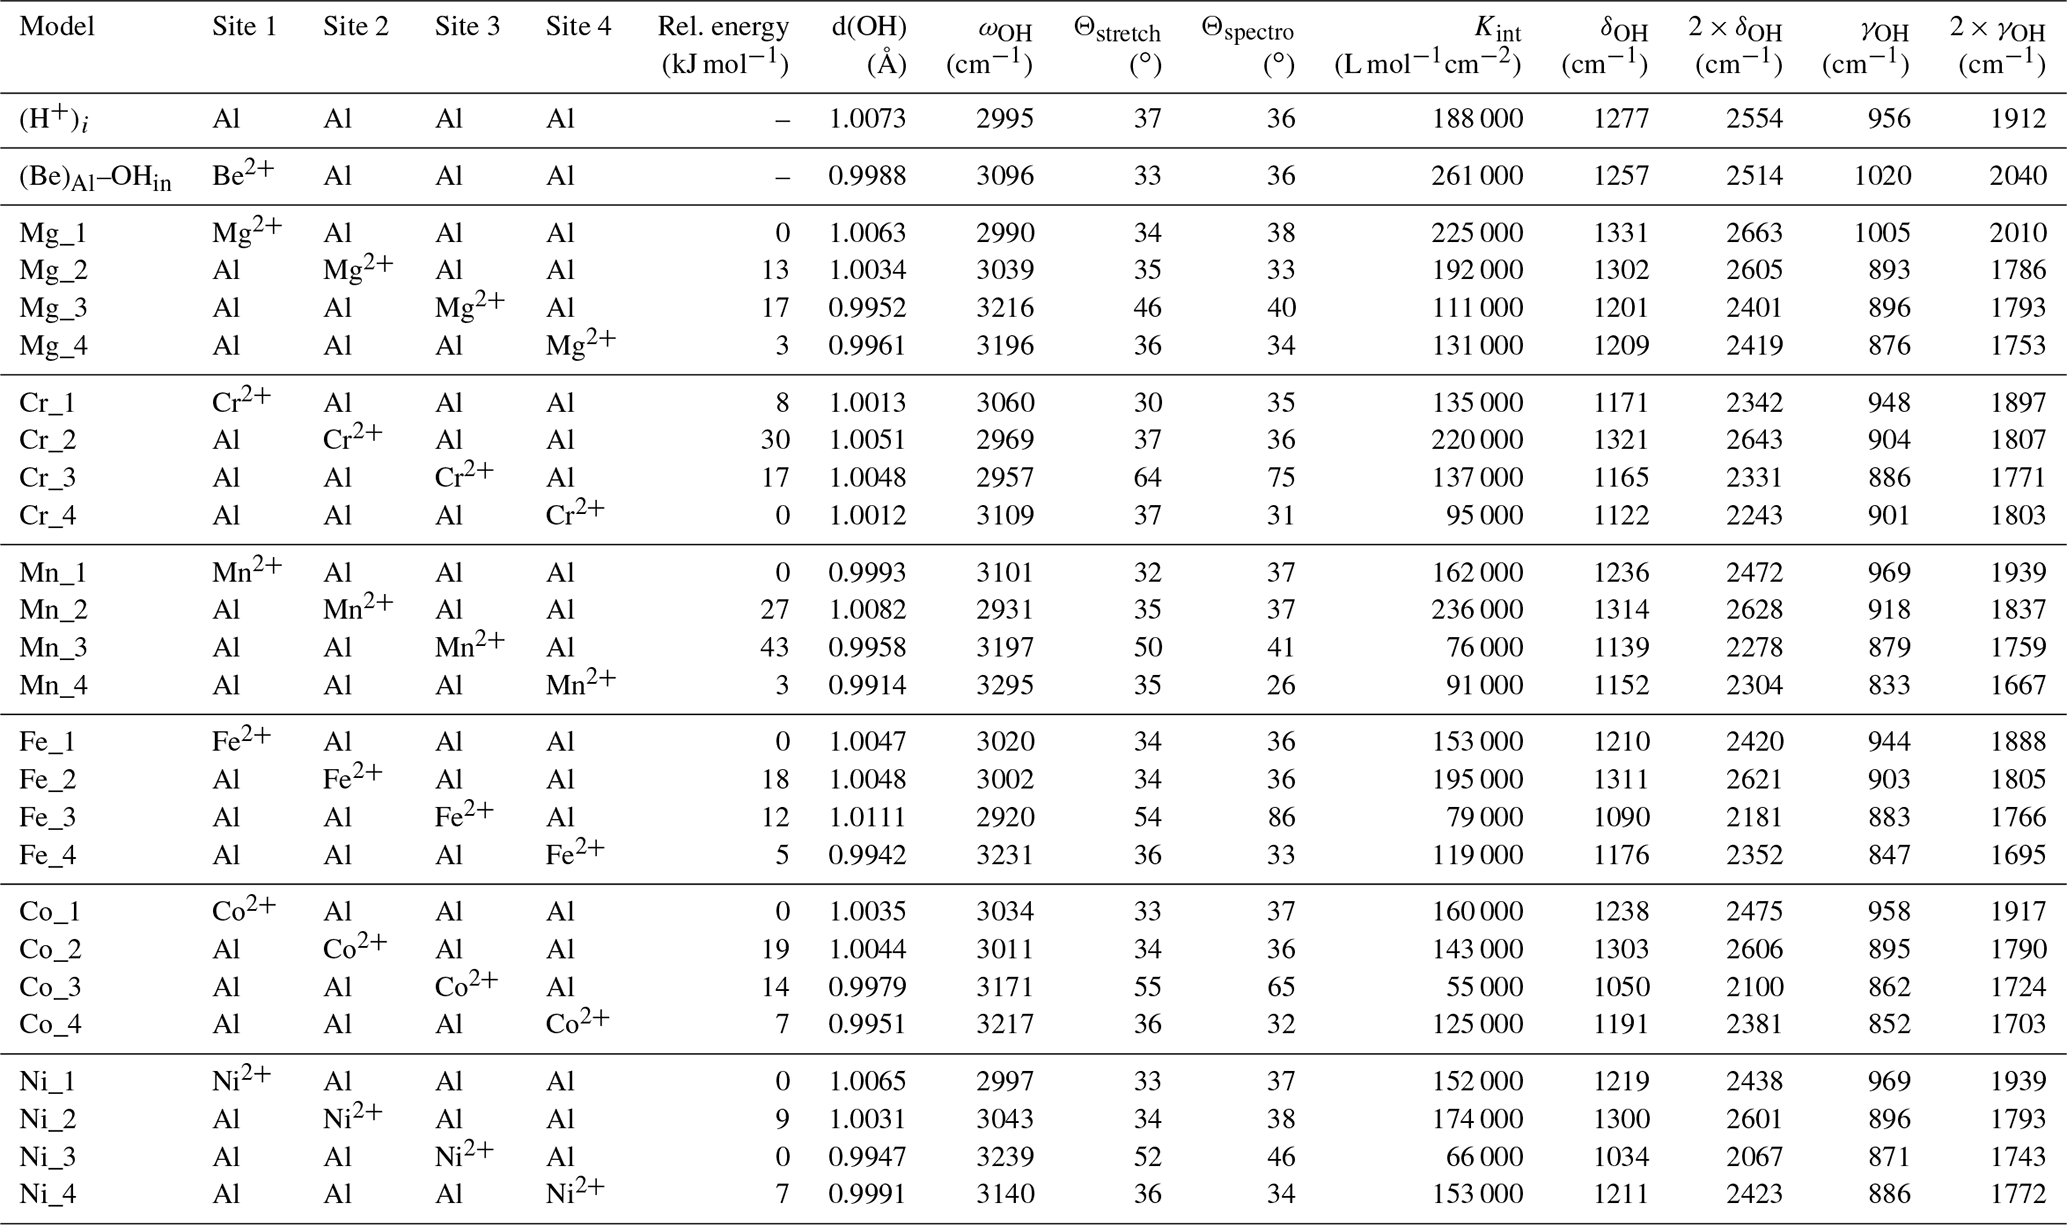
The angle between the mode-effective charge vector and the [001] direction (Θspectro, Table 1) is the quantity which can be experimentally determined from the variation in the IR absorption intensity as a function the IR light polarisation (e.g. Libowitzky and Beran, 2006). The mode-effective charge vector is proportional to the polarisation induced by the atomic displacements in the related vibrational mode and is defined by (Gonze and Lee, 1997)
where is the Born effective charge tensor which describes the polarisation induced in the Cartesian direction α by the displacement of atom τ in the Cartesian direction β and Um(τβ) is the displacement coordinate along β of atom τ of mode m. Um(τβ) is normalised such that , where Mτ is the mass of atom τ and δmn=1 if m=n and δmn=0 otherwise. Due to the potential anisotropy of the Born effective charge tensors, the Θspectro angle can differ from the Θstretch angle defined between the stretching direction of the OH group and the [001] direction (Table 1).
2.2 Infrared spectroscopy
To complement the DFT modelling, Fourier-transform infrared (FTIR) spectra were manually selected from a large database of unpolarised experimental spectra of faceted gemstones recorded at laboratories of the Gemological Institute of America (GIA). In general, these are recorded using Thermo iS50 spectrometers equipped with MCT detectors, using an instrumental resolution of 2 cm−1 and ≥32 scans. Three types of spectrum were extracted. The first set comprised 250 spectra of natural samples showing a clear band at 3161 cm−1, without any broad band at around 3000 cm−1 or bands from the “3309 cm−1 series”, which is usually characterised by a main band centred at 3309 cm−1. The second set is a compilation of spectra showing a double peak at 3015 and 2970 cm−1, recorded from synthetic corundum crystals with relatively high Ni concentrations (>7 wt ppm). Such crystals are rarely submitted for examination, and trace element data are generally unnecessary to confirm their synthetic nature. As a result, only 14 such spectra were available. The third set corresponds to spectra showing the broad band observed in Mg-doped synthetic crystals, with a doublet at 3207 and 2991 cm−1, with broad tails on this main band often extending to >3300 and <2800 cm−1. Such spectra can be observed in synthetic corundum, as well as natural and Punsiri-treated crystals. All spectra were then baseline-corrected using a concave-rubber-band method and then fitted with Gaussian peak-shape functions, with a different series of functions used for the three types of spectrum. The integrated areas of the bands were compiled for each spectrum. No thickness correction was made; therefore all integrated absorbance is arbitrary. The aim of this exercise is to determine which bands show correlations with one another, which is useful for supporting or refuting assignation of different bands to the same defect, or at least the same class of defect. Unfortunately, it was not possible to identify experimental FTIR spectra of hydrous defects in corundum related to Mn2+ or Cr2+ in the GIA database or in the literature.
Finally, transmission FTIR spectra were recorded from a 3.3 mm thick slab of a natural yellow sapphire (YS-1) from Sri Lanka showing the 3161 cm−1 band, for which polarisation information was lacking. The spectra were obtained for polarisation directions roughly parallel or perpendicular to the [001] direction with an instrumental resolution of 4 cm−1, using a Nicolet 6700 FTIR spectrometer and Continuμm microscope, set with an EverGlo source, KBr beam splitter and MCT detector.
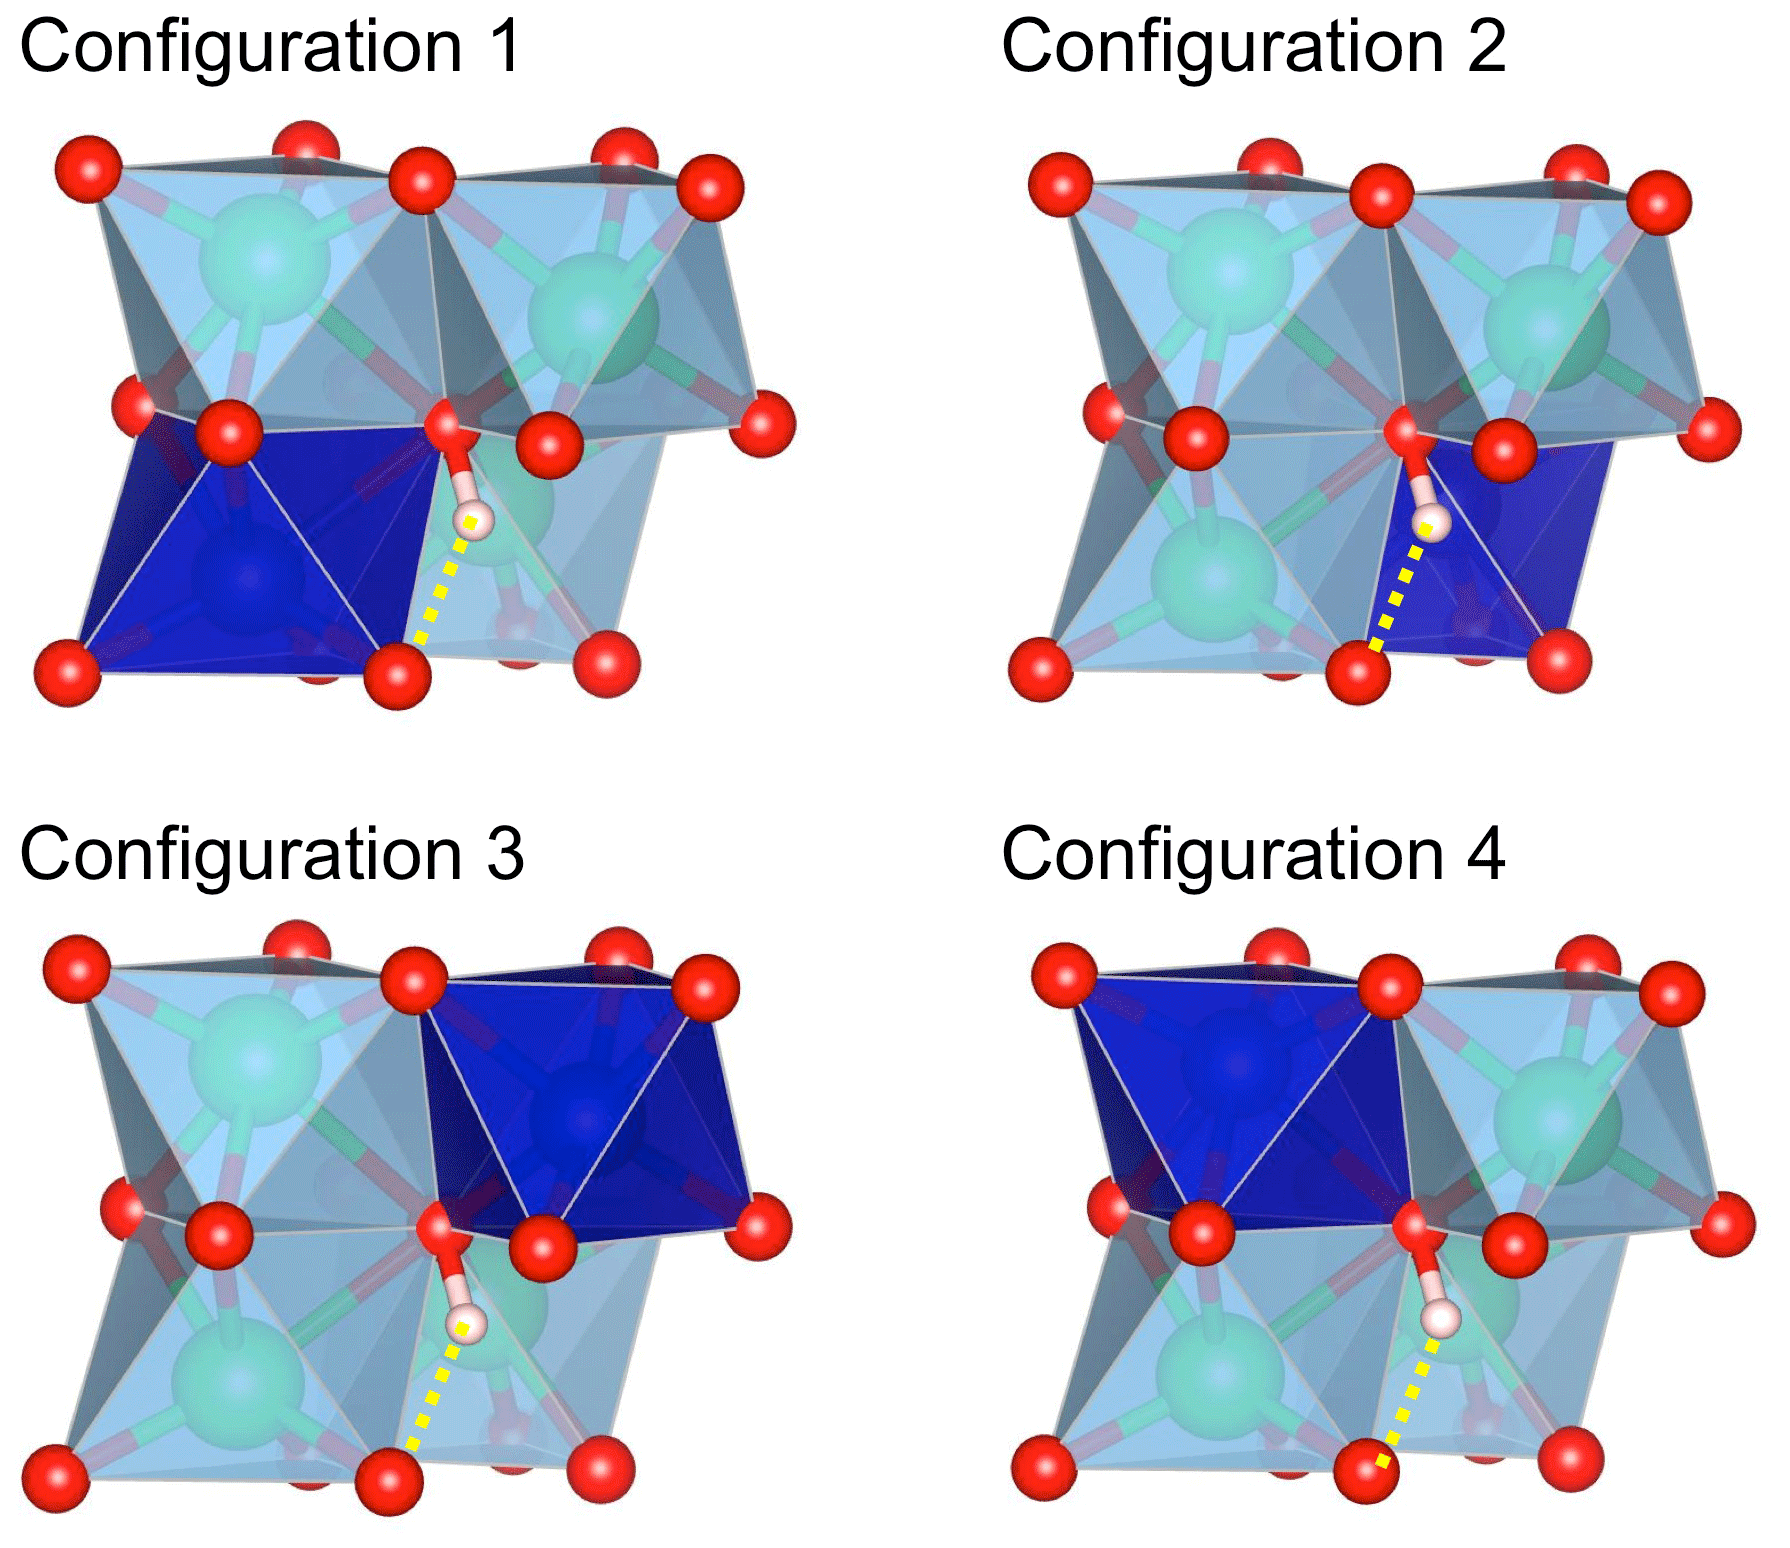
Figure 1Configurations of interstitial H+ associated with a divalent cation in corundum. The configurations differ by the occupancy of one of the four octahedral sites (deep blue) surrounding the OH group. The OH group forms a medium-strength H bond (dotted yellow line) with an oxygen anion of the structurally vacant octahedral site. Red sphere: oxygen atom; light-pink sphere: hydrogen atom; green sphere: aluminium.
3.1 General properties of interstitial H+ in corundum
Hydrous defects comprising a cationic substitution, such as Mg2+ for Al3+, associated with an interstitial H+ (Fig. 1), are closely related to the (H+)i model previously investigated by Zhang et al. (2014), T-Thienprasert et al. (2017) and Balan (2020). In this positively charged model, the OH group resulting from the bonding of the H atom to an oxygen atom of the corundum structure is coordinated to four Al atoms. The theoretical model of Balan (2020) displays an OH bond length of 1.0073 Å and an OH stretching frequency of 2994 cm−1. Two OH bending modes, denoted δ and γ, are predicted at 1277 and 956 cm−1, respectively (Table 1; eigendisplacements are reported as electronic files in the Supplement). These bending modes correspond to a hydrogen displacement dominantly parallel (δ mode) or perpendicular (γ mode) to the [001] direction. Note that OH vibrational modes of crystals involving a displacement of the H atom in a direction perpendicular to the OH bond are referred to as libration modes in basic hydroxides, such as LiOH or NaOH, and as bending modes in systems with more covalent bonds, such as Al hydroxides (Ryskin, 1974). Bending modes usually correspond to higher vibrational frequencies than libration modes. For the three vibrational modes, the norm of the H-atom displacement vector accounts for more than 99 % of the norm of the full atomic displacement vectors. Therefore, the vibrational properties of the OH groups can be qualitatively discussed by considering only the hydrogen displacement (whilst the other atoms interacting with the hydrogen must be considered for a quantitative treatment). The H atom also contributes to lower-frequency modes due to the coupling of its displacements with the corundum vibrational modes involving the Al and O atoms. For most of these modes, the H displacement is not dominant and accounts for less than 50 % of the norm of the full atomic displacement vectors. One theoretical mode at 764 cm−1 displays a more significant contribution of the hydrogen displacement (63 %), with a displacement pattern similar to that of the γ bending mode (theoretical eigendisplacements and animation files are provided in the Supplement).
For one cationic substitution, four non-equivalent defect configurations display a M2+–OH bond (Table 1). They differ by the respective position of the OH group and substituted Al site (Fig. 1). All of the configurations are electrostatically neutral. In configurations 1 and 4, the H atom is bonded to an oxygen atom of the small oxygen triangle shared by the substituted octahedral site and the neighbouring Al-occupied site. The two configurations differ by the orientation of the OH bond, which points along the edge of the substituted site in configuration 1 and in the opposite direction in configuration 4. In configurations 2 and 3, the hydrogen atom is connected to the large basal oxygen triangle between the substituted site and the neighbouring structurally vacant octahedral site. The OH bond is in a lateral position with respect to the face of the substituted site in configuration 3 and points in the opposite direction in configuration 2 (Fig. 1). The relative energy of the configurations (Table 1) suggests that H being bonded to an oxygen of the small triangle (configurations 1 and 4) is favoured relative to bonding on the large oxygen triangle (configurations 2 and 3), except in the Ni-bearing configurations, which display a smaller variation range in their total energy. The conversion between configurations 1 and 2 corresponds to a H+ exchange between two oxygen anions belonging to the same structurally vacant octahedral site. This suggests that this conversion is very easy, which implies that the less stable configuration 2 is not expected to occur at significant concentrations at room temperature.
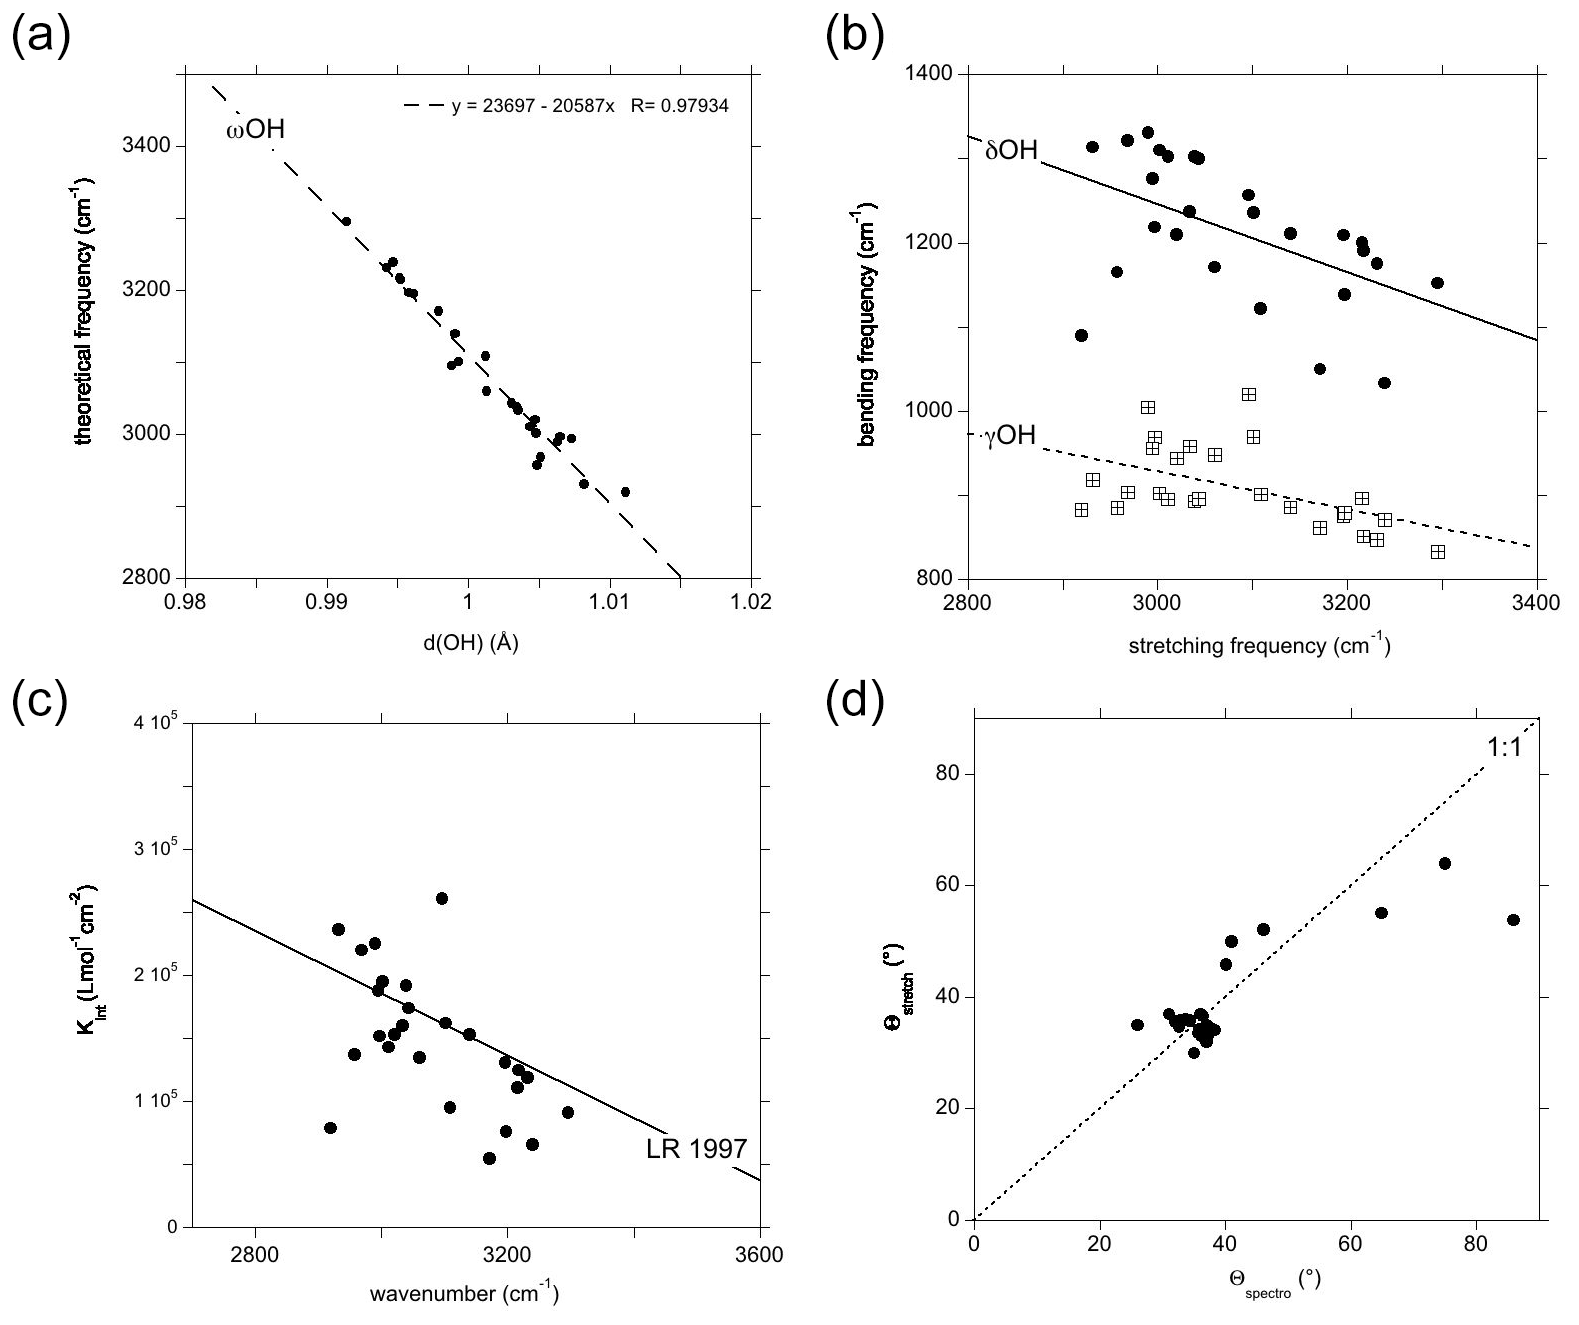
Figure 2Theoretical vibrational properties of the hydrous defects in corundum (Table 1). (a) Relation between the OH stretching frequency and the OH bond length. (b) Frequency of the OH bending modes (filled circles: δ modes; open squares: γ modes) reported as a function of the corresponding stretching mode. (c) Theoretical infrared absorption coefficient of the OH stretching mode as a function of the corresponding theoretical frequency. The straight line (LR 1997) corresponds to the Libowitzky and Rossman (1997) experimental calibration (Kint=246.6 (3753–νOH)), where Kint is the absorption coefficient of the OH stretching band in units of cm−2 per mol H2O L−1 and νOH the observed stretching frequency in reciprocal centimetres (cm−1). (d) Comparison of the theoretical polarisation angle inferred from the spectroscopic properties of the models to that corresponding to the stretching coordinates.
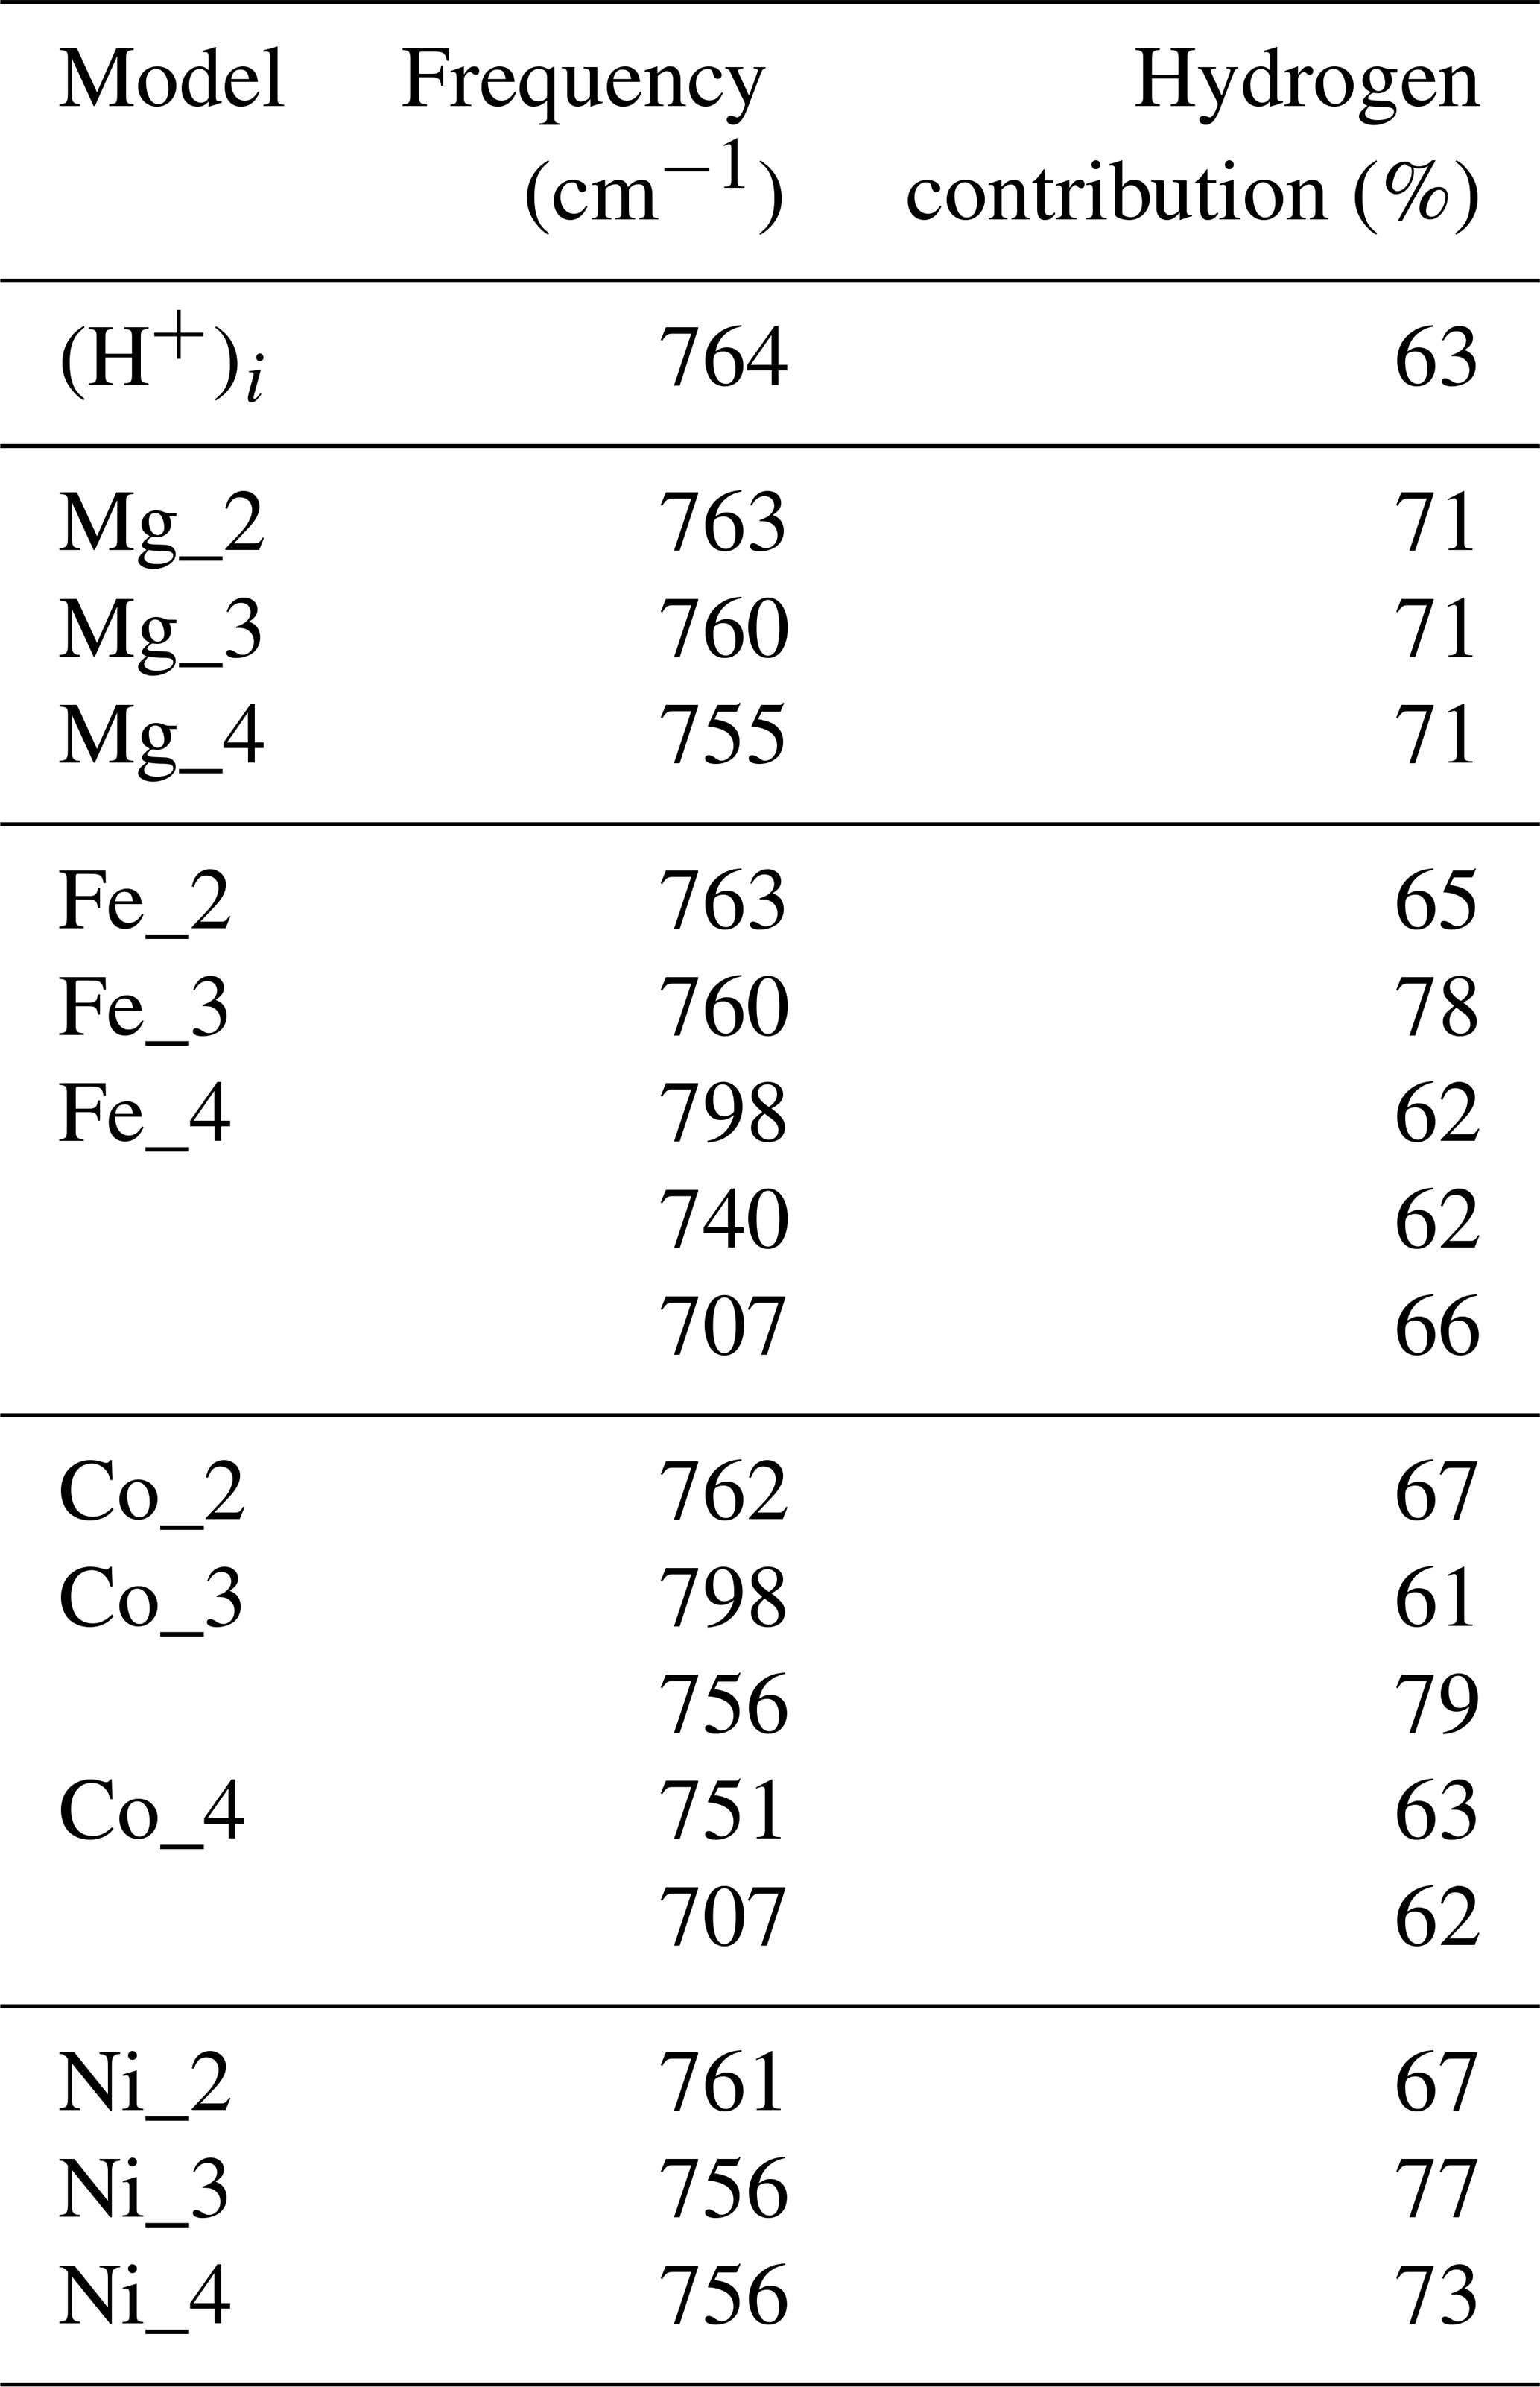
The orientation and length of the OH groups in the whole series of models are generally close to those determined for the (H+)i model, with theoretical bond lengths between 0.99 and 1.015 Å. Variations in the OH bond length are correlated to variations in the OH stretching frequency (Fig. 2a), as previously observed (e.g. Jollands et al., 2020; Balan, 2020). Most of the theoretical OH stretching frequencies range between 2900 and 3200 cm−1, corresponding to the range expected for OH groups involved in medium-strength H bonds (Nibbering et al., 2007). The theoretical bending frequencies occur between 1000 and 1400 cm−1 (δ mode) and between 800 and 1100 cm−1 (γ mode). They broadly decrease as a function of the stretching frequencies of OH groups (Fig. 2b). Interestingly, some of the configurations also display theoretical vibrational modes at lower frequency involving a significant contribution (up to 79 %) of the hydrogen displacement coupled to a vibrational mode of the corundum host, similar to that observed in the (H+)i model (Table 2). It is noteworthy that this type of mode does not appear in all the configurations and should be highly sensitive to the respective vibrational properties of the molecular impurity and of the crystal host.
Table 2Vibrational modes of the (H+)i and Mg, Fe, Co and Ni models at frequencies above 700 cm−1 and displaying a coupled contribution of the hydrogen atom accounting for more than 60 % of the norm of the atomic displacement vector. Some of these modes are expected to lead to the second overtone bands observed between 2100 and 2400 cm−1 in the corresponding spectra.
The theoretical absorption coefficient of the stretching modes (Fig. 2c, Table 1) roughly decreases as a function of the stretching frequency, which is consistent with the general properties of OH groups in minerals and crystalline solids, as determined from experimentation (Libowitzky and Rossman, 1997) or theory (Balan et al., 2008). This variation in the theoretical absorption coefficient is related to the variation in the magnitude of the Born effective charge tensor of hydrogen along the H-displacement direction, which increases as a function of the H-bond strength (Balan et al., 2008). One of the configurations (Fe_3 configuration, Table 1) however combines a relatively low theoretical absorption coefficient and low theoretical stretching frequency (Fig. 2c). In this configuration, the substituting Fe2+ cation occupies a lateral position with respect to the OH group (Fig. 1).
For most of the models, the theoretical infrared absorption related to stretching modes is stronger for an incident-light polarisation parallel to the [001] direction (Fig. 2d). The Θspectro angle ranges between 25 and 50∘, with some configurations exhibiting a more significant canting with respect to the [001] direction. Due to the low symmetry of the local environment of the OH group (Fig. 1) and related anisotropy of the Born effective charge tensor, the Θspectro angle can differ from the Θstretch angle. For most of the models, the difference is small, not exceeding 10∘(Fig. 2d). The Fe_3 configuration is anomalous, with a Θspectro angle of 86∘, corresponding to a polarisation almost perpendicular to the [001] direction, and a Θstretch angle indicating a canting of only 54∘. This discrepancy can be traced back to a relatively large off-diagonal element (0.45 electron charge) which counterbalances the contribution of the diagonal (0.74 electron charge) element to the polarisation change induced by the longitudinal displacement of the hydrogen. As the Born effective charges are dynamical charges accounting for the changes in the electronic structure related to atomic displacements (e.g. Ghosez et al., 1998), the anomalous behaviour observed in the Fe_3 configuration suggests a significant electronic interaction between the nearby Fe2+ cation and the hydrogen atom.
3.2 Discrepancies between theoretical and experimental frequencies: calculated properties of benchmark systems
Theoretical and experimental frequencies are not expected to match perfectly due to the many approximations used in the theoretical modelling. These discrepancies can be assessed using two “benchmark” systems – water and diaspore (AlOOH), which suggest that the theoretical frequencies are affected in a systematic manner (Fig. 3).
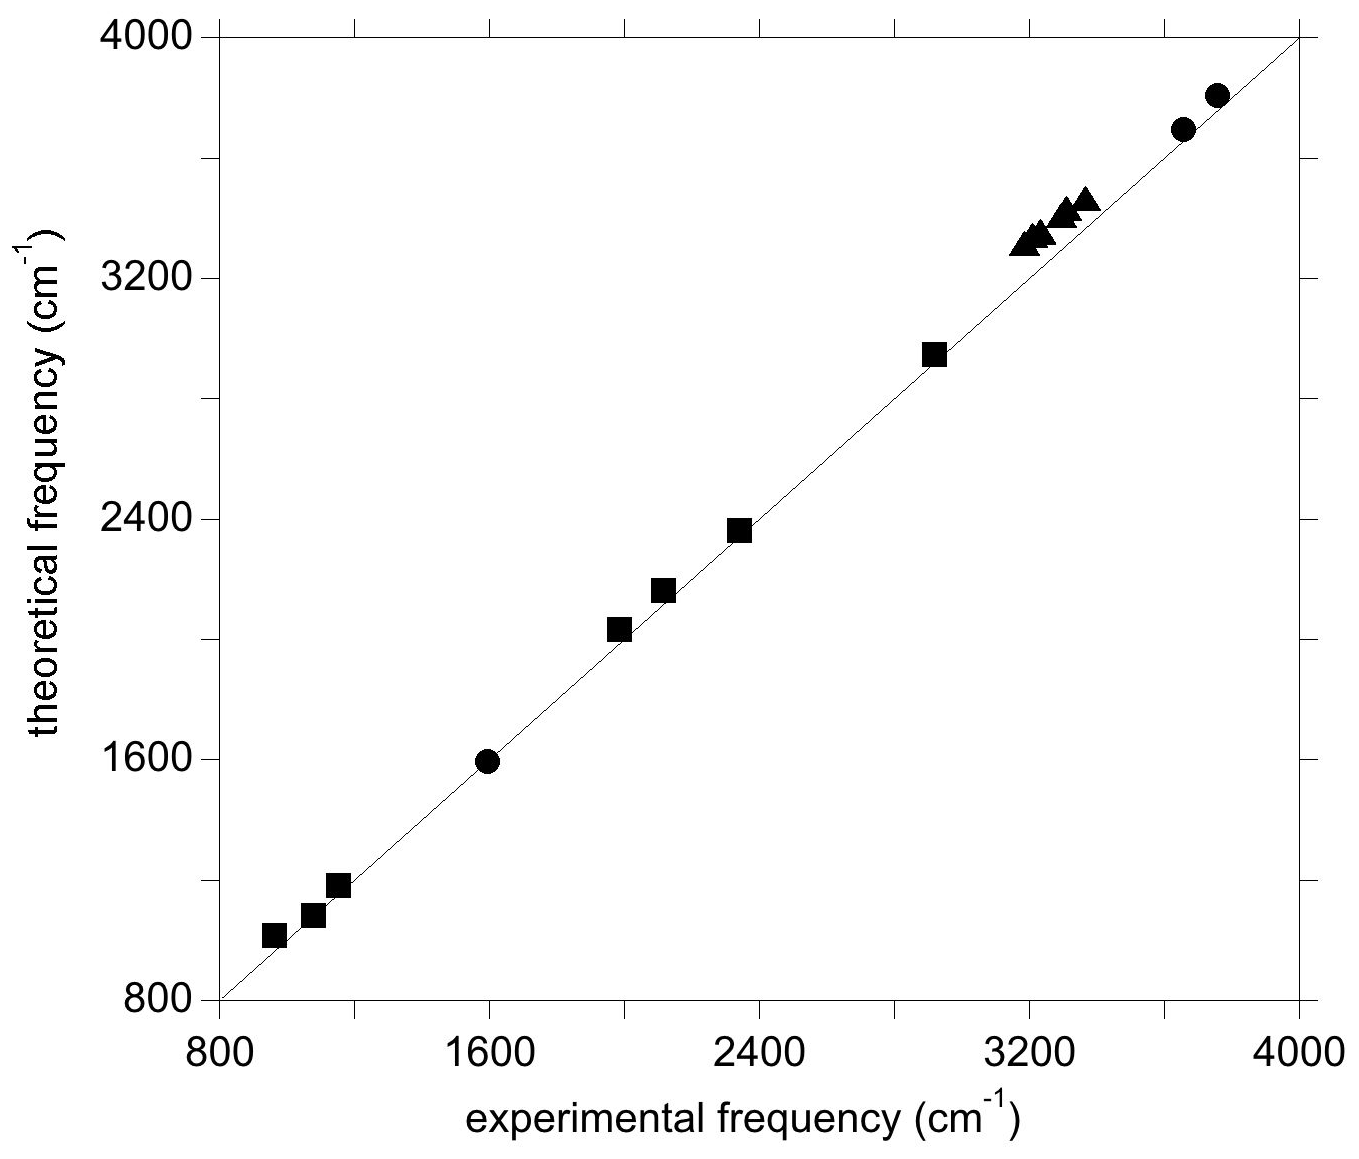
Figure 3Theoretical vs. experimental vibrational frequencies of water (circles), diaspore (squares), and OH-bearing Al vacancies associated with Ti in corundum from Balan (2020) (triangles).
For the isolated water molecule, the theoretical harmonic OH stretching frequencies are a few dozens of wavenumbers higher than their experimental counterparts (Table S1 in the Supplement). This confirms the approximate cancellation of errors arising from the use of the PBE exchange–correlation functional and the neglect of anharmonicity (Balan et al., 2007). Compared with the stretching modes, the theoretical frequency of the H2O bending mode is closer to its experimental counterpart (Table S1). Calculations performed on diaspore (AlOOH), which displays medium-strength hydrogen bonds, lead to an OH stretching frequency at ∼2920 cm−1 and OH bending frequencies between 960 and 1153 cm−1 (Table S2). The experimental OH stretching band is significantly broadened (>200 cm−1) by anharmonic interactions even in highly ordered samples, whilst the bending bands are less affected (Delattre et al., 2012). A rough comparison indicates that the theoretical frequencies overestimate those of experimental bands by less than 60 cm−1. The diaspore spectrum also displays several bands between 1980 and 2340 cm−1 whose frequencies are about twice that of the fundamental bending bands and which have been interpreted as two-phonon excitations involving the OH bending modes (Stegmann et al., 1973; Kohler et al., 1997; Delattre et al., 2012). Although not fully explained, their anomalous intensity is likely related to a stronger anharmonic character stemming from the significant hydrogen bonding in diaspore (Kohler et al., 1997). Notably, the experimental frequencies of these bands are within 50 cm−1 of those obtained by multiplying the fundamental theoretical frequency of the IR-active OH bending modes by 2 (Table S2, Fig. 3). Previous investigations of OH defects into corundum (Fig. 3) and quartz have shown similar agreement between theoretical and experimental frequencies, where theoretical OH stretching frequencies were found to overestimate their experimental counterparts by ∼10 to ∼130 cm−1 (e.g. Jollands et al., 2020; Balan, 2020).
3.3 Assignment of vibrational bands associated with divalent cations
The room temperature spectra of synthetic sapphire containing Mg2+, Ni2+ and Co2+ ions, along with hydrogen, display a broad band at ∼3000 cm−1 and a series of well-defined bands at lower frequency (Müller and Günthard, 1966; Volynets et al., 1972; Ramírez et al., 1997; Fukatsu et al., 2003).
Table 3Theoretical and experimental OD stretching frequencies. Experimental frequencies were assessed from Müller and Günthard (1966) for Co and Ni and from Ramírez et al. (1997) for the Mg-doped sample.
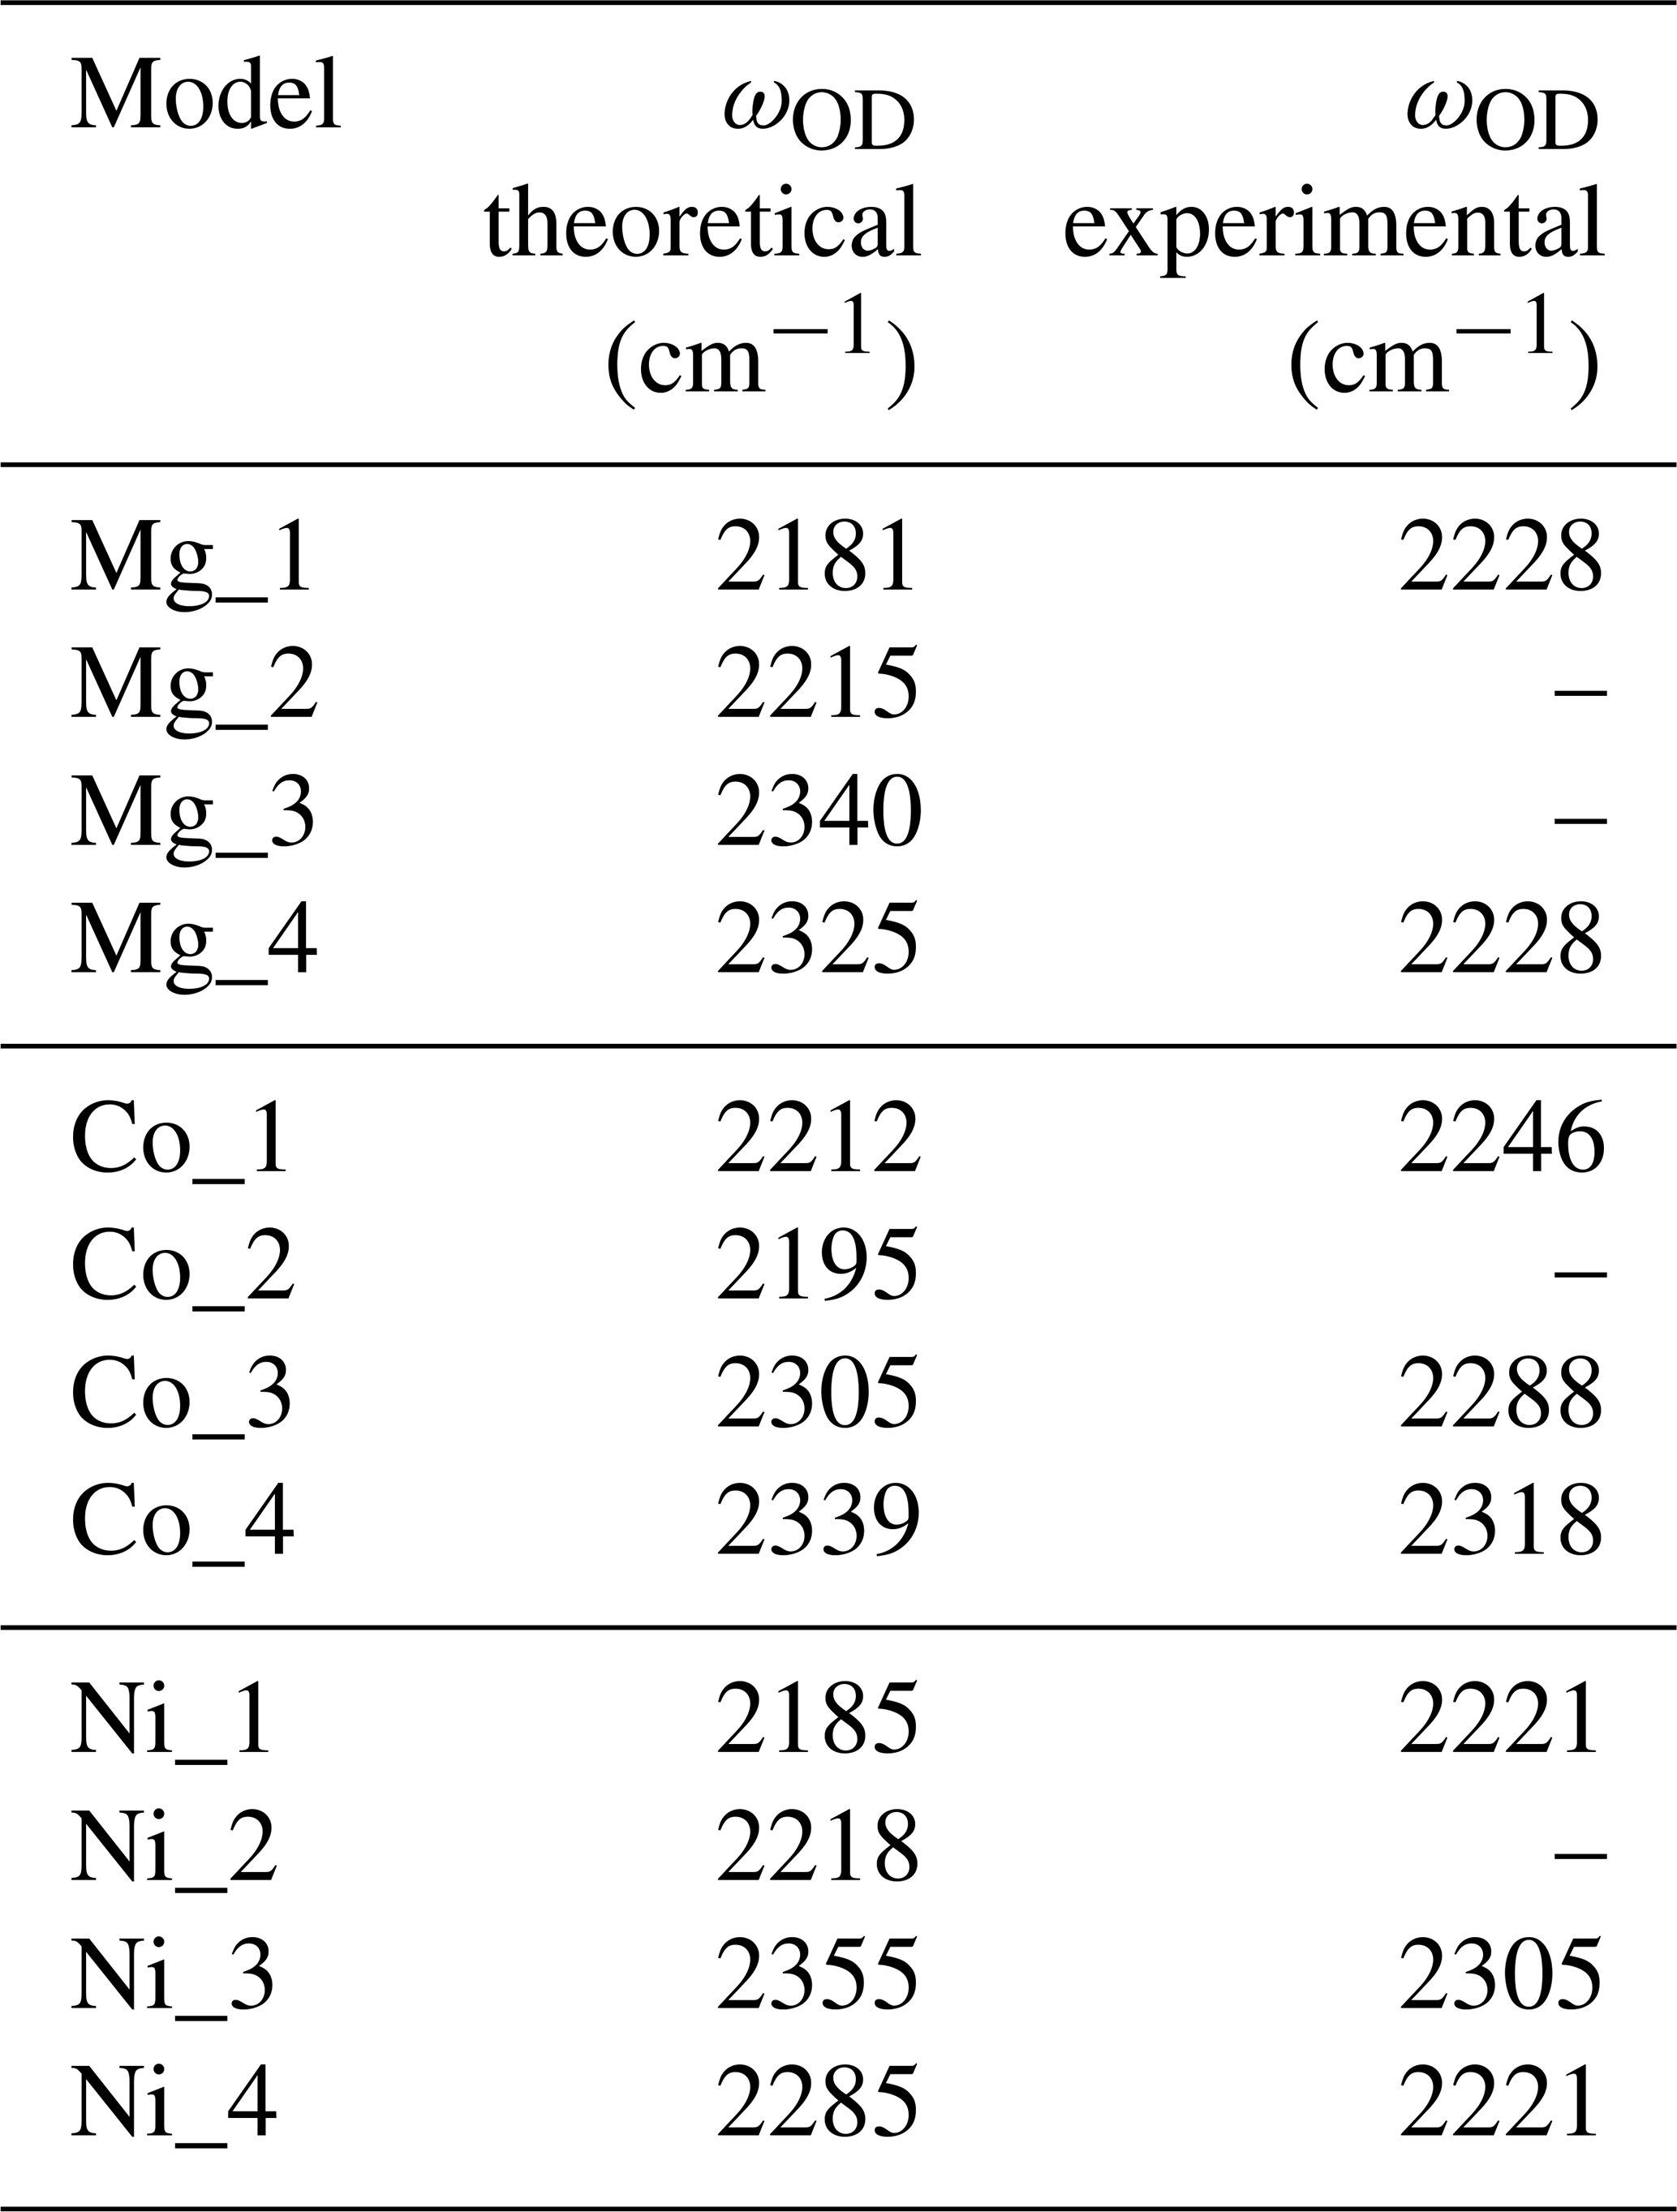
When attempting to assign such bands to a given defect, it is important to note that, in cases of significant hydrogen bonding, the OH stretching bands are frequently affected by interactions with lower-frequency modes. This leads to their broadening and modification of their shapes (e.g. Nibbering et al., 2007). For this reason, it is not straightforward to assign the OH stretching bands to specific configurations of OH groups. In comparison, the narrower OD bands can be more easily related to specific models (Table 3), which then helps to guide assignment of OH bands.
Another challenge is that the composition of synthetic samples is not fully documented. This is problematic as hydrous defects can be associated with chemical impurities at very low concentration levels. For example, the Verneuil samples investigated by Beran (1991) and the Fe-doped sample of Eigenmann and Günthard (1971) display the “3309 cm−1 series” of bands related to the occurrence of OH groups associated with Al vacancies and charge-compensating Ti4+ cations (Moon and Phillips, 1991, 1994; Balan 2020). This may explain why the spectrum of the Fe-doped sample investigated by Eigenmann and Günthard (1971) significantly differs from that of the Co- and Ni-doped samples, whilst those of the Fe-doped, Fe : Ti-doped and Ti-doped samples are similar.
However, despite these issues, attempts are made to assign the experimentally observed bands to specific defect configurations, using evidence from both DFT modelling and analyses of correlations in band areas between multiple experimental spectra.
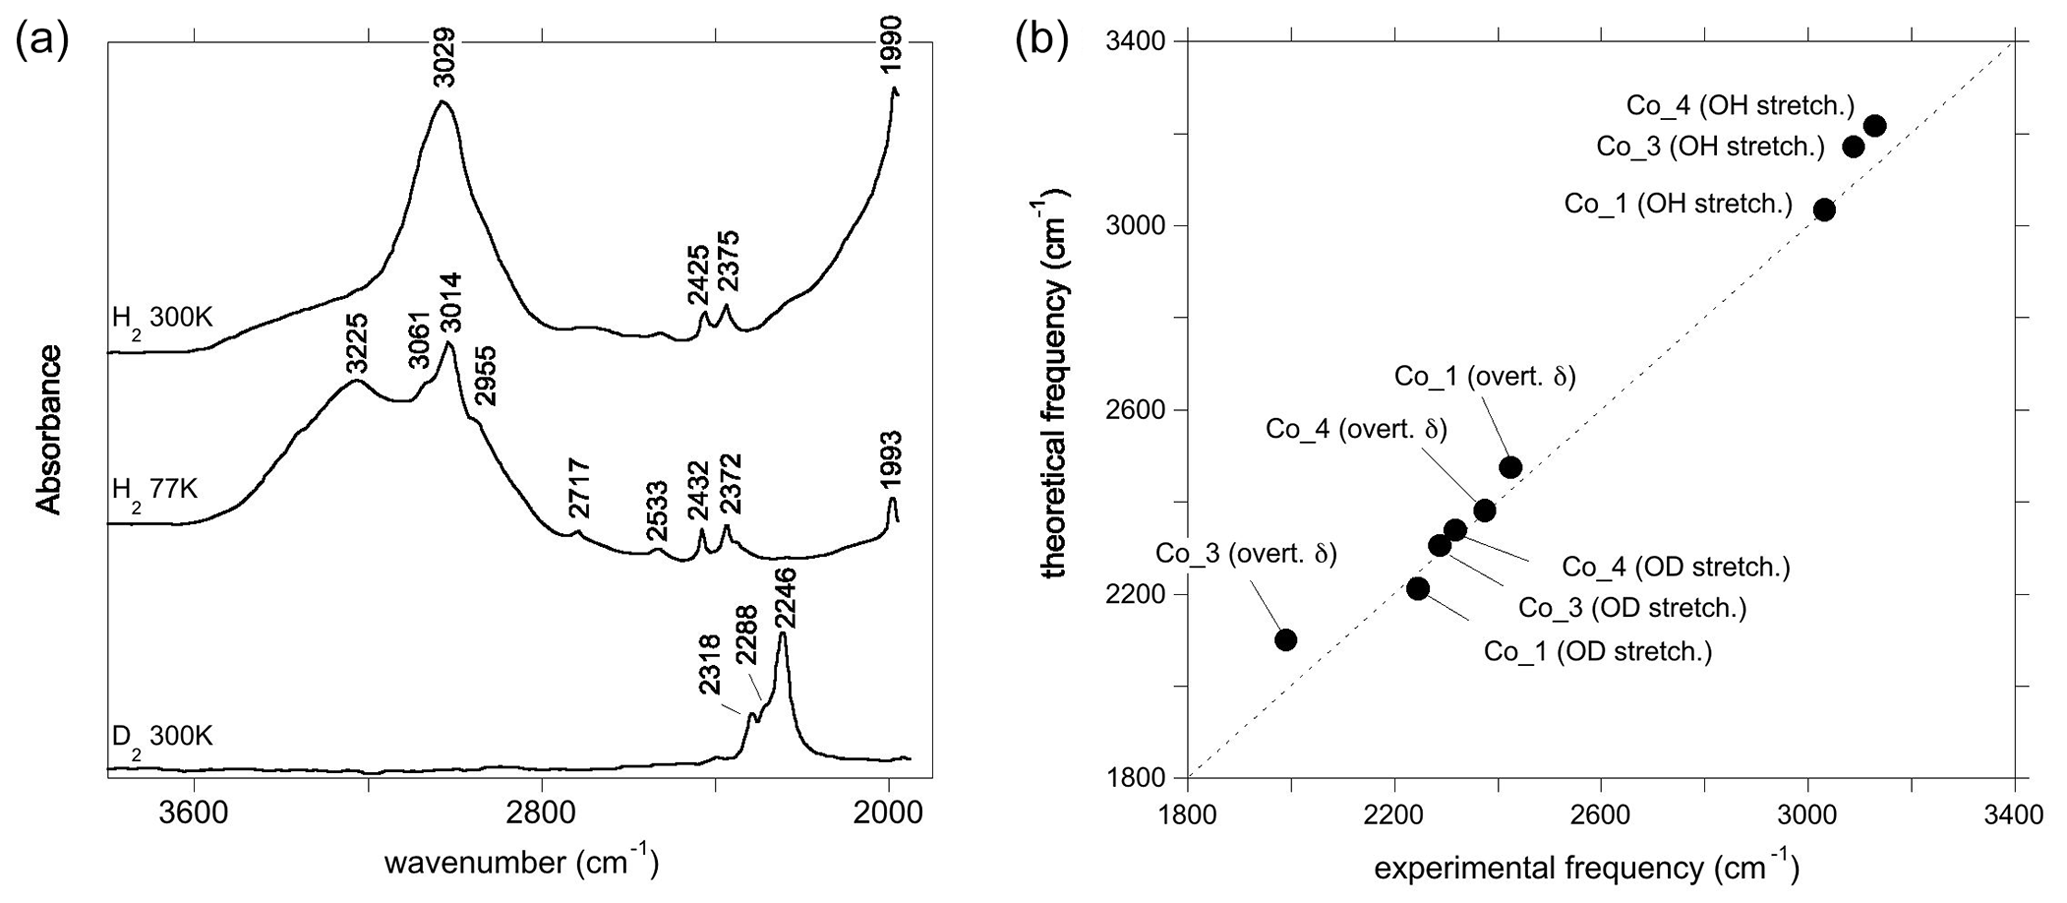
Figure 4(a) Experimental spectra of Co2+-bearing corundum from Müller and Günthard (1966). H2 and D2 refer to the gases in which Co3+ was reduced. The values 300 and 77 K refer to the temperature at which the spectra were recorded. These spectra were digitised from the original publication, so band positions may be inaccurate. (b) Comparison of theoretical with experimental frequencies. The experimental Co_4 and Co_3 stretching frequencies have been inferred from the position of OD bands. OH stretch: OH stretching frequency; OD stretch: OD stretching frequency; overt. δ: first overtone of δ bending modes (Table 1).
3.3.1 Cobalt
The room temperature spectrum of Co-doped synthetic sapphire (Fig. 4a) displays a broad band at ∼3029 cm−1, as well as narrower and weaker bands at 2530, 2425, 2375 and 1990 cm−1 (Müller and Günthard, 1966). Here and in the following, wavenumbers have been determined from digitised spectra; therefore peak positions may be inaccurate. At 77 K, the band at 3029 cm−1 splits into three narrower components at 3061, 3014 and 2955 cm−1 and a narrower band is observed at 2717 cm−1. An additional broad band at 3225 cm−1 in the 77 K spectrum is likely related to ice in the low-temperature cell (Fig. 4a). The OD bands are observed at ∼2318, ∼2288 and ∼2246 cm−1. Assuming that the ratio of the OH to OD frequencies is 1.35, which is based on the value reported for an Mg-doped sample by Ramírez et al. (1997), these bands would correspond to OH stretching frequencies at 3129, 3089 and 3032 cm−1, respectively. Based on their relative frequencies, the three OD bands can be ascribed to the Co_4, Co_3 and Co_1 configurations, respectively (Table 3, Fig. 4b). The corresponding bands are not resolved in the broad OH stretching band centred at 3029 cm−1, although the band appears to be asymmetric, suggesting that it may be composed of multiple individual bands, with a major component at 3029 cm−1. The 3029 cm−1 experimental frequency is close to that theoretically inferred for the Co_1 configuration. This suggests that this configuration is dominant, which is consistent with the relative stability of the Co-bearing configurations (Table 1). Regarding the lower-frequency bands, the experimental 2425 and 2375 cm−1 bands approximately match the theoretical harmonic frequencies of the first overtone of the δ bending modes of the more stable Co_1 and Co_4 configurations (Table 1), whilst the experimental 1990 cm−1 band (Fig. 4a) could be related to the overtone of the δ bending mode of the Co_3 configuration (Fig. 4b). This interpretation is consistent with the occurrence of the three configurations inferred from the analysis of the OD bands. Using the same interpretative framework, the 2955, 2717 and 2533 cm−1 bands, present in the Müller and Günthard (1966) 77 K spectrum (Fig. 4a), could correspond to the second overtones of the Co_1 δ, Co_3 γ and Co_4 γ bending modes, respectively, enhanced by their interaction with the fundamental OH stretching excitation.
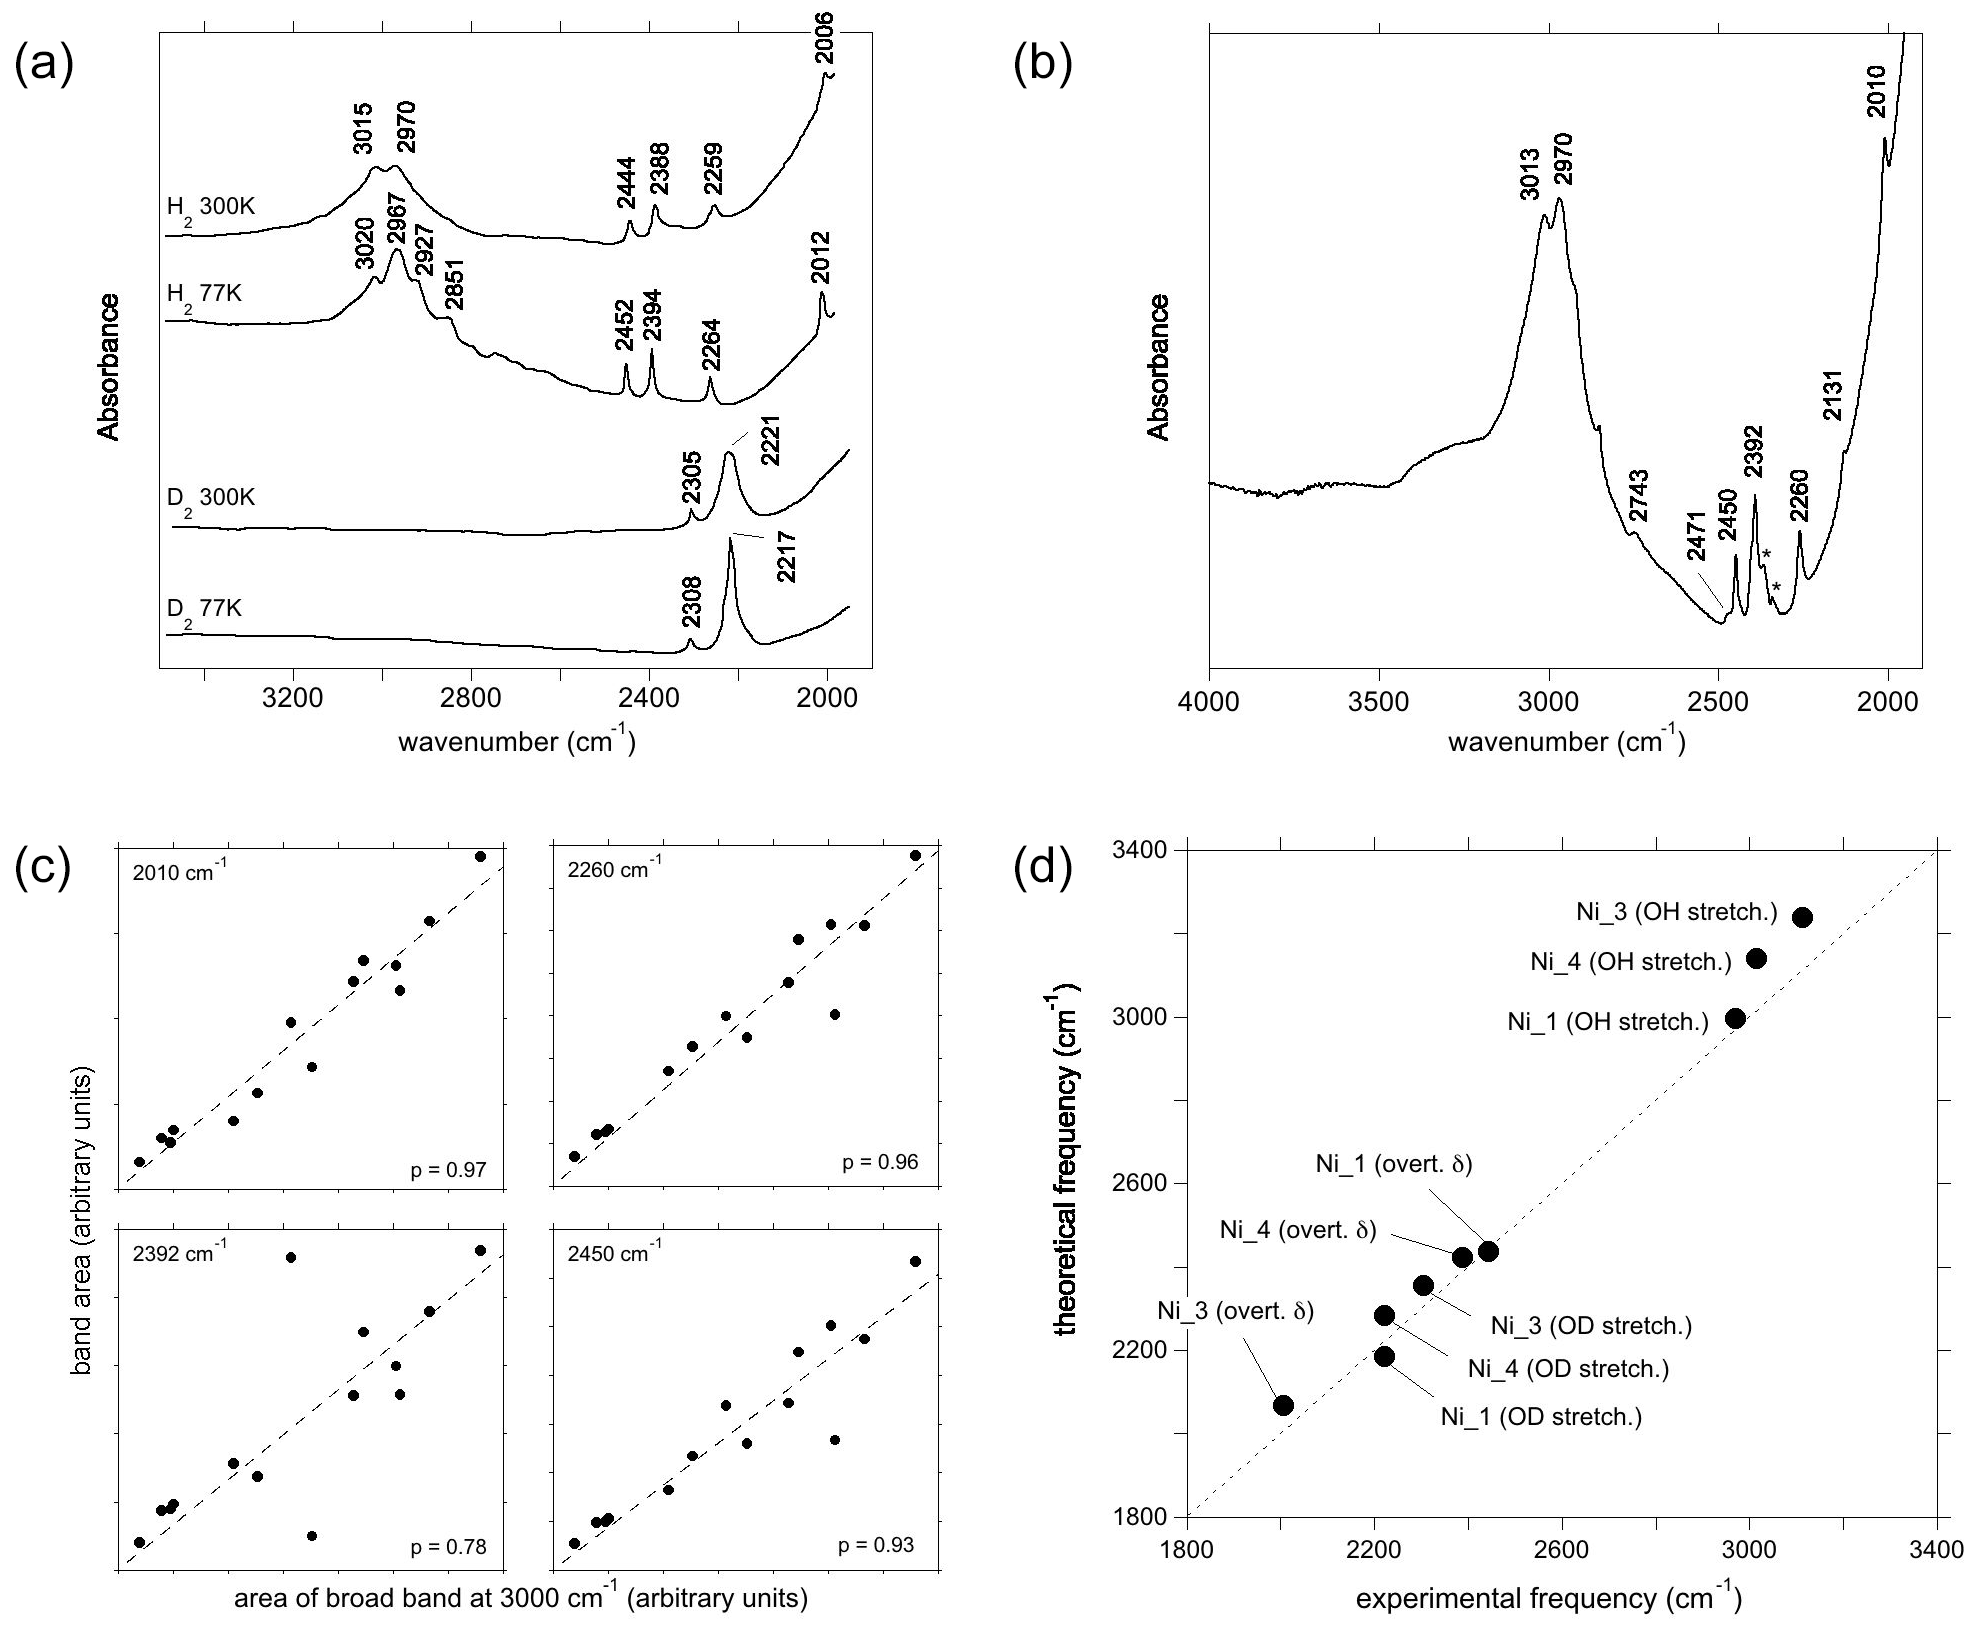
Figure 5(a) Experimental spectra of Ni2+-bearing corundum, synthesised by Ni3+ reduction, from Müller and Günthard (1966). H2 and D2 refer to the gases in which Ni3+ was reduced. The values 300 and 77 K refer to the temperature at which the spectra were recorded. These spectra were digitised from the original publication, so band positions may be inaccurate. (b) Spectrum of a synthetic Ni-bearing sample from the GIA database. The asterisks denote artefactual bands related to atmospheric CO2. The positions in this spectrum are taken as the correct positions; e.g. 3015 cm−1 in (a) is equivalent to 3013 cm−1 in (b). (c) Selected correlations of the areas of some low-frequency bands with the area of the broad OH stretching band centred at ∼3000 cm−1, along with their Pearson's correlation coefficient (p) values and linear regressions. (d) Comparison of theoretical with experimental frequencies. Labels as in Fig. 4b. The experimental Ni_3 stretching frequency has been inferred from the position of the OD band.
3.3.2 Nickel
The main band at ∼3000 cm−1 is split in the room temperature spectrum of Ni-doped corundum (Fig. 5a), with two maxima experimentally observed at ∼3015 and ∼2970 cm−1 (Müller and Günthard, 1966). This doublet is also observed in the 14 spectra from high-Ni synthetic sapphires recorded at the GIA (Fig. 5b), which show maxima positions from 3012 to 3016 cm−1 and from 2966 to 2972, respectively. Additional contributions are resolved at 2927 and 2851 cm−1 at 77 K.
Two OD bands (Fig. 5a) are observed at ∼2305 and ∼2221 cm−1, which would correspond to OH stretching frequencies of 3112 and 2998 cm−1, respectively. The 2998 cm−1 frequency falls between the two experimental bands at ∼2970 and ∼3015 cm−1. Comparing experimental and theoretical frequencies (Table 1), these two OH stretching bands can be ascribed to the Ni_1 configuration and the slightly less stable Ni_4 configuration, respectively, whilst the corresponding OD bands are not resolved in the experimental peak at 2221 cm−1 (Table 3). The peak inferred from the OD band at 3112 cm−1 is not resolved in the OH stretching spectrum but could contribute to the high-frequency tail of the broad OH stretching band. Considering its higher frequency, an inferred 3112 cm−1 band would correspond to the Ni_3 configuration (Fig. 5d).
Considering the lower-frequency region, Müller and Günthard (1966) presented a spectrum showing bands at 2444, 2388, 2259 and 2006 cm−1 (Fig. 5a). The 14 spectra from the GIA database show bands at 2010, 2131, 2260, 2392, 2402 (weak), 2450, 2471 and 2743 cm−1 (the frequencies are those determined from the spectrum reported in Fig. 5b). As the positions of the Müller and Günthard (1966) bands were extracted from a spectrum digitised from a scanned document, it is likely that their 2444, 2388, 2259 and 2006 cm−1 bands correspond to the bands at 2450, 2392, 2260 and 2010 cm−1 in the GIA spectrum (Fig. 5b). The latter positions are assumed to be correct herein. From the 14 GIA spectra, Pearson's correlation coefficients (p) between the area of the main band comprising the ∼2970 and ∼3015 cm−1 doublet and the low-frequency bands are as follows: 2010 cm−1, p=0.97; 2131 cm−1, p=0.71; 2260 cm−1, p=0.96; 2392 cm−1, p=0.79; 2402 cm−1, p=0.59; 2450 cm−1, p=0.93; 2471 cm−1, p=0.86; and 2743 cm−1, p=0.96. The strong correlations between the main band and the 2010, 2260 and 2450 cm−1 bands are consistent with these bands being present in the Müller and Günthard (1966) 300 K spectrum, although the 2392 cm−1 band, observed in the latter, shows a relatively weak correlation (Fig. 5c). It is possible that the poorer correlation is due to the proximity of this band to the signal associated with atmospheric CO2 in routine FTIR measurements, which complicates baseline subtraction.
The two narrow bands at 2450 and 2010 cm−1, which are both present in the Müller and Günthard (1966) spectrum (Fig. 5a) and show strong correlations with the main band in the spectra from the GIA database, can be assigned to the first overtone of the δ bending modes of the Ni_1- and Ni_3-bearing models, respectively (Fig. 5d). The theoretical position of the first overtone of Ni_4 is 2423 cm−1, which would be consistent with the 2392 cm−1 experimental band, although the correlation is less strong than for the 2450 and 2010 cm−1 bands.
The assignment of the 2260, 2471 or 2743 cm−1 experimental bands is not straightforward. Their strong correlations suggest that they are related to defects associating Ni and H atoms and rule out a potential assignment to another impurity. In addition, their systematic occurrence and limited number suggest that they are related to some of the four neutral configurations investigated (Table 1) as the location of the H atom on other oxygen anions would lead to significant overbonding. Therefore, and as for the Co-doped samples, these bands most likely correspond to higher-order overtones of vibrational modes involving the hydrogen atom. In particular, the experimental 2260 cm−1 band is consistent with the frequency of the second overtone of the theoretical mode at 756 cm−1 (second overtone at 2268 cm−1), which occurs in both the Ni_3 and the Ni_4 configurations and displays an unexpectedly large hydrogen contribution in its atomic displacement vectors (Table 2). The properties of such a specific mode depend on the respective properties of the crystal host and molecular impurity. Although no clear explanation for its absence in the spectrum of the Co-doped sample of Müller and Günthard (1966) can be proposed, it is not unlikely that the difference between the Ni and Co spectra is related to small variations in vibrational properties that are not perfectly reproduced in the theoretical models.
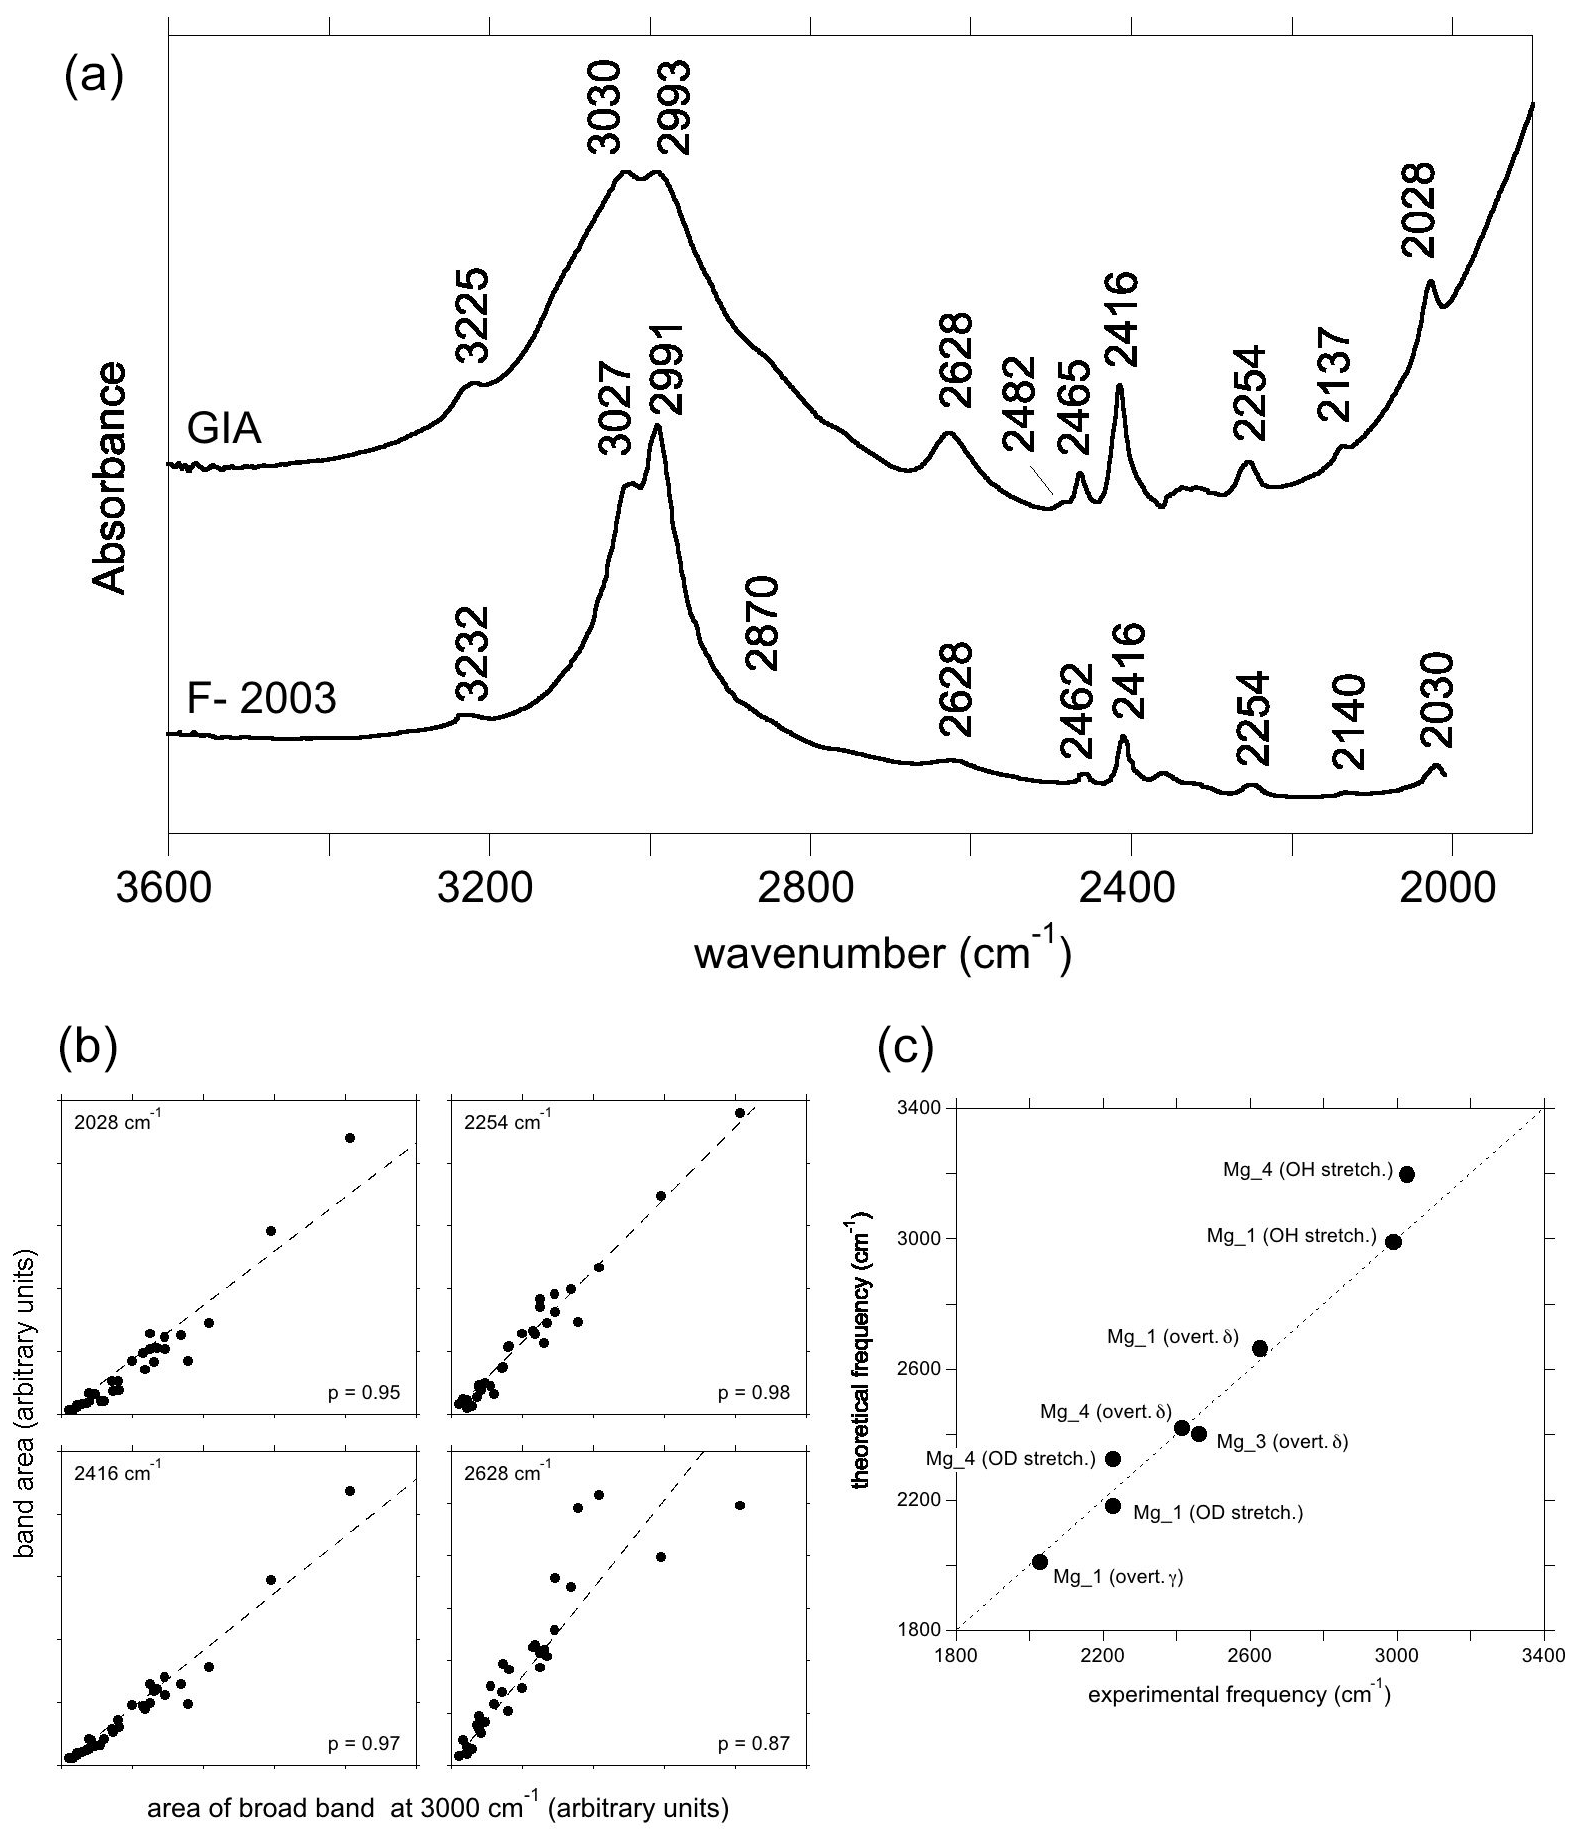
Figure 6(a) Experimental spectra of Mg2+-bearing corundum from Fukatsu et al. (2003) (bottom) and from the GIA database (top). The lower spectrum was digitised, so positions may be inaccurate. The positions in the top spectrum are taken to be correct; e.g. 2137 and 2993−1 in the top spectrum are equivalent to 2140 and 2991 cm−1 in the lower spectrum. (b) Selected correlations of the area of the low-frequency bands with that of the broad OH stretching band centred at ∼3000 cm−1, as in Fig. 5c. (c) Comparison of theoretical with experimental frequencies. Labels as in Fig. 4b, with the addition of overt. γ (first overtone of the γ bending mode).
3.3.3 Magnesium
Similar to, but offset from, the Ni-doped sample, a broad band centred at ∼3000 cm−1, with maxima at 3027 and 2991 cm−1, is observed in the infrared spectrum of the Mg-doped sample investigated by Fukatsu et al. (2003) with an additional weaker band at 3232 cm−1 (Fig. 6a). The main band is stronger when the electric field is parallel to the [001] direction (Volynets et al., 1972; Fukatsu et al., 2003). An OD band at ∼2228 cm−1 with a width of 56 cm−1 was reported by Ramírez et al. (1997). Its frequency and width are consistent with the two OH stretching bands experimentally observed at 3027 and 2991 cm−1 by Fukatsu et al. (2003). Following the assignments proposed for the Ni- and Co-doped samples, these two OH stretching bands can be assigned to the two most stable configurations, Mg_4 and Mg_1 (Table 1).
The lower-frequency bands in the hydrogenated Mg-doped sample are reported at 2030, 2140, 2254, 2416 and 2462 cm−1, and a broader one is reported at 2628 cm−1 (Fukatsu et al., 2003). The GIA spectra show the same bands, as well as small bands at 2482 and 2567 cm−1, the former being a shoulder on the stronger 2462 cm−1 band (Fig. 6a). The experimental bands at 2028, 2254, 2416 and 2628 cm−1 are well correlated to the main band at ∼3000 cm−1 (Fig. 6b).
Considering that the Mg_1 model has the greatest stability and based on its frequency, the experimental band at 2628 cm−1 is ascribed to the δ OH bending overtone of the Mg_1 configuration (Table 1, Fig. 6c). Its broadening suggests a more significant coupling of the fundamental OH stretching transitions with the bending overtones when both frequencies begin to overlap. The experimental band at 2028 cm−1 matches the overtone of the γ OH bending mode of the Mg_1 configuration (Table 1), whilst the 2416 cm−1 band would correspond to the overtone of the δ OH bending mode of the Mg_4 configuration. As with the Ni-doped corundum, the band at 2254 cm−1 is likely related to the second overtone of the coupled mode with significant hydrogen contribution calculated at 755 cm−1 for the Mg_4 configuration (Table 2).
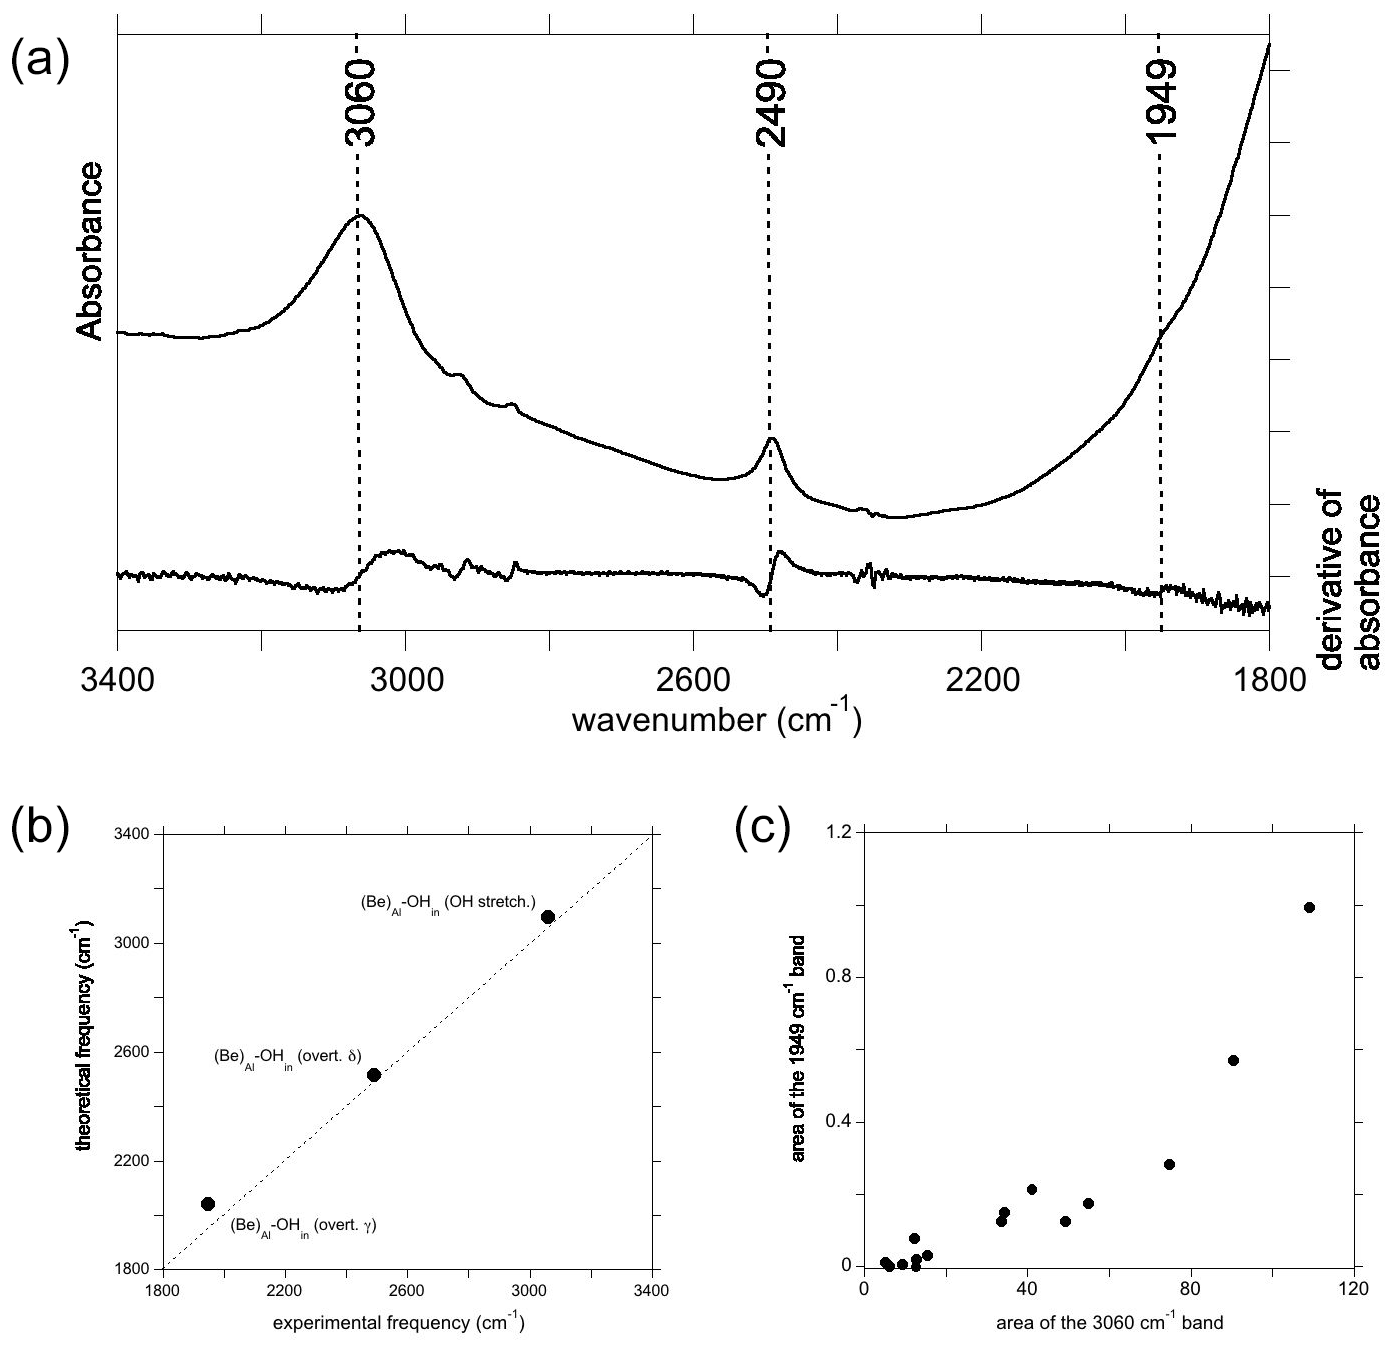
Figure 7(a) Spectrum recorded from a Be2+-bearing corundum from the GIA database, along with the first derivative of the spectrum, used for identifying the presence of a band at 1949 cm−1. (b) Comparison of theoretical with experimental frequencies, labels as in Figs. 4b and 6c. (c) Correlation of the area of the band at 1949 cm−1 with that of the OH stretching band at 3060 cm−1.
3.3.4 Beryllium: a reappraisal
Experimental spectra of sapphires treated by Be diffusion sometimes display a broad band at ∼3060 cm−1 with a dominant polarisation parallel to the [001] direction. This band is usually associated with a band at 2490 cm−1, which has similar pleochroism and is most likely also related to a Be-bearing defect (Fig. 7a). Theoretical modelling of Be incorporation in corundum provided strong support for the assignment of the 3060 cm−1 band to the OH stretching mode of an electrostatically neutral defect in which the Be occupies the basal plane of an Al vacant site and an OH group, related to the coupled incorporation of hydrogen, forming a H bond along the edge of the vacant site ((Be)Al–OHin) (Jollands and Balan, 2022). The formation of short Be–O bonds and location of the Be atom on the basal plane of the Al site, which is also consistent with the theoretical findings of Futazuka et al. (2020), lead to a different local configuration of the hydrous defect compared to that observed for the incorporation of the other divalent cations. The various configurations of this defect have been theoretically investigated in Jollands and Balan (2022), and only the most stable one is considered here. Based on a comparison with other X–H vibrational frequencies and on the theoretical properties of a Be–H model, the band at 2490 cm−1 was ascribed to the formation of Be–H groups (Jollands and Balan, 2022). Although the high-temperature Be treatment of corundum may be done in reduced conditions, which would also lead to the formation of Ti3+ ions in Fe–Ti sapphire (Rossi et al., 2022), the systematic presence of this band in samples presumably treated under different conditions was unclear. Considering the presence of absorption bands in the same frequency range as that associated with other divalent cations that are unlikely to form strong X–H bonds, the present theoretical results support the alternative assignment of the 2490 cm−1 band to a bending overtone of the (Be)Al–OHin configuration. This has a theoretical harmonic frequency of 2514 cm−1, very close to its experimental counterpart (Fig. 7b). Simply, contrary to the findings of Jollands and Balan (2022), Be–H bonds are not necessary to explain the 2490 cm−1 band. In this case, the lack of perfect correlation between the intensities of the main OH stretching band and 2490 cm−1 band could be related to the presence of other divalent cations in the samples belonging to the large database investigated by Jollands and Balan (2022), forming defects contributing to the broad band at 3000 cm−1. Finally, the overtone of the other bending mode (γ) of the (Be)Al–OHin model is predicted to occur at 2040 cm−1 (Table 1). A careful examination of the experimental spectra of Be-diffused samples revealed a weak feature at 1949 cm−1, which is broadly correlated to the main band at 3060 cm−1 (Fig. 7c) and occurs in an admissible frequency range (Fig. 7b). It is therefore most likely that this weak band, easily missed and previously not reported, correspond to the other bending overtone of the (Be)Al–OHin configuration. Its presence confirms the theoretical prediction and further supports the assignment of the FTIR spectroscopic features observed between 1900 and 2700 cm−1 in corundum to overtones of OH bending modes.
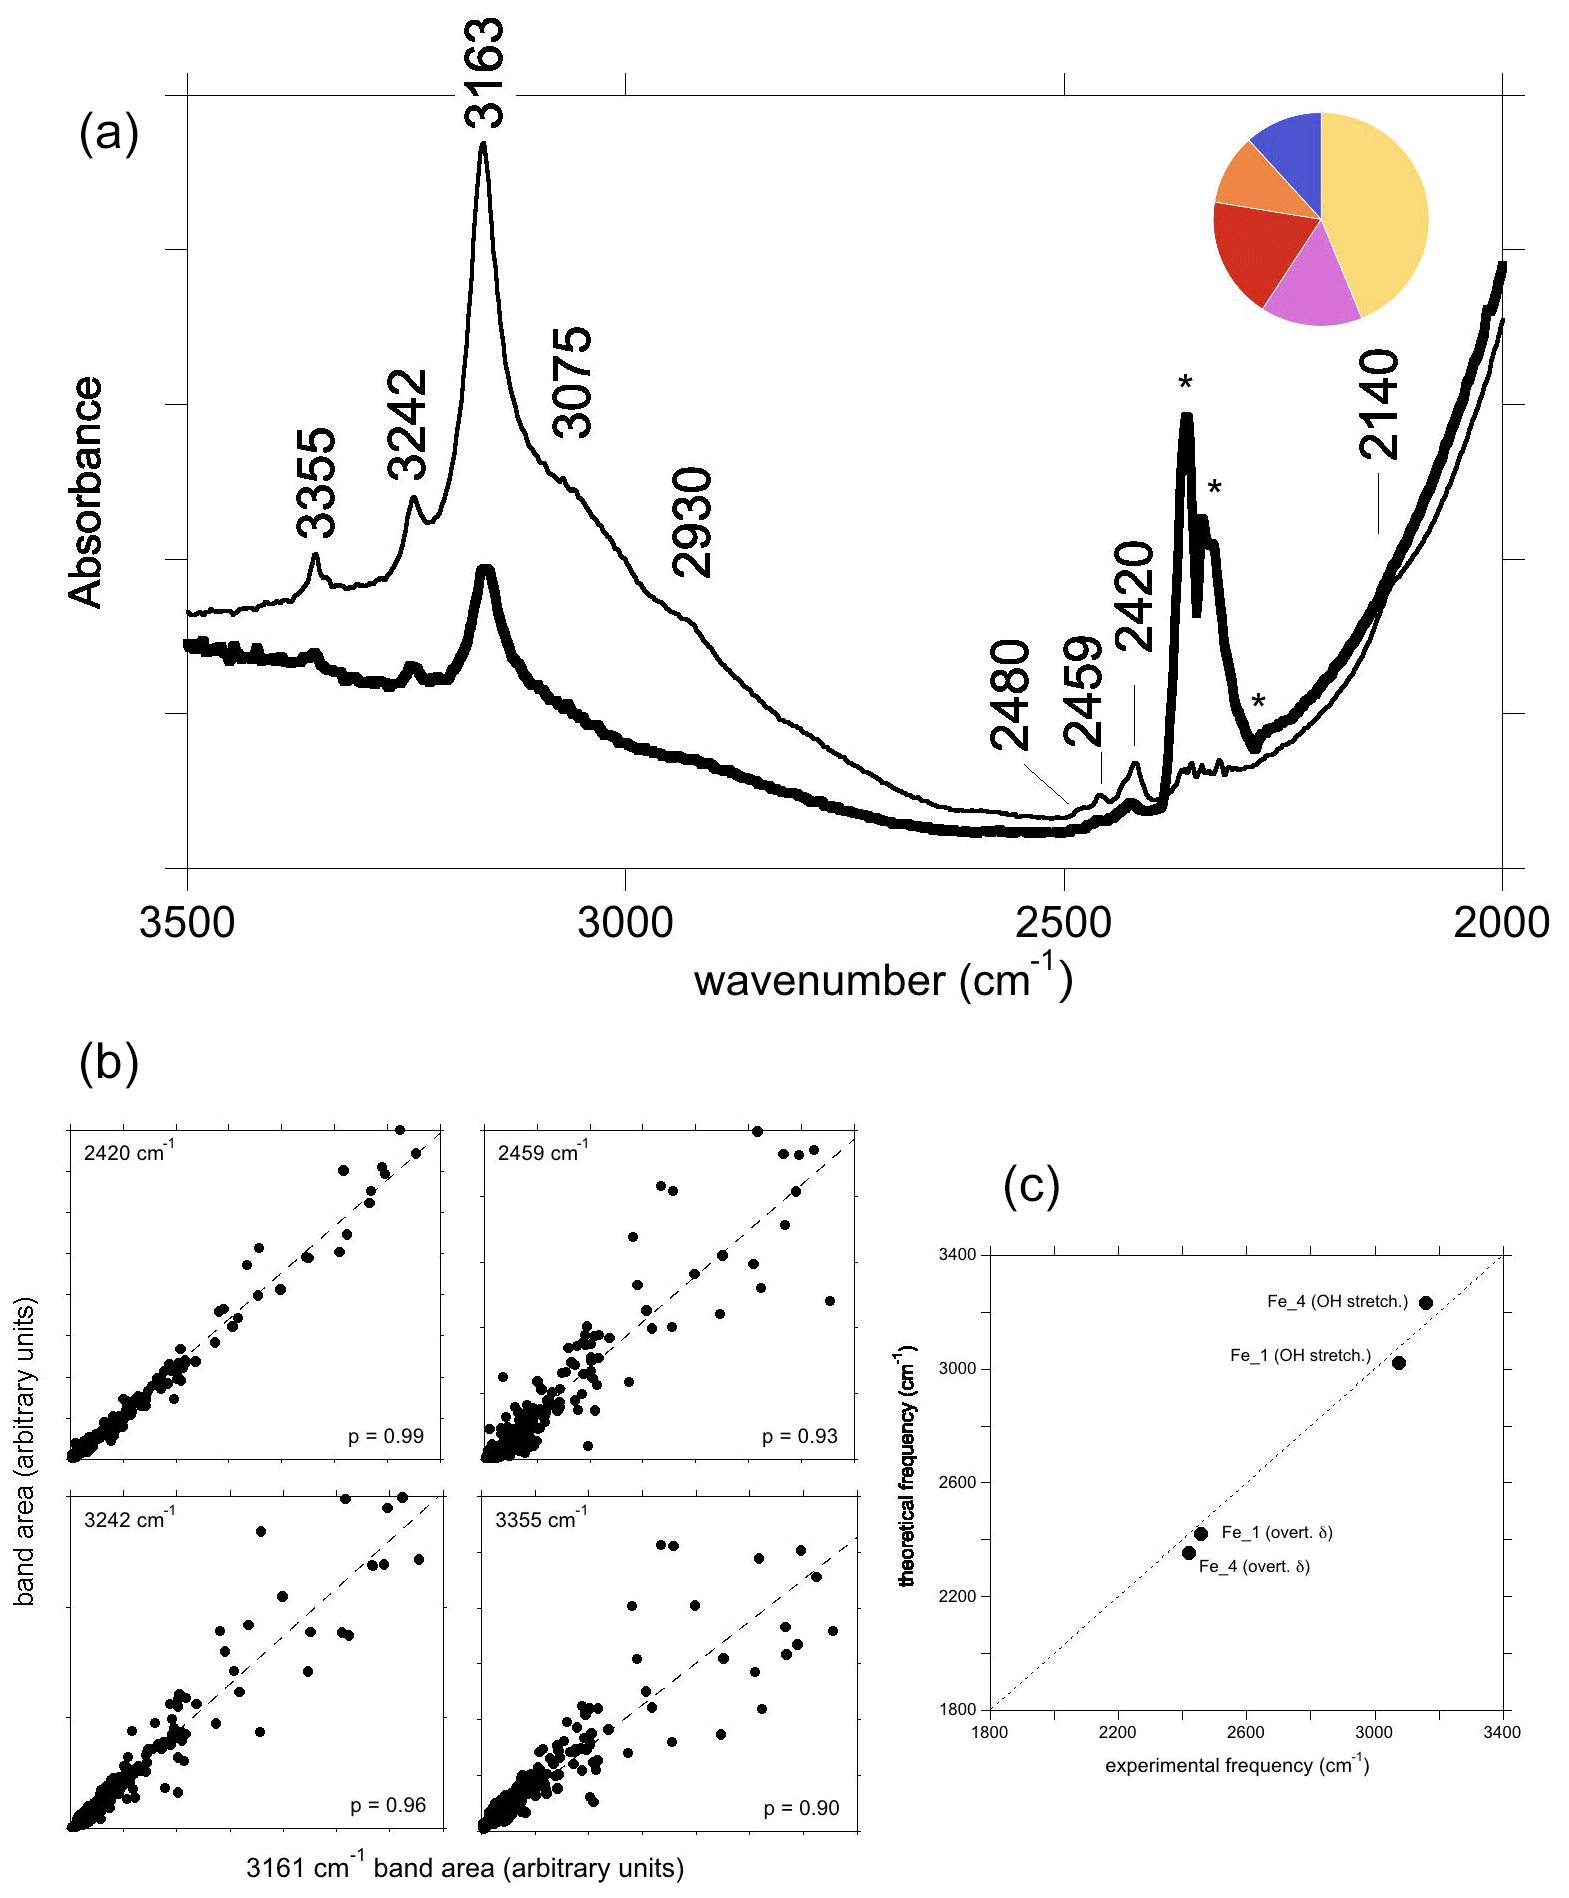
Figure 8(a) Spectrum of natural yellow sapphire (YS-1) from Sri Lanka for a beam polarisation approximatively parallel (thin line) or perpendicular (thick line) to the [001] direction. The asterisks denote artefactual bands related to atmospheric CO2. The inset is a simple colour pie chart showing the distribution of hues, describing crystals with the “3161 cm−1” band from the GIA database (∼15 000 samples). A majority are in the yellow–orange–red–pink range, and only a minority are blue. (b) Correlations of the area of selected bands with that of the 3161 cm−1 band. (c) Comparison of theoretical with experimental frequencies assuming that the observed bands are related to Fe2+ cations.
3.3.5 The “3161 cm−1” band
The infrared spectrum of the natural yellow sapphire (YS-1) sample (Fig. 8a) is similar to those reported by, for example, Smith and Van der Bogert (2006) and Choudhary and Vijay (2018). It displays three well-defined bands at 3163 cm−1 (herein referred to as the 3161 cm−1 band for consistency with the literature), 3242 and 3355 cm−1, with the former superimposed on a broader shoulder centred at around 3070–3100 cm−1. A small band at 3302 cm−1 is also present in the spectra from the GIA database. This type of spectrum may be encountered in Fe-rich and Ti-poor natural sapphires and some rubies. In terms of crystals analysed at laboratories of the GIA, the most common main hue for corundum containing this band is yellow, with red, pink, orange and blue hues comprising the remainder (Fig. 8a). The main bands have a stronger intensity when the incident-light polarisation is perpendicular to the (001) plane (Fig. 8a). This suggests that the related OH groups are not associated with the basal plane of Al vacancies (Balan, 2020) but that they more likely correspond to interstitial H+ compensating for the electrostatic charge imbalance caused by substitution of divalent or monovalent cations for trivalent aluminium. A low-frequency band is consistently observed at 2420 cm−1. Analysis of correlations from 250 spectra from the GIA database shows a very strong positive correlation between the areas of the 3161 and 2420 cm−1 bands (p=0.99). Two other low-frequency bands are consistently observed at 2459 and 2480 cm−1, albeit with poorer correlations with the 3161 cm−1 band (p=0.93 and 0.77, respectively). The area of the 2459 cm−1 band shows the strongest correlations with the ∼3100 (p=0.95), 3242 (p=0.96) and 3355 cm−1 (p=0.95) bands.
The correlation between the areas of the 3161 and 2420 cm−1 bands suggests that they are related to the same OH configuration (Fig. 8b). As the samples displaying the “3161 series” can be iron-rich and titanium-poor (e.g. Schwarz et al., 2008), it may be reasonable to assign the main bands to OH groups in association with Fe2+ ions. Among the potential configurations, the Fe_4 configuration has theoretical OH stretching and bending overtone frequencies of 3231 and 2352 cm−1, respectively, which are in the admissible range with respect to the experimental 3161 and 2420 cm−1 frequencies (Fig. 8c). The Fe_1 configuration, which is moderately more stable (by 3 kJ mol−1) than the Fe_4 configuration, could then lead to an OH stretching band contributing to the broad signal at ∼3100 cm−1 and to the OH bending overtone at 2459 cm−1 (Fig. 8a).
The experimental bands at 3242, 3355 and 3302 cm−1 cannot be assigned to specific defects, although all are correlated with the 3161 cm−1 band (p=0.96, 0.90 and 0.85, respectively). The relatively poor correlation between 3161 and 3302 cm−1 bands is likely due to the very low absorbance of the latter, as well as its location on the shoulder of the 3161 cm−1 band. Together, these observations suggest that these bands are related to similar defects, meaning defects with the same stoichiometry (Fe2+OH). They could result from the anharmonic interaction of the OH stretching mode with higher-order overtones (Fermi resonances) or with low-frequency excitations (combination bands).
The area of the experimental band at 2480 cm−1 does not correlate well with any other bands, suggesting that it might not be genetically related to the 3161 cm−1 band, i.e. does not have Fe2+OH stoichiometry, despite generally being present in the spectra containing the “3161 cm−1 series”.
Significant spectral changes are reported in heating experiments of samples corresponding to the “3161 cm−1 series”: a sample heated in oxidising atmosphere at 900 ∘C for 6 h displays a spectrum of the Punsiri type, whilst a flat spectrum is observed on same sample heated at 1550 ∘C for 6 h (Atikarnsakul and Emmett, 2021). Based on the assignment of the “3161 cm−1 series” to an Fe2+–OH defect, these changes could be interpreted as follows. Heating at 900 ∘C at ambient pressure leads to oxidation of Fe2+ to Fe3+ ions, which mobilises the H+ that is associated with Fe2+. Some H+ may diffuse out of the crystal, and some could combine with Mg2+ ions at trace concentration level. This forms an Mg2+–OH defect, leading to a Punsiri-type spectrum similar to that observed in Mg-doped samples. Further heating of the sample at 1550 ∘C then leads to full dehydration, associated with formation of the associated Mg2+–hole pairs, explaining the enhancement of the yellow colour.
3.4 Qualitative properties of OH bending overtones in H-bonded systems
The assignment of the low-frequency bands to overtones of bending modes requires further explanations for two observations: (i) the intensity of the low-frequency bands is anomalously high for overtone bands compared with that of the fundamental OH stretching bands observed in the same spectra; (ii) the polarisation of the overtone bands is similar to that of the fundamental stretching bands (Fukatsu et al., 2003; Jollands and Balan, 2022). Assuming that the proposed assignments are correct, both peculiarities are likely related to the significant H bonding of the interstitial H atoms. Although infrequent, strong two-phonon bands related to the bending modes have been observed in diaspore (AlOOH) and groutite (MnOOH), which are hydrous minerals with medium-strength H bonds (Stegmann et al., 1973; Kohler et al., 1997; Delattre et al., 2012). Abnormally strong bending overtones have also been reported in H-bonded molecular systems, such as chloroform (CHCl3) and cesium bihalide salts (Thompson and Pimentel, 1960; Nibler and Pimentel, 1967). Even though they did not propose an interpretation for the low-frequency bands, it is noteworthy that Müller and Günthard (1966) stated that the OH⋯O environment in reduced sapphire is analogous to the bihalide system (FHF)−.
Table 4Proposed assignments of infrared absorption bands in the spectra of corundum containing divalent cations. ME: multiple excitation (anharmonic resonance or combination band involving the strong OH stretching excitation); HOCM: higher-order overtone of coupled mode (see text). δ and γ correspond to the first overtone of corresponding bending modes; ? corresponds to an undefined interpretation.
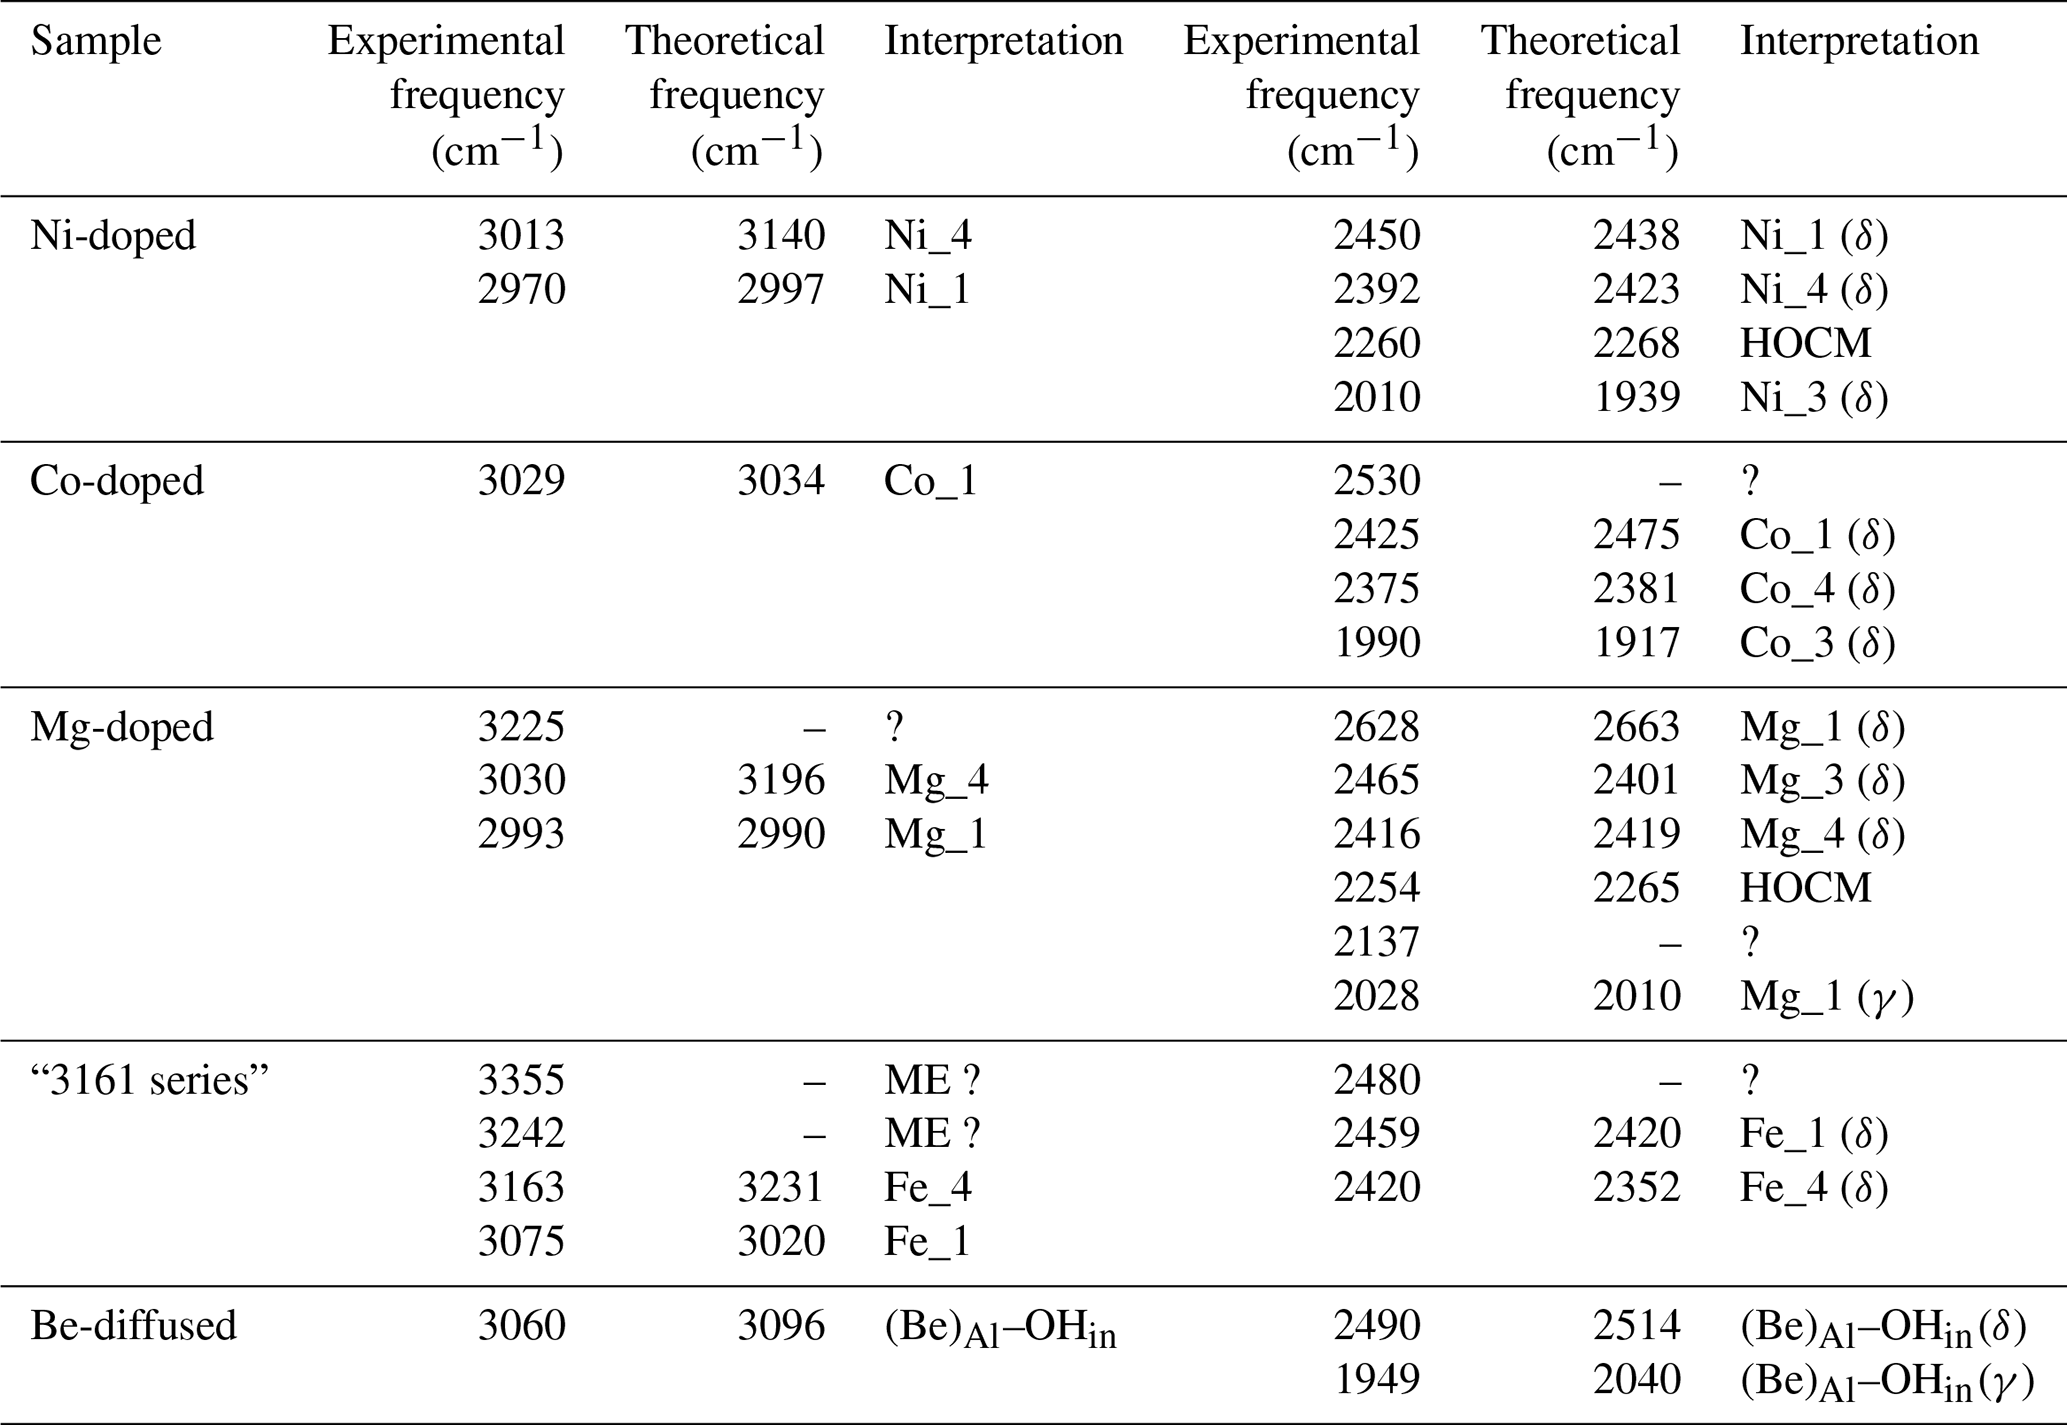
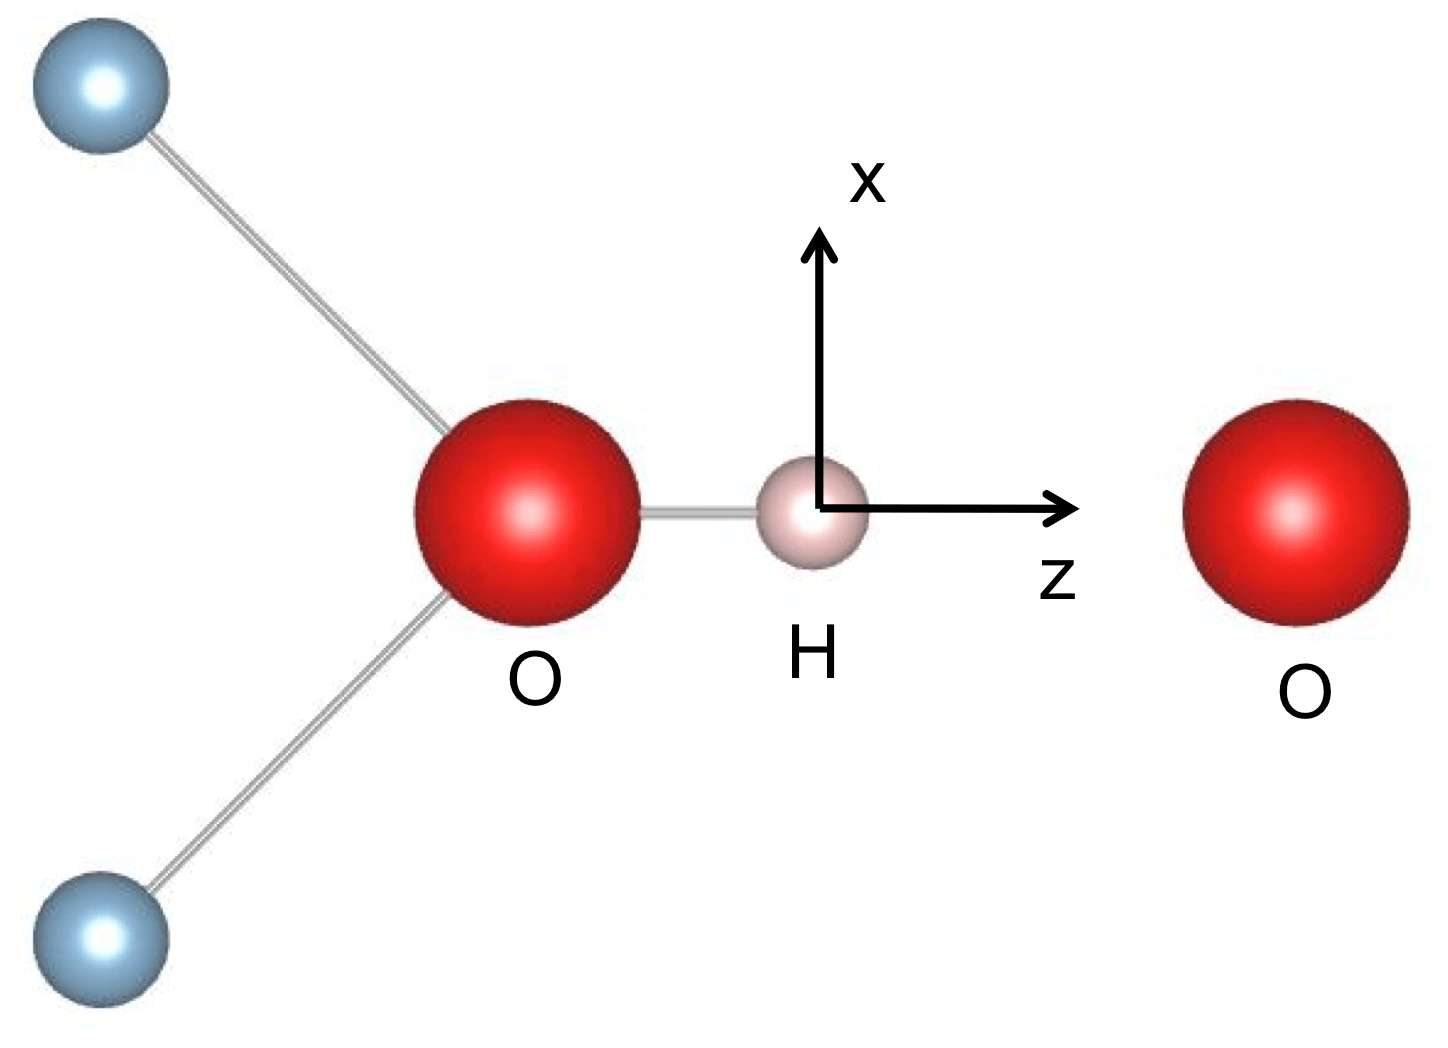
Figure 9Simple molecular model with C2v symmetry of a H-bonded OH group. A qualitative discussion of the OH vibrational properties can be restricted to the displacement of the H atom in the z (longitudinal) and x (transverse) directions, corresponding to the stretching and bending vibrations, respectively.
Following Thompson and Pimentel (1960) and Nibler and Pimentel (1967), an anomalous intensity of the OH bending overtone can be qualitatively discussed using a local molecular picture. This is consistent with the isolated character of the hydroxylated defects investigated in this present study. The transition intensity depends on the specific expression of the dipole moment function, as well as on the shape of the potential, which determines the vibrational wave functions (e.g. Thompson and Pimentel, 1960). Assuming that only the ground state is significantly populated at room temperature, the transition from the n=0 to n=1 state corresponds to a fundamental transition, whilst overtones correspond to transitions from n=0 to n>1 states. Only transitions with are allowed in the harmonic approximation, whereas overtones can arise from the nonlinearity of the dipole moment function (electrical anharmonicity) and from the anharmonicity of the potential (mechanical anharmonicity). Although a full treatment of the overtone absorption intensities is beyond the objectives of the present study, a conceptual understanding of the H-bonded system can be obtained using a simple molecular model with two vibrational degrees of freedom (Thompson and Pimentel, 1960). This model with C2v (mm2) symmetry displays an OH group oriented along the z axis sharing a H bond with a facing O atom (Fig. 9). The OH stretching mode mostly corresponds to a small longitudinal displacement (dz) of the H atom from its equilibrium position along the z direction, whilst the in-plane bending mode corresponds to its transverse displacement (dx). In such a model, the intensity and polarisation properties of the first bending overtone are determined by the longitudinal component of the dipole moment function, whilst the fundamental bending transition depends on the transverse component (Thompson and Pimentel, 1960). This property is also apparent from a group theoretical analysis. The stretching and bending modes belong to the A1 and B1 representations of the C2v point group, respectively. The B1 × B1 = A1 symmetry of the first overtone is thus the same as that of the fundamental stretching mode, corresponding to the z polarisation, and differs from that of the fundamental bending transition. Furthermore, Thompson and Pimentel (1960) show that when the dipole moment function only depends on the distance between the hydrogen atom and the facing atom, the intensity of the fundamental stretching and bending overtone bands depends on the same charge mobility term, a term which is significantly enhanced by the formation of hydrogen bonds (e.g. Libowitzky and Rossman, 1997; Balan et al., 2008). Accordingly, it is suggested that the anomalously strong intensity of the bending overtone bands in the spectra of corundum-bearing divalent cations arises from the more significant H-bonding of OH groups compared with that of OH groups associated with Al vacancies and leading to the “3309 cm−1 series”. In addition, a dominance of the longitudinal component of the dipole moment function in the intensity of overtone bands would also explain why their polarisation is similar to those determined for the fundamental OH stretching bands (Fukatsu et al., 2003; Jollands and Balan, 2022). Note however that the OH defects in corundum display a lower symmetry (Fig. 1). In this case, transverse terms in the dipole moment function, as well as the anharmonicity of the potential, can affect the overtone intensity, which complicates the picture.
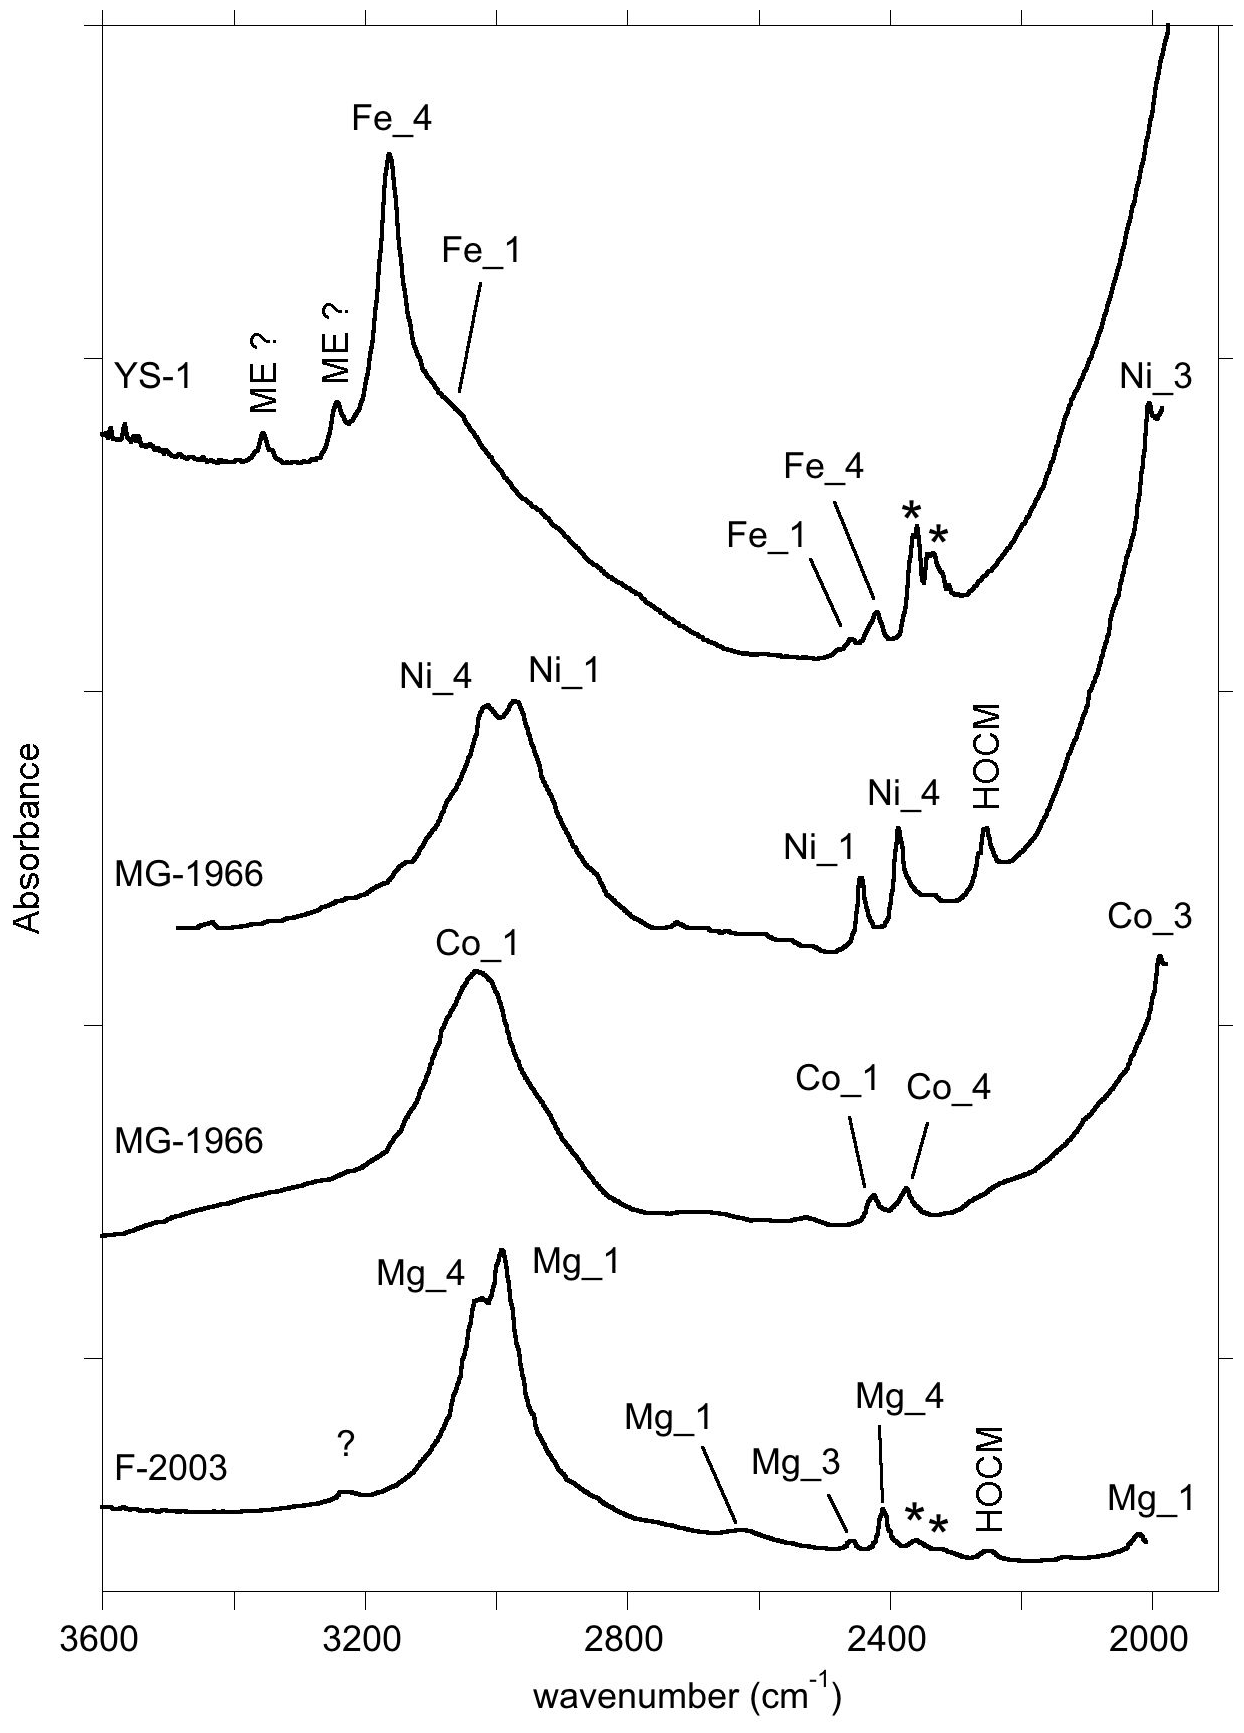
Figure 10Summary of the assignment of the main FTIR bands of corundum-bearing divalent cations. The spectra are room temperature spectra of YS-1 sample, Ni- and Co-doped samples (MG-1966) from Müller and Günthard (1966), and Mg-doped sample (F-2003) from Fukatsu et al. (2003). HOCM: higher-order overtone of coupled mode (see text); ME: multiple excitation (anharmonic resonance or combination band involving the strong OH stretching excitation). The asterisks denote artefactual bands related to atmospheric CO2.
It is likely that the proposed mechanism also contributes to the enhancement of the two-phonon OH bending bands in the spectra of diaspore and groutite (Kohler et al., 1997). This mechanism differs from the enhancement of overtones by Fermi resonances, i.e. the anharmonic interaction between a fundamental transition and an overtone of a lower-frequency mode when both occur at a similar frequency. An anharmonic interaction between the bending overtone and the fundamental OH stretching excitations is however suggested by the broadening of the overtone bands observed above 2500 cm−1.
In this study, hydrous defects in corundum associated with divalent cations have been investigated by theoretical modelling and experimentation in order to discuss the origin of bands frequently observed between 2000 and 3500 cm−1 in the FTIR spectra of natural, treated and synthetic corundum (Table 4). The series of bands observed below 2700 cm−1 in the spectra of samples containing Be, Mg, Co or Ni most likely correspond to overtone bands of OH bending modes. These overtone bands are likely enhanced by the electrical anharmonicity of the OH group involved in medium-strength hydrogen bonding. Most of these bands are significantly narrower than the corresponding OH stretching bands. They could therefore be efficiently used to identify specific configurations of hydrous defects in natural and synthetic corundum samples when OH stretching bands are broad and overlapping. This could be useful for gemological applications. More generally, the analytical importance of narrower bending infrared bands for the study of hydrogen-bonded systems has been pointed out by Novak (1974). In addition, the comparison of theoretical and experimental frequencies supports the assignment of the main bands observed in corundum samples containing divalent cations to specific defect configurations (Table 4, Fig. 10). The results support the assignment of the 3161 cm−1 band frequently observed in natural sapphire samples to structural OH groups associated with Fe2+ ions.
PWscf and PHonon codes (Giannozzi et al., 2009) are available at https://www.quantum-espresso.org/ (last access: 6 October 2023). The pseudopotentials (Schlipf and Gygi, 2015) are available at http://www.quantum-simulation.org/potentials/sg15_oncv/ (last access: 6 October 2023). Structure drawings have been done using VESTA software (https://jp-minerals.org/vesta/en/, last access: 6 October 2023, Momma and Izumi, 2011).
Theoretical structure and vibrational modes of the investigated models and experimental FTIR spectra of corundum samples from the GIA database are reported in the Supplement.
The supplement related to this article is available online at: https://doi.org/10.5194/ejm-35-873-2023-supplement.
MCJ and EB initiated the study. EB performed the calculations. MCJ, SJ, MC, MG, KB and PG performed the experimental measurements and analysis. All co-authors contributed to the discussion of the results and preparation of the manuscript.
At least one of the (co-)authors is a member of the editorial board of European Journal of Mineralogy. The peer-review process was guided by an independent editor, and the authors also have no other competing interests to declare.
Publisher’s note: Copernicus Publications remains neutral with regard to jurisdictional claims in published maps and institutional affiliations.
This article is part of the special issue “Probing the Earth: spectroscopic methods applied to mineralogy”. It is not associated with a conference.
Calculations were performed using the HPC resources of the SACADO MeSU platform at Sorbonne Université and the HPC resources of IDRIS under allocation 2022-AD010910820R1 attributed by GENCI (Grand Équipement National de Calcul Intensif). The “Plateforme de spectroscopie” (IMPMC) and Noémie Brossut and Paul Lasserre (UFR TEB, Sorbonne Université) are thanked for their support in the experimental measurements. The “Collection de Minéraux” (IMPMC, Sorbonne Université) is thanked for providing us with the yellow sapphire sample. Pamela Cevallos and Tyler Smith (Gemological Institute of America) are thanked for introductions to the different types of spectrum observed in gemological analyses. We thank Boriana Mihailova and the two anonymous reviewers for their detailed and constructive comments.
This paper was edited by Reto Gieré and Boriana Mihailova and reviewed by two anonymous referees.
Atikarnsakul, U. and Emmett, J. L.: Heat treatment effects on the behavior of the 3161 cm−1 feature in low-iron metamorphic yellow sapphire, Gems Gemol., 57, 286–288, 2021.
Balan, E.: Theoretical infrared spectra of OH defects in corundum (α-Al2O3), Eur. J. Miner., 32, 457–467, https://doi.org/10.5194/ejm-32-457-2020, 2020.
Balan, E., Lazzeri, M., Delattre, S., Meheut, M., Refson, K., and Winkler, B.: Anharmonicity of inner-OH stretching modes in hydrous phyllosilicates: assessment from first-principles frozen-phonon calculations, Phys. Chem. Minerals, 34, 621–625, https://doi.org/10.1007/s00269-007-0176-4, 2007.
Balan, E., Refson, K., Blanchard, M., Delattre, S., Lazzeri, M., Ingrin, J., Mauri, F., Wright, K., and Winkler, B.: Theoretical infrared absorption coefficient of OH groups in minerals, Am. Mineral., 93, 950–953, https://doi.org/10.2138/am.2008.2889, 2008.
Balmer, W. A., Leelawatanasuk, T., Atichat, W., Wathanakul, P., and Somboon, C.: Update on characteristics of heated yellow sapphires, Poster, Proceedings of the 1st International Gem and Jewelry Conference, 2006.
Balmer, W. A. and Krzemnicki, M. S.: Be-detection by FTIR on Corundum: A Preliminary Report, International Gemmological Conference, Vilnius, Lithuania, Abstracts Book, 69–71, 2015.
Baroni, S., de Gironcoli, S., Dal Corso, A., and Giannozzi, P.: Phonons and related crystal properties from density-functional perturbation theory, Rev. Mod. Phys., 73, 515–561, https://doi.org/10.1103/RevModPhys.73.515, 2001.
Beran, A.: Trace hydrogen in Verneuil-grown corundum and its colour varieties – an IR spectroscopic study, Eur. J. Mineral., 3, 971–975, https://doi.org/10.1127/ejm/3/6/0971, 1991.
Beran, A. and Rossman G. R.: OH in naturally occurring corundum, Eur. J. Mineral., 18, 441–447, https://doi.org/10.1127/0935-1221/2006/0018-0441, 2006.
Blum, H., Frey, R., Günthard, H. H., and Ha, T.K.: Ab initio SCF study of OHO3− system and its relation to the structure of α-Al2O3:OHO3− (Me2+), Chem. Phys., 2, 262–270, https://doi.org/10.1016/0301-0104(73)80030-8, 1973.
Bonnet, M. and Fritsch, E.: Bandes d'absorption peu connues dans les spectres infrarouges du corindon: que signifient-elles, Gemmol. Francoph., 1–3, 2021.
Choudhary, G. and Vijay, S.: 3161 cm−1 infra-red feature in synthetic sapphires, GIA International Gemological Symposium, 2018.
Delattre, S., Balan, E., Lazzeri, M., Blanchard, M., Guillaumet, M., Beyssac, O., Haussühl, E., Winkler, B., Salje, E. K. H., and Calas, G.: Experimental and theoretical study of the vibrational properties of diaspore (α-AlOOH), Phys. Chem. Minerals, 39, 93–102, https://doi.org/10.1007/s00269-011-0464-x, 2012.
Eigenmann, K. and Günthard, H. H.: Hydrogen incorporation in doped α-Al2O3 by high temperature redox reactions, Chem. Phys. Lett., 12, 12–15, https://doi.org/10.1016/0009-2614(71)80605-X, 1971.
Fukatsu, N., Kurita, N., Oka, Y., and Yamamoto, S.: Incorporation of hydrogen into magnesium-doped α-alumina, Sol. State Ion., 162, 147–159, https://doi.org/10.1016/S0167-2738(03)00218-2, 2003.
Futazuka, T., Ishikawa, R., Shibata, N., and Ikuhara, Y.: First-principles calculations of group IIA and group IV impurities in α-Al2O3, Phys. Rev. Mater. 4, 073602, https://doi.org/10.1103/PhysRevMaterials.4.073602, 2020.
Ghosez, Ph., Michenaud, J. P., and Gonze, X.: Dynamical atomic charges: The case of ABO3 compounds, Phys. Rev. B, 58, 6224–6240, https://doi.org/10.1103/PhysRevB.58.6224, 1998.
Giannozzi, P., Baroni, S., Bonini, N., Calandra, M., Car, R., Cavazzoni, C., Ceresoli, D., Chiarotti, G. L., Cococcioni, M., Dabo, I., Dal Corso, A., de Gironcoli, S., Fabris, S., Fratesi, G., Gebauer, R., Gerstmann, U., Gougoussis, C., Kokalj, A., Lazzeri, M., Martin-Samos, L., Marzari, N., Mauri, F., Mazzarello, R., Paolini, S., Pasquarello, A., Paulatto, L., Sbraccia, C., Scandolo, S., Sclauzero, G., Seitsonen, A. P., Smogunov, A., Umari, P., and Wentzcovitch, R. M.: Quantum ESPRESSO: a modular and open-source software project for quantum simulations of materials, [code], J. Phys. Cond. Mat., 21, 395502, https://doi.org/10.1088/0953-8984/21/39/395502, 2009.
Gonze, X. and Lee, C.: Dynamical matrices, Born effective charges, dielectric permittivity tensors, and interatomic force constants from density-functional perturbation theory, Phys. Rev. B, 55, 10355–10368, https://doi.org/10.1103/PhysRevB.55.10355, 1997.
Hamann, D. R.: Optimized norm-conserving Vanderbilt pseudopotentials, Phys. Rev. B, 88, 085117, https://doi.org/10.1103/PhysRevB.88.085117, 2013.
Hauffe, K. and Hoeffgen, D.: Zum mechanismus der umladung von kobaltionen im saphir, Berichte der Bunsengesellschaft für physikalische Chemie, 74, 537–546, 1970.
Hummel, G.: Etude en spectroscopie infrarouge d'une collections de saphirs jaunes à oranges, Diplome d'Université de Gemmologie, Université de Nantes, 2019.
Jollands, M. C., Blanchard, M., and Balan, E.: Structure and theoretical infrared spectra of OH defects in quartz, Eur. J. Mineral., 32, 311–323, https://doi.org/10.5194/ejm-32-311-2020, 2020.
Jollands, M. C. and Balan, E.: Beryllium incorporation in corundum, Mineral. Mag., 86, 758–766, https://doi.org/10.1180/mgm.2022.63, 2022.
Kohler, T., Armbruster, T., and Libowitzky, E.: Hydrogen bonding and Jahn-Teller distortion in groutite, α-MnOOH, and manganite, γ-MnOOH, and their relations to the manganese dioxides ramsdellite and pyrolusite, J. Sol. State Chem., 133, 486–500, https://doi.org/10.1006/jssc.1997.7516, 1997.
Libowitzky, E. and Rossman, G. R.: An IR absorption calibration for water in minerals, Am. Mineral., 82, 1111–1115, https://doi.org/10.2138/am-1997-11-1208, 1997.
Libowitzky, E. and Beran, A.: The structure of hydrous species in nominally anhydrous minerals: Information from polarized IR spectroscopy, Rev. Mineral. Geochem., 62, 29–52, https://doi.org/10.2138/rmg.2006.62.2, 2006.
Momma, K. and Izumi, F.: VESTA 3 for three-dimensional visualization of crystal, volumetric and morphology data, [code], J. Appl. Crystallogr., 44, 1272–1276, https://doi.org/10.1107/S0021889811038970, 2011.
Moon, A. R. and Phillips, M. R.: Defect clustering in H,Ti: α-Al2O3, J. Phys. Chem. Sol., 52, 1087–1099, https://doi.org/10.1016/0022-3697(91)90042-X, 1991.
Moon, A. R. and Phillips, M. R.: Defect clustering and color in Fe,Ti: α-Al2O3, J. Amer. Ceram. Soc., 77, 356–367, https://doi.org/10.1111/j.1151-2916.1994.tb07003.x, 1994.
Müller, R. and Günthard, H. H.: Spectroscopic study of the reduction of nickel and cobalt ions in sapphire, J. Chem. Phys., 44, 365–373, https://doi.org/10.1063/1.1726471, 1966.
Nibbering, E. T., Dreyer, J., Kühn, O., Bredenbeck, J., Hamm, P., and Elsaesser, T.: Vibrational dynamics of hydrogen bonds, in: Analysis and Control of Ultrafast Photoinduced Reactions, edited by: Kühn, O. and Wöste, L., Chem. Phys., 87, Springer, Berlin, Heidelberg, https://doi.org/10.1007/978-3-540-68038-3_7, 2007.
Nibler, J. W. and Pimentel, G. C.: Infrared spectra of Cesium bihalide salts, J. Chem. Phys., 47, 710, https://doi.org/10.1063/1.1711944, 1967.
Novak, A.: Hydrogen bonding in solids. Correlation of spectroscopic and crystallographic data, in: Large Molecules, Struct. Bond., Springer, Berlin, Heidelberg, 18, https://doi.org/10.1007/BFb0116438, 1974.
Perdew, J. P., Burke, K., and Ernzerhof, M.: Generalized Gradient Approximation Made Simple, Phys. Rev. Lett., 77, 3865–3868, https://doi.org/10.1103/PhysRevLett.77.3865, 1996.
Ramírez, R., González, R., Colera, I., and Vila, R.: Protons and deuterons in magnesium-doped sapphire crystals, J. Am. Ceram. Soc., 80, 847–850, https://doi.org/10.1111/j.1151-2916.1997.tb02913.x, 1997.
Ramírez, R., Colera, I., González, R., Chen, Y., and Kokta, M. R.: Hydrogen-isotope transport induced by an electric field in α-Al2O3 single crystals, Phys. Rev. B, 69, 014302, https://doi.org/10.1103/PhysRevB.69.014302, 2004.
Rossi, M., Biondi, R., Rizzi, R., Corriero, N., Sequino, F., and Vergara, A.: Mechanism of Be-Thermodiffusion in Rutile Inclusions of Fancy Sapphires, Cryst. Growth Design, 22, 6493–6503, https://doi.org/10.1021/acs.cgd.2c00700, 2022.
Ryskin, Y. A. I.: The vibrations of protons in minerals: hydroxyl, water and ammonium, in: The Infrared Spectra of Minerals, edited by: Farmer, V. C., Mineral. Soc., 137–181, 1974.
Sangsawong, S., Pardieu, V., Raynaud, V., and Engniwat, S.: “Punsiri” type FTIR spectral features in natural yellow sapphires, Gems Gemol., 52, 325–327, 2016.
Schlipf, M. and Gygi, F.: Optimization algorithm for the generation of ONCV pseudopotentials, [code], Comput. Phys. Comm., 196, 36, https://doi.org/10.1016/j.cpc.2015.05.011, 2015.
Schwarz, D., Pardieu, V., Saul, J.M., Schmetzer, K., Laurs, B.M., Giuliani, G., Klemm, L., Malsy, A.-K., Erel, E., Hauzenberger, C., Du Toit, G., Fallick, A. E., and Ohnenstetter, D.: Rubies and Sapphires from Winza, Central Tanzania, Gems Gemol., 44, 322–347, 2008.
Smith, C. P. and Van der Bogert, C.: Infrared spectra of gem corundum, Gems Gemol., 42, 92–93, 2006.
Soonthorntantikul, W., Khowpong, C., Atikarnsakul, U., Saeseaw, S., Sangsawong, S., Vertriest, W., and Palke, A.: Observations on the heat treatment of basalt-related blue sapphires, Gemological Institute of America Report, 60 pp., 2019.
Stegmann, C., Vivien, D., and Mazières, C.: Etude des mode de vibration des oxyhydroxydes d'aluminium boehmite et diaspore, Spectrochim. Acta, 29A, 1653–1663, 1973.
Thompson, W. E. and Pimentel, G. C.: The first overtone of the hydrogen bending mode of chloroform: Enhancement by hydrogen bonding, Z. Elektrochem., 64, 748–753, https://doi.org/10.1002/bbpc.196000040, 1960.
T-Thienprasert, J., Boonchun, A., Reunchan, P., and Limpijumnong, S.: Identification of hydrogen defects in α-Al2O3 by first-principles local vibration mode calculations, Phys. Rev. B, 95, 134103, https://doi.org/10.1103/PhysRevB.95.134103, 2017.
Volynets, F. K., Sidorova, Y. A., and Stsepuro, N. A.: OH-groups in corundum crystals grown by the Verneuil technique, J. Appl. Spectr., 17, 1088–1091, 1972.
Zhang, G., Lu, Y., and Wang, X.: Hydrogen interactions with intrinsic point defects in hydrogen permeation barrier of α-Al2O3: a first-principles study, Phys. Chem. Chem. Phys., 16, 17523, https://doi.org/10.1039/c4cp01382d, 2014.
3161 cm−1 seriesto OH groups associated with Fe2+ ions and the interpretation of bands below 2700 cm−1 in corundum containing divalent cations in terms of overtones of OH bending modes.